
Abstract
Using a pay-as-you-go strategy, we allow for a community of users to validate or invalidate mappings obtained by an automatic ontology matching system using consensus for each mapping. The ultimate objectives are effectiveness – improving the quality of the obtained alignment (set of mappings) measured in terms of F-measure as a function of the number of user interactions – and robustness – making the system as much as possible impervious to user validation errors. Our strategy consists of two major steps: candidate mapping selection, which ranks mappings based on their perceived quality so that users are presented first with those mappings with lowest quality, and feedback propagation, which seeks to validate or invalidate those mappings that are perceived to be similar to the mappings already presented to the users for validation. The purpose of these two strategies is twofold: achieve greater improvements earlier and minimize overall user interaction. There are three important features of our approach: the use of a dynamic ranking mechanism to adapt to the new conditions after each user interaction, the presentation of each mapping for validation more than once – revalidation – because of possible user errors, and the immediate propagation of the user input on a mapping without first achieving consensus for that mapping. We study extensively the effectiveness and robustness of our approach as several of these parameters change, namely the error and revalidation rates, as a function of the number of iterations, to provide conclusive guidelines for the design and implementation of multi-user feedback ontology matching systems.
Introduction
The ontology matching problem consists of mapping concepts in a source ontology to semantically related concepts in a target ontology. The resulting set of mappings is called an alignment [10], which is a subset of the set of all possible mappings, which we call the mapping space. As ontologies increase in size, automatic matching methods, which we call matchers, become necessary. The matching process also requires feedback provided by users: in real-world scenarios, and even in the systematic ontology matching tracks of the Ontology Alignment Evaluation Initiative (OAEI), the alignments obtained by automatic algorithms are neither correct nor exhaustive when compared against a gold standard, also called reference alignment. An important additional consideration is that domain experts such as those with whom we collaborated in the geospatial domain [7], require the ability to verify the correctness of a subset of the mappings. In this paper we propose a semi-automatic ontology matching approach that supports feedback provided by multiple domain experts. Our approach first computes an alignment using automatic matching methods and then allows for the domain experts, called henceforth users, to validate them.
When users requests a mapping to validate, a feedback loop is triggered, which starts with a candidate selection strategy, followed by the labeling of the selected mapping as correct or incorrect. A feedback propagation method updates the similarity of that mapping and of all the mappings that are deemed similar. The matching process continues iteratively by selecting new candidate mappings, presenting them to users for validation followed by propagation, with the alignment being updated at each iteration.
When different users are allowed to take part in the interactive matching process, they may disagree upon the label to assign to a mapping [1]. Our approach assumes that mappings labeled as correct (resp. incorrect) by a user majority are correct (resp. incorrect).
The main purpose of the candidate selection strategy and of the feedback propagation method is to reduce the number of times that users validate mappings, for a given quality of the alignment. To this end, we define a model to dynamically estimate the quality of the alignment at each iteration, which consists of five different measures. These measures, which consider the mapping similarity and the feedback collected in previous iterations, are combined into two candidate selection strategies of the mappings that are estimated to have lower quality first.
Because of the possibility of labeling errors, a proportion of the mappings that have already been validated is selected again to be presented for validation. This proportion, called revalidation rate, can be configured to tune the robustness of the approach against user errors. We define robustness as the ratio between the quality of the alignment for a given error rate and the quality of the alignment when no errors are made.
Our approach is devised to run in a pay-as-you-go fashion, where we may stop the iterative process at any stage because we generate a new alignment at the end of each iteration. In particular, our propagation strategy is in opposition to first collecting a pre-determined number of n validations for each mapping, considering the majority vote after that, and only then propagating the user-provided feedback. During those n iterations, we would only be progressing on a single mapping. Instead, during n iterations we make progress on as many as n mappings and propagate the user-provided feedback at each iteration.
Several previous approaches to ontology matching assume that feedback is given by individual users [6,9,11,12,16,21,22]. Only one of these approaches considers the possibility of user validation errors, yet it does not propose a method to overcome those errors [11].
To evaluate our approach we simulate user feedback considering different error rates. We conduct experiments with the OAEI Benchmarks Track to evaluate the gain in quality (measured in terms of F-measure) and in robustness as a function of the number of validations for different error and revalidation rates. Our results highlight complex trade-offs and point to the benefits of adjusting the revalidation rate.
In Section 2, we describe the architecture of the multi-user feedback ontology matching system and give an overview of the combined automatic and manual processes. In Section 3, we describe the key elements of the proposed approach: a model for the evaluation of the quality of the mappings, the ranking functions used for candidate mapping selection, and the method used for feedback propagation. In Section 4, we present the results of our experiments conducted on the OAEI Benchmarks Track. In Section 5, we compare our work with related work. Finally, in Section 6, we draw some conclusions and describe future work.
Approach overview
The validation of a mapping m by a user assigns a label l to that mapping. We define the homonymous function label, such that label(m) has value 1 or 0 depending on whether the user considers that m is correct or incorrect, respectively. When more than one user is involved, we use a consensus-based approach to decide whether a mapping belongs to an alignment. In this paper we use a consensus model based on simple majority vote, where V is an odd number of validations considered sufficient to decide by majority (we do not require that all the users vote on each mapping); thus, minimum consensus,
The architecture of our multi-user ontology matching strategy can be built around any ontology matching system. In our case, we use AgreementMaker [4,5]. We list the steps of the feedback loop workflow:
This feedback loop implements a pay-as-you-go approach to ontology matching mainly because an initial alignment computed with automatic methods is refined every time that an individual mapping is validated by one user without waiting for consensus. Even if we consider possible errors in validating mappings, thus causing inconsistency among users, we assume consistency for the same user, thus we do not present the same mapping more than once to each user. In addition, mappings for which consensus has been reached in previous iterations are removed from the list of mappings to be validated.
The candidate selection and feedback propagation steps are designed for equivalence mappings and for one-to-one mappings. However, our approach does not depend on the cardinality of the alignment, because the desired cardinality can be set at the end of the feedback loop.
Quality-based multi-user feedback
In this section we describe the Candidate Selection and Feedback Propagation steps, which play a major role in our model. First, we explain the Mapping Quality Model, which is used by both steps.
Mapping quality model
We use a mapping quality model to estimate the quality of the candidate mappings, which uses five different mapping quality measures. The quality of a mapping estimated by a measure is represented by a score, which is higher for the mappings that are considered of higher quality. The score assigned to the mappings is always normalized in the interval
As an example, given a mapping m with a signature vector
This measure assigns a higher quality score to a mapping that has less conflict with other mappings, a conflict occurring when there exists another mapping for the same source or target concept. This measure takes into account the similarity score of the mappings, assigning a lower quality to mappings that conflict with mappings of higher similarity.
An example of a similarity matrix. Empty cells have value 0
An example of a similarity matrix. Empty cells have value 0
For the matrix of Table 1, the values of
For the matrix of Table 1, the values of
Three examples of the CON quality evaluation are shown in Table 2. According to the consensus gathered among the users, the quality of mappings
Examples for the Consensus (CON) and Feedback Stability (SF) quality measures with
The fraction in Eq. (4) measures the instability of a mapping, defined as the ratio between the minimum and the maximum distances from minimum consensus of the number of similar labels assigned to a mapping. For
Considering the examples in Table 2, mapping m has the lowest SF score because we are in a tie situation and new feedback on that mapping is required. Mapping
We combine the proposed quality measures using well-known aggregation functions to define two different candidate selection strategies: Disagreement and Indefiniteness Average (DIA), which is used to select unlabeled mappings (mappings that have not been validated by any user in previous iterations) and Revalidation (REV), which is used to select already labeled mappings (mappings that have been validated in previous iterations). Both strategies use quality scores that change over time and rank mappings at each iteration.
The DIA strategy uses the function:
It favors mappings that are at the same time the most disagreed upon by the automatic matchers and have the most indefinite similarity values. The two measures CON and SF cannot be used to rank unlabeled mappings because they consider previous validations. After an experimental evaluation of different combinations of the other quality measures, discussed in detail in Section 4.2, we found that the combination of DIS and SSD (without CSQ) is the best combination of measures to find those mappings that were misclassified by the automatic matchers.
The second strategy, Revalidation (REV), ranks mappings using the function:
This strategy favors mappings with lower consensus and such that previous validations could have changed significantly, and harmfully, the quality of the current alignment. The analysis of the users’ activity, which is explicitly captured by CON and SF, is crucial to this strategy. In addition, since several mappings may have similar CON and SF in the first iterations, REV favors also mappings with potential conflicts with other mappings leveraging the CSQ measure. In this strategy, CSQ is preferred to DIS and DSS because: i) to rank already labeled mappings, disagreement among users, measured with CON and SF, is more informative than disagreement among automatic matchers, measured by DIS, ii) labeled mappings will have very definite similarity scores, and, therefore, very similar DSS scores, and iii) more potential conflicts, measured by CSQ, can emerge as more feedback is collected.
The mapping that is presented to the user is selected by a parametric meta-strategy, which picks the top mapping from one of the DIA or REV rankings. This meta-strategy uses two probabilities,
To support a pay-as-you-go approach to interactive ontology matching, we use a combination of DIA and REV. The former (DIA) is associated with earlier validation of those mappings that are more likely to be misclassified based on the automatic matching methods. In this way the alignment can be quickly improved in the first iterations. The latter (REV) is associated with validation of mappings that have already been validated, especially those for which previous validations have been less conclusive.
For example, if we consider two mappings m and
Quality-based feedback propagation
When the selected mapping is validated by a user, the feedback is propagated by updating a subset of the Similarity Matrix. We experimentally evaluated several feedback propagation methods, including a method used in our previous work [6], a method based on learning similarity scores with a multiple linear regression model, and a method based on our quality measures. For our experiments, we use this last method, which we call Quality Agreement (QA) Propagation, because it achieves the best trade-off between speed and robustness.
The method we used in our previous work assigns the label (0 or 1) to all the mappings in the cluster of mappings whose signature vectors are equal to the vector of the mapping validated by the user (with a 0 or 1, respectively). This method has the disadvantage of propagating the user feedback on a very limited number of mappings. The method based on the multiple linear regression model learns the dependency between the values in the signature vectors of the mappings and the similarity values in the global similarity matrix. We found that this method has the disadvantage of requiring many user inputs before producing meaningful predictions.
In QA Propagation, the similarity of the validated mapping is set to 1 or 0 depending on the label assigned by the user. To propagate the similarity to other mappings, we compute the Euclidean distance between the signature vector of the validated mapping, denoted by v, and the signature vectors of all the mappings for which consensus has not been reached. A distance threshold θ is used to identify the class of mappings most similar to the mapping labeled by the user. The mappings in this class have their similarity increased if the validated mapping is labeled as correct, and decreased otherwise. The change is proportional to: 1) the quality of the labeled mapping v and of the mappings m in the similarity class, measured respectively by two quality measures Q and
We adopt a conservative approach to propagation to make the system more robust to erroneous feedback. We define
Experiments
We conduct several experiments to evaluate our multi-user feedback loop model. In a first set of experiments we evaluate the performance of the proposed pay-as-you-go method by analyzing the performance of different system configurations under various error rates and comparing it to the performance of a baseline approach. In a second set of experiments, we compare the performance of our mapping quality measures to the performance of other quality measures proposed in related work.
Performance under different error rates
Experimental setup
Our experiments are conducted using four matching tasks in the Benchmarks track of OAEI 2010, which consist of real-world bibliographic reference ontologies that include BibTeX/MIT, BibTeX/UMBC, Karlsruhe and INRIA, and their reference alignments. We chose these ontologies because they have been used in related studies [6,9,19,21].
In the evaluation we use two measures based on F-Measure:
Gain at iteration t,
Robustness at iteration t, Robustness
The above measures characterize the behavior of the system in time. We need to consider two additional measures to represent this behavior with a single aggregate value, so as to ease the comparison among different configurations. The Area Under the Curve (AUC) can be used to describe a variable measured at different points in time, e.g., gain at iteration t, with an aggregate value. This value is defined by the area of the curve obtained by plotting the variable over time. The two aggregate measures based on AUC used in our experiments are defined as follows.
Area Under the Gain Curve (AUGC), is a measure that provides an aggregate representation of the gain in F-Measure until a fixed iteration n:
Results after the initial matching step
Results after the initial matching step
Area Under the Robustness Curve (AURC), is a measure that provides an aggregate representation of the Robustness until iteration n:
We conduct our experiments by simulating the feedback provided by the users. Our focus is on the evaluation of the methods proposed to minimize the users’ overall effort and make the system robust against user errors. This kind of simulation is needed to comparatively assess the effectiveness of different candidate selection and propagation methods before performing experiments with real users, where presentation issues play a major role. We consider a community of 10 users, and simulate their validation at each iteration using the reference alignment. We note that we have made two assumptions that can be revised as they do not alter the substance of the method. The first reflects the fact that we do not distinguish among users as mentioned in Section 2 and therefore consider a constant error rate for each sequence of validated mappings. A constant error rate has been applied to other interactive ontology matching approaches [11]. The study of a community of users might uncover an appropriate probability distribution function for the error (e.g., Gaussian). The second assumption is related to the choice of the number of validations V considered sufficient to decide by majority, which we set to 5, and therefore
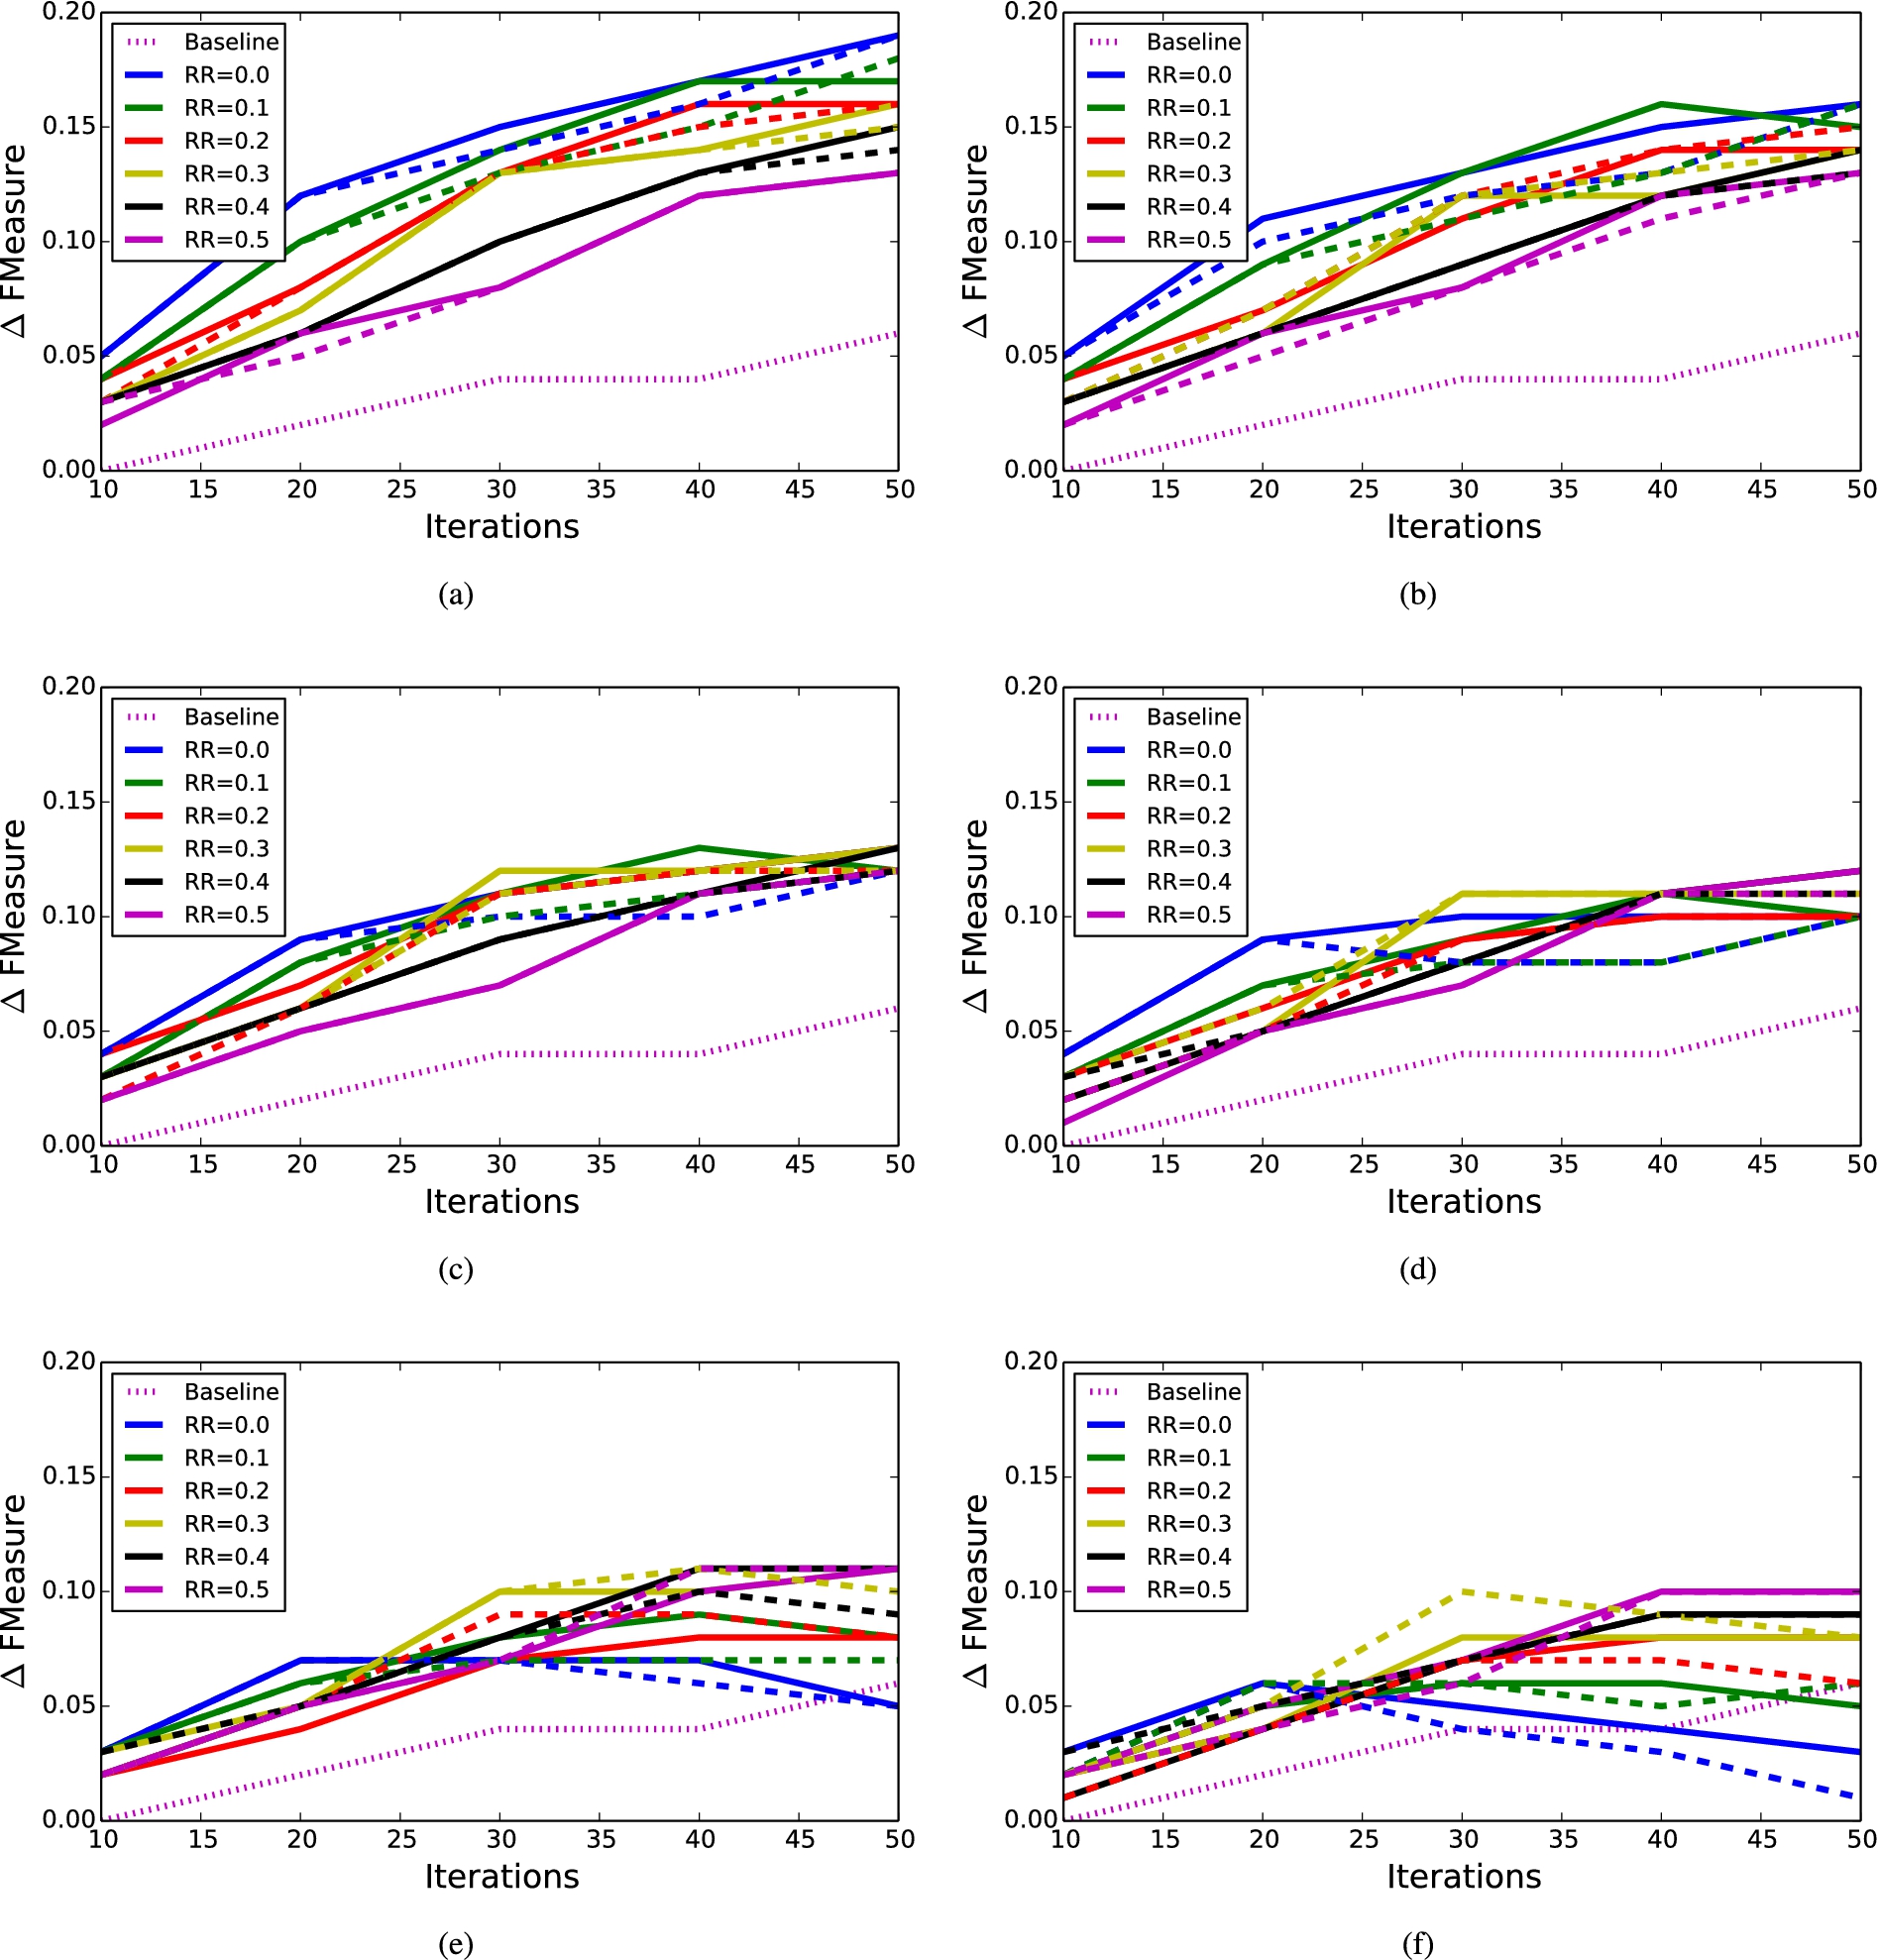
Each chart presents
In the Initial Matching Step we use a configuration of AgreementMaker that runs five lexical matchers in parallel. The LWC matcher [5] is used to combine the results of five lexical matchers, and two structural matchers are used to propagate the similarity scores. The similarity scores returned by these matchers are used to compute the signature vectors. In our experiments we compute the gain and robustness at every iteration t from 1 to 100, with six different error rates (ER) (0.05, 0.1, 0.15, 0.2, 0.25) and twelve different system configurations. The configurations stem from the six different revalidation rates (RR) (0.0, 0.1, 0.2, 0.3, 0.4, 0.5) used in candidate selection strategy, and two different feedback propagation gains,
We also want to compare the results obtained with our model, which propagates the user feedback at each iteration in a pay-as-you-go fashion, with a model that adopts an Optimally Robust Feedback Loop (ORFL) workflow, inspired by CrowdMap, a crowdsourcing approach to ontology matching [19]. In their approach, similarity is updated only when consensus is reached on a mapping, which happens after five iterations when
We ran our first experiment on two of the OAEI Benchmarks ontologies, 101 and 303. We chose these ontologies because their matching produces the lowest initial F-Measure (0.73) when compared with the results for the other matching tasks 101–301 (0.92), 101–302 (0.86) and 101–304 (0.93). Thus we expect to see a higher gain for 101–303 than for the others. Table 3 shows for each matching task the number of correct mappings, false positives, false negatives, and F-Measure after the initial matching step.
AUGC for ontologies 101–303
AUGC for ontologies 101–303

Parallel coordinates of AUGC for ontologies 101–303.
Figure 1 shows the gain in F-Measure after several iterations using different configurations of our model and the ORFL approach. Each chart presents results for a specific error rate (ER). Solid lines represent configurations with propagation gain
Table 4 shows AUGC for the charts presented in Fig. 1. AUGC is also plotted using parallel coordinates in Fig. 2, where each parallel line represents a different error rate. It is evident from Table 4 that propagation gain always helps to obtain the maximum AUGC for every error rate. However, for some revalidation rates and some error rates, AUGC is higher when the feedback is not propagated to other mappings (i.e.,

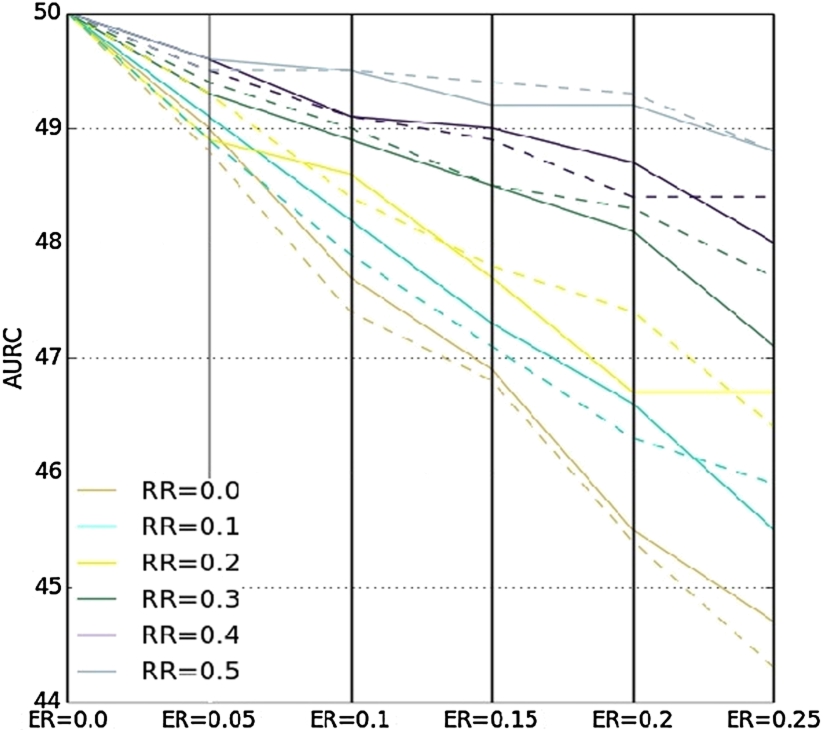
Each chart presents Robustness
Figure 3 shows the robustness of different configurations evaluated at different iterations, varying both the error and the revalidation rates. Each chart presents results for a specific error rate (ER). Solid lines represent configurations with propagation gain
Table 5 shows AURC for the charts presented in Fig. 3. AURC is also plotted using parallel coordinates in Fig. 4. As error rates increase, we see a sharp monotonic decrease in robustness. However, as the revalidation rates increase, robustness always increases, except in one case for RR = 0.2 and ER = 0.05. This observation indicates that with high revalidation rates the system becomes less sensitive to the error rate. Moreover, it can be seen from Table 5 that configurations with propagation gain greater than zero are more robust than configurations with zero propagation gain for low revalidation and error rates. When error rate increases and a high revalidation rate is used, configurations with zero propagation gain are more robust than configurations with propagation gain greater than zero.
We ran further experiments with three other matching tasks of the OAEI 2010 Benchmarks track. Table 6 contains the results for the three other tasks (101–301, 101–302, 101–304) and shows
AURC for ontologies 101–303
Parallel coordinates of AURC for ontologies 101–303.
We establish a comparison between our mapping quality model and the measures used in the candidate selection of the single user approach of Shi et al. [21]. We want to determine which quality model performs better in our feedback loop workflow. The candidate selection strategy used by Shi et al. uses three measures, Contention Point, Multi-Matcher Confidence, and Similarity Distance, whose intent is close to that of our quality measures CSQ, DIS, and SSD.
We ran an experiment with all the four matching tasks of the OAEI 2010 Benchmarks track (101–301, 101–302, 101–303, 101–304), in an error-free setting (like the one considered by Shi et al.) with no propagation gain. We consider the measures of our model that are meaningful in an error-free setting, i.e.,
for the matching tasks with higher initial F-Measure
NDCG is a well known measure used to evaluate the quality of a ranked list of results [13]. Discounted Cumulative Gain measures the gain of an item in a list based on its relevance and position. The gain is accumulated from the top of a result list of n elements to the bottom, with the gain of each result discounted at lower ranks:
Comparison of different quality measures and their combinations showing retrieved false positives, retrieved false negatives,
Table 7 shows the result of our experiments on four matching tasks (101–301, 101–302, 101–303, 101–304). We refer to the set of measures in Shi et al. as SLTXL, using the first letters of the names of each author. For each candidate selection strategy, Table 7 shows the number of misclassified mappings (#FP and #FN),
From our experiments with four different matching tasks characterized by different initial F-Measure values, we draw the following conclusions:
When users do not make errors, our method improves the quality of the alignment much faster in every matching task than an optimally robust feedback loop (ORFL) method that labels a mapping only after having collected from the users every validation needed to reach consensus. An increasing error rate can be counteracted by an increasing revalidation rate, still obtaining very good results for an error rate as high as 0.25 and a revalidation rate of 0.5. In the presence of errors, our approach is particularly effective when the initial alignment has lower quality and includes a higher number of false positives (see Table 3). In the matching task with lower initial F-Measure, every configuration of our method improves the quality of the alignment much faster than the optimally robust feedback loop method, even when error rates are as high as 0.25. Propagating the feedback to mappings other than the mapping labeled by the user at the current iteration shows a higher gain in F-Measure in several of the experiments. In the presence of errors, the F-Measure gain decreases after a certain number of iterations, unless a high revalidation rate is used. The number of iterations after which the gain in F-Measure decreases, which is clearly correlated with the error rate, appears to also be correlated with the quality of the initial alignment and, in particular, with the number of false positives (see Table 3). For example, using a revalidation rate of 0.3 and an error rate of 0.1, the F-Measure gain starts to decrease after 25 iterations in matching tasks with at most six false positives in the initial alignment (101–301, 101–302), and does not decrease before the 50th iteration in matching tasks where the initial alignment contains at least nine false positives (101–303, 101–304). When the error rate is unknown, a revalidation rate equal to 0.3 achieves a good trade-off between F-measure gain and robustness because of the “stability” of the results as displayed in the (d) charts of Figs 1 and 3. We note that propagation gain leads to better results for the F-measure gain than for robustness. Propagation gain leads to better results (F-measure gain) in the absence of user errors. Thus, propagation gain would be clearly effective if applied after consensus is gathered on a mapping. However, when we consider user errors, propagation gain leads to better results (F-measure and Robustness) in some settings, i.e., with different revalidation and error rates, but worse results in other settings. The most notorious example of worse results obtained with propagation gain in Table 4 can be seen for ER = 0.2 and RR = 0.2. In this case, it appears that errors get propagated, without being sufficiently counteracted by revalidation. When revalidation rate increases to RR = 0.3 then the results with propagation gain greater than zero wins. Another example is when we have ER = 0.25 and RR =0.3 in Table 5. The result with zero propagation gain is much better than with propagation gain. However, when the revalidation rate increases, the results become better with propagation gain. To minimize the loss in robustness, we have to use high revalidation rates independently from the error rate, as shown in Fig. 4. For example, when we use RR = 0.5 we obtain the most robust system configuration for every error rate. However, we should consider the error rate when we want to configure the system to avoid a loss in F-Measure gain. Figure 2 indicates that lower revalidation rates provide better results with lower error rates and higher revalidation rates provide better results with higher error rates. According to our results, the revalidation rate should be changed over time, starting with a lower revalidation rate and then switching to a higher revalidation rate. The higher the error rate, the sooner the switch should occur.
Related work
Leveraging the contribution of multiple users has been recognized as a fundamental step in making user feedback a first class-citizen in data integration systems, such as those for schema and ontology matching [1,19]. Ontology matching approaches relying on the feedback provided by a single user are a precursor to multi-user systems. They include the work of Shi et al. [21], Duan et al. [9], Cruz et al. [6], Noy et al. [16], To et al. [22], Jirkovsky et al. [12] and Jiménez-Ruiz et al. [11]. We describe first single-user approaches in two groups based on the type of candidate selection method they adopt, namely static vs. dynamic, and describe the multi-user approaches.
Single user feedback with static candidate selection
The first group of single user approaches includes those systems that have a static candidate selection strategy. The ranked list of candidate mappings does not get updated, after it is generated.
Duan et al. use a supervised method to learn an optimal combination of different similarity measures and to determine the right number of iterations for a similarity propagation algorithm. Mappings submitted to the users for validation are chosen randomly, and potential user errors are not considered [9].
Shi et al. use an active learning approach [21]. User feedback is propagated by learning an optimal threshold for mapping selection and interactively propagating the similarity using a graph-based structural propagation algorithm. The mappings presented to the users for validation are selected using three different measures. Since the approach is designed for a single user scenario, consensus obtained around the mappings in previous iterations and user errors are not considered. We compare the performance of their approach with ours in Section 4.2.
Cruz et al. use signature vectors that identify the mappings for which the system is less confident and propagate user feedback based on the similarity among signature vectors. They include a visual analytics panel that supports users in the interactive matching task [6]. In comparison, we now refine both the measures adopted in the candidate selection step and the feedback propagation function. In the current multi-user scenario, we consider user errors and make decisions by consensus.
LogMap 2 is an interactive ontology matching system proposed by Jiménez-Ruiz et al. [11]. They identify reliable and non-reliable mappings using lexical, structural, and reasoning-based techniques. They discard reliable mappings and most of the non-reliable mappings, and request feedback for the remaining mappings, which are presented to the users sorted by similarity. The user feedback is propagated by using logical inference to detect conflicts with previously found mappings, which are rejected. LogMap 2 has been evaluated considering several error rates for the user feedback, but does not implement strategies specifically designed to counteract user errors.
Single user feedback with dynamic candidate selection
The second group of single user approaches includes those systems that have a dynamic candidate selection. They update the list of candidate mappings at each iteration. However, none of these approaches considers user errors.
Noy et al. use an interactive component in the PROMPT suite for ontology merging and matching [16]. They ask users for feedback based on some heuristics and analysis of the structure of two ontologies. Their candidate selection method is different from ours in that we rank candidate mappings based on the combination of quality measures, each with a particular emphasis, and they use heuristics associated with the structure of the two ontologies. PROMPT determines inconsistencies and potential problems after user feedback is received and updates the list of candidate mappings, which is, however, not ranked.
To et al. propose an adaptive machine learning framework for ontology matching using user feedback [22]. They use two kinds of user feedback in their approach: pre-alignment, which is used at the beginning of the mapping process to train a Naïve Bayes classifier, and relevance feedback, which is used in a semi-supervised method to iteratively improve the learner. The user feedback is propagated in the sense that the classification model is updated each time that the user feedback is collected. Jirkovsky and Ichise propose MAPSOM, an interactive ontology matching approach [12] also based on the classification of mappings, which uses a neural network. The neural network learns an optimal combination of the basic similarity measures, using the user provided feedback. The mappings presented to the user for validation are the ones considered uncertain by the classifier, i.e., the closest mappings to the boundary established by the classifier between correct and incorrect mappings. In our approach, candidate mappings are selected using several quality measures and the user feedback loop starts after the combination of initial matchers. Another important difference between our approach and the last two approaches (besides the single vs. multiple user provided feedback) is that feedback is propagated by updating the similarity matrices instead of tuning a classifier. One advantage of our approach is that we can set a desired alignment cardinality and run an optimization algorithm on top of the feedback propagation step.
Multi-user feedback
In multi-user scenarios, several opportunities arise, such as the possibility of gathering consensus on mappings, as well as challenges, such as the need to deal with noisy feedback [1,19]. Multi-user scenarios include CrowdMap [19] for ontology matching, ZenCrowd [8] for entity linking, and Zhang et al. [23] for database schema matching, which use crowdsourcing on a web platform.
Both CrowdMap and ZenCrowd engage multiple users (named workers) to solve a semantic-based matching task and collect several user inputs for individual candidate mappings. However, CrowdMap does not integrate automatic matching methods with user feedback and does not investigate methods for candidate mapping selection nor feedback propagation. CrowdMap is comparable to an optimally robust feedback loop in the sense that consensus is obtained on the mappings before they are included in the alignment. Instead we propose a pay-as-you-go approach in which the alignment is refined after each iteration. ZenCrowd proposes a probabilistic approach to combine user feedback from a crowdsourcing platform with automatic entity matching algorithms. However, ZenCrowd does not reach consensus on a mapping. Instead, it performs probabilistic inference. Links are correct if they have a posterior probability that is greater than a threshold.
The recent crowdsourcing approach of Zhang et al. [23] for database schema matching considers alignments (sets of mappings) at a time instead of individual mappings. It aims to reduce the uncertainty of an alignment. The best alignments have highest certainty and lowest cost. User reliability is considered and consensus is obtained using a probabilistic approach.
Workers may not have specific skills nor a specific interest in the task that they perform other than the monetary reward that they get. Therefore, strategies are needed to assess their performance. For example, McCann et al. [14] classify workers as trusted or untrusted. Another example is provided by Osorno-Gutierrez et al. [17], who investigate the use of crowdsourcing for mapping database tuples. They address the reliability of the workers by identifying those workers whose answers may contradict their own or those of others. Because our users are experts and have a vested interest in the quality of the results, our approach does not take into account the reliability of the workers. If we were to deploy our approach to (non expert) workers in a crowdsourcing platform, our model would have to consider these same reliability issues.
Like us, Meilicke et al. [15] also consider domain experts. However, they reduce the effort of manual evaluation by computing the implications of the decisions that those experts make to decide if other mappings are correct or incorrect.
Finally, this paper extends our previous conference paper [3] as follows. First, we use new measures to evaluate the results, including AUGC (Area Under the Gain Curve) and AURC (Area Under the Robustness Curve). We also provide a detailed comparison between the mapping quality measures of our model and the measures used by Shi et al. in their active learning approach [21]. There are two other remarkable differences. In this paper we compare the performance of our approach using different revalidation rates for each of the six possible error rates. In each plot we can see the impact of different revalidation rates, which is a configuration parameter, for a given error rate, which is a characteristic of a specific matching scenario. In our previous paper we used a different plot for each revalidation rate, which, in our opinion, is less effective in showing how different system configurations would behave in equivalent settings. Furthermore, we improved the explanation and the formulas used to define the mapping quality measures. In particular, the Feedback Stability score is equivalent to subtracting the previously defined score computed by Propagation Impact from 1, with the advantage that higher Feedback Stability now indicates higher quality. This is similar behavior to the other measures we define where higher scores correspond to higher quality.
Conclusions and future work
A multi-user approach needs to manage inconsistent user validations dynamically and continuously throughout the matching task, while aiming to reduce the number of mapping validations so as to minimize user effort. In this paper, we presented a mapping model that uses quality measures in the two main steps of the system: the Candidate Mapping Selection and the Feedback Propagation. In the first step, a dynamic mechanism ranks the candidate mappings according to those quality measures so that the mappings with lower quality are the first to be presented for validation, thus accelerating the gain in quality. In the second step, the similarity among mappings is used to validate mappings automatically without direct user feedback, so as to cover the mapping space faster.
Our experiments brought clarity on the trade-offs among error and revalidation rates required to minimize time and maximize robustness and F-measure. Our strategies show under which circumstances we can afford to be “aggressive” by propagating results from the very first iterations, instead of waiting for a consensus to be built.
Future work may consider user profiling, so that there is a weight associated with the validations and how they are propagated, depending on the quality of the feedback. In addition, one may consider feedback reconciliation models more sophisticated than majority or weighted majority voting, for example, tournament solutions [2]. Changing the feedback reconciliation model poses several challenges like adapting the quality measures used in revalidation strategies or designing new methods to distribute the mappings among users. In this paper, we tested different constant error rates to model a variety of user behaviors as an aggregate. New models may take into account the possibility that the engagement of users may decrease along time due to the repetitiveness of the validation task, thus leading to an increasing error rate, or that in certain situations users learn with experience and make fewer errors, thus leading to a decreasing error rate.
Our overall strategy could also be modified to present one mapping together with several mapping alternatives. In this case, the visualization of the context for those alternatives could prove beneficial. This visualization can be included in a visual analytics strategy for ontology matching [6] modified for multiple users.
Footnotes
Acknowledgements
This work was supported in part by NSF Awards CCF-1331800, IIS-1213013, IIS-1143926, and IIS-0812258, by a UIC-IPCE Civic Engagement Research Fund Award, and by the EU FP7-ICT-611358 COMSODE Project.