
Abstract
While in developing countries around 50% of total employment are informal sector jobs, and much more among the poorest, its statistical measurement is a major issue. Having long remained a black hole of national statistical systems, sound methodologies have been developed to measure the informal sector in its different dimensions (employment, production, and more broadly articulation with the rest of the economy) in a reliable manner. Taking stock on nearly four decades of experiences accumulated around the world, this article presents a system of original surveys, specially designed for this objective: the Informal Sector Mixed (households-businesses) Surveys (ISMSs). After exposing their theoretical principles, the paper addresses the main challenges of implementation in the field, detailing their advantages and limitations. In particular, we question the compatibility of ISMSs with the recommendations of the new Resolution concerning statistics on the informal economy, adopted in 2023 during the 21st International Conference of Labor Statisticians. We also identify avenues to address a certain number of challenges that still arise with this type of survey, both in the methodological field and on the institutional level. We illustrate our discussion with a set of selected empirical results drawn from surveys conducted in various contexts.
Introduction
While most developing countries are adopting economic policies aimed at reducing poverty and establishing models for sustainable growth, the statistical information systems on the informal economy, in particular the informal sector, is still deficient. This weakness severely affects the assessment of the informal sector characteristics and the implementation, monitoring and evaluation of policies towards this sector, in the short run (to face crises, like the COVID-19 pandemics, during which the informal sector was affected the most) as in the long run (to boost structural transformation). Moreover, whatever the assumptions about future growth rates in the global south, the informal sector will not disappear. It will even increase in many countries.
However, the experience accumulated over approximately four decades in conducting informal sector surveys shows that its statistical measurement is not only possible, but contrary to intuition, are no more complex to carry out than other types of surveys, such as labour force surveys (LFS), enterprises surveys (ES) or income-expenditure surveys (IES), to quote only the most classic. Among the different existing options, the purpose of this article is to present the mixed surveys on the informal sector (ISMSs), which combines households and businesses, a tool specially designed at the end of the 1980s for the statistical measurement of the informal sector. Although this type of survey has been conducted in dozens of countries, it still remains partly unknown, even among the community of survey statisticians. While there are numerous technical manuals on traditional surveys, ISMSs are to date very poorly documented. The aim of this paper is to contribute to filling this knowledge gap, so that the ISMSs enter the standard toolbox of the survey statistician. We draw on a large number of ISMSs conducted around the world to present their theoretical principles, the challenges encountered in their implementation in the field, and various concrete empirical examples. While focused on methodological issues, the paper also addresses some institutional considerations.
The paper is organized as follows. After this introduction, Section 2 presents the main principles of the mixed surveys and stresses their comparative advantage over other alternatives in measuring the informal sector. A special attention will be given to one kind of ISMS, the 1-2-3 survey, a popular and augmented mixed survey. Section 3 highlights some illustrative findings. Section 4 concludes and, elaborating on previous papers [1, 2], examines further issues to improve statistical measurement and analysis of the informal sector, with a special focus on the challenges raised by the 21st ICLS Resolution concerning statistics on the informal economy, adopted in 2023.
Main principles of informal sector mixed surveys (ISMSs)
After years of cacophony [3], the definition of the informal economy, and in particular of the informal sector is now well established [4, 5, 6]. According to the 21st ICLS resolution, the definition of the informal sector is as follows:
“The informal sector, comprising economic units whose production is mainly intended for the market with the purpose of generating income and profit, but that are not formally recognized as producers of goods and services distinct from the own-use production of the owner-operators’ household (informal household unincorporated market enterprises)” [6].
Given the definition, the economic unit should be the starting point. In this context, two kinds of issues arise, in order to minimize sampling errors and measurement errors. First, how to elaborate a sampling frame for a target population which is not registered, thus probably unknown from public authorities? Second, how to get reliable estimators from economic units which do not keep a formal set of accounts? Without positive answers to these two challenges, indirect method should be favoured over direct survey approach.
Sampling strategy
The fundamental intuition of informal sector mixed surveys (ISMSs) is that Informal Economic Units are easier to capture through the jobs of informal sector workers than via the identification of premises in which the activity is run. The main challenge is then to build the implicit population of individuals, jobs and production units, and their relations. The sequence is, starting with the population, to get to the production units through the jobs (which play the role of an intermediary variable). The two-phase design was developed in the late 1980s in México by statisticians of the National Statistics Office (INEGI) in collaboration of researchers of the French research institute for sustainable development (IRD). They proposed a solution to overcome the conventional approach’s main shortcomings (“first strategy” in Fig. 1), that is the difficulty in achieving exhaustive coverage of the informal sector [7] (see also [8]).
Why informal establishment/enterprise surveys (IES), the natural way to measure the informal sector, is not adequate? Two major issues at stake. The first is to get a comprehensive picture of the reference’s population: the Informal Economic Units. Unless the Economic Census sampling frames is conducted and tied in with the Population Census, exhaustive coverage cannot be achieved, especially as regards activities performed at home or in non-fixed premises. Second, given the informal sector’s erratic demographic laws (business creation and mortality rates), updating registers to draw representative samples of the informal sector is ruled out. That is why most of the surveys conducted along these lines have produced unreliable and inconsistent estimators (underestimating totals; overestimating the share of the Informal Economic Units with premises, and consequently overstating the economic performances of the informal sector, as located enterprises usually perform better than non-located ones).
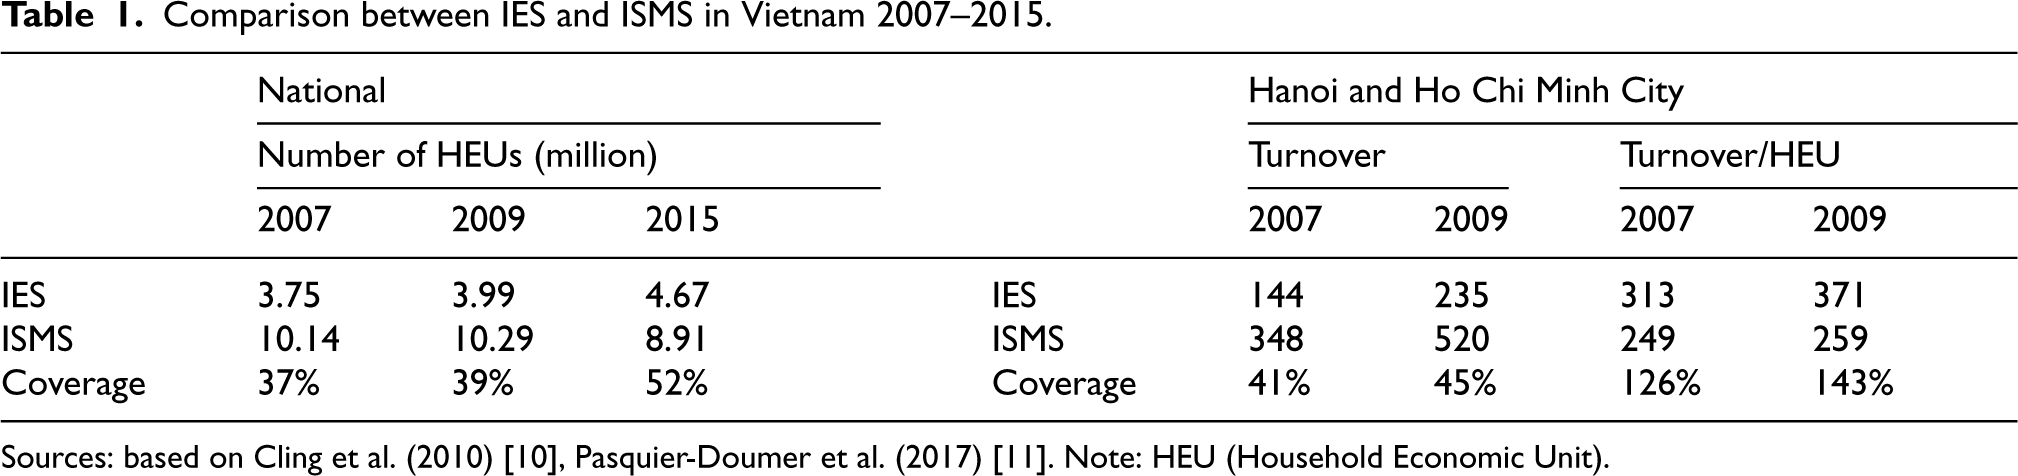
Comparison between IES and ISMS in Vietnam 2007–2015.
Comparison between IES and ISMS in Vietnam 2007–2015.
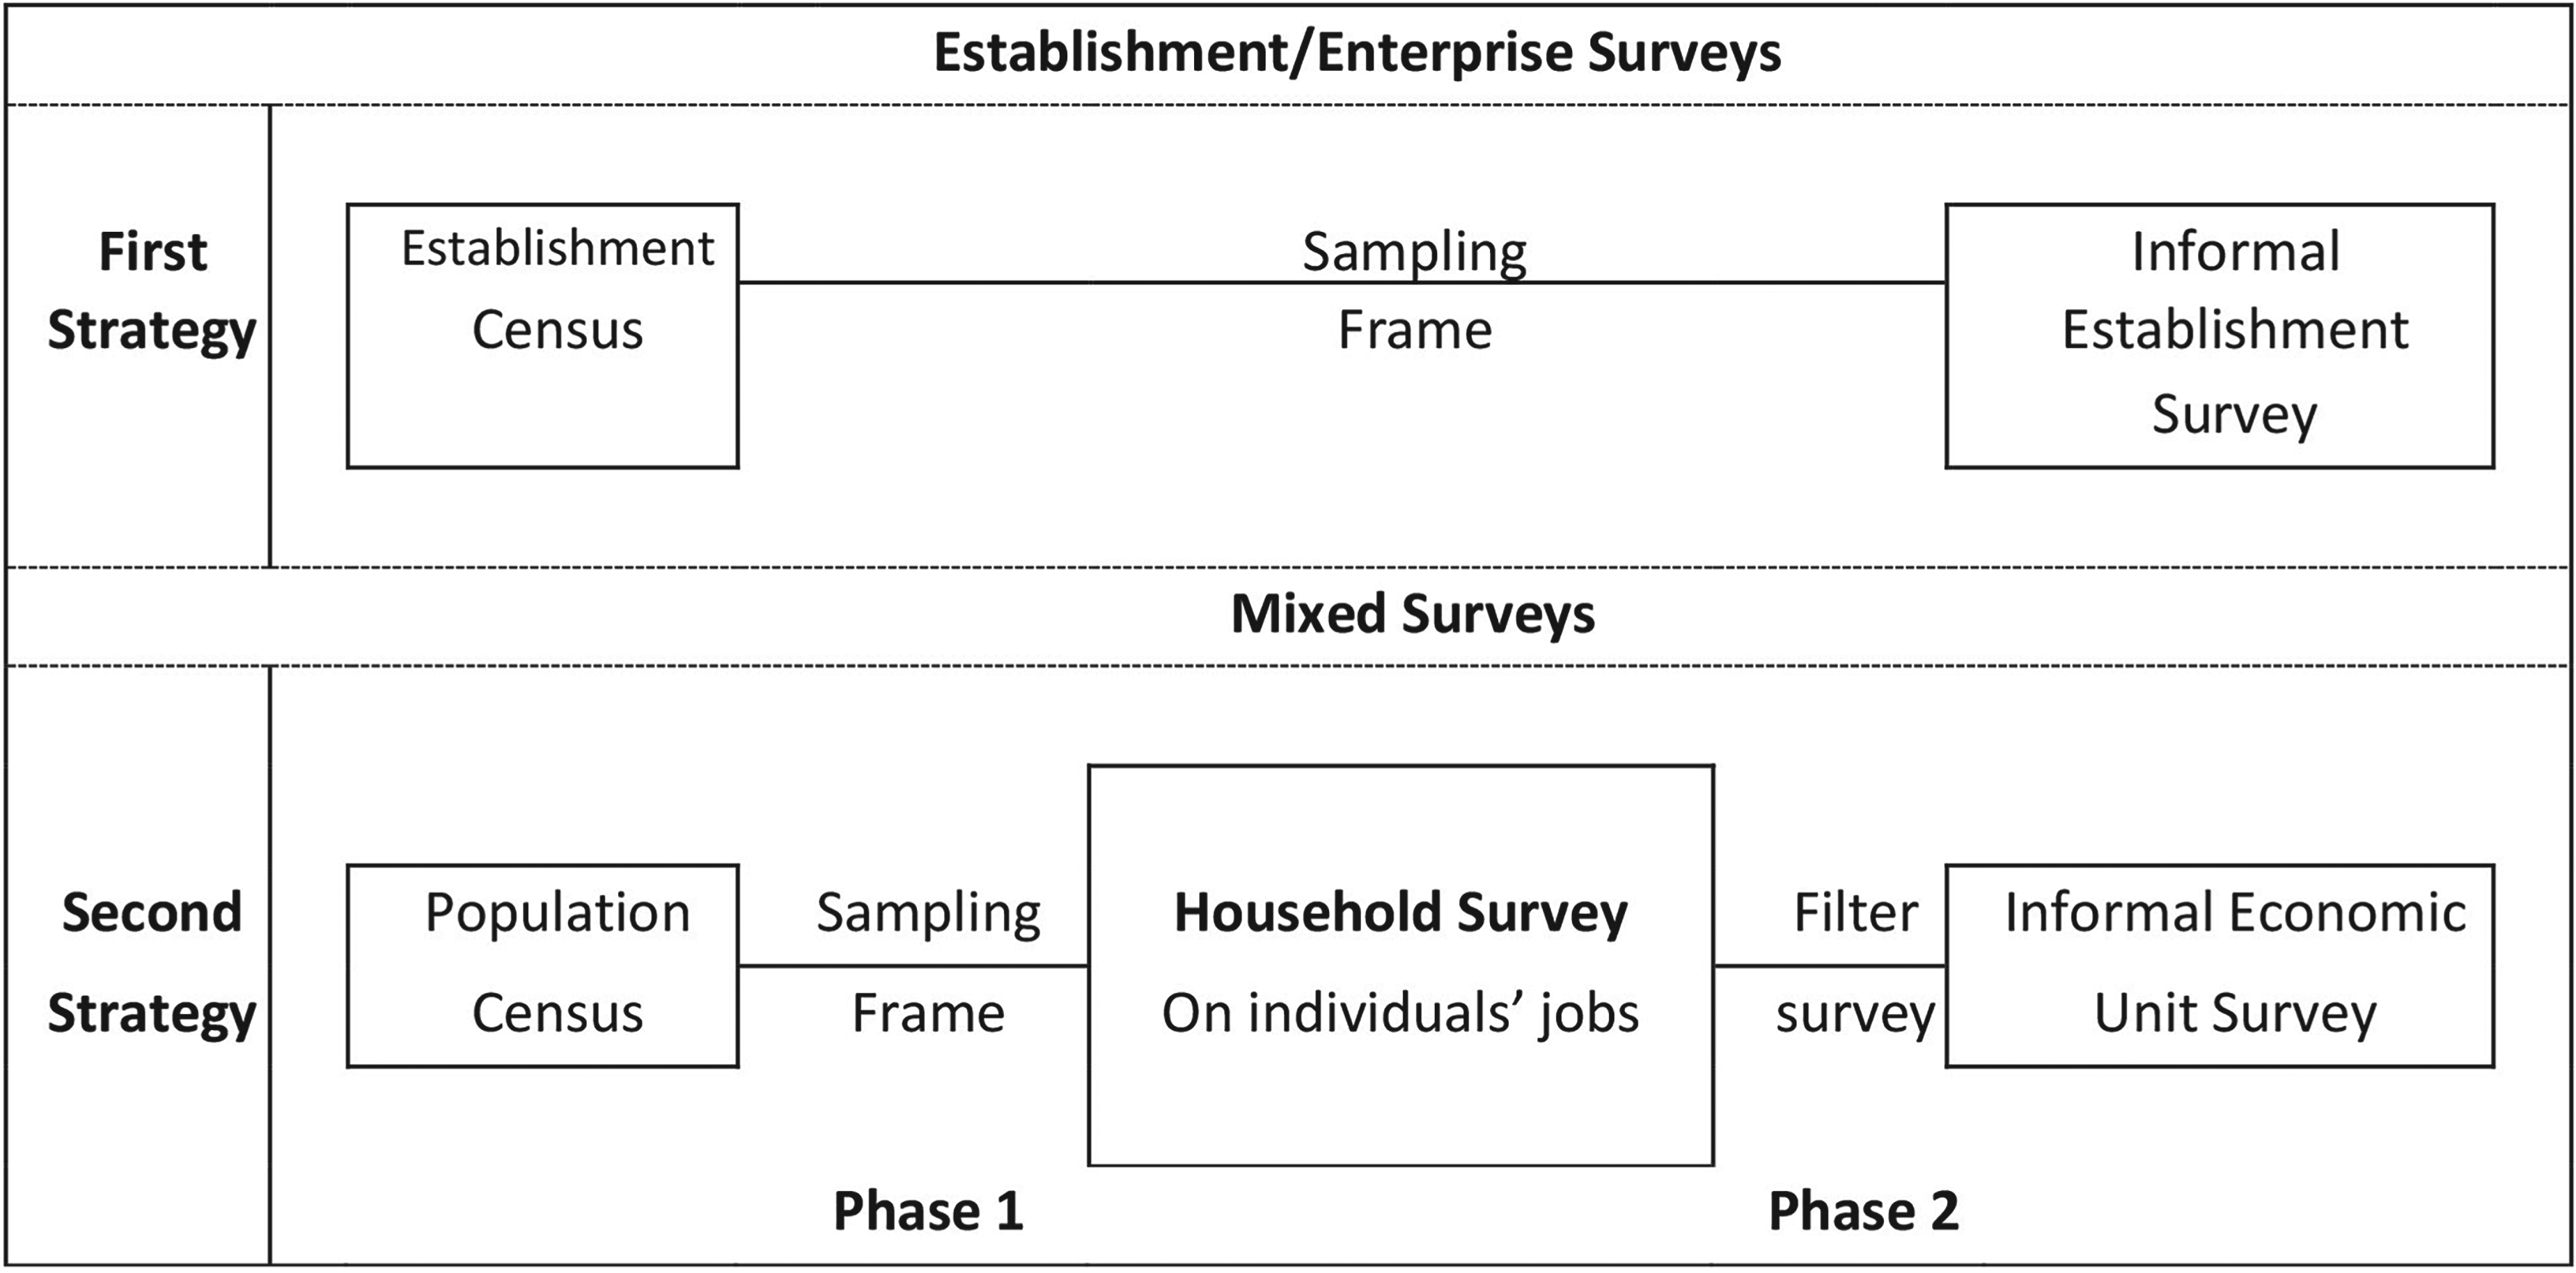
Two alternative sampling strategies for measuring the informal sector. Source: based on Roubaud and Séruzier, 1991 [9].
The Vietnamese case provides an empirical example of the shortcomings generated by the first sampling strategy. In Vietnam, the two kinds of surveys (enterprise survey and mixed survey) have been conducted in parallel, which allows comparing the results. Unfortunately, the Household Economic Unit survey, specially designed to capture household businesses, does not distinguish between their formal and informal status (Table 1). Nevertheless, according to the Household Economic Unit surveys, there were 3.75 million Household Economic Units at the national level in 2007. The corresponding figure drawn for the ISMS was 10.14 million. The IES survey captures just a bit more than one Household Economic Unit out of three. From 2007 to 2015, the coverage rate by the Household Economic Unit survey increased significantly (resp. 37% and 52%), but was still very low (ignoring one Household Economic Unit out of two). In terms of economic performances, the same comparison, restricted to Hanoi and Ho Chi Minh City (the two main Vietnamese cities), shows that total turnover is underestimated by a huge 60% through the Household Economic Unit survey, while the turnover per economic units is over estimated by 26% to 42% in 2007 and 2009. Obviously, these discrepancies would be even higher when considering only informal economic units, as the enterprise surveys only capture the informal sector upper tier.
In order to carry out an ISMS, some conditions are required (Guerrero et al, 2013). First, the phase 1 survey should be an “augmented” LFS (or any other household survey that include a component identifying persons in employment), in two respects. On the one hand, the criterion to identify informal sector jobs (the status of registration of the Economic Unit) should be included in the questionnaire, at least for independent workers (employers, own account workers and dependent contractors). On the other hand, to get the full picture of the informal sector, the filter survey should consider the primary and the secondary job, with the same identifying variables.
If LFSs are the best filter survey (phase 1), other household surveys may be used as second best. However, the same main requirements should be respected: the survey should ensure that all Informal Economic Units are associated with corresponding informal sector jobs, held by independent workers as their head. This condition is not always respected. For instance, the main disadvantage of using the World Bank Living Standard Measurement Surveys (LSMS) to address informal sector measurement is that there is no link between the employment section and the activities of household businesses [10].
Another option would be to rely on an “augmented” LFS only (see paragraph above), not adding a phase 2. Again, this solution is not optimal, for various reasons. Indeed, LFSs provide valuable information on informal sector: informal sector employment, number of Informal Economic Units by sector, size, type of premises, socioeconomic characteristics of Informal Economic Unit’ heads, etc. However LFSs have serious shortcomings in providing statistics on the production within the informal sector. First, measurement of income is based on one or a few questions, with limited reliability. They do not make it possible to elaborate the economic accounts of the Informal Economic Units and other kind of information (see below the list of modules of the 1-2-3 survey). As LFSs are generally high frequency surveys, they rely on relatively light questionnaires. Adding more questions would put the whole survey at risk of overloading the interviewee and increasing non response rate. Second, LFSs protocol usually accepts proxy respondents. In ISMS, the only person supposed to answer is the owner operator of the Informal Economic Unit, the only one to get the full picture of its business accounts. This means that information collected in phase 2 is generally more reliable than the on collected in phase 1. Naturally, there is a price to pay for excluding proxy respondents, as the fieldwork is more complex to organize. But, it is counterbalanced by another important advantage. Common information collected in both phase 1 and 2 (job status of Informal Economic Unit’ head, industry, etc.) can be double checked and corrected in the LFS if necessary. Third, to conduct ISMSs, the interviewer skills should be different from the classical LFS ones. While the latter should be familiar with demographic and labour market concepts, the former should also master economic concepts (like value added, fixed capital, etc.), more common in enterprise surveys or SNA departments; a good reason to collaborate.
Using LFSs as a filter survey raises two additional sampling issues. When the LFS sampling frame has not been design ex ante to measure the informal sector, the sample size may be too small (depending on Informal Economic Units prevalence). In such a case, one may use the information provided by dependent workers to identify the Informal Economic Unit they are working for. It will make the calculation of the weight more complex but still tractable. However using employees information to track their employer location may be ethically problematic. Another option is to used various previous rounds of the phase 1 survey, as experienced in Palestine. Again, some adjustments should be made to compute the appropriate weights (combination of samples), taking into account the mortality rate. The other issue arises when Informal Economic Units are geographically concentrated in some specific areas. In this case, auxiliary information is useful. Obviously, the best option is to elaborate the LFS sample frame in order to satisfy jointly both the LFS and the informal sector survey objectives.
A final concern is the management of the time lag between phase 1 and phase 2. These periods should be as short as possible. The longer the time period between phase 1 and phase 2, the higher the risk of attrition as a greater proportion of Informal Economic Units will have disappeared. The extreme solution to avoid this problem of attrition is to conduct the two phases back to back (once phase 1 has been filled in and the Informal Economic Units identified, conduct phase 2) or even to integrate the two phases into the same questionnaire. The Peruvian household survey (Encuesta Nacional de Hogares; ENAHO) is emblematic in this respect. Since decades, the ENAHO combines successfully in one questionnaire the equivalent of an LFS, a phase 2 survey and income and expenditure questions, which is the best way to address jointly informal sector issues in relation with monetary poverty.
An augmented ISMS: The generic scheme of the 1-2-3 Survey
The 1-2-3 survey is probably the most popular ISMS, notably in Africa. Conducted in dozens of countries in Africa, Asia and Latin America1 since its first implementation in Cameroon in 1993, the 1-2-3 survey experience had a significant societal impact beyond mere statistics [13]. The methodology is recommended by AFRISTAT as the main tool to measure the informal economy in Africa [14]. On the basis of the grafted surveys principle, the 1-2-3 Survey is made up of an arrangement of three interlocking surveys targeting different statistical populations: individuals, economic units and households. A less demanding but still relevant option is to restrict the survey to phases 1 and 2, as chosen in various countries.
The first phase of the 1-2-3 Survey is an augmented LFS (
Let us focus on the phase 2 of the 1-2-3 Survey. The standard questionnaire is an individual form. It comprises
Module A.: The establishment’s characteristics Module B.: Labour force Module C.: Production Module D.: Expenditure and costs Module E.: Customers, suppliers and competitors Module F.: Capital, investment and financing Module G.: Problems and prospects Module S.: Other topics (optional)
Previous to these subject-specific modules, the first page of questionnaire begins with a screening module that to some extend includes the same questions used in the first phase to identify Informal Economic Units. This module is designed to check that information about the Informal Economic Units collected in phase 1 is accurate. Relevant information from phase 1 on Informal Economic Units selected for phase 2 (main characteristics of the Informal Economic Unit – postal address, industry, legal status, type of accounts, registers, type of premises, etc. – and the Informal Economic Unit’s holder – name, age, gender, relation to household head, job status, etc.) is reported ex ante in the phase 2 questionnaire. Then, the same information is collected again in the “filter module”. If the answers are consistent, the others modules are applied. Otherwise, the reason for the change between phase 1 and 2 is collected and, if the selected informant does not hold an Informal Economic Unit anymore, the survey stops. In addition to precisely delimiting the scope of phase 2, the “filter module” can be used to assess phase 1 quality (in the same spirit as post-census surveys). Field experience shows that the average time taken to fill in the questionnaire is 60 to 90 minutes [15, 16].
Compared with other informal sector surveys, the 1-2-3 survey presents some interesting innovations. We highlight five following main points.
First, the questionnaire has been designed to fit in with the national accounts concepts, which is not always the case (cf. the LSMS surveys), and to provide input to develop its main aggregates [9, 17]. The main challenge is to ensure compatibility with the daily empirical categories managed by informal sector entrepreneurs, the vast majority of whom do not comply with formal accounting rules (or even do not keep any kind of accounts). For this purpose, detailed income and expenditure tables (product by product) are drawn up, leaving it up to the entrepreneurs to make the choice of the reference period that suits them the most for each good and service they produce (from day to year, with all combinations in between). Only this fastidious procedure can ensure the reliability of the data produced, in the absence of written accounts.2 However, as for each product, number of units produced, unitary price and total value are recorded, a fundamental side product of this procedure is to allow computing informal sector specific price indexes, which cannot be captured consistently otherwise (see Section 3 for some results).
Second, in order to have a better understanding of the informal sector’s place and links with other sectors (public, foreign enterprises, formal domestic enterprises, etc.), input source and product destination are collected for each item listed in the questionnaire. Furthermore, detailed subcontracting relations are explored. Such information provides the quantified information required to build input/output tables and Social Accounting Matrices that break down the formal and informal sectors at product and industry levels, and by household categories (see Table 4).
Third, one important characteristic to stress is the seasonality of economic activity in the informal sector over the year. One classic (but expensive) way of addressing this issue is to collect data throughout the year.3 However, this sampling frame is not always feasible and has its own shortcomings. Phase 2 of the 1-2-3 Survey sets out to overcome this problem by including a set of questions about the intensity of business operational activity over the last year. Once the current month’s accounts have been carefully set up, a recall table establishes the level of turnover month by month over the full year, distinguishing four options: 0.No activity; 1.Low; 2.Average; 3.High. To quantify these qualitative appraisals, a specific question captures the estimated minimum and maximum level of turnover (never taken per se, but only to estimate the percentage gap between low, medium and high months). This procedure is the most accurate to estimating the annual Informal Economic Unit aggregates, which are not directly measurable. Empirical evidence based on African data shows that Informal Economic Unit mixed income is substantially underestimated if these seasonal factors are not taken into account. Underestimation ranges from a minimum of 5% in Senegal to up to 39% in Mali [19]. Naturally, the two strategies (with samples distributed across the year) can be combined, as in Mongolia (2008).
Fourth, phase 2 also considers other crucial issues more aimed at informing public policies. One of the most relevant is the set of questions exploring in depth the interactions between the informal sector and the state: types of registers and reasons for not being registered, levels of corruption, and compliance with regulations. These questions are similar to those found in the Business climate surveys (World Bank) investigating governance issues. Another important topic concerns problems encountered by informal sector entrepreneurs and their demands for public specific policies to facilitate informal sector activities (simplifying registration procedures, scaling up micro-credit structures, targeting training programmes, improving access to equipment, market information, adjusting the tax system, etc.). These qualitative data modules have strategic statistical properties. These data are easier to collect than quantitative data on economic activities (for instance, production estimates), guaranteeing that, even if the survey fails in its quantitative part, it will at least provide valuable information on qualitative issues. Moreover, field experience shows that informal producers are usually more comfortable about answering these questions than traditional accounts data. This can improve the response rate and the quality of answers to the quantitative modules.4
Fifth, the labour force module (B.) lists, for each enterprise, all working members with their personal characteristics (relation to the enterprise’s head, gender, age, ethnic group, education, training, experience, seniority, etc.). Thus, phase 2 can be considered to be a matched enterprise/employee survey. The new developments in this type of survey, mainly on formal enterprises, can be applied to the informal sector. In particular, labour market functioning and industrial relations can be reconsidered by studying the matching process between employer and employees, taking into account individual characteristics of employees and enterprises at the same time.
The objective in this section is not to comment in details the results of the figures but to illustrate which kind of information can be obtained through ISMSs, which could not be obtained for other sources. We selected six of them, based on ISMSs conducted in different parts of the world.
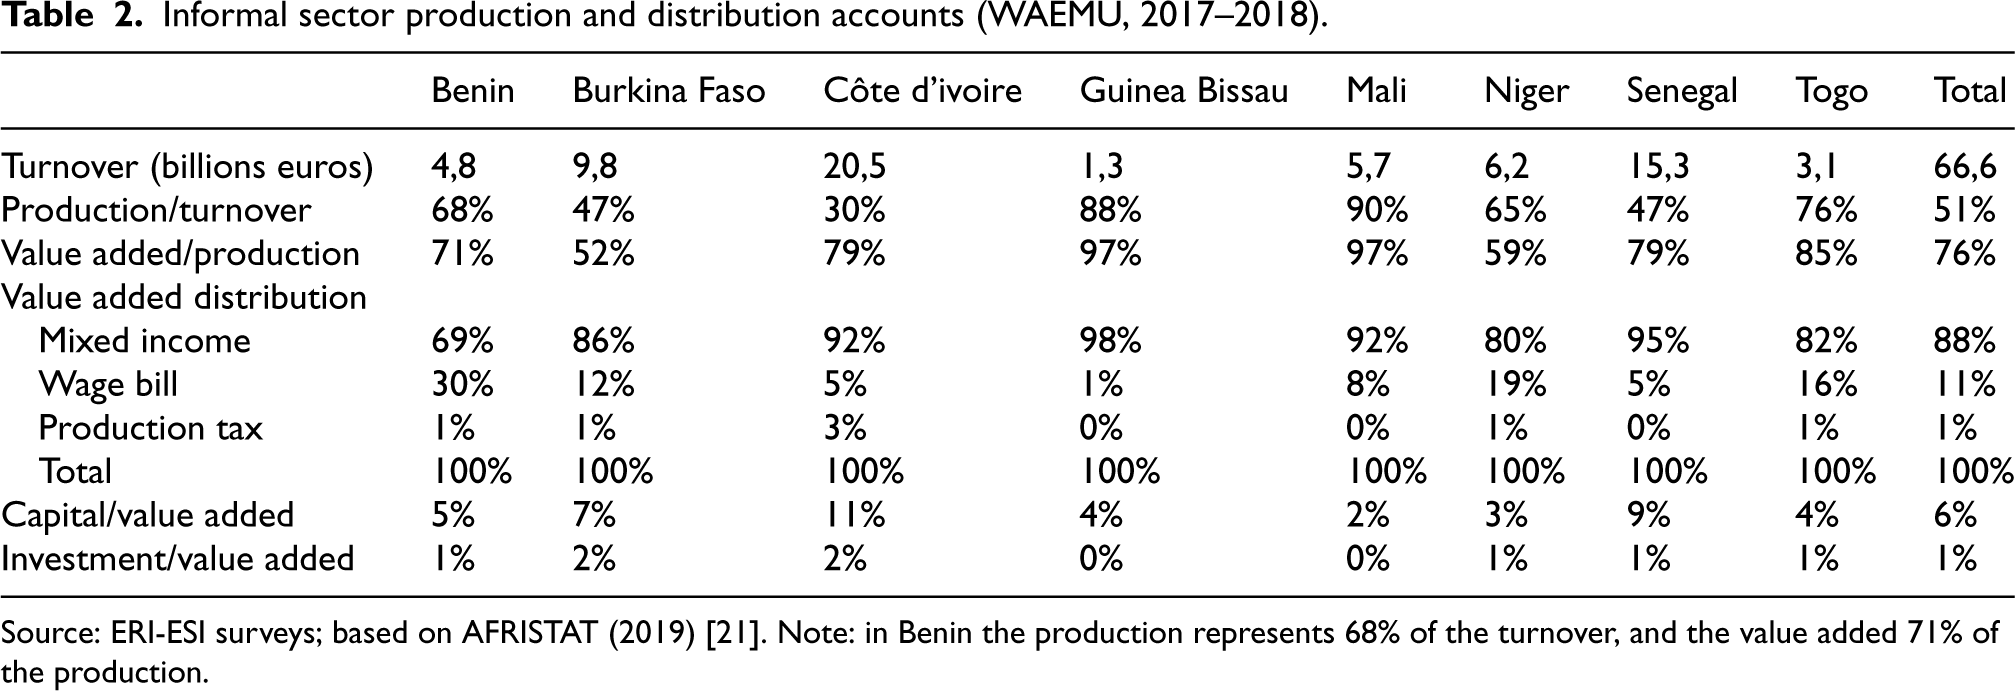
Informal sector production and distribution accounts (WAEMU, 2017–2018).
Informal sector production and distribution accounts (WAEMU, 2017–2018).
Source: ERI-ESI surveys; based on AFRISTAT (2019) [21]. Note: in Benin the production represents 68% of the turnover, and the value added 71% of the production.
Table 2 is based on a set of national harmonized surveys on labour market and the informal sector conducted by the NSOs and coordinated by AFRISTAT in the WAEMU (West Africa Economic and Monetary Union, counting 8 countries) in 2017–2018 [21]. The surveys are a local version of the 1-2-3 survey, without the phase 3, conducted independently (see Section 4). We present the informal sector technical coefficients, based on the main economic aggregates (turnover, production, value added and its distribution, etc.). In this region, as in other African countries covered by AFRISTAT, the 1-2-3 survey scheme is the tool recommended to measure the informal sector, and the main input for the National Accounts elaboration. All indicators captured in the survey are aligned with the SNA concepts to produce production and distribution accounts, and beyond. For instance, the survey includes a measure of productive capital, in order to estimate production functions and capital accounts. Another example is the elaboration of Social Accounting Matrices. The harmonization of the survey at the regional level is a huge advantage, for comparison and policy purposes.
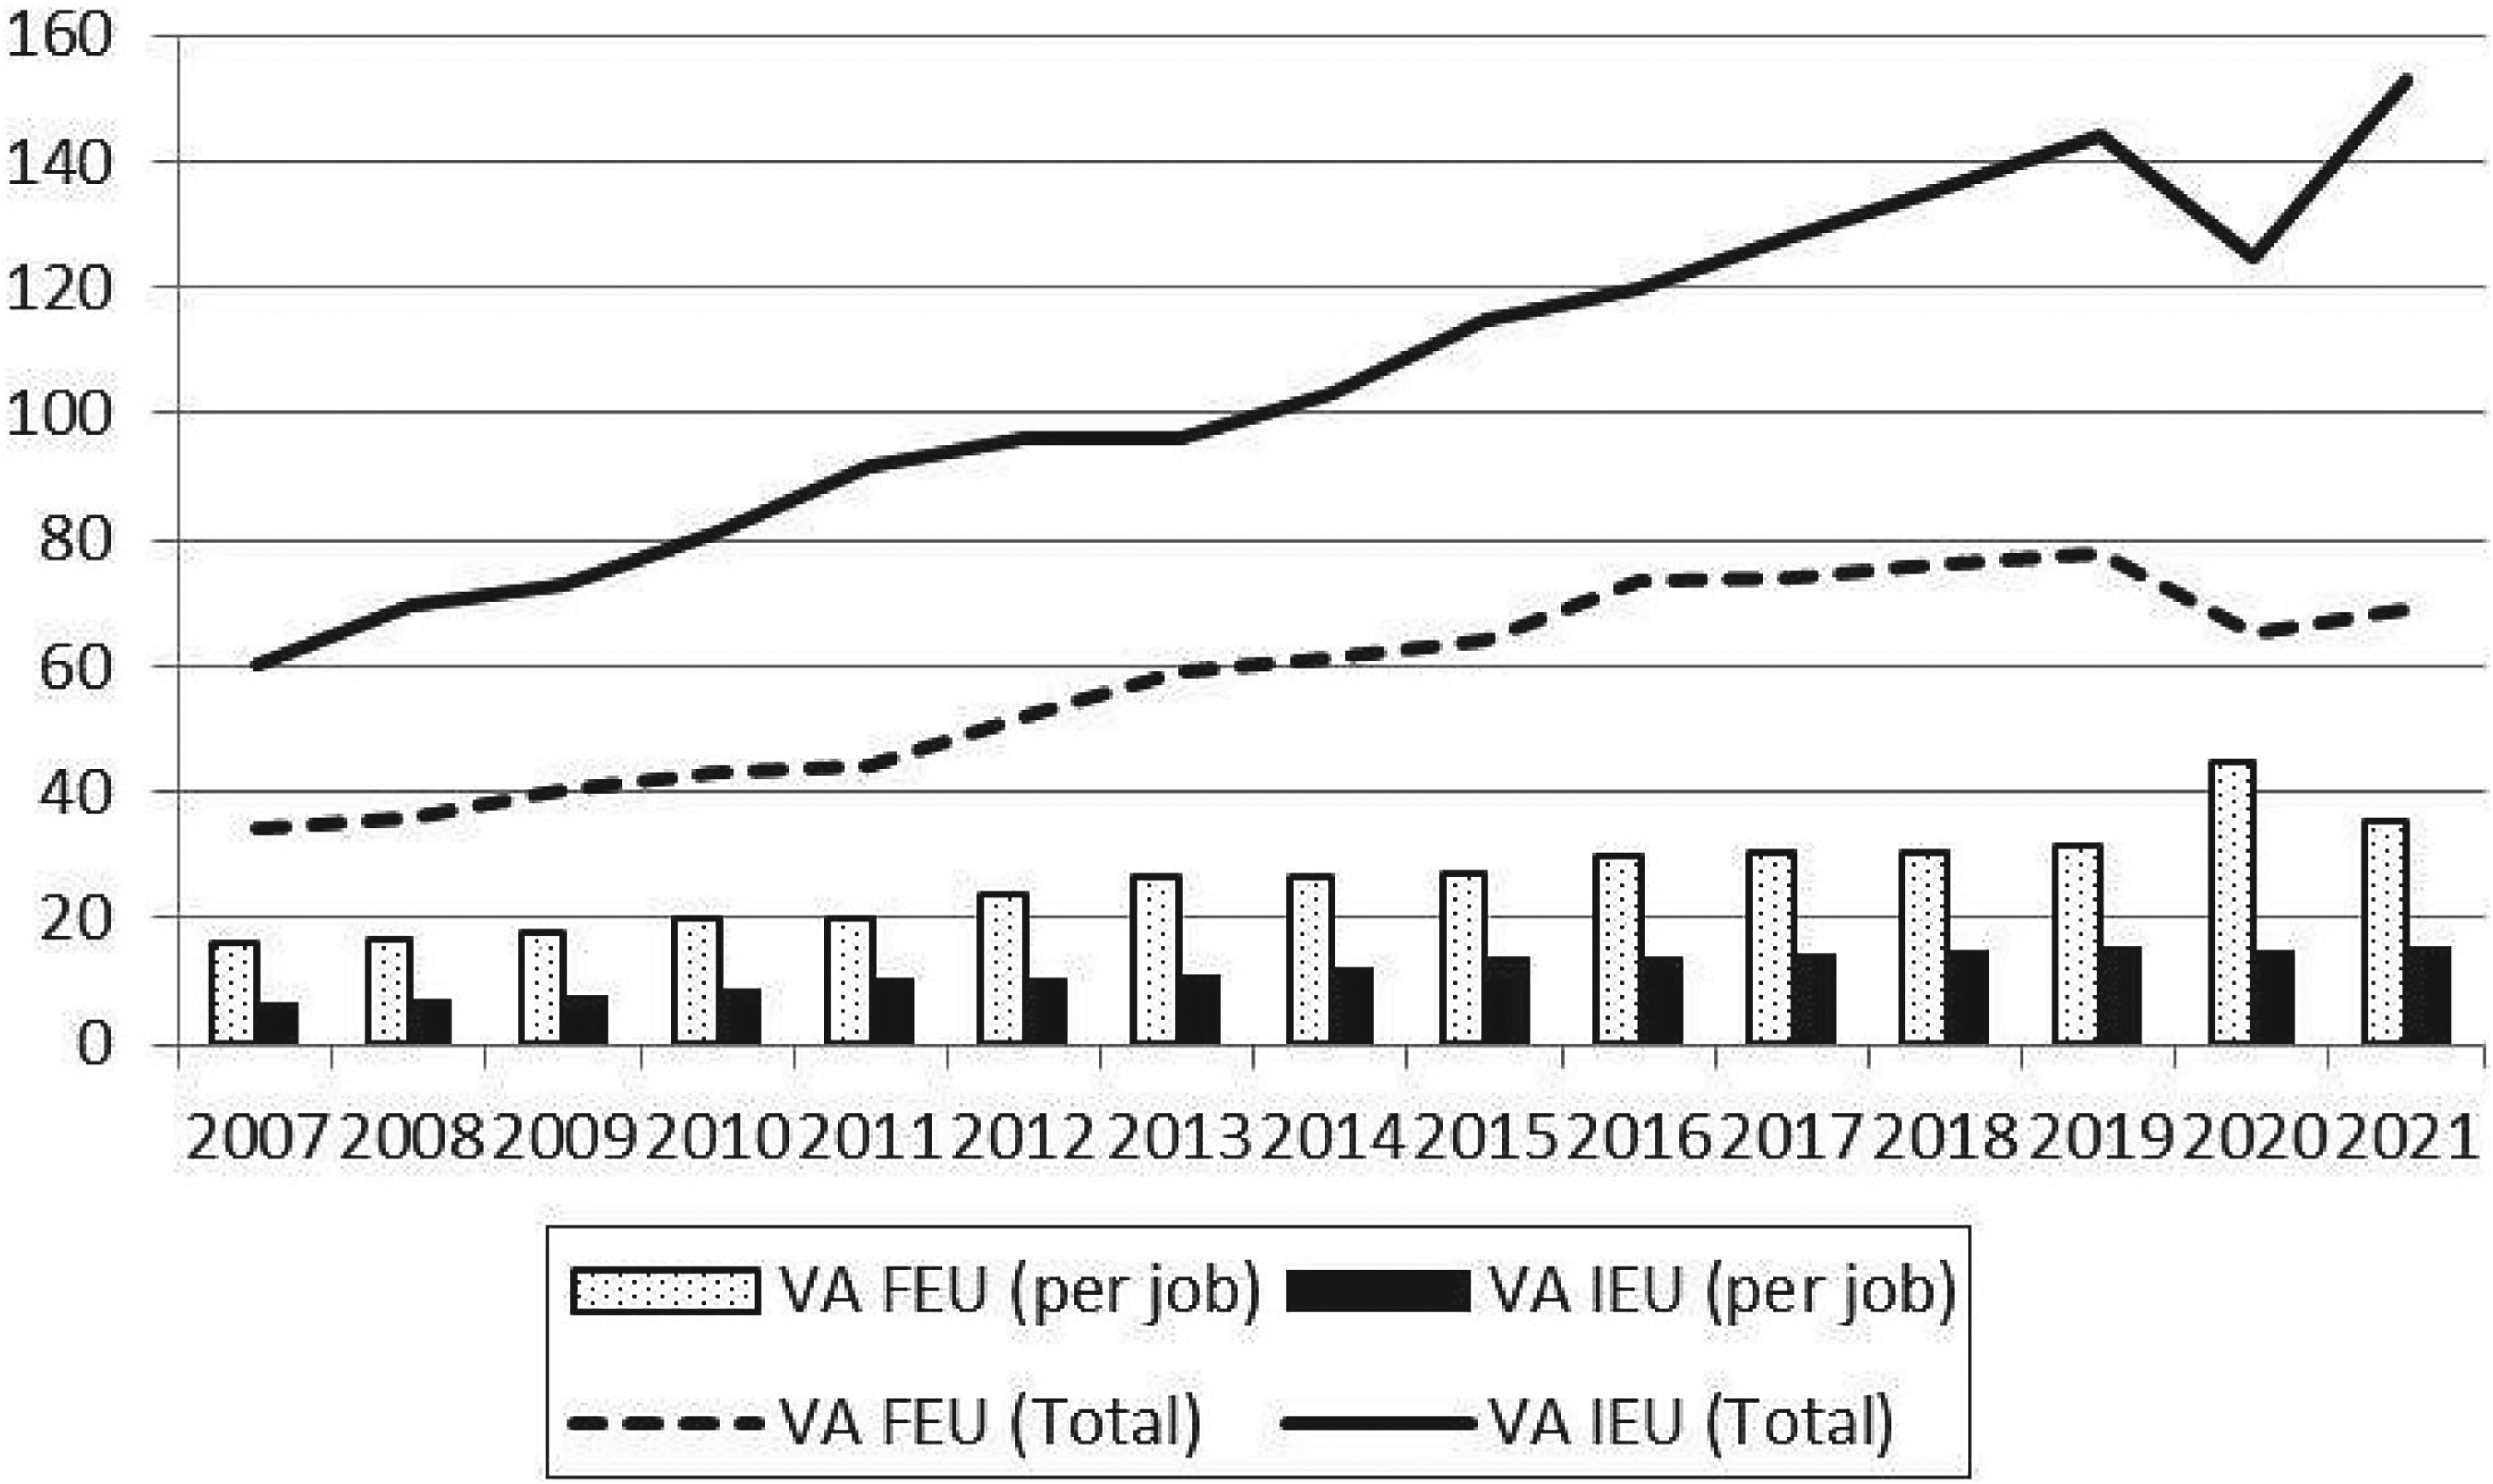
Macro-dynamics of Informal and formal household economic units production (Peru, 2007–2021). Source: ENAHO surveys; based on INEI (2022) [23]. Note: VA FEU (VA IEU) correspond to the value added of Formal (Informal) Economic Units.
As stressed above, the national household survey (ENAHO) is an integrated 1-2-3 survey, where the three phases are included in the same survey. Figure 2 shows the total value added and the value added per worker of Formal and Informal Economic Units from 2007 to 2021. One of the key advantages of the ENAHO is to capture both kinds of household economic units. As expected, Formal Economic Units are 2 or 3 times more productive than Informal Economic Units, confirming the importance to capture and distinguish them. However, as Informal Economic Units are much more numerous than Formal Economic Units, the major part of the household economic units value added comes from the informal sector. Nevertheless, one issue remained unanswered. From 2007 to 2021, Formal Economic Unit value added was multiplied by 2, in current prices, while the corresponding figure was 2.5 for the Informal Economic Units. But this does not mean that the real growth rate was higher for the informal sector. It depends on their respective deflators, without any reason to consider they should be same, on the contrary. The only way to answer this basic question is to elaborate specific deflators for formal and informal sectors (as further discussed later). Given the richness of the data over a long period of time, the INEI elaborates a comprehensive satellite account of the informal economy, first published in 2014 [22], and updated in 2022 [23].
Transitions from the informal to the formal economy are part of the international agenda ([24]; SDG 8). One way to assess these transitions at the micro level is to conduct panel surveys, following the same Economic Units over time. This was done in Vietnam where a 3 waves longitudinal survey were collected in 2007, 2009 and 2014 for a representative sample of Household Economic Units in Hanoi and Ho Chi Minh City [10, 11]. Figure 3 presents the transitions between formal and informal sectors. In this context, a minority of Informal Economic Units got formalized, but an equivalent number of Formal Economic Units got informalized. But for these movers, it corresponds to a transient status, as a half of them returned to their initial sector in the 3rd period. The big picture is that transitions are a complex phenomenon, which should be investigated further with panel data, as the only way to capture the micro-dynamics of Household Economic Units. A complex economic phenomenon indeed, but also a tricky statistical challenge: to define how to identify the same Economic Units (for instance, how to consider an Economic Unit with the same manager but in a different sector from one date to the other?). How to address the attrition process? It shows also the interest of adding formal household economic units in ISMSs, as in Peru since more than 20 years.
Variation of informal sector price indexes, CPI and GDP deflator (Madagascar, 1995–2010) (%)
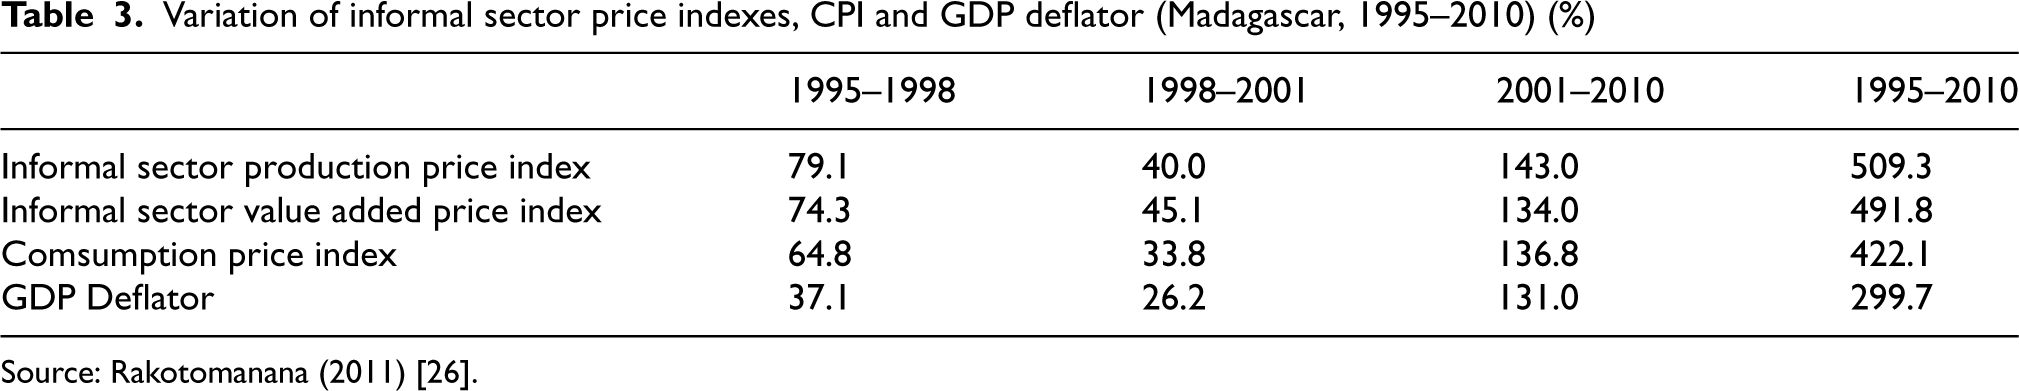
Source: Rakotomanana (2011) [26].
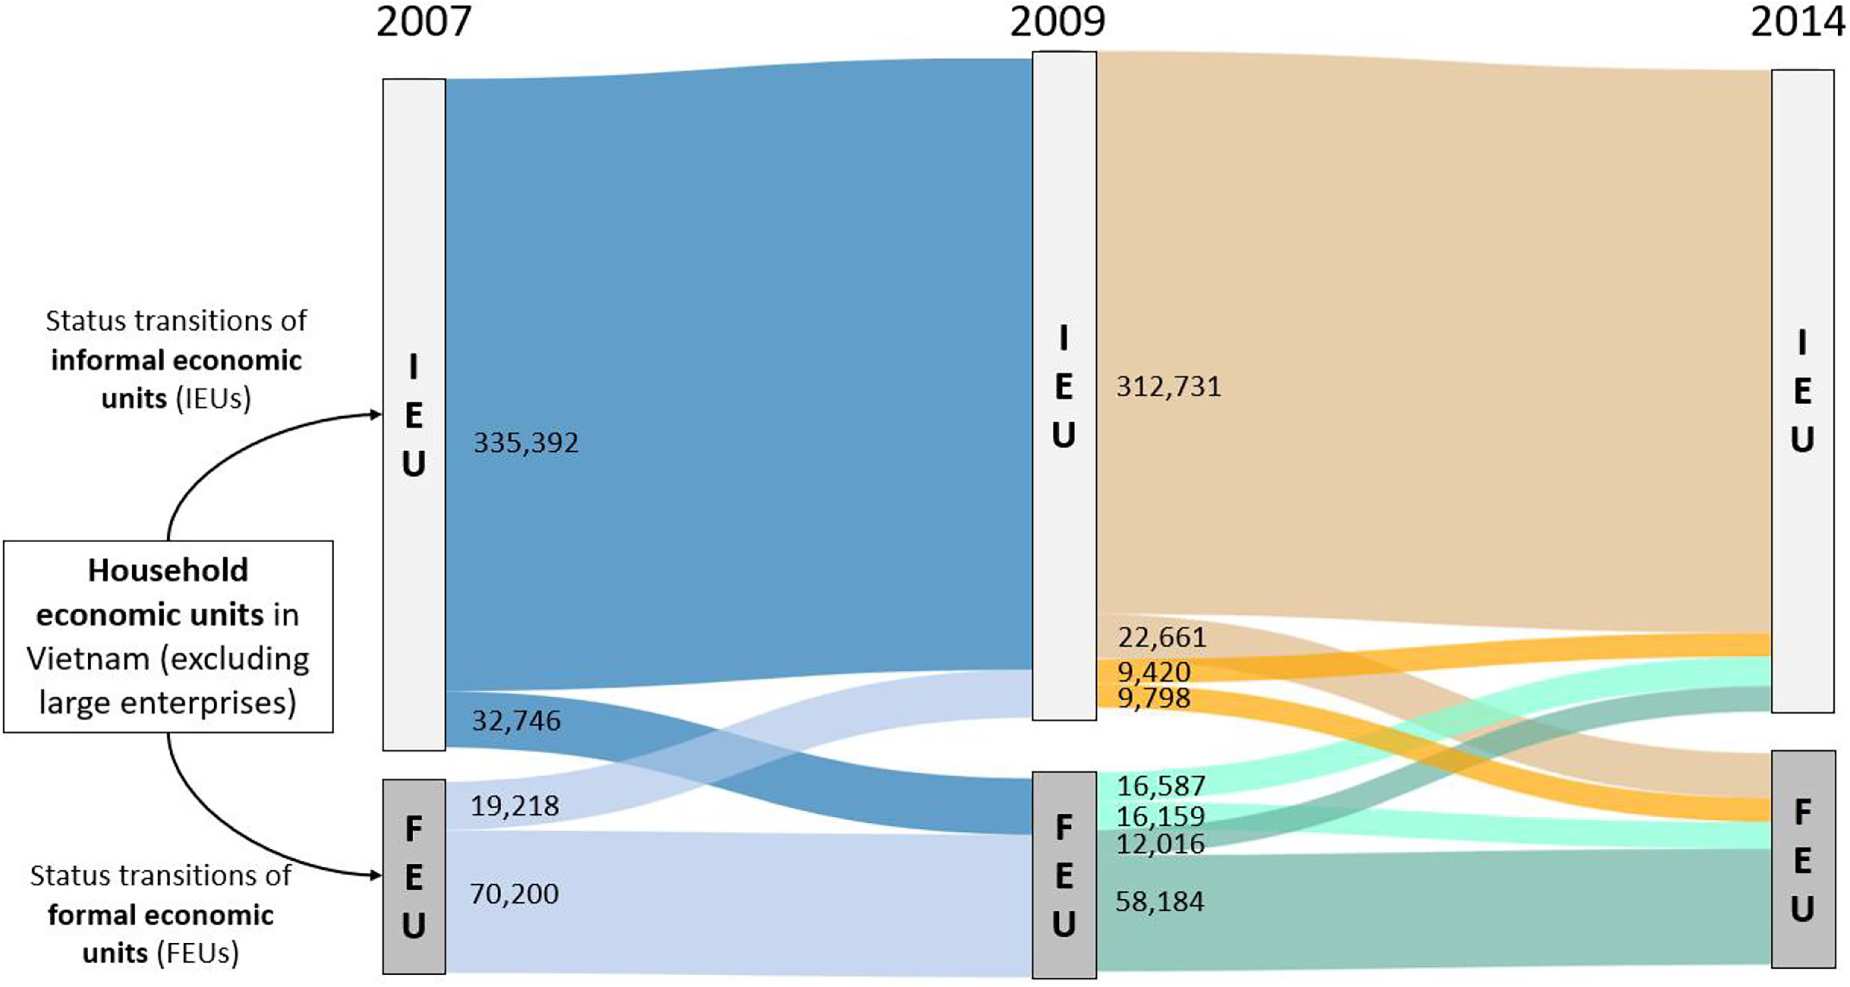
Micro-dynamics of Informal and formal household economic units (Vietnam, 2007–2014). Source: based on Ralaimidona (2024) [25]. Note: FEU (IEU) correspond to Formal (Informal) Economic Units.
Despite the proliferation of surveys, it is still impossible today to reply to the simplest question concerning the informal sector: “In a given country, has the informal sector production increased or declined over time (whether in absolute or relative terms)?” This major shortcoming no doubt explains why macro-studies on the informal sector have been abandoned in favour of approaches that are more micro-focused on the labour market. The question is: which deflators should be applied to the informal sector to obtain the economic aggregates in comparable volume from one period to another? None of the existing price indexes are suited to capture the informal sector price dynamics. Nor the GDP or industries deflators (as they mainly measure the formal sector), nor the consumption price index (which includes formal products with an inadequate ponderation) reflect the specific composition and evolution of prices in the informal sector. To our knowledge, nothing has been done in this key area, apart from the elaboration of specific production price indexes for the Madagascan informal sector between 1995 and 2010 based on phase 2 of the 1-2-3 surveys conducted in that country [14, 26]. The results are presented in Table 3. During this period, informal sector production prices increased by 509%, while the valued added price index increased by 492%. During the same period, the CPI increased by 422% and GDP deflator by 300%. These huge differences show that the only way to deflate properly informal sector economic aggregates is to conduct an ISMS, with detailed prices and quantities by products, similar to phase 2 of the 1-2-3 survey.
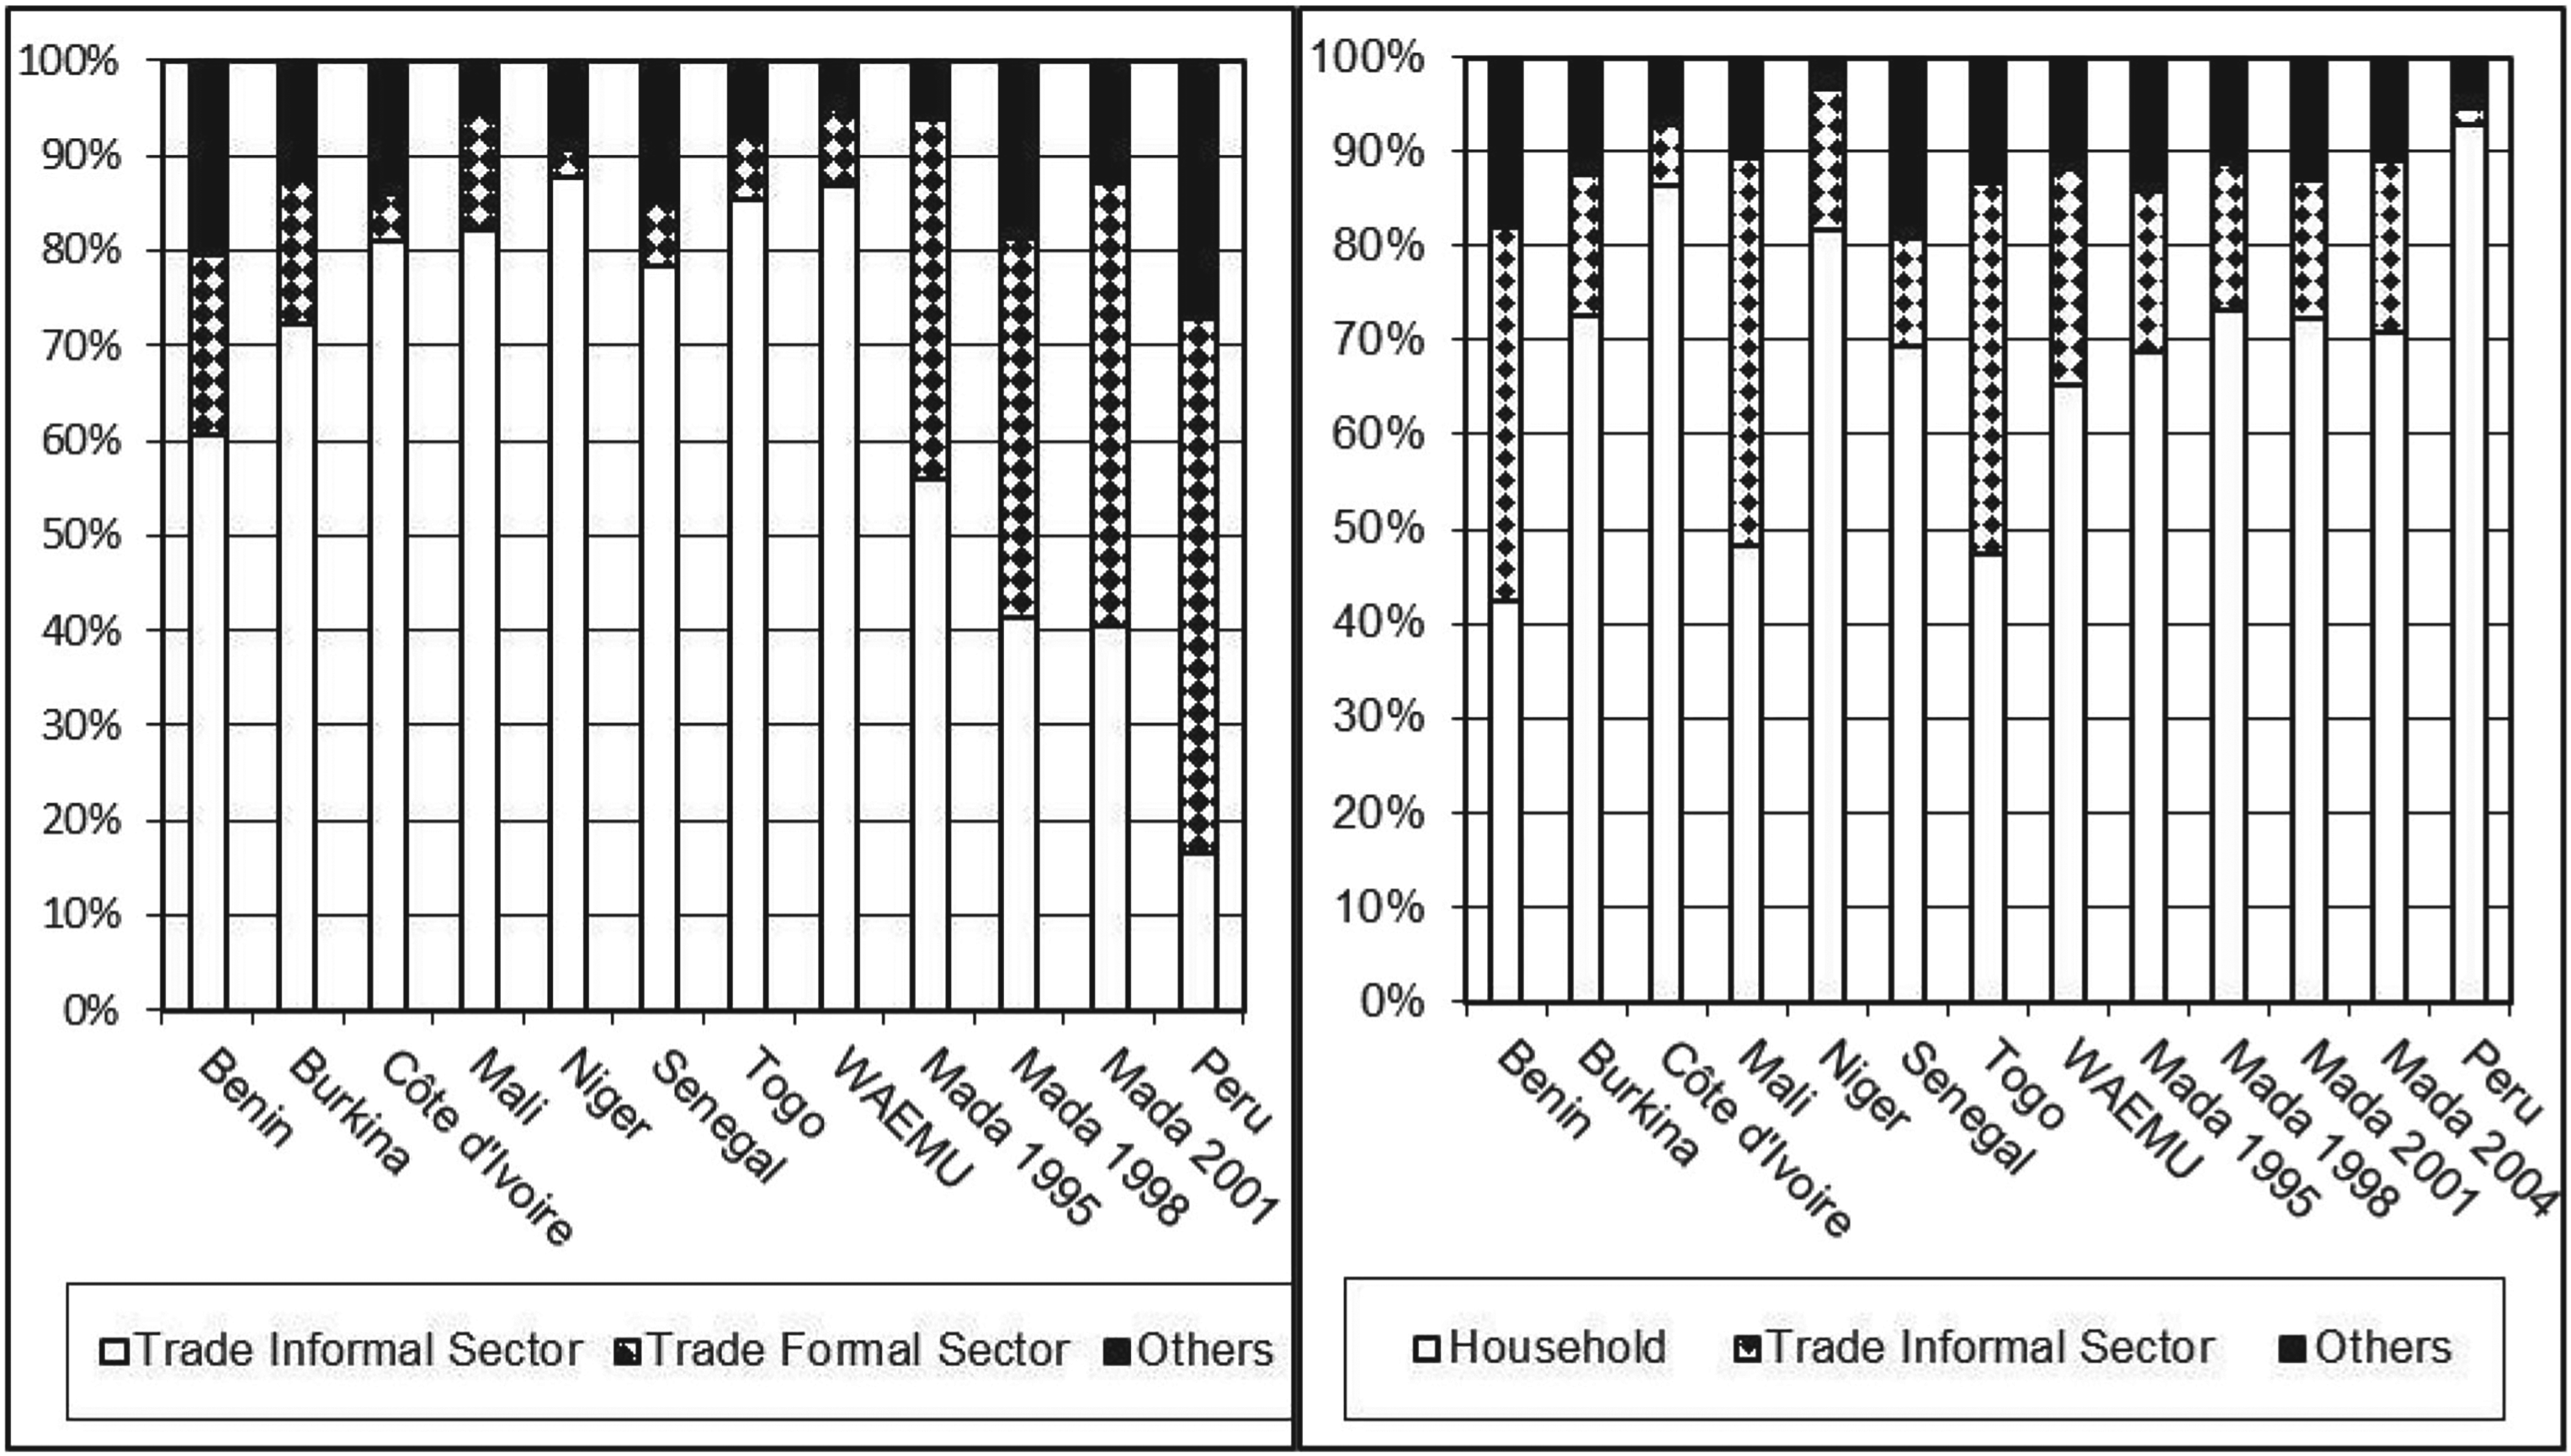
The previous figures present an extended set of classical indicators on the informal sector (jobs, production, prices…). However, phases 2 and 3 of the 1-2-3 surveys have been designed to go beyond. The examples selected here intend to assess the integration of the informal sector with other segments of the economy. First, Fig. 4, drawn from phase 2, shows the origin of inputs and the destination the informal sector production, by type of agents and relevant sectors (distinguishing trade and non trade activities) for various countries [27]. Given the information is available product by product, the distribution is measured in monetary amounts and not only as an answer to a qualitative question on the main origin of inputs or the main destination of production, as it is sometimes asked in some surveys. On the one hand, In West Africa, the informal sector’s main supplier is informal trade, accounting for more than 80% of intermediate consumption on average (panel a.). In Madagascar, formal and informal trade shares are more balanced, while formal sector dominates in Peru. Furthermore, the repeated cross sections in Madagascar show that the informal sector’s share shrinks with growth (1995–2001), as intermediate consumption purchased in the informal sector is gradually replaced by formal sector inputs, the Informal Economic Units becoming more productive. On the other hand, the figure (panel b.) suggests that the informal sector production is mainly oriented to satisfy household demand, and secondarily informal sector intermediate consumption. Direct exports and demand from the public sector are negligible.
Demand side: Consumption informal sector by quartile of consumption per head (various countries, circa 2000).
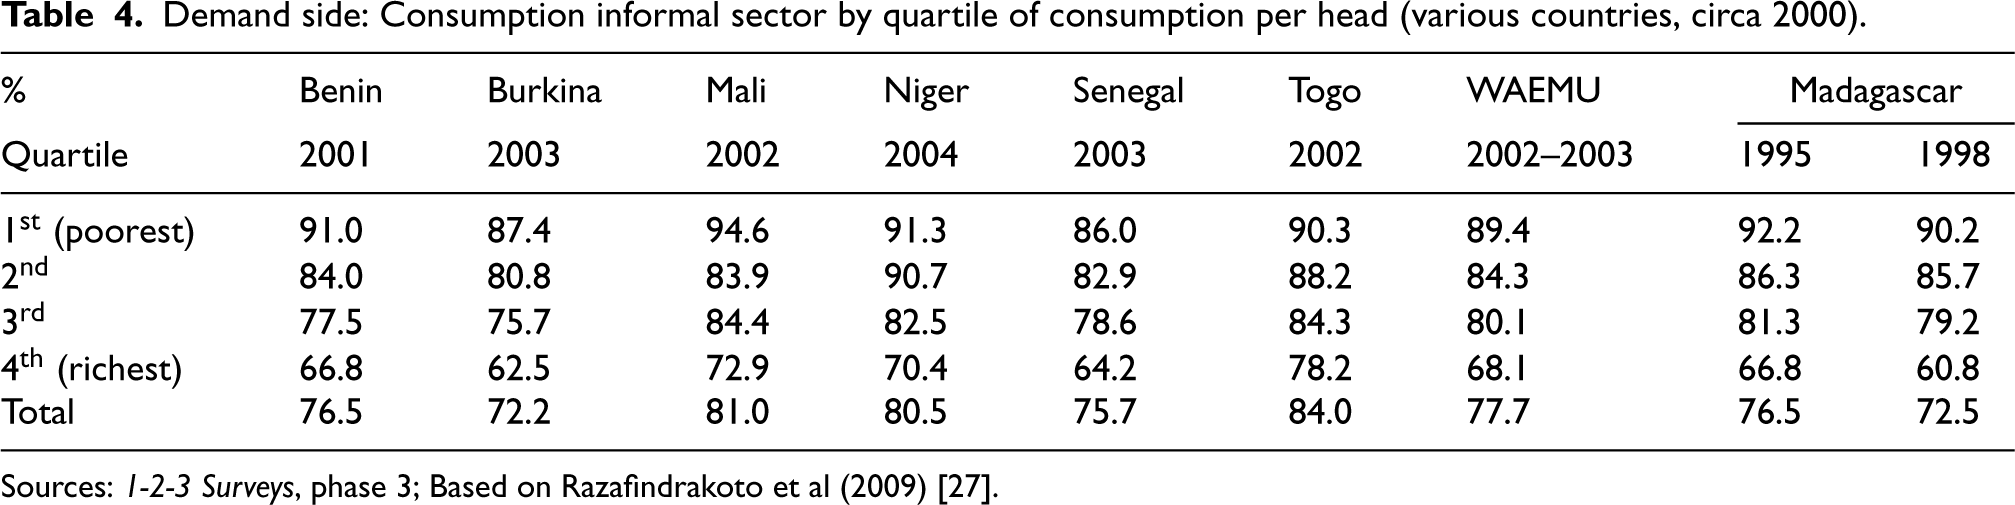
Sources: 1-2-3 Surveys, phase 3; Based on Razafindrakoto et al (2009) [27].
While Fig. 4 shows that the informal sector is mainly dedicated at satisfying final consumption, the dual question is which part of the household consumption is satisfied by the informal sector? Phase 3 of the 1-2-3 survey has been designed to provide an answer to this question. For each product, in addition to information on the type of product, quantity, unit price and total value, the survey inform about the place where the products are purchased (or obtained). The classification of place of purchase is elaborated in order to distinguish formal and informal sectors. Table 4 gives an example of results derived from phase 3 in some Sub-Saharan Africa countries [27]. It shows that the weight of the informal sector in household consumption is extremely high. More than three-quarters of total consumption is purchased in the informal sector. In all countries, the poorer the households, the higher the informal sector share. Yet, even among the wealthiest households, the informal sector accounts for the main part of consumption (more than two-thirds). In Madagascar, however, where phase 3 has been repeated for a number of years, the share of the consumption coming from the informal sector decreases with income growth (i.e. the income elasticity of informal products is lower than that the income elasticity of formal products). This kind of results can be further disaggregated by categories of products and other kinds of household typologies.
The increase in the number of informal sector surveys over the last thirty years is an indication of their progressive anchorage in the world’s statistical toolbox on the informal sector, to the detriment of enterprise surveys, which statisticians preferred in the past (enterprise surveys have not completely disappeared). While this change in the method of understanding the informal sector is squarely in line with the recommendations of the 1993 ICLS Resolution, a number of difficulties currently encountered – some old, others are more recent and potentially engendered by the new 2023 ICLS Resolution are worth highlighting.
First, concerning the definition and boundaries of the informal sector, the 2023 ICLS Resolution introduced three main changes: a) to get aligned with the SNA concepts, the Informal Economic Unit should be mainly intended for the market instead of partly intended for the market; b) the Informal Economic Unit should be not registered (not covered by formal arrangements), while 1993 Resolution accepted other second best criteria, like the size; c) agriculture is now included in the boundaries of the informal sector. In fact, none of these changes create serious challenges to the ISMSs strategy. The non-registration criterion was already adopted in most of the ISMSs (and systematically in the 1-2-3 surveys). However, some LFSs, even those of the highest quality like the Brazilian LFS (PNAD-C), still do not include the registration criterion for all workers (in this case, for employees), making it impossible to capture informal sector jobs [28]. The inclusion of agriculture in the survey do not pose significant challenges and has already been done successfully in some ISMSs. There is no sampling issue here, the main decision is whether to use the same phase 2 questionnaire for all kinds of activities, or to draft a specific questionnaire more suited to agriculture (see for instance the ENAHO in Peru). Finally, distinguishing between activities mainly intended for the market or mainly intended for own-use was already a tricky business in previous surveys. The best option is to survey both kinds of Economic Units and to disentangle ex post those to be classified in the informal sector and those belonging to the household own-use production sector, depending on the information provided in phase 2.
Second, the development of platform workers and the introduction of dependent contractor category in the ICSE-18 [29] add an additional degree of complexity to identifying Informal Economic Units in the filter survey (LFSs) It should be noted that it is a common challenge to all LFSs, but does not create specific problems in the second phase. The difficulty does not rely mainly on distinguishing formal and informal dependent contractors, as the criterion for her business to be considered as an Informal Economic Unit is the same as for independent workers (provided that non registration apply to their own business and not the enterprise they are working for), but arises because some of them may declare themselves as employees (of the platform there are working for, for instance). Clear instructions should be given upstream to interviewers to avoid this kind of misclassification and question should be included that enables an identification of this group in the LFSs The other case of misclassification (dependent contractor declaring themselves as independent workers) is not an issue, as, once identified as holding an Informal Economic Unit, they will be surveyed in the second phase. It is worth noting that some dependent contractors might only provide their labour as input. However in most cases, they should invest in their own Economic Unit, not providing capital being one of the contractor main incentives to develop this kind of labour arrangement (for instance, the car of platform drivers).
Third the question of the institutionalisation of the ISMSs within the official National Statistical System is at stake. Today, relatively few countries conduct mixed surveys regularly. Apart from the necessity to disseminate information about the long standing experience on ISMSs and advocating activities to promote them, the time frame to implement these surveys should be considered. Because of their cost and the fact that the structural parameters (technical coefficients) does not change so quickly over time, high frequency survey, annual or infra-annual ISMSs may not be required. The ISMSs could be conducted every 3 to 5 years, and at least at each change in the national account basis. In between, the LFS should be used to update the data, in terms of jobs and economic output [30]. On the one hand, the LFS captures employment in the informal sector. On the other end, in general the LFS provides information on job earnings: both employee wages and independent workers mixed income, which correspond to the two value added main components. Production taxes are missing, but they are marginal as shown by Table 2 (1% in the WAEMU). As seen above, these measures may not be completely reliable (and probably underestimated), but their evolution is a good proxy of the informal sector value added dynamics, provided the bias is constant over time (a plausible hypothesis; Roubaud, 1989). A more ambitious option would be to develop a light phase 2 questionnaire, with a selection of key variables, which could be grafted to the LFS without overloading the survey.
Finally, in this paper, we show that ISMSs are a good (and according to us, the best) candidate to measure the informal sector in its different dimensions. From its inception four decades ago, a lot of experience has been accumulated at the international level to prove it is a robust instrument to be incorporated in the toolbox of the survey statistician. As for other surveys, there are still a number of challenges to be overcome, the main one being the elaboration of appropriate deflators. Toeven better equip the countries to conduct mixed surveys, it would it be beneficial to implement cognitive testing to try to develop more respondent friendly question. Methodological exercises should also be conducted: for instance to assess pros and cons of direct questions vs detailed questions on economic outcomes, the extent of misclassification of dependent contractors, employees and independent workers, the impact of proxy respondent on data quality, or list experiments to assess social desirability biases. But to begin with, taking stock on past experiences, accumulated over the decades but never consolidated, is required urgently.
However the main challenge is not technical but institutional. Because of the lack of institutionalization within National Statistical Offices, ISMSs lost momentum in the recent years. This is particularly the case of the phase 3 of the 1-2-3 survey. In many NSOs departments in charge of LFS and income-expenditure surveys are not connected, and usually the latter does not consider informal sector issues as priority. In the case of francophone Sub-Saharan Africa, where the experience was the most extensive, the World Bank proselytism to maintain its leadership on LSMS surveys focused at measuring monetary poverty, put a stop at new collections of phase 3 surveys, without integrating their innovations. More generally, a political economy approach suggests that powerful international actors contribute to explain why ISMSs encounters difficulties in getting institutionalized. While LFSs are supported by the ILO and IES by the World Bank, ISMSs cannot count on any international champion. National actors play also a role in this respect. The structure of NSOs and the actual division of labour between services in charge of different surveys, do not facilitate the implementation of a comprehensive survey system to measure the informal sector in an integrated manner. One suggestion would be to attribute the supervision of ISMSs to the National Account Department. It would be in charge of coordinating the different components of this new scheme, with the side advantage of boosting collaboration between services, often working independently. Locating the ISMS within the National Account department would have also two technical advantages. First, the close collaboration between the survey statistician and the national accountant to develop the ISMS questionnaire would ensure that it meets the objectives of the national accounts as well as the objectives of economic analysis. Second, integrating the results of the ISMSs into the national accounts can help address the issue of limited data availability (like the limited number of production units in certain industries). The integration of the 21st ICLS resolution in the forthcoming revision of the SNA (2025) might be a good opportunity for a further push towards an increased awareness and ownership of the ISMSs within the SNA community. At the end of the day, as informal sector is here to stay, providing livelihood to the poorest segments of the world population, it deserves as much efforts from the statisticians as formal sector, in order to deliver inclusive growth.
Footnotes
Acknowledgments
I thank the two anonymous referees for their valuable comments.