
Abstract
Today, most activities of the statistical offices need to be adapted to the modernization policies of the national statistical system. Therefore, the application of machine learning techniques is mandatory for the main activities of statistical centers. These include important issues such as coding business activities, address matching, prediction of response propensities, and many others. One of the common applications of machine learning methods in official statistics is to match a statistical address to a postal address, in order to establish a link between register-based census and traditional censuses with the aim of providing time series census information. Since there is no unique identifier to directly map the records from different databases, text-based approaches can be applied. In this paper, a novel application of machine learning will be investigated to integrate data sources of governmental records and census, employing text-based learning. Additionally, three new methods of machine learning classification algorithms are proposed.
A simulation study has been performed to evaluate the robustness of methods in terms of the degree of duplication and purity of the texts. Due to the limitation of the R programming environment on big data sets, all programming has been successfully implemented on SAS (Statistical analysis system) software.
Introduction
In most official surveys, there exist many open-ended questions such as occupation, job industry, education level, disease history, etc. Such information is required to be manually coded into thousands of categories, a time-consuming and costly task. More recently, machine learning (ML) approaches have been employed in which a model is trained on manually coded training data and is then used to predict the most probable code for new data [1]. Among these tasks, address matching is increasingly required for a wide range of applications, particularly in official statistics [2]. We want to extend machine learning approaches to address matching by predicting the most probable unique identifier address for a new text-based postal address.
Finding several registers to the same entity may be easy if the identification number corresponding to each entity is the same for all registers. However, this rarely happens. For instance, in Iran, 10-digit postal codes produced by the National Post Company of the Islamic Republic of Iran are the unique identifiers of housing units and the 19-digit statistical addresses provided by the Statistical Center of Iran are the unique identifiers of census blocks and villages. In the absence of unique identifiers to directly join records, practitioners often rely on text-based approaches in order to match text-based addresses. The main purpose and basic challenge is to link the database of the National Post Company of the Islamic Republic of Iran, which contains the 10-digit postal code (list frame) and text-based postal address of all places to the 19-digit statistical addresses of the statistical center of Iran which is an area frame. This linkage establishes a link between register-based census and traditional censuses and provides time-series census information. This is a many-to-one relationship in which each statistical address includes multiple postal addresses. For more explanation, Fig. 1 in Section 3 shows this relationship.
In accordance with the world modernization of statistical systems, the move towards replacing traditional censuses with register-based censuses has been intensified and statistics organizations are now looking more at secondary data sources. In this new condition, the processing of some secondary data sources including administrative sources, big data, etc. is steering statistics organizations to look into opportunities offered by machine learning techniques. As a result of the rising demand for further appropriate, timely, comprehensive, and accessible statistical information as well as data services that are reliable in making evident and effectual data-managed policy decisions, statistics organizations are questioned for their responsibility. Moreover, statistics organizations are compelled to accomplish these goals in an extremely capable manner through current budget amounts. They are also in the challenge of the growing amount of data available in a wide variety of sources, formats, and quality levels. Therefore, interest in the use of ML for official statistics is rapidly growing and the High-Level Group for the Modernization of Official Statistics (HLG-MOS) is exploring and developing application of ML techniques to add value (relevance, timeliness, quality, and efficiency) to the production of official statistics [3, 4]. Consequently, ML can enable statistics organizations to produce improved information more quickly and use less of the available resources.
In the register-based censuses, all important geographical information, including geographical maps, lists of blocks, places, households, population, and housing, along with their attributes, are obtained from official government-based records. Therefore, it is important to establish a link between the register-based census and traditional censuses to provide time-series census information. Such a link can be considered for different levels of country divisions, from larger geographical areas such as provinces and cities to smaller levels such as blocks and villages.
Along with other developing countries, Iran has decided to implement a register-based census in the coming years. Accordingly, producing a time series of register-based census results at the smallest possible geographical levels requires finding a link between the register-based census and traditional censuses. In other words, blocks and villages need to be aligned on two data sets to allow time series to be set at the smallest geographic levels. Besides, since the maps used in administrative sources may not be sufficiently accurate, evaluating the quality of the maps and their level of accuracy is crucial. A high-quality map leads to a possible matching process between new maps and the older maps used in the previous census. Map matching is based on matching the boundaries of blocks and villages on the map. This is a very time-consuming and cumbersome task, particularly, when there are some mismatching areas on both maps which requires a further field of investigation.
The main administrative records in the National Post Company of the Islamic Republic of Iran are the 10-digit postal codes for every housing unit along with their map information. In other words, for each 10-digit postal code in the National Post Company of the Islamic Republic of Iran dataset, a corresponding block number and postal address are linked. Also, the statistical address of each block and village for the Statistical Center of Iran are their unique identifiers. Every block and village in every new census has a unique identifier code in the database of statistics organizations which is linked to previous censuses. As previously mentioned, in Iran, these identifier codes are called statistical addresses. In the National Post Company of the Islamic Republic of Iran database, every 10-digit postcode, block, or district, is associated with a postal address. Having these features, if we can manage to relate the existing postal codes in the National Post Company of the Islamic Republic of Iran with the statistical addresses in the Statistics Center database, the expected linking procedure between register-based census and traditional censuses can be accomplished at the level of block and village.
According to the endorsement of the Geocoded National Address File (GNAF) ordinance in 2015 by Iran, the scheme of geocoding the 10-digit postal codes was included in the schedule of the National Post Company of the Islamic Republic of Iran. The time-intensive process of geocoding the postal codes (adding a geocode or the latitude and longitude to the postal code) lasted until the end of 2018, encompassing 78 major cities among almost 1245 cities. These cities constitute around 60% of the urban population. In accordance with geocoding 10-digit postal codes, the linkage of the mentioned postal codes to the corresponding statistical addresses can be accomplished accurately. The Statistical Center of Iran has already mapped most of the geocode postal codes to their statistical addresses in the urban area (almost 82% of the 60% geocode postal codes) based on the latitude and longitude of each location. However, the rest of the geocode postal codes could not be mapped to their statistical addresses for various reasons including erroneous data or failure to record the latitude and longitude of postal codes which required field operations. This field operation would be time-consuming and also a costly task.
Since the end of 2018, almost 82% of the geocode postal codes that were associated with a postal address, have already been linked to the statistical addresses, so it would be possible to apply the machine learning methods to link the statistical addresses with the corresponding geocode postal codes for the remaining 18% of the unlinked information. It should be mentioned that there must be a few measurement errors in 82% of geocode postal codes that are already linked, which are unavoidable. In this situation, 82% of the text postal addresses that are linked to the statistical addresses (classes) can be considered as a predefined dictionary. Then, we use this predefined dictionary to train and test data sets and use a machine learning classification approach to predict the most probable statistical address for a new postal address (unlinked information) which is defined as a text.
In text mining techniques, the text turns into numerical variables and then it is analyzed with statistical techniques [5, 6]. In our application, we create a unigram or one-gram variable for each word that occurs in any of the postal addresses, using text mining methodology. These unigram variables either record the number of times or weight of each term that occurs in a postal address or the presence or absence of the word in the given postal address [7, 8]. Since the number of unigram variables can be very large, machine learning methods are widely used, playing an essential role in the analysis.
In this paper, the purpose of coding is to match a code (statistical address) to a postal address that is linked to a postal code, to establish a link between register-based census and traditional censuses, and ultimately, to provide time-series census information. In this research, we evaluate seven coding techniques with three new techniques (combining duplicate approaches for different
The remainder of this article is organized as follows: Section 2 reviews the workflow and provides the required background information on approaches to automated coding and address matching in official statistics. In Section 3, an application of linking postal addresses to statistical addresses using machine learning classification algorithms [9] and a text-mining approach will be explained. In Section 4, we evaluate the outcome of the discussed approaches for two major cities of Qom and Zanjan in Iran. In Section 5, a simulation study has been conducted in Zanjan city to compare the robustness of the methods for different values of duplicates and the purity of the texts. Section 6 provides the concluding remarks.
Applications of machine learning in official statistics
Machine learning refers to a set of tools and techniques for modeling and understanding complex datasets [10]. Most machine learning problems fall into one of two categories, supervised and unsupervised learning. Supervised machine learning involves building a statistical model for predicting or estimating an output, based on one or more inputs. Many classical machine learning methods related to classification and regression, operate in the supervised learning domain. In contrast, with unsupervised machine learning, there are inputs but no supervising output; In this case, we can seek to understand the relationships between the variables or between the observations. One of the machine learning tools in unsupervised learning is clustering [11].
One of the classical applications of machine learning in the development of official statistics is to classify and code data into standard classes such as industry, geography, commodities, etc. An automated occupation coding process, an automated postal address coding with statistical address, and automated coding of open-ended questions are examples of important tasks in official statistics, which refers to coding a respondent’s text answer into one of many hundreds of codes [1, 12, 13, 14]. Among different learning algorithms for automatic categorization, some of them including support vector machines, duplicate-based approach, modified nearest neighbor approach, and combining models [1] have been widely applied.
Supervised learning could be also used for the imputation of missing data, prediction of response propensities, construction of homogeneous groups for imputation or statistical matching, reweighting, and calibration [15, 16]. With the requirement of modernizing the statistical system of countries, it is necessary to use machine learning methods in the process of producing official statistics for primary and secondary data analysis.
Many machine learning algorithms such as decision trees, random forests, neural networks [17], cluster methods, natural language processing, and SVM are often used for classification, identification, clustering, dimension reduction, and imputation [11]. Before choosing an appropriate ML technique and the application domain (regression, classification, clustering, etc.), it is important to know the statistical areas (e.g. household and business statistics) and the application requirements (e.g. record linkage, coding, outlier detection, disclosure control, imputation, identification, etc.).
As previously mentioned, ML approaches are applicable in linkage or matching multisource statistics (administrative or big data sources) [18, 19] for different applications such as construction sampling frames or register-based census. Increasing demands for timely prepared and qualified data and the statistics applied in evidence-based decision-making and development planning calls for new approaches in official statistics. Integrating data from different surveys is a convenient procedure to achieve more comprehensive sources of data. There are different techniques such as Record Linkage (RL), Statistical Up (Down) scaling (SUS, SDS), and Statistical Matching (SM) for integrating data sources [4, 20, 21]. These methods rely on comparisons of a set of variables available in both or more data sources. In record linkage, couples of records in different data sources are referred to the same entity (e.g. person, household, farm, business). Therefore, this method is applied to match equal observations collected in different data sets or to identify duplicated records in data sets where unique identifiers are unavailable. Statistical up (down) scaling has been developed in the research fields with the aim of adapting data collected at different aggregate levels to enlarge or narrow the information [4]. However, statistical matching which is also called data fusion or synthetic matching, allows us to impute information in one data set defined as the “recipient” from one or more other data sets defined as “donor(s)” [21, 22]. In this method, couples of records in different data sources (usually samples) are referred to the same target population.
More recently, record linkage has been percolated in machine learning [23, 24, 25]. Comber and Arribas-Bel [24] introduce two recent developments in text-based machine learning including conditional random fields and word (address) embedding in address matching. Abramitzky et al., [25] evaluate different automated methods for linking historical data. Recent advances in machine learning have been extensively used by many researchers in record linkage [26, 27, 28]; therefore, the address matching plays an essential role in the applications of machine learning in record linkage. Elfeky et al. [29]also developed an interactive record linkage toolbox with a machine learning approach and Feigenbaum [30] used machine learning approach to census record linkage.
Therefore, another application of machine learning methods is integrating data from different data sources in the process of producing official statistics. The traditional census is still contemplated as one of the main sources of official statistics. However, due to the high cost of conducting traditional census, as well as respondent burden, it may not be possible to collect all variables of interest in a data set. To obtain a more comprehensive source of data, one possible way is to integrate available data from different data sets such as already existing data, administrative registers, and official surveys. This helps to minimize the shortcomings of each survey and to maximize their advantages. Also, statistical matching and record linkage using machine learning algorithms can be used to reduce the computational complexity of comparison records among different data sets.
Examples of urban blocks in Iran.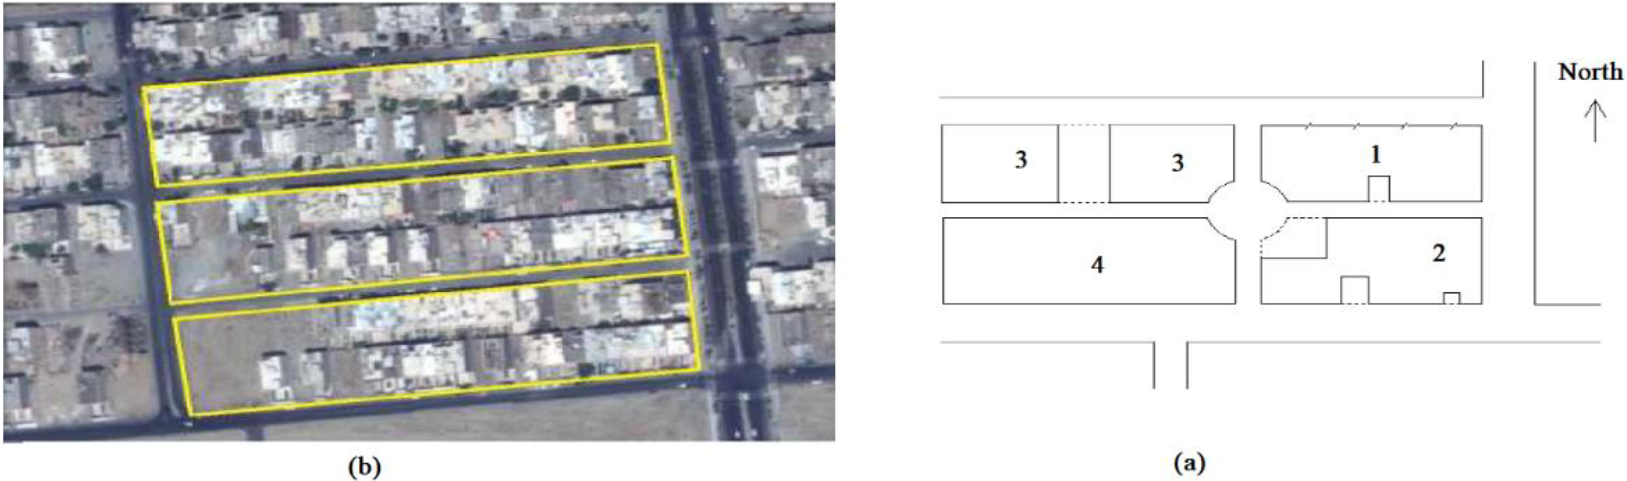
In this paper, an application of linking postal addresses to statistical addresses using machine learning classification algorithms and a text-mining approach will be explained in the next section.
Integrating or linking data from different sources in order to merge all records related to the same entity, (such as geographical maps and households) is an important task in official statistics. If no identifier code is available in all data sources, sometimes probabilistic record linkage using other information that the sources have in common on the same entities [31] are used. Also, sometimes, the linkage should be performed using the available identifying attributes such as postal addresses. For instance, in Iran, postal codes by the National Post Company of the Islamic Republic of Iran are unique identifiers for housing units and the 19-digit statistical addresses by the Statistical Center of Iran are unique identifiers for every block and village. Also, each statistical address has multiple postal addresses (this is a many-to-one relationship). In the absence of a unique identifier code to join records, there are different methods such as probabilistic record linkage or decomposition of a postal address to
In Fig. 1(a) the census blocks and villages that have 19-digit statistical addresses, are often marked up by a solid line and in some cases with dashed lines. The notion of a block is a collection of interconnected-joined buildings (or lands and interconnected-interdependent buildings) restricted from all sides to the public passages (alley, square, street, etc.). To determine the blocks in each enumeration area, a specific number has been allocated to each block. In each enumeration area, this number begins from 1 and continues-persists to the last remaining blocks of the same domain, respectively. In the same manner, the yellow line in Fig. 1(b) is also census blocks and villages. All housing units in each block have a 10-digit postal code. In this situation, our objective is to link all housing units that are associated with the 10-digit postal code (register-based system) to a statistical address (yellow line in Fig. 1b) on the statistics center database (traditional system) at the level of block and village.
An example of (a) 10-digit postal code components and (b) 19-digit statistical address components.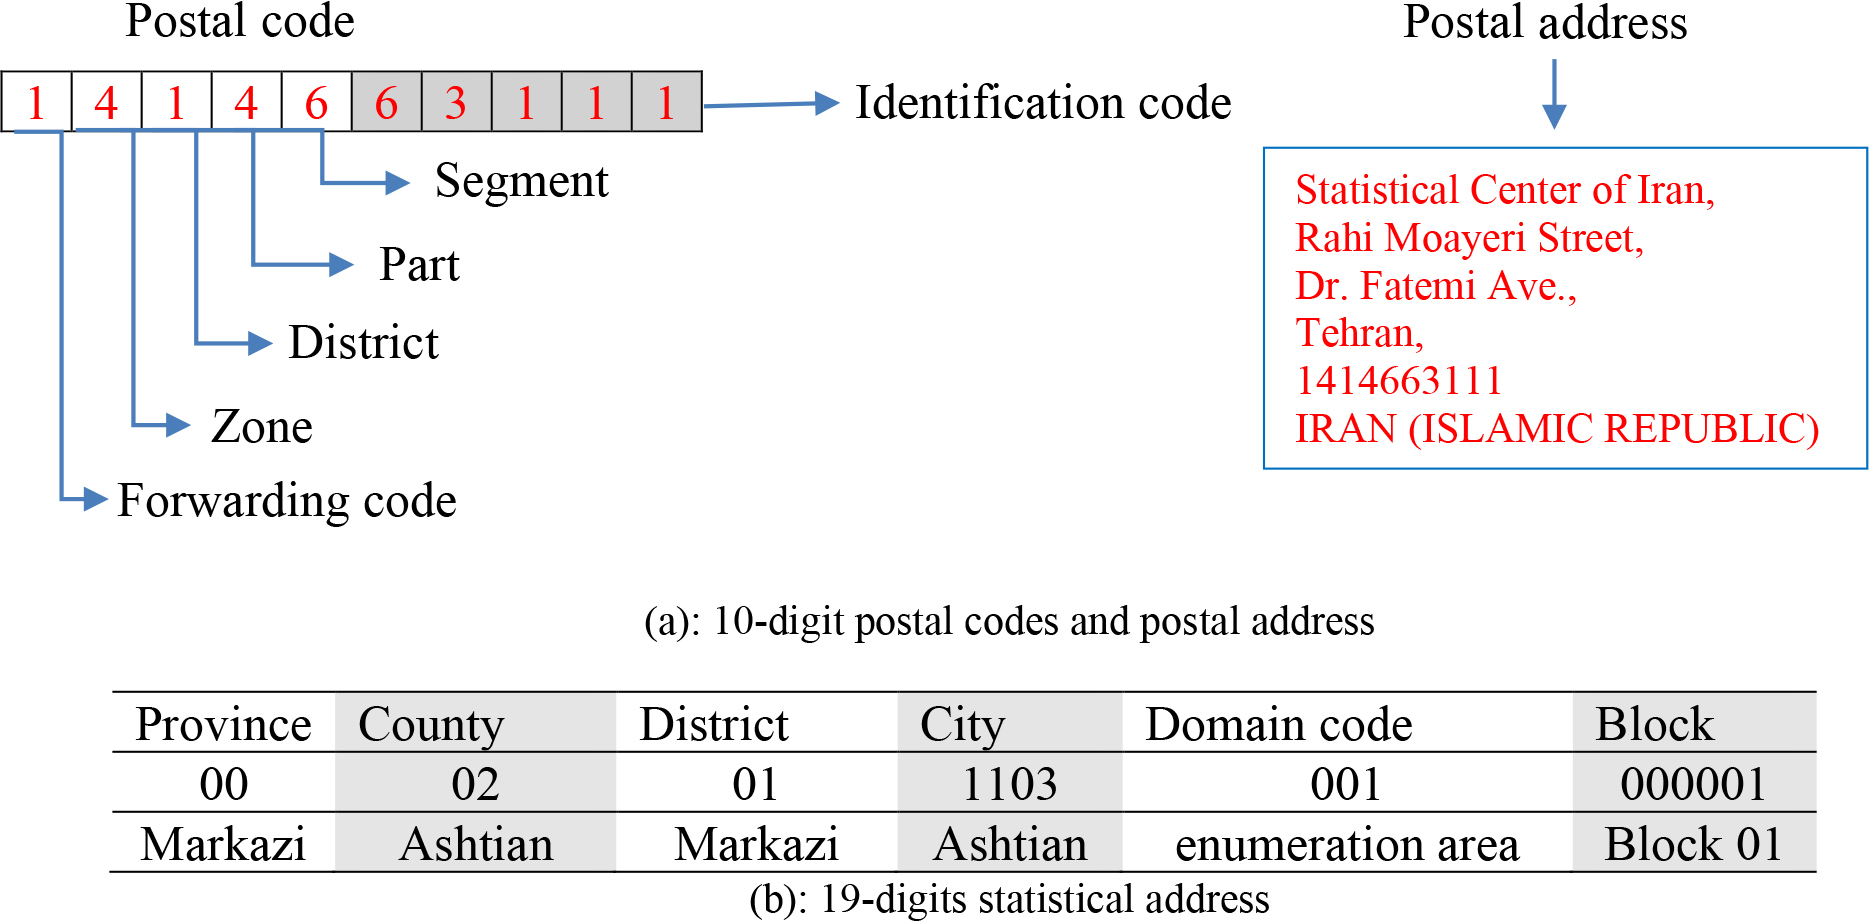
The nature of the identifiers such as postal ZIP code used in administrative record, has an important implication in statistical purposes. Also, the statistical address identifier which is used in the statistical center contains information about the characteristics of the geographic location. To make postcode systems more analytically useful, some postal authorities have added a geocode to the most local level of the postal code. National Post Company of the Islamic Republic of Iran has recorded the latitude and longitude of all postal codes in the metropolitan and major cities of Iran. The combined coded information is called geocoded postal codes or geocodes for short. The Statistical Center of Iran has already linked most of the postal codes to their statistical addresses based on the latitude and longitude of each location in urban areas. Since in urban areas, postal codes are linked to statistical addresses for about 82% of the data, it was possible to use machine learning methods to link postal codes (postal addresses) to statistical addresses of other unlinked information. This is done in a way that a percentage of the linked files is selected as the training file which contains the statistical addresses of all 10-digit postal codes; then statistical models learn from already classified training data and the method used in machine learning extracts the relationship between statistical address and postal address as a model. This is done by decomposition of a postal address to
In this section, seven text-based machine learning techniques are evaluated on the collected data from Qom and Zanjan cities for integrating data sources of governmental records and census. The data sets for these two cities include three variables: postal code, postal address, and statistical address. The postal address consists of different attributes including district name, current street (avenue, drive) name, and previous street (avenue, drive) name. The statistical address is a 19-digit number starting with two digits for the province, followed by two digits for the county code in the province, two digits for the district code in the county code, four digits for the city code, three digits for the domain code in the city code, and the last six digits for block code in the enumeration area. It is important to note that each block corresponds to a unique 19-digit statistical address. Also, postal codes in Iran consist of 10 numbers. The first digit represents the forwarding code. The second digit represents the zone. The third, fourth, and fifth digits represent district, part, and segment, respectively; and the last five digits stand for the identification code. In Fig. 2, an example of 10-digit postal code components and postal address (a) and 19-digit statistical address components (b) are presented.
In Table 1, the number of blocks (19-digit statistical address) and enumeration area (13-digit statistical address) in Qom and Zanjan cities are presented. This information will be used in the automated address matching based on machine learning in a later subsection. Table 1 also indicates the number of records linked between postal addresses and statistical addresses for units, flats, or apartments in Qom and Zanjan cities. With the involvement of the Statistical Center of Iran, about 76% of the 10-digit postal codes of Qom city, as well as 68% of the 10-digit postal codes of Zanjan city, were linked to their related statistical addresses (blocks) based on postal geocodes till the end of 2018. As previously mentioned, the rest of the postal addresses that could not be linked to their statistical addresses require field operations which is time-consuming and a high-priced task. In these situations, the implementation of machine learning methods can be expressed as a reasonable trajectory. Since unlinked records in the same block, have a similar postal address as the linked records, a specific model can be defined on linked records, applying a machine learning classification approach. This model can then be utilized to predict the most probable code or statistical address regarding each of the new or unlinked postal addresses.
The number of records (unit) with and without linkage between the postal address (for each unit) and the statistical address (for each block) and the number of blocks and enumeration area
Turning text (postal address) into unigrams: Document-Term Matrix (DTM). The unigram variables contain 1 if the word is present in the record (postal address) and 0 otherwise
In this paper, we use machine learning classification methods to link postal addresses to 19-digit statistical addresses of other unlinked information (for approximately 24% of units in Qom and 32% of the units in Zanjan). To justify this problem, semi-automated classification was used in which some easy-to-code records were automatically classified by a learning model and the others were left for manual classification which is costly. By implementing semi-automated classification, lots of financial resources can be saved, using the machine learning approaches.
Before we start automated address matching, all the postal addresses should be brought into a proper form using Persian text preprocessing (normalization). In the following subsections, we explain the string preprocessing of postal addresses. The automated address matching based on machine learning will be presented subsequently.
In address matching, text mining implies the process of creating unigram variables in order to count the frequency, presence, or absence of the words in the given postal address. The steps followed in the address-matching analysis are as follows.
Persian text preprocessing (Normalization and Tokenization) String preprocessing can often have a significant impact on the performance of the classification algorithms. The steps that are carried out in the preprocessing of data are stop-word removal, punctuation removal, space correction, spelling correction, etc. Also, the existence of different character encodings for similar letters in text documents is one of the issues in Persian text processing. Since Persian and Arabic scripts have almost the same character encoding for similar letters, there exist a few stylistic disparities when it comes to some of the letters such as “ Creating document-term matrix (DTM) Creating the document term matrix (DTM) of the corpus is the main step in the analysis. It includes the decomposition of a postal address to Training and testing machine learning classifier After turning the text (postal address) into numerical variables, the machine learning classifier should be chosen for address matching. In this step, statistical models will be learned from classified training data. This is done in a way that a percentage of the linked files is selected as the training file. In Table 3, the training file contains the statistical addresses as the response variable levels (classes) and
 ” (ye) and “
 ” (kaf). Some of the Persian text may include both Persian and Arabic Unicode encodings. Therefore, we were required to use a text normalization procedure to convert Persian letters of different shapes into the same letter (for example, converting the letters “
 ” and “
 ” (Arabic ye) to the Persian ye “
 ”.
”.
Document-Term Matrix (DTM) in train data
Document-Term Matrix (DTM) in train data
Number of training duplicates having a statistical address
This section provides an overview of seven methods corresponding to automated address matching and evaluates the performance of these approaches. In this paper, we have used three techniques proposed by Gweon et al. [1] in a new application, i.e. linking postal address to statistical address (in Persian scripts), as an automated coding. The above-mentioned three methods include a duplicate method, combining duplicate and machine learning approaches (we call it as Hybrid 1 approach), and linear support vector machines approach. Nonlinear SVM, combining duplicate-based approaches for different levels of aggregation, and combining duplicate-based approach with a nonlinear SVM (called Hybrid 2 approach) and also the maximum probability of duplicate-based approach and machine learning are proposed for linking postal address to statistical address. For each method, the predicted statistical address is the statistical address that has the highest score. In the following paragraphs, we explain the application of seven methods for address matching, based on machine learning in national and international statistical institutions:
Duplicate-based approach Linear support vector machines Nonlinear polynomial kernel support vector machines (P-SVM) Combination of duplicate-based approaches for different Combination of duplicate-based approach with linear SVM (Hybrid 1) Combination of duplicate-based approach with nonlinear polynomial kernel SVM (Hybrid 2) The maximum probability of duplicate-based approach and machine learning (Max (Dup-SVM))
Different definitions of duplicates based on
Due to the large DTM (containing 798,129 rows and 6,064 columns for Qom city), it was not possible to use R software for data analysis even with a high volume of RAM (Random access memory) and massive hard drive storage. Therefore, SAS software was used to automatically analyze the statistical address of each postal address (postcode). Table 3 is a DTM of train data which contains
Generally, in each row of Table 4,
where
For each test record, the statistical address with the highest probability is chosen as the predicted statistical address. If the probability is the same for two or more statistical addresses, one of the statistical addresses is selected at random. In the context of our implementation, due to the resemblance of the postal address of housing units in each block, if the number of postal addresses linked to the 19-digit statistical address in line with each block was prominent, accordingly the number of repetitions in the training data set can take place many times. Therefore, the proposed methodology performs well based on satisfactory outcomes.
Support vector machines
In our application, linear and nonlinear polynomial kernel support vector machines [32] were chosen for machine learning approaches. In this method, the response variable becomes a binary variable. Although in our example, the number of response variable levels (statistical address) is greater than 2, a binary variable was created for each level of this variable. The value of this variable is equal to 1 for records in the corresponding level and 0 for other records (method one against the other). All binary unigram variables (words) in Table 2, which indicate the presence or absence of the word in the respective postal address, are employed as features in the classification for an SVM classifier. Besides, since it was not possible to run this method on all records simultaneously (due to the need for too much memory), this analysis was performed separately for each postal patrol. Postal patrol is the first 5 digits of the postal code. In other words, to reduce the possibly very large number of pairs of records that need to be compared, indexing techniques are applied [33] in SVM methods. These techniques filter out record pairs that are very unlikely to correspond to matches. When SVM is performed separately for each postal patrol, it means that the SVM is performed in a homogeneous class. Therefore, it is a guarantee that the statistical address is linked to the relevant postal address of the patrol or the relevant geographical area. For each of the response variables at the patrol level, the assigned probability to this level of the response variable (corresponding binary variable) is estimated using the hierarchical probabilistic support vector machine (HPSVM) method [34]. The statistical address with the highest probability is then chosen as the predicted statistical address. Same as the duplicate method, if the probability is the same for two or more statistical addresses, one of the statistical addresses is selected at random.
Combination of duplicate-based approaches for different
-digit level
Postal addresses and statistical addresses have a hierarchical structure. We propose to apply the duplicate method separately to the 19-digit statistical address (named blocks) and to the first 13 digits of the statistical address (named domain or census enumeration area), and to combine the probabilities as explained in the following paragraphs. The last 6 digits of the 19-digit statistical address represent blocks in each census enumeration area.
As mentioned in Table 1, since the number of statistical addresses with the 19-digit level is more than the higher geographical levels (13-digit level), the number of observations at the 19-digit level is sparser compared with the 13-digit level. If the classification from the 19-digit classifier result is in a near tie of statistical address with different 13-digit geographical levels, the classification from the 13-digit classifier may correct the classification of the 19-digit statistical address. Then, for each test record, the mean probability of the assignment to the 19-digit statistical address and the probability of assignment to the corresponding enumeration area are considered as the probability of assignment to that 19-digit statistical address. Thereafter, based on these new probabilities, the statistical address of the desired record is estimated.
Suppose that 19-digit statistical address
A hybrid approach
The hybrid approach proposed by Gweon et al., [1] combines two duplicate and linear SVM approaches which have a good performance in text categorization [8]. This approach is desirable and has more achievement than duplicate or SVM, in the situation by which for every postal address in the test data set, there is an equal probability (a tie) among different duplicate statistical addresses. With more records including this property in the test data set, the better performance of this method will be shown. Let
In this method, the weighted average of the probability assigned to a particular statistical address is derived from the two methods. If there are no duplicates (
In this paper, in a hybrid manner, we use two SVM approaches including linear SVM (Hybrid 1) and nonlinear SVM with the polynomial kernel (Hybrid 2).
The maximum probability of duplication method and the svm method
In this method, the maximum probability of duplication and the SVM method (Max (Dup-SVM)) is considered as the probability assigned to that statistical address and based on that, the statistical address is estimated. For this combined approach the combined score
When there is an equal probability among duplication and the SVM method, the performances of this method will be acceptable. In this situation, the postal address related to the method with maximum probability will be chosen.
Results
Comparison of different methods for address matching. Methods include duplicate method, linear SVM (SVM), nonlinear polynomial kernel SVM (P-SVM), duplicate from two models at different 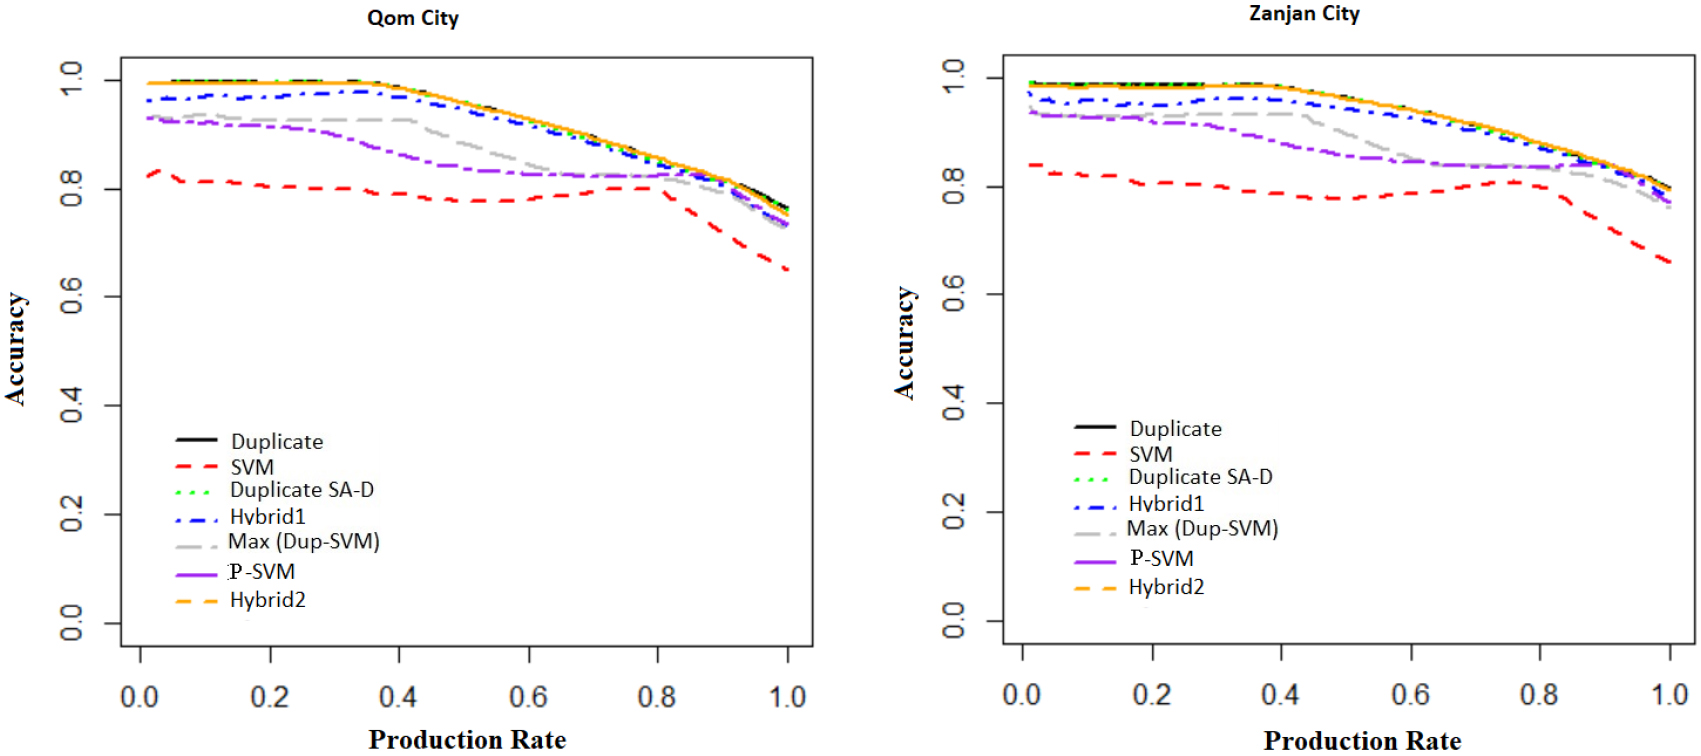
In this section, we compare the accuracy by different production rates for the proposed methods (duplicate-13/19digit, hybrid approach which combines two duplicate and nonlinear SVM (Hybrid 2) and Max (Dup-SVM)) and default methods (duplicate, linear SVM and hybrid method (Hybrid 1)) for Zanjan city. When some postal address texts are coded automatically and some are coded manually, a score is needed to distinguish between hard-to-code and easy-to-code answers. It needs to determine a threshold as a trade-off between accuracy and production rate for different methods. The production rate is the proportion of observations that can be coded automatically. For a given production rate, accuracy is the proportion of codes that are coded correctly.
In Fig. 3, the duplicate method refers to assigning the statistical address of unigram duplicates (or a random statistical address for no duplication) and the SVM refers to statistical learning model based on the statistical address in each Postal Patrol. P-SVM refers to nonlinear polynomial kernel support vector machines based on the statistical address in each Postal Patrol. The duplicate SA-D refers to a duplicate method for 19-digits (SA: statistical address) and 13-digits (D: domain) which is based on averaged probability from a separate duplicate method for 19-digit (blocks) and 13-digit (domain). As previously mentioned, if classification from a 19-digit classifier results in a near tie of statistical address with different 13-digit geographical levels, classification from the 13-digit classifier may correct the classification of 19-digit statistical address. Figure 3 shows the accuracy of different methods based on the production rate. For production rate more than 0.5, Hybrid 2 is the best approach for Zanjan city data. The duplicate and duplicate SA-D methods perform equal to or better than another next best method, i.e. the Hybrid 1. Also, linear SVM is not a good method in comparison to other methods in this application. Max (Dup-SVM) and P-SVM are good methods for production rate more than 0.9. Similar results have been obtained for the Qom city. Contrary to Joachims’ opinion [8] that applied SVM with a linear kernel in text categorization, we show that in address matching, nonlinear SVM performs better than linear SVM.
A production rate of 100% corresponds to making a linkage between postal codes and statistical addresses automatically. At full automation, Hybrid 2 is the best approach for Zanjan city. Also, duplicate SA-D, duplicate and P-SVM methods perform equally well in Qom and Zanjan cities. At full automation, linear SVM has resulted as the worst method with an accuracy rate of 65% in Qom and 66% in Zanjan cities, respectively. Max (Dup-SVM) and hybrid1 methods have an accuracy of 72% and 73%, respectively for Qom and 76% and 78%, for Zanjan. At full automation, the duplicate SA-D, duplicate and hybrid2 methods have increased the accuracy to 80% in Zanjan. Figure 3 also shows that duplicate SA-D and duplicate accuracy remained at around 100% up to a production rate of about 0.40. The performances of duplicate SA-D and duplicate were similar for fully automated address matching also at low-medium production rates.
Figure 3 also demonstrates postal addresses which should be classified automatically and those that need to be classified by field operation. For example, if a 90% accuracy is required, then Fig. 3 suggests that 74% of the postal address can be classified (linked to statistical address) automatically with the duplicate SA-D, duplicate and hybrid2 method, 70% with hybrid1 method and 50% with the Max (Dup-SVM) method in Zanjan city. In Qom city, if the 90% accuracy is required, then Fig. 3 suggests that 68% of the data can be classified automatically with the duplicate SA-D and duplicate, 64% with the hybrid1 method. Figure 3 also shows the SVM accuracy remained at around 80% up to a production rate of about 0.80.
Tables 5 and 6 show the accuracy of seven methods with a training size of 70% by probabilities of assignment of postcodes to statistical address in Qom and Zanjan cities, respectively. In Qom, the statistical address assigned to a postal address with probability 1 in duplicate SA-D, duplicate and hybrid2, leads to an accuracy of 0.99. In Zanjan, this probability leads to the accuracy of 0.98. The experimental results show that around 36% of the test data for Zanjan and 34% of the test data for Qom, with a probability of 1, had the correct assignment of the statistical address to the postal address.
Accuracy of five methods for test data in Qom city with a size of the training data 70% by the probability of assignment of postcode to statistical address
Accuracy of seven methods for test data in Zanjan city with a size of the training data 70% by the probability of assignment of postcode to statistical address
Accuracy of the duplicate method for test data in Qom city with different sizes of the training data 70%, 80%, 85% and 90% by the probability of assignment of postcode to statistical address
Comparison of the accuracy of test data in Zanjan city as a function of production rate for different methods on a reduced data set by reducing 20% duplicates and three increased data sets by increasing 10%, 30% and 50% duplicates.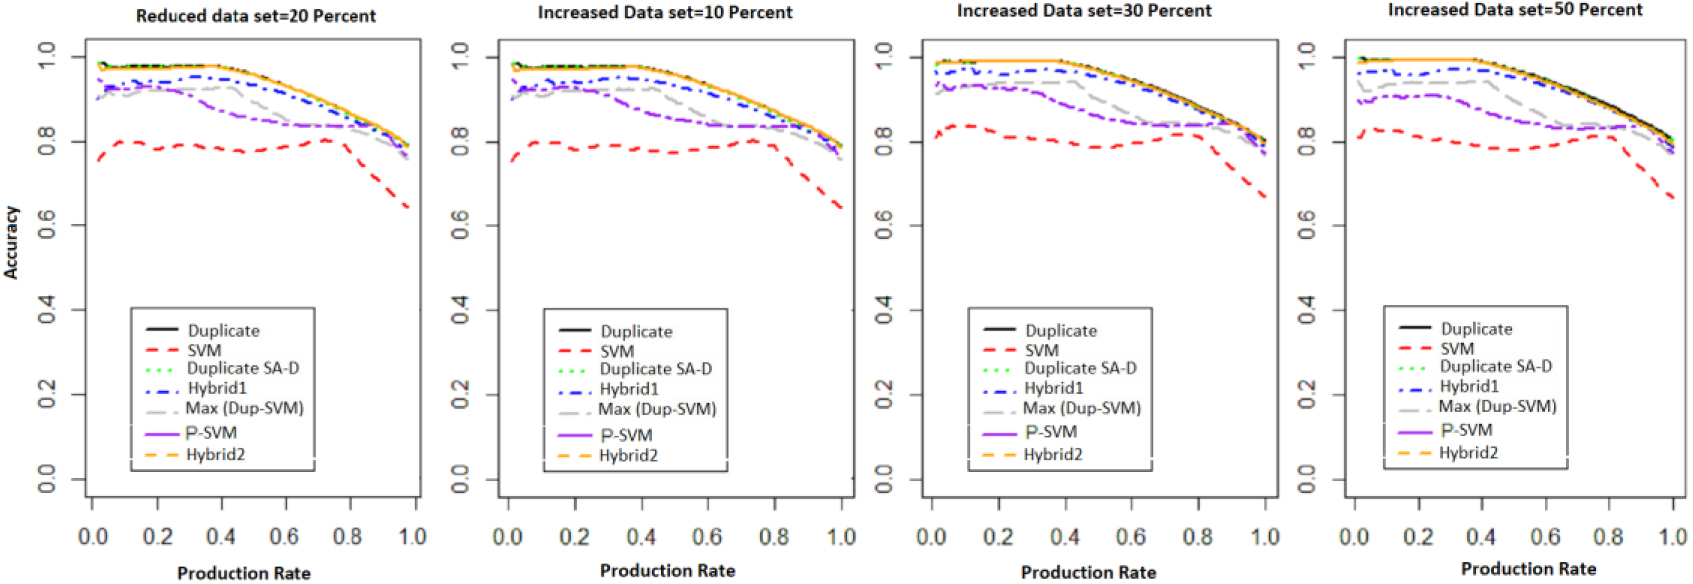
Although at full automation, duplicate SA-D, duplicate and hybrid2 methods increase the accuracy to 80% in Zanjan and 76% in Qom and the three mentioned methods has the same accuracy, but the results show that around 67% of the test data for Zanjan and 62% of the test data for Qom had the correct assignment of the statistical address to the postal address, with a probability of at least 80% in the duplicate SA-D method. Also, for Max (Dup-SVM), around 63% of the test data for Qom and 65% of the test data for Zanjan had the correct assignment, with a probability of at least 80%. While in the duplicate method, around 57% of the test data for Zanjan and 51% of the test data for Qom, and for Hybrid 2, around 51% and 57% of the test data for Qom and Zanjan, had the true address matching with a probability of at least 80%, respectively. Therefore, duplicate SA-D and Max (Dup-SVM) rather than duplicate and hybrid2 methods cover larger proportion of test data with true address matching for high detection rates.
Table 7 shows the accuracy of the duplicate method based on the test data in Qom city with different sizes of the training data 70%, 80%, 85%and 90%. In addition, the accuracy is reported by the probability of assignment of postcode to statistical address. The results show that there is no difference in the accuracy of the duplicate method for different size of the training data.
Accuracy of different methods for test data in Zanjan city for decreased data with a 20% reduction in duplicate records and three increased data with a 10%, 30% and 50% increase in duplicate records in the data set
Comparison of the accuracy of test data as a function of production rate for different methods on less clean text data with 50 and 100 noise variables added to the Zanjan city data.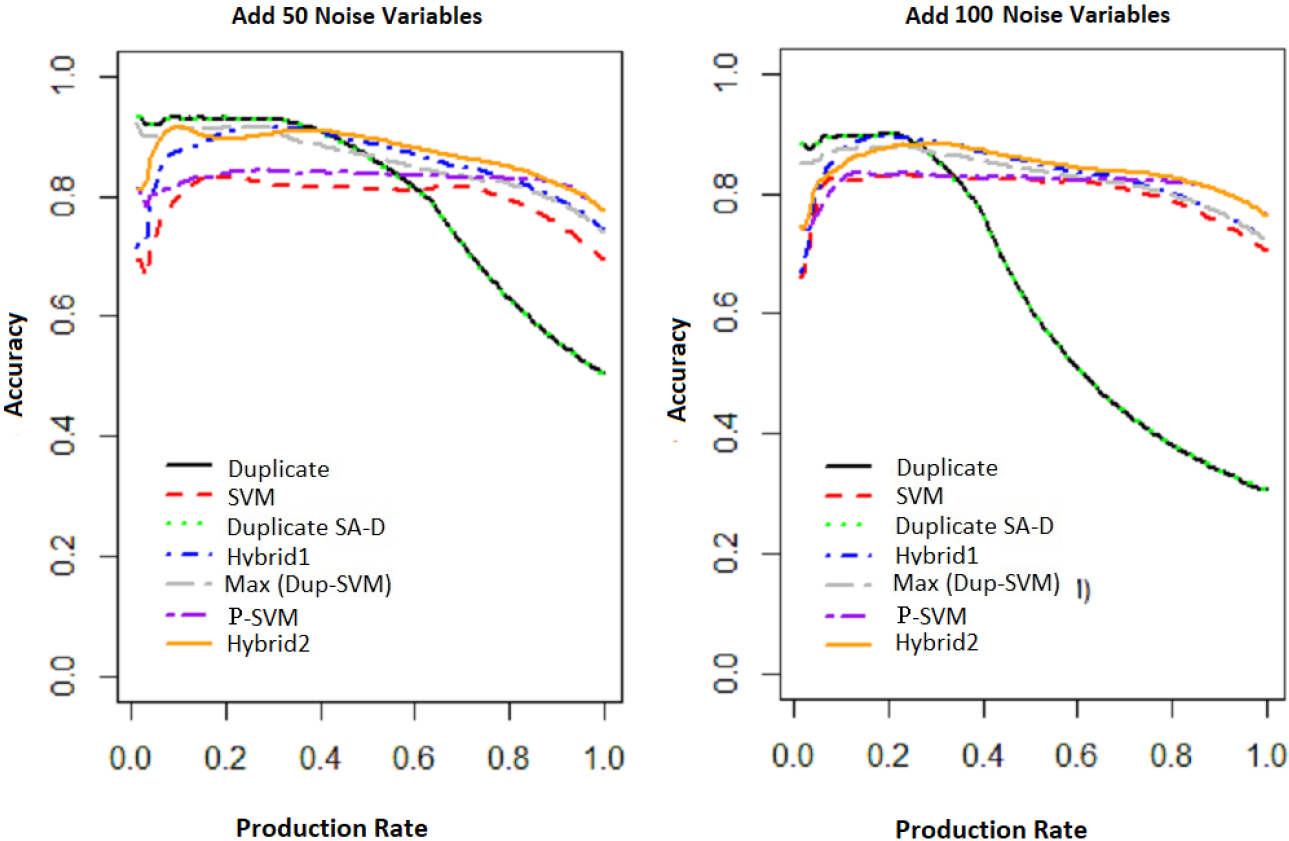
The purpose of this section is to show how well the proposed address matching methods are sensitive or robust to the less clean text or more or less duplicate data sets in the predefined dictionary. Since postal addresses are written by survey officers with different handwriting and postal addresses stored in the national statistical centers have noisy words, some simulations have been performed to evaluate the performance of proposed methods in the presence of more noise variables (words) in the postal address. In this section, some simulations have been performed on the Zanjan city data. In fact, by increasing or decreasing the rows and columns of the document term matrix (DTM), which leads to building a data set with more or less duplicates and with less clean text, we will evaluate the robustness of the results.
Accuracy of different methods for test data in Zanjan city on a less clean text data with 50 and 100 noise variables in the data set
Accuracy of different methods for test data in Zanjan city on a less clean text data with 50 and 100 noise variables in the data set
At first, we simulate four data sets with fewer and more duplicates than usual. To simulate a data set with fewer duplicates, a random subset of duplicate records was removed. Therefore, a reduced simulated data set was created with fewer duplicates by reducing 20% duplicates of the data. The reduced data set contained 37,402 observations. To simulate a data set with more duplicates, a random subset of duplicate records was added so that in the increased data, only about ten, thirty, and fifty percent duplicates of the test records were added. Three more simulated data sets with more duplicates than usual related to 10%, 30% and 50% of duplicates of the test records contained 52,549, 62,362, and 72,156 observations. As mentioned before, due to the large size of Qom and Zanjan cities data, and the costly extraction time of the results, each of the seven methods discussed in this manuscript has been evaluated for Zanjan. The results of Fig. 4 and Table 8 show that the accuracy for all methods has not changed or decreased fundamentally. Also, in a situation where we are dealing with less or more duplicate data sets, three methods of duplicate, duplicate SA-D, and Hybrid 2 are still the best approaches for the Zanjan city data. The accuracy of the P-SVM method is increased more than SVM, but P-SVM does not increase the accuracy of hybrid 2 method fundamentally.
The second simulation involves building a data set with less clean text. We add 50 and 100 additional words that are not related to the postal address and are followed by a Bernoulli distribution with a probability of success of 0.01. This simulation decreased the number of duplicates. The results of Fig. 5 show that the accuracy of the duplicate and duplicate SA-D (combined) methods begins to decrease with a production rate of about 0.25 instead of about 0.45 for simulation with 100 additional noise variables. Also, the accuracy of these two methods begins to decrease with a production rate of about 0.35 instead of about 0.45 for simulation with 50 additional noise variables. In this case, the Hybrid 2, Hybrid and Max (Dup-SVM) methods outperform the other methods. Although the Max (Dup-SVM) method did not work well in Figs 3 and 4 but it outperformed the others when there were noise variables. The results of Table 9 show that by increasing the noise variables from 50 to 100, the accuracy of Duplicate and Duplicate SA-D methods have decreased fundamentally (0.50 to 0.31). Also, in a situation where we are dealing with less clean text data sets, two methods of Hybrid 2 and P-SVM have the most accuracy and these two methods with Hybrid 1 and Max (Dup-SVM) are still the best approaches for the Zanjan city data.
In this paper, we have investigated several approaches for automated mapping of the geocode postal codes to their statistical addresses for any desired production rate. This automated coding leads to address matching as an application for register-based census. By address matching, a link between register-based census and traditional censuses will be made leading to provide time series census information. Two methods of combining duplicate-based approaches for different levels of aggregation and combining duplicate-based approaches with a nonlinear support vector machines (SVM) are proposed as the two best-performing methods. Contrary to Joachims’ opinion [8] who reported that linear SVM approaches have a good performance in text categorization, we show that in address matching, the SVM approach has the worst performance and nonlinear SVM works better than the linear SVM.
In this paper, the outcome of the discussed approaches for two major cities of Qom and Zanjan in Iran were evaluated. The results in this application show that for example targeting 90% accuracy for the automated coding, the duplicate SA-D, duplicate and hybrid2 methods can be classified (linked to statistical address) to 74% of the postal address automatically. However, for the automated address matching, the hybrid1 and Max (Dup-SVM) methods can be classified to 70% and 56% of the postal address automatically, respectively in Zanjan city.
In general, in this application, we recommend the use of duplicate SA-D. The hybrid methods that include the SVM do equally as well, but they involve SVMs which are more complex. Also, duplicate SA-D does substantially better than duplicate by itself (19-digit level) and a polynomial SVM achieves a better performance compared with linear SVM on text data.
Also, some simulations have been performed to show how well the proposed address matching methods are sensitive or robust to less clean text or more or fewer duplicate data sets. The results show that for more or less duplicate data sets, the accuracy of all methods has not decreased fundamentally. Therefore, the robustness of the methods is confirmed. For less clean text data sets, the accuracy of the duplicate and duplicate SA-D methods has decreased fundamentally. However, the Hybrid 1, Hybrid 2, SVM, P-SVM and Max (Dup-SVM) methods have not decreased fundamentally and Hybrid 2 outperforms the other methods when there were noise variables.
In this paper, we have suggested new approaches to automated address matching leading to the link between the existing postal codes in the National Post Company of the Islamic Republic of Iran with the statistical addresses in the traditional census database. By address matching, a link between register-based census and traditional censuses will be made leading to provide time series census information. Such a link can be considered for different levels of country divisions, from larger geographical areas such as provinces and cities to smaller levels such as blocks and villages.
In summary, the coding and machine learning methods introduced in this manuscript can be applied to all coding activities in statistical centers around the world that were previously done manually. In other words, by using information encoded manually by coding experts in previous years and creating a dictionary of assigning codes to the specific texts, future coding activities can be performed automatically or semi-automatically using machine learning methods. For instance, the method presented in this article can be used to all coding activities in statistical centers to automatically classify and code the data into standard classes such as industry, geography, commodities, etc. An automated occupation coding process, an automated postal address coding with a unique address code and also an automated coding of open-ended questions are examples of important tasks in official statistics, which can be done with the methods presented in this article. By way of applying semi-automated classification, lots of financial resources can be saved, using the machine learning approaches.