
Abstract
The current measure of inflation in Kazakhstan presents several problems. This paper first illustrates the method and procedure currently followed and then proposes a new methodology to address the problems highlighted and calculate inflation at regional level. To this end, the weights of the different components of goods and services are calculated using cluster analysis. The results indicate that the regional weights for calculating inflation in Kazakhstan should be different from those currently used for the different products and services. The measurement of inflation can therefore be improved by adopting a different methodology for calculating its regional weights and by complying with international recommendations in terms of sampling design.
Introduction
Trust in official inflation indicators is essential to Kazakhstan’s domestic political, economic, and monetary policies.
The general objective of the paper is to verify whether the current measure of inflation is valid and whether the users (economists, academia, the public, etc.) have confidence in it, especially in light of international recommendations and the experiences of other countries. To this end, it is necessary to analyze in detail the methodology used in Kazakhstan for measuring inflation, identify any indicate points, and indicating what needs to be done to eliminate and/or minimize them. The current measurement of inflation at a regional level, regional consumer price indices (CPI), is not valid because these regional indices are calculated using consumption weights of the families at a national level, as it also happens in other countries. For this reason, the more specific objective of the paper is to estimate the weights of regional consumption to obtain the estimate of reliable regional CPI.
The low level of trust in legal documents and procedures for forming inflation came from the need for a clear and transparent methodology to form and calculate the CPI. Methodologically transparent procedures must positively impact the formulation of the official inflation rate and become the basis of public confidence in official statistics.
According to the analyzed data, at the end of 2022 and the beginning of 2023, the weighting scheme for calculating inflation indicators does not include regional disproportions in commodity groups; clear information about the sampling procedure for settlements included in the CPI needs to be available to the population.
Our hypothesis is that the Kazakhstani methodology for measuring official level of inflation is imperfect due to ignoring regional disparities, especially in regions with a high proportion of the rural population.
Clustering the population’s spending by region will make it possible to clarify the regional weight components, which in turn will increase the population’s confidence in official inflation. The typification of inflation by type of location and the refinement of the methodology for calculating inflation in terms of the number of price quotations will increase the transparency of calculating price changes.
Clustering the regions in terms of household spending and increasing the transparency of the methodology for calculating inflation in Kazakhstan will allow interested government agencies to know the actual prices in the regions, and the population to trust in official data.
The paper is therefore organized in the following way. In paragraph 2, we start (2.1) with a general discussion of the importance of ensuring public trust in inflation indicators following international recommendations and country best practices. Subsequently (2.2.), a detailed description of the current calculation methodology of inflation in Kazakhstan is presented, comparing it with the international recommendations to highlight the reasons why it is not reliable and does not command the trust of users. Paragraph 3 discusses the main limitations of the current measure (3.1) and possible methods to improve it, with the use of big data on prices and consumption (3.2) and, above all, with the estimation of the weights of consumption at regional level (3.3), specifying the methodology chosen to carry out the latter (also considering the differences in price and consumption behavior at urban and rural levels). In paragraph 4 the new procedure for calculating inflation at a regional level is described in detail, initially presenting (4.1) how the selection of the urban and rural settlements should be made and, subsequently, the methodology of calculating the consumption weights at a regional level using cluster analysis (4.2), then explaining why this method was used (4.3) and finally illustrating the results obtained (4.4).
Trust in the measures of inflation at the international level and in Kazakhstan
Trust in the measures of inflation at international level
Tendencies of distrust of the population to official inflation are not typical for Kazakhstan for various reasons. According to the study by Drenik, and Perez [1] in Argentina, the distortion of official statistics on inflation caused the search for alternative methods and sources of measuring inflation. In European countries, according to Drager and Nghiem [2], the level of inflation perceived by the population and the official one is significantly different, with the official level of 0.3%, and growth is perceived at the level of 5%. Such a difference can reduce confidence in official inflation data, even though the difference can be explained by the perception of households, according to Coleman and Nautz [3]. For example, Bruin, Klaauw, and Topa [4] believe that people tend to remember extreme prices and, on this basis, build inflation expectations. Also, the level of confidence in the official inflation level can be undermined by a return to central banks’ targets after rising inflation [3]. Confidence in the official rate of inflation is essential since the lack of confidence in official price changes can lead to public discredit of monetary policy and distortion of market prices and wages [5], to inflationary uncertainty [6], and volatility [7].
Accuracy, the validity of the application of international recommendations in the field of statistics and increasing the transparency of the methodology are the main ways to increase public confidence in inflation indicators. It is essential to describe reliably sampling processes, the number of objects, and price quotations in product classes. It is important since, according to Carvalho and Kryvtsov [8] small samples in product classes (sectors) cause a bias towards sectors with more comprehensive price selection. It is important to consider regional differences, for example in Poland, Rokicki and Hewings [9] found that intra-rather differentials influence the overall inequality level. The accuracy of measuring inflation is only possible by taking into account regional differences, so Xiao, Wang, Tian, and Zhen [10] in their study based on data from China, note that there are significant differences across regions in terms of the level of economic development, the presence of natural resources and income level.
Comparison between Kazakhstani methodology and international recommendations
Comparison between Kazakhstani methodology and international recommendations
Source: author’s work.
Also, one should consider the possibility of improving official statistics by calculating error bias and uncertainty. Mazzi, Mitchell, and Carausu believe that accuracy and elimination of error bias can be obtained by delaying publication until more information becomes available about the sample population or updated data [11]. Various approaches for calculating sampling errors in consumer price indices are presented in detail in the work by Smith [12], where methods for estimating the impact of sampling errors on prices and weights were considered separately in the context of the regional CPI.
In Kazakhstan, the measurement of inflation (the consumer price index) is calculated based on the Methodology for constructing the consumer price index [13] and the Methodology for monitoring prices for consumer goods and services [14]. These methodological recommendations are publicly available in the Adilet system.
Based on the comparison between national and international recommendations, the Methodology [13] requires clarification on specific points.
In terms of the number of price quotations: the Methodology considers the structural specifics of household consumption in the region based on the number of price quotations. However, the method for calculating the number of price quotations and the criteria for the sufficiency of price quotations necessary for the formation of high-quality statistical information [13] are not described.
In terms of settlements included in surveillance: according to the methodology, it is assumed that the coverage of urban and rural areas depends on the population size and the possibility of obtaining regular price information. At the same time, clear criteria that determine the possibility of obtaining regular information are not described.
The methodology stipulates that district centers are included in the observation, which can be urban-type settlements. So, according to the Bureau of National Statistics, the number of district centers that are urban-type settlements is 28.4%.
International recommendations also suggest considering territorial specifics (Table 1).
IMF recommendations: to sample areas based on cut-off and random sampling methods. At the same time, in the first stage, it is recommended to select cities, the population of which contains most of the population of the region, using the cut-off method. Further, the rest of the settlements are selected with a probabilistic method. The number of observed settlements must be set in advance. Rural settlements must be included in the sample. Purposeful selection is not recommended, as it increases the sampling bias [15].
In Kazakhstan, at the end of 2022, 17 regional centers (cities: Semey, Kokshetau, Aktobe, Konaev, Atyrau, Oral, Taldykorgan, Taraz, Karaganda, Kostanay, Kyzylorda, Aktau, Pavlodar, Petropavlovsk, Turkestan, Taldykorgan, Ust-Kamenogorsk), three cities of republican significance (Almaty, Shymkent, Astana), and 65 district centers were included in the CPI calculations, while information about the district centers selected for observation is not open and publicly available.
At the moment, international recommendations for the selection of settlements in Kazakhstan are not fully followed; there is a need for wider coverage of the rural area. This need is discussed in more detail in the section ‘Main limitations of current inflation measurement’. It also notes the need to use methods of random selection of settlements.
From the analysis of international experience, we focus on the experience of European Union countries (EU), where a stratified sample is used in the selection of settlements (Table 2).
Methods of selection of settlements by country
Methods of selection of settlements by country
Source: Manuals and guidelines [16, 17, 18, 19, 20, 21, 22, 23].
Now in Kazakhstan, according to methodological recommendations, the selection of settlements is performed taking into account the population as a whole in the region, the degree of market saturation; the mandatory presence of rural areas is also regulated. At the same time, it is necessary to consider the possibility of using stratified and probabilistic sampling methods, by the IMF selection rules.
Main limitations of current inflation measurement
A significant part of the population of Kazakhstan lives in rural areas [24] (see Fig. 1). In Kazakhstan, consumer prices are monitored in cities and district centers. In district centers, prices are registered according to a limited list of goods consisting of only 96 items, while the complete list consists of 508 goods.
In district centers for 96 goods, price quotations are collected to provide information for calculating the cost of living [14]. The approach includes only district centers in the observation, with 28.4% of them being urban, and does not include rural settlements, where a significant part of Kazakhstan’s population lives. This gives rise to a distortion of the actual price level and distrust of official statistical information.
Population by region and rural/urban area in 2022. Source: Bureau of National Statistics of Kazakhstan [24].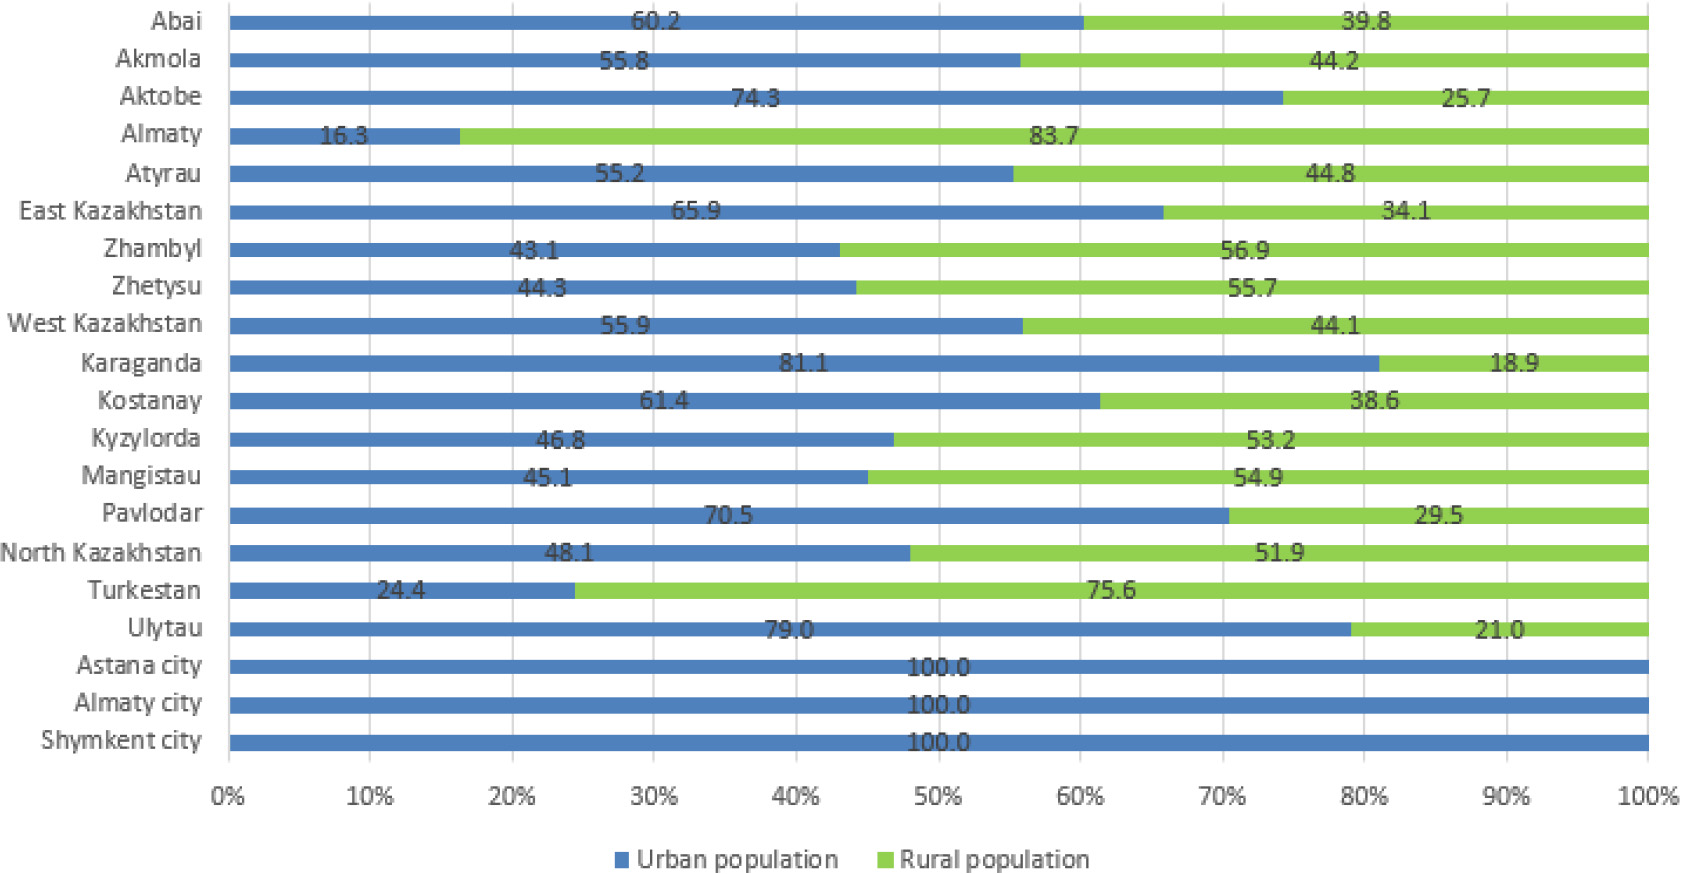
Distrust of the official inflation rate is justified, as the analysis showed that most of the population of Kazakhstan lives in rural areas. In Turkestan region, the share of rural population is 79.1% percent, in the Almaty region it is 75.5%, in the Zhetysu region it is 66%, in Zhambyl it is 60%, in Mangystau it is 59.7%, in Kyzylorda it is 55.1%, in North Kazakhstan it is 53%, and in Akmola it is 52.4% (Fig. 2) [24]. At the same time, most of the goods’ prices collected to calculate inflation according to the Methodology [14] are goods that were bought in the regional centers.
Thus, price changes in the rural zones are poorly accounted in inflation in Kazakhstan in full, even though most of the rural population is concentrated in only several regions. The division of inflation indicators into urban and rural areas will make it possible to smooth the perception of inflation indicators and increase their reliability in the eyes of the population.
In Kazakhstan, one can often face criticism of the official inflation rate. In many ways, this is also because the Bureau of National Statistics of Kazakhstan is a state body, a subordinate body of the Agency for Strategic Planning and Reforms. Such subordination casts a shadow on the independence of official statistics and emphasizes the need for a transparent methodology or the search and use of alternative methods for measuring inflation.
The search for alternative ways to measure inflation becomes relevant in the international environment. On the other hand, the international community often focuses on the accuracy and validity of applying international recommendations in the field of statistics.
Alternative methods of collecting information for measuring inflation are becoming an actual trend in countries with developed digital analytics, as Macias, Stelmasiak, Szafranek [25] note in their work. Big data on price quotes collected from web pages expand the possibilities of predicting the level of inflation and increase the accuracy of inflation forecasts. By big data here we mean large volumes of complex data on product prices, the use of which is possible using machine learning tools. Large amounts of data from web pages, presented in the form of information on prices for a wide range of products and services, make it possible to take into account changes in various goods in real time. Using machine learning tools, taking into account factors affecting price changes, we can more accurately predict future changes in inflation, and in turn quickly respond to them. Especially the collection and analysis of online prices were relevant during the Covid-19 period for countries with a long period of nationwide quarantine, such as China [26]. Yim, Son, and Lee [27] believe that using big data collected from the Internet is relevant for countries with developed e-commerce. As the authors note, the use of big data is accompanied by a noticeable decrease in the level of food inflation compared to official statistics. Cavallo [28] also notes the difference in data from the Internet compared to official statistics.
Thus, using the web pages is a relevant and timely solution. However, it is worth noting that for developing countries or countries where the share of e-commerce is insignificant, as in Kazakhstan, focusing only on Internet data can significantly reduce the calculated inflation. Therefore, attention should be paid to studies devoted to improving the procedures for collecting primary data and the stages of forming inflation indicators. Sheremirov [29], in his work, concludes that the inflation indicator will be more accurate if the number of sales is taken into account when registering prices. Nakamura and Steinsson [30] believe that the use of scanning data can provide such an advantage since they include information on quantities sold and prices. However, according to Nakamura and Steinsson [30], the disadvantage of scanning data is the use of only packaged consumer goods and the concentration on one retail outlet from a chain of stores.
It is possible to improve the quality of CPI collection using web pages by combining data across all regions and periods through sampling and estimating region-specific and time-specific fixed effects. One such method was developed by Aizcorbe and Aten [31], which normalizes the ratios to one region and period.
The use of big data from the Internet and scanning data for Kazakhstan will not be a complete solution to the problem of the reliability and transparency of the development of statistical data when calculating inflation since the share of e-commerce in retail trade at the end of 2021 in the total amounted to only 3.6%, and 4.1% in 2020 [32]. At the same time, it should be considered that implementing e-commerce in the rural zone of Kazakhstan, where 38.5% of the population lives as of 2021, is complex [24]. Also, in the rural area of Kazakhstan, there are often no retail chain stores where data can be potentially scanned. Therefore, despite the relevance of using web pages and scanning data as alternative sources for measuring a reliable inflation indicator, they do not solve the current problems.
Thus, increasing public confidence in the published statistical indicators of inflation in Kazakhstan is possible by improving the transparency of the methodology for constructing inflation indicators and eliminating all its inaccuracies that give rise to doubts, as well as considering regional differences in consumption.
Estimating the weights of consumption at regional level: Choice of appropriate methodology
To analyze inflation and its constituent elements, Carrion [33] used the clustering method, Carrion divided the CPI food basket into clusters using the k-means method, taking into account the specifics of inflationary fluctuations. Also, the cluster method was used by Xiao, Wang, Tian, and Zhen [10] for separating regions. The contribution of our study is the division of Kazakhstan regions into clusters, taking into the consideration specifics of household spending, which can significantly affect inflationary fluctuations in the regions and the country.
For the analysis, we used data on household expenditures for 2021 from the Bureau of National Statistics [34] by region and by type of products consumed from the composition of the basket of products, according to which the inflation indicator is calculated, and the data on the population by region at the beginning of 2022 [24].
The k-means cluster and dispersion analysis method were used to analyze the differentiation of the consumer basket by region. For cluster analysis we used data on household expenditures by region. We preliminarily found an optimal number of clusters. The clusters are represented by region that are similar in the structure of consumption expenditures.
It is worth noting that in 2022, there were changes in the administrative-territorial structure of Kazakhstan. Three new regions (Abai, Zhetysu, and Ulytau) were reorganized and formed. When conducting a cluster analysis, these new regions were not included due to the lack of data. Also, where it was not possible to get complete 2022 data on household expenditures, 2021 data were used [34].
When analyzing spending by region, one should also consider features that can distort the distribution across clusters, listed below.
The structure of expenditures in the capital city of Astana and the cities of republican significance, Almaty and Shymkent, have their own characteristics. For example, in the structure of consumer spending of the population, a significant part is allocated to paid services (23.4%, 22.2%, and 20.9%, respectively) [34], while on average, in the Republic this figure is 17.4%.
In the Atyrau region, the share of the population with incomes below the subsistence level is 3.3%, one of the lowest rates in the Republic, lower only in Astana (2.2%) [35].
Oil refining industries are concentrated in Atyrau region. Any change in oil prices will affect the main economic trends here [36].
Expenses of households in Astana, Almaty, Shymkent cities, and Atyrau region formed single clusters when included in the cluster analysis. Therefore, they were excluded from the general cluster analysis. Due to this reason, the cluster analysis was performed for 13 regions out of 20.
In addition, to argue for the need to publish inflation indicators by type of area (urban and rural), we performed an analysis of the population structure based on official statistics at the beginning of 2021.
A proposal of a new procedure to calculate inflation at a regional level
The selection of the settlements
The selection of settlements:
should be performed in a regional context and take into account the share of the rural population living in it. It is important to take into account the share of rural population living in settlements when sampling them on a regional basis since it will make it possible to plan social and economic programs based on more accurate data on price levels in the region. in a rural area, it is necessary to expand the list of goods and the number of price quotations that affect the level of inflation. This will have a positive impact on monitoring and managing inflation and will contribute to more accurate measurement of inflation. as a basis for selecting settlements in the rural area, use data on the population for the last year. This measure will allow to focus efforts and resources on settlements with the highest population density or the largest number of inhabitants. perform the selection of settlements by probabilistic and stratified selection methods, adhering to the principles of transparency and openness in the selection of settlements. These methods help reduce bias and provide more accurate inferences from the sample. They will also ensure transparency and openness in the process of selecting settlements and will increase confidence in official statistics.
In Kazakhstan, at the moment, the weight components of goods and services are the same for all regions. The formation of weight components at the lower level for goods and services from 8 to 6 digits NCICP (Directory of Commodity Items for the Classifier of Individual Consumption by Purpose) is carried out based on data on household expenditures. Weight components are adjusted from 5 digits NCICP onwards according to the data of the system of national accounts.
Calculations of the structure of household expenditures by region of the Republic of Kazakhstan and by consumer goods and services.
We used data on household expenditures for 2021 by 13 regions of Kazakhstan to determine the differences in the structure of household expenditures. The data were analyzed using dispersion and cluster analysis. Cluster analysis showed that, according to the household expenditure structure, the republic’s regions could be divided into 3 main clusters (Fig. 2).
The optimal number of regional clusters in the Republic of Kazakhstan, according to household spendings. Source: author’s work.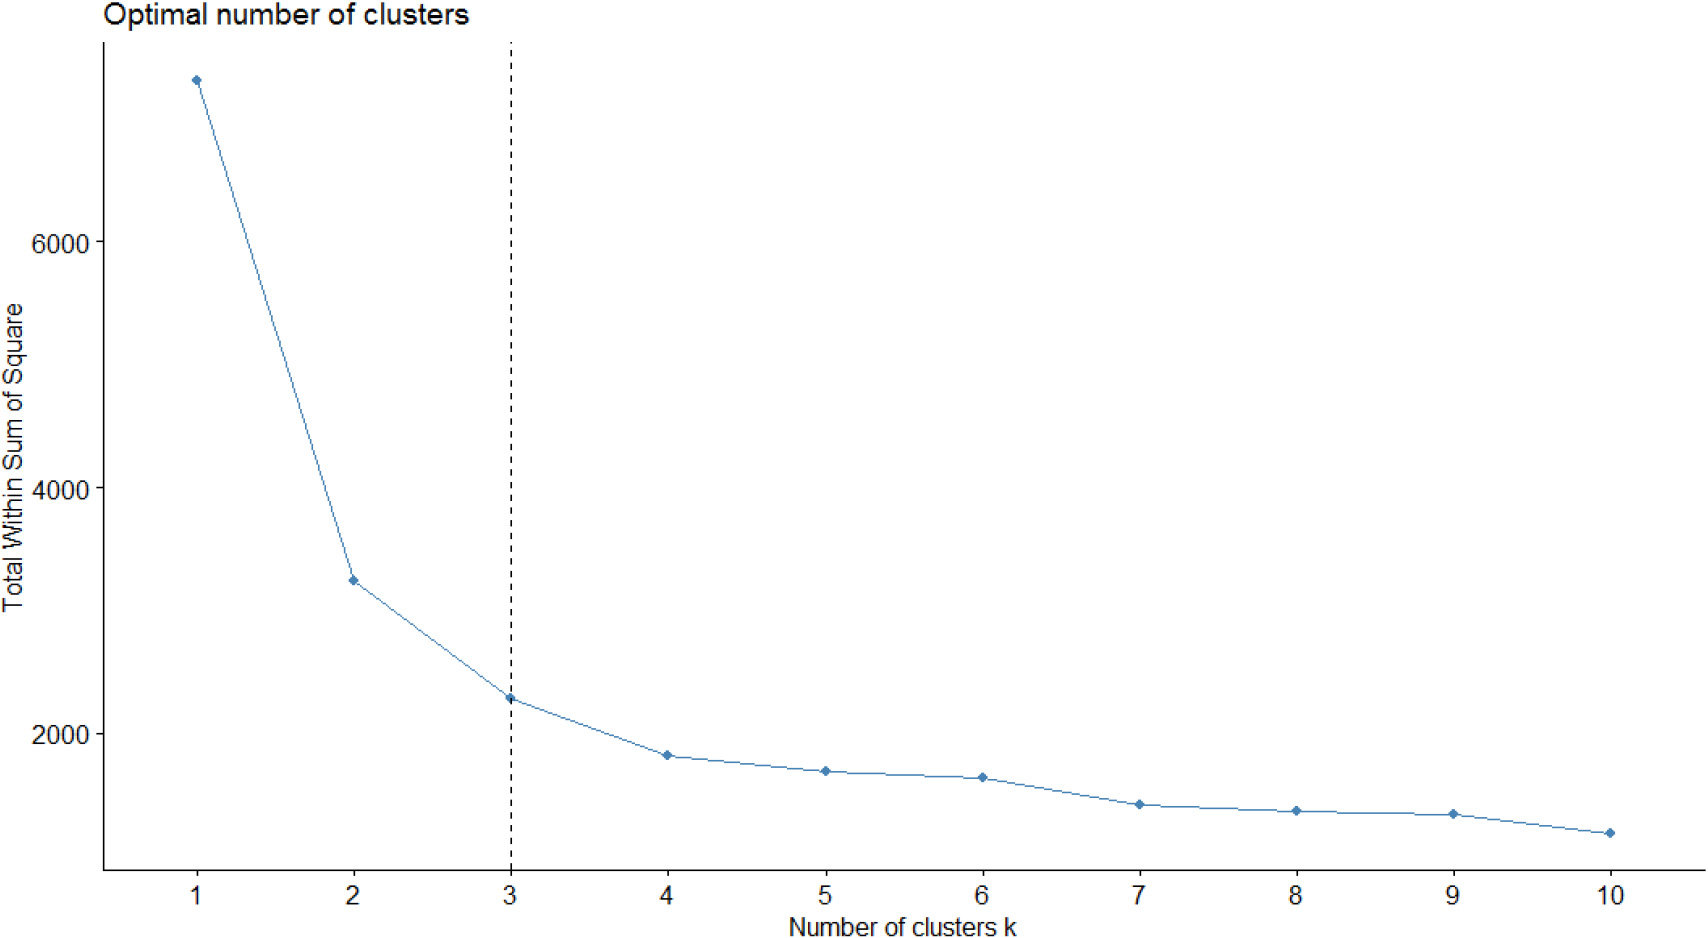
Cluster analysis shows that the third cluster includes 6 regions, the second cluster includes three, and the first includes four regions.
Cluster analysis was performed with R Studio and SPSS programs. Clustering was performed using the k-average method, where data on the shares of household expenditures in the regions on goods and services according to the consumer basket were used as the basis for distribution by clusters. The analysis was performed based on the search for distances (differences) between the shares of expenses for a certain product by region.
Distances between the end centers of clusters
Source: author’s work.
The regions where the smallest distance was found are assigned to one cluster. This approach makes it possible to determine the centers of clusters and the distances between the centers of clusters (Table 4).
Allocation of regions by cluster
Source: author’s work. Proposed disaggregation for household expenditures.
Based on regional household spending data we divide regions into following clusters:
Cluster 1: Akmola, Kostanay, North Kazakhstan, Pavlodar regions. The first cluster includes mainly northern regions – these regions have cold climate, and well developing industry (mainly manufacturing), as well as agriculture. The share of agriculture in gross regional product (GRP) in the Akmola region is 18.8%, industry 31.9% (of which 25.9% is manufacturing). In the Kostanay region, the share of agriculture is 13.2%, industry – 34.4% (of which 24.4% is manufacturing). In North Kazakhstan, the share of agriculture is 28.1%, industry 16.2% (of which 13.6% is manufacturing). In the Pavlodar region, agriculture is 6.1%, industry is 38.7% (of which 24.1% is manufacturing) [37]. Thus, about half of the total GRP of the regions in this cluster is formed in agriculture and manufacturing, which affects the economic situation of households and the structure of their consumption. Moreover, 38.3% of all agricultural products and 23.3% of manufacturing products in Kazakhstan come from these regions. Also, the most common modal salary in these regions is less than 200$ (USA dollars) per month [38].
Cluster 2: Zhambyl, Kyzylorda, Turkestan regions. This cluster represents southern regions with a warm climate. Despite this, agriculture in the structure of GRP does not make such a large share as in the northern regions of the first cluster. Agriculture in the Kyzylorda region accounts for 6%, Zhambyl region – 11%, Turkestan region – 16.2% of GRP [37]. Industry in the Kyzylorda region is 30.9% (of which manufacturing is 6.3%), Zhambyl region is 18.7% (of which manufacturing is 12.0%), Turkestan region is 17.3% (of which manufacturing is 7.1%). Thus, agriculture and manufacturing make up no more than 25% of the region’s GRP. In the Kyzylorda region, the mining industry predominates – 22.9%. In Zhambyl region, transport and warehousing – 14.4%. In these regions, the modal level of wages is different, so in the Zhambyl region it is about 200$ per month, in the Turkestan region it is not much more than 200$, in the Kyzylorda region it is about 300$ [38]. Therefore, it generalizes and forms the structure of consumption.
Cluster 3: Aktobe, Almaty region, West Kazakhstan, Karaganda, Mangystau, East Kazakhstan regions. Cluster three includes regions with developed industry. In Aktobe, the share of industry in GRP is 37.9% (of which mining is 19.5%), in West Kazakhstan – 52.5% (of which mining is 47.3%), in Karaganda – 49.1% (of which metallurgy products are about 27.5%), in Mangystau – 48.7% (of which mining – 42%) [37, 39]. In East Kazakhstan, the share of industry in GRP is 35.4% (of which metallurgy products are about 22.5%), in Almaty region it is 29.7% (of which 44.5% is food and beverage production). The modal salary in the East Kazakhstan region is about 300$ per month, in the Aktobe region more than 250$, in the West Kazakhstan, Mangystau, and Karaganda regions about 200$ [38]. ’ Separate regions outside of the clusters are Atyrau region, Astana, Almaty, Shymkent. The consumption structure in these cities and regions differs from other regions of the country. Each has its own characteristics. The Atyrau region produces 44.2% of all mining products in Kazakhstan, and the modal wage level is more than 400$ per month. The city of Almaty accounts for 37.7% of wholesale and retail trade services of the entire Republic, compared with 12.8% in Astana. At the same time, in the cities of Almaty and Shymkent the modal level of wages is more than 300$ per month, while it is more than 600$ in the city of Astana [38].
In more detail, with the level of reliability, the differences in consumer goods are shown by the conducted analysis of variance.
Thus, with a significance level of 0.002 (99.998% confidence), there are differences in the regions in the consumption of rye and rye-wheat bread. The average squared deviation is 1.115. Differences also exist in the consumption of the following goods:
chicken parts (thigh, drumstick, leg) – significance level 0.032 (97% confidence), mean square deviation 0.088; chicken breasts – significance level 0.081 (92% confidence), mean square deviation 0.01; eggs – significance level 0.001 (99.9% confidence), mean square deviation 0.102; egg powder and melange – significance level 0.010 (99% confidence), mean square deviation 0.173; melons – significance level 0.00 (100% confidence), mean square deviation 783.564; carrots – significance level 0.00 (100% confidence), mean square deviation 0.66; ice cream – significance level 0.002 (99.998% confidence), mean square deviation 0.092; green tea – significance level 0.040 (96% confidence), mean square deviation 0.014; vodka – significance level 0.007 (99.993% confidence) mean squared deviations 0.007; men’s hats, caps – significance level 0.001 (99.99% confidence) mean squared deviations 0.001; cement – significance level 0.086 (92% confidence) mean squared deviations 0.005; tulle – significance level 0.042 (96% confidence) mean squared deviations 0.001; baths – significance level 0.03 (97% confidence) mean squared deviations 0.125.
Considering the above, we propose using regional weight components for certain types and groups of goods and services according to the structure of regional household expenditures to display the inflation rate by region correctly. Adjustment of weight components according to SNA data should be carried out only at the level of the Republic.
It is necessary to provide differentiated weight components for the following product groups, in which there are discrepancies by region:
Meat and poultry; Dairy products, cheese, and eggs; Potatoes and other tuberous vegetables; Coffee, tea, and cocoa; Alcoholic drinks; Outerwear; Other garments and clothing accessories; Household goods and services.
The use of regional weight components will make it possible to bring the perception of published official statistical information closer to the inflation expectations of the population in the regions.
Cluster analysis is not the only way to estimate regional weight components: alternative methods include the “small area estimation” method [40] and “Jackknife replication method” [41]. Small area estimation (SAE) provides an analytical framework for increasing the level of detail without necessarily collecting data. The Asian Development Bank recommends its use when there are no other small area-level data that can be used. SAE requires careful review of the assessment. The method is used to detail the available information, and it is important to have auxiliary data that could explain the variable of interest [42]. In the context of studying inflation in Kazakhstan, the SAE method is currently of little use, since there may often be no accurate information on prices in rural areas of Kazakhstan.
Another method that can be used to achieve sampling is the Jackknife replication method. This method involves excluding the i-th element and finding the average value of the elements of the data set without this element, thus narrowing the sample to the optimal one. It is noteworthy that this method is compatible with cluster analysis, when clusters of elementary units are selected in subsamples of each cluster [44]. Klick and Shoemaker used the Jackknife replication method to evaluate significant differences between urban population and other populations [42].
Despite the advantages of the SAE and Jackknife replication method for improving the accuracy of inflation data in Kazakhstan, especially in its rural zone, we propose as a basis a cluster method for distributing the weight components of the inflation basket and stratified sampling methods for selecting territories . The cluster method will allow taking into account the natural, climatic, economic, and social characteristics of the regions of Kazakhstan, and sampling and stratification methods will ensure the accuracy of the data.
Results: Presentation and discussion
Analysis shows that the methodology uses statements that have not been proven. For example, “Trends in price changes in other settlements repeat the movement of prices in large cities within a certain period”. However, there needs to be more information on whether prices are monitored in out-of-sample settlements, how often, in what form, and by which organization, to confirm the last statement. Based on the literature review, there are no studies on price trends in urban and rural areas in Kazakhstan. In particular, the lack of research on inflation trends in Kazakhstan’s urban and rural areas is understandable since no official statistical information has been published on the division of inflation in the rural and urban areas.
Compliance with international recommendations remains an important aspect of increasing the confidence in inflation indicators, along with the use of alternative sources of information, scanned data, and data from web pages. Regarding the number of price quotations, it is necessary to regulate the observed settlements and the number of price quotations taken into account when calculating inflation indicators in rural areas, considering the number of residents. Since the share of rural and urban population differs across the regions of Kazakhstan (there are regions with a very high proportion of the rural population), transparency in forming a list of settlements and the number of rural areas involved in calculating inflation indicators is essential. Also, in this case one should adhere to probabilistic, stratified selection methods.
An analysis of the structure of household expenditures in Kazakhstan shows differences in consumption in the regions by commodity groups. These are meat and poultry, dairy products, cheese and eggs, potatoes, coffee, tea and cocoa, alcoholic beverages, outerwear, household goods, and services. Differences by product groups must be presented in regional weight components, which can be divided into clusters of areas. Three clusters from 13 regions with a similar consumption structure have been found in Kazakhstan.
Thus, to solve the identified problems when calculating inflation in Kazakhstan, it is necessary to review existing procedures and methods. Their revision will increase confidence in the official inflation rate in Kazakhstan. The new methodology for a more accurate calculation of inflation at the regional level should be based on methods recognized by the international community, including methods of random and stratified sampling of settlements in rural areas and at the regional level, ensuring their transparency. Price indices at the regional level also need to be calculated more accurately with clarification and detailing of the weighting components at the regional level, which is proven by the cluster analysis we conducted.