
Abstract
One of the U.S. Census Bureau’s innovations in the 2020 U.S. Census was the use of administrative records (AR) to create household rosters for enumerating some addresses when a response was not available but high-quality ARs were. The goal was to reduce the cost of the fieldwork in the Nonresponse Follow-up (NRFU). The original plan had NRFU beginning in mid-May and continuing through late July. However, the pandemic forced the delay of NRFU and caused the Internal Revenue Service to postpone the income tax filing deadline, resulting in an interruption in the delivery of ARs to the U.S. Census Bureau. The delays were not anticipated when U.S. Census Bureau staff conducted the research on AR enumeration with the 2010 Census data in preparation for the 2020 Census or during the fine tuning of plans for using ARs during the 2018 Census Test. These circumstances raised questions about whether the quality of the AR household rosters was high enough for use in enumeration. To aid in investigating the concern about the quality of the AR rosters, this study compares census rosters to AR rosters that meet a quality standard at addresses that have both and the census roster is either a self-response or a NRFU household member response. A key result is that the mode of census response and the amount of time between the response and the April 1st reference date impacts the agreement rate between AR roster size and the census roster size at addresses that have both types of rosters.
Introduction
The U.S. Census Bureau’s approach to the 2020 Census included the use of administrative records (ARs) to reduce the cost of Nonresponse Follow-up (NRFU), which is the field operation where enumerators visit and attempt to obtain an interview at addresses that did not self-respond. The 2020 Census is the first census in the U.S. to use ARs to enumerate some households. The use of ARs has become feasible due to advancements in computer capacity and processing speed.
One way that ARs were used in the 2020 Census was to enumerate an address for which no response was submitted by Internet, mail or telephone during the self-response period or obtained in one visit by an enumerator during NRFU. The ARs for the address were required to meet a specified quality standard. When these quality criteria were met, no further visits were made to the address during NRFU.
The COVID-19 pandemic caused delays in the data collection and processing for the 2020 Census. The original plan for the Census called for the collection of self-responses to occur March 12–July 31 of 2020 but the actual self-response period occurred March 12–October 15. NRFU originally was scheduled to start in May but was delayed by three months.
In addition, the pandemic caused federal agencies to postpone the collection and delivery of some of the ARs that they had agreed to provide. These delays resulted in the Census Bureau staff postponing the start of the remaining preparations for the AR enumeration from early May to late May. The agencies made monthly deliveries that contained updates of their ARs which allowed the Census Bureau’s AR processing staff to see if these files changed from month to month and when a change occurred, to see the effect on the AR rosters.
The combination of the delay of NRFU data collection and the delay of the receipt of ARs created situations that did not appear when Census Bureau staff were conducting the research with the 2010 Census data in preparation for the 2020 Census. These circumstances raised questions and created opportunities for improving the Census count using ARs beyond the original plans. In fact, the Census Bureau Scientific Advisory Committee recommended that the Census Bureau conduct analyses that would compare census rosters and administrative records rosters for addresses where both types of rosters were available [1].
This document focuses on the addresses where both a census roster and an AR roster were available, but the two rosters differed on the size of the household. Of particular interest is the situation where the census roster lists one more or one less person than the ARs identified as residing at the address since these were the types of discrepancies between the census roster and the AR roster that occurred most often. When an address had both an AR roster and a census self-response or a NRFU household member response, the response submitted by the household was the one that was used for the census enumeration.
Examining the characteristics of households where the census roster and AR roster have a different household size will add to the knowledge base for using ARs in the most effective ways in future censuses. For addresses where the census household size and the AR household size are different, the distribution of the differences in household size is of particular interest. In addition, the analyses consider whether the distributions of the differences in household size vary by type of AR roster and/or by type of respondent. These analyses seek to inform the planning for the 2030 U.S. Census.
Background
The Census Bureau has a long history of seeking ways of improving census-taking methodology and reducing cost while preserving data quality. The Census Bureau has increased the use of ARs in its programs over the years as the quality of ARs and the computer technology to process large datasets have improved. In addition, sharing of AR data between federal agencies has been encouraged by the Office of Management and Budget and thereby become more frequent under strict guidelines for protecting privacy. The source agency also must approve the way the receiving agency plans to use the data. Recent U.S. censuses have used ARs in some aspects of census-talking but not for enumeration of households. For the 2010 Census, the Census Bureau updated its Master Address File (MAF), which is a list of the U.S addresses with living quarters, by using five commercial databases and a U.S. Postal Service database, called the Delivery Sequence File (DSF), that has all residential addresses that receive mail. The challenge in using ARs for census enumeration has been that the U.S. does not have a single AR system that covers the entire population. Therefore, the Census Bureau has had to acquire AR datafiles from several sources along with approvals to merge and remove duplicates to create a single file with substantial coverage of the U.S. population
Total addresses versus addresses with an administrative record roster
Total addresses versus addresses with an administrative record roster
As the planning for the 2020 Census started after the evaluation of the 2010 Census, the Census Bureau searched for ways to reduce the cost of Nonresponse Followup (NRFU) while maintaining the quality of the enumeration. NRFU is the field operation where enumerators attempt to obtain census responses from households that did not submit a self-response by Internet, mail or telephone. NRFU is one of the most expensive operations in the census. ARs appeared to be a potential source of data that could be used for census enumeration. Therefore, the Census Bureau conducted a research program from 2012 to 2018 to identify cost-effective ways to use ARs to reduce the cost of NRFU while preserving quality and protecting personally identifiable information from disclosure.
The research program produced a methodology for creating an AR roster for the household at an address in NRFU and assessing its quality. The quality assessment relied on statistical models to assign a status of AR Vacant, AR Nonresidential, AR Occupied or No Determination to addresses in NRFU. AR rosters were created for addresses with the status of AR Occupied and assigned a quality status. An AR roster that met a specified quality standard was used for enumeration only if a self-response was not received for the address and one NRFU contact attempt was unable to resolve the status of the address. For more details about the quality standard, see Section 3.
According to census residency rules, the correct location for a person’s enumeration is the address of the person’s usual residence around Census Day, which is April 1 of the census year. The population under study in this analysis is defined as occupied addresses with an AR roster and a self-response or NRFU household member response. Another requirement for AR enumeration and therefore inclusion in this study is that the address appears on the Census Bureau’s Master Address File (MAF) with an assigned identification number called a MAFID. The assignment of a MAFID indicates that the address has been verified. In addition, the AR roster must have one of the six valid household compositions (between one and three adults, with or without children) to be considered for AR enumeration. Previous research has shown that AR rosters for households containing more than six persons tend not to meet accuracy requirements [2].
Table 1 shows national level results for the total number of addresses in the U.S. and the total number of those addresses that had a high-quality AR roster suitable for census enumeration. In particular, Table 1 shows that 55.35 million addresses (or 36.5%) that are Occupied housing units have a self-response and a high-quality AR roster. In addition, Table 1 also shows that 3.781 million addresses (or 2.5%) that are Occupied housing units with a NRFU response from a household member and a high-quality AR roster. When these two categories are combined, they contain 59.131 million of the 126.8 million Occupied addresses.
Matching administrative records for persons
Linking administrative records data for persons to other data sources, which includes census data, requires that records in both sources include Protected Identification Keys (PIKs). These PIKs are essentially encrypted Social Security Numbers or Individual Tax Identification Numbers, which are included when using the term Social Security Numbers in this paper. Administrative records data files come with Social Security Numbers that the Census Bureau staff convert to PIKs after a validation of their accuracy through matching to Social Security Administration files, a procedure called the Person Identification Validation System (PVS) (Wagner and Layne 2014). When a data file with records for persons does not come with Social Security Numbers, the Census Bureau uses its system to look up Social Security Numbers and encrypt them by assigning PIKs.
Sometimes the PVS fails to assign a PIK to a record. For example, 90.3% of the 2010 Census enumerations received a PIK from the PVS, while 97% of the enumerations had enough information for an attempt to assign a PIK [3]. Evaluation studies have shown that a missing date of birth or an error in the name in a record is highly correlated with the PVS not assigning a PIK [3, 4].
Data
Data sources for AR rosters
The following AR sources were used to construct the AR rosters in a process that included identifying multiple records for the same person at an address and removing the duplicate records:
IRS 1040 forms filed for 2019, IRS 1099 forms filed for 2019, Medicare records, Indian Health Service Patient Database, Household Composition Key File at the U.S. Census Bureau.
The Household Composition Key File [5] is a database created and maintained by Census Bureau staff using applications for Social Security Numbers (SSNs) from the Social Security Numerical Identification (Numident) File. The Census Bureau maintains a Census Numident file derived from the Social Security Numident File that contains names and SSNs that are used in assigning PIKs to records to enable child-to-parent linking for children under 18 years of age. A record for a child in the Household Composition Key File includes the names of the child’s mother and father, if available, but not the SSNs of the parents.
An AR household roster for a verified address must meet the requirement that at least one person on the AR roster could be corroborated at the address by two or more additional AR sources for the AR roster to be used to enumerate the address. For this purpose, staff consider an agency or data supplier as a single source. For example, IRS 1040s and IRS 1099s are treated as a single source since the two files come from the same agency. Thus, an IRS 1099 cannot be used to corroborate a person from an IRS 1040 [2].
Sources for AR roster corroboration
Sources for AR roster corroboration
Furthermore, the corroboration operation added AR sources to those used for constructing the AR household rosters. The additional sources include third-party sources, previous censuses, and surveys such as the American Community Survey (ACS), and other federal sources such as the Selective Service System. The records used in the corroboration were maintained in a Census Bureau database [6]. The database also contains data from other sources, both public and private, that the Census Bureau acquires an ongoing basis. The sources used only in corroboration are listed in Table 2.
Development of methodology
One of the goals during the planning of the 2020 Census was to reduce the cost of the NRFU fieldwork while maintaining the high quality of the household rosters used for census enumeration in NRFU. As part of the preparations for the 2020 Census, Census Bureau researchers developed a method for identifying addresses with high quality AR rosters suitable for enumeration. If a self-response was not submitted for an address but a high-quality AR roster was available, the address was removed from NRFU fieldwork, and the AR roster was inserted for the enumeration.
The approach for using ARs to enumerate some households in the 2020 Census used a distance function approach based on two predictive models to identify addresses with a reliable household or a vacancy determination. These models are described in the next section. A more extensive discussion of the research concerning the models and their variables may be found in [7] and [8].
The development of the methodology produced a screening tool that was flexible enough to permit adjustments of the threshold for identifying AR rosters suitable for enumeration if required by circumstances such as the cost or time constraints to complete NRFU fieldwork. One advantage of the approach was that the quality standard for the AR rosters could be raised or lowered if necessitated by circumstances arising from the status of the fieldwork or other situations that may occur in the census operations. The approach involved creating a housing unit level data set for the addresses and using characteristics of each address to assign a quality score for the AR roster for the address.
The initial work occurred during the 2015 Census Test and used the predictive modeling in an optimization approach to identify high quality AR rosters. The goal was to assign a quality score to each AR roster for use in ranking the AR rosters. The rankings would permit developing a cutoff that identified AR rosters that were suitable for AR enumeration.
Subsequently, the researchers used 2010 Census data to compare the results from the distance function approach to the results from a linear optimization approach. The study found a high level of agreement between the quality assessments of the AR rosters by the two approaches. In particular, 91 percent of the addresses assigned the status of AR Vacant by the distance function approach also were assigned the AR Vacant status by the linear optimization approach. A similar study that compared the assignments of AR Occupied to the 2010 NRFU status found an agreement rate of 94.4 percent among the 500,000 addresses with the lowest scores, which indicated the highest probability, of being occupied.
In the end, the distance function approach for assigning scores to the AR rosters for the addresses in NRFU was selected because the research demonstrated that it provided more flexibility and was easier to implement in the NRFU operation than the linear optimization approach.
Implementation of AR modeling
Initially, a multinomial logistic regression model, known as the Vacant-Nonresidential model, is fit using data from 2010 Census to aid in identifying addresses that are vacant and nonresidential. The dependent variable has three levels which are Vacant, Nonresidential, and Occupied. This statistical model relies heavily on Undeliverable As Addressed codes assigned by U.S. Postal Service mail carriers when they could not deliver Census mail to an address, but also uses additional characteristics of the housing unit and its neighborhood from other data sources. The model is applied using the characteristics of the 2020 addresses but relies on thresholds for the estimated probabilities of Vacant and Nonresidential identified using 2010 Census data. The addresses that the model does not identify as AR Vacant or AR Nonresidential are given the status of No Determination and retained for further processing to determine whether they are AR Occupied.
Next, an AR roster is created for each address that the model discussed in the previous paragraph designates as occupied. As discussed in Section 2.1, only addresses with AR rosters that have six or less household members and one of the six valid household compositions (between one and three adults, with or without children) are considered for AR enumeration. Two statistical models are fit using 2010 Census data and then applied to a distance measure that is used to identify the high-quality AR rosters for use in AR enumeration. One of the models is the Household Composition Model which is used to estimate the probability that the household composition (the number of adults and the number of children) for the AR roster at an address is correct, say
The second model, called the Person-Place model, provides an estimated probability that the
Next, the Person-Probability
The addresses assigned a score
Analyses with the 2010 Census data determined the final thresholds used during the 2020 Census. To arrive at a suitable distance threshold, we completed simulations with 2010 Census data that showed the effect of varying the threshold for identifying AR Occupied cases. These analyses can be seen in [7, 10]. One metric we were interested in is covered in this paper – the count match rate between the 2010 Census household and the AR-created roster. Another metric that we looked at was characteristic coverage of the AR-created roster. To do this, we looked at the availability of age, sex, race, Hispanic origin, relationship, and tenure for the set of potential AR enumerations.
AR rosters that met the high-quality threshold required for AR enumeration also were required to have at least one person on the AR roster that appeared at the address in one of the corroboration sources listed in Table 2. AR rosters that met these criteria were called One-Visit Multiple Source AR rosters because they were eligible to be used to enumerate the address if a NRFU enumerator was unable to resolve the status after one visit, provided at least one person could be corroborated. Under these circumstances, all the persons on the qualifying AR roster were inserted as the enumeration for the address.
Assignment of children to AR rosters
During the construction of the AR household rosters for census enumeration, Census Bureau staff attempted to assign a mother PIK and father PIK using the names of the parents. The Census Numident file was used to obtain age and sex information for each person in the AR household roster. Therefore, while each child record received a PIK based on the child’s SSN in the Household Composition File, not all AR records for parents were assigned a PIK as discussed in Section 2.2. In addition, there may have been errors in a parent’s PIK assignment [2].
An issue with the Household Composition Key File is that it does not provide address information; the file only provides the child PIK and the PIKs of the parents if they could be assigned. To compensate, the child was added to the AR roster for each of the addresses where either the mother or the father appears. If the mother and father appear in ARs at separate addresses, then the child was added at each of these addresses. Similarly, if a parent appeared in multiple addresses in ARs, then staff added the child to each of those addresses (Mule, Keller, Konicki 2018). One reason for adding the child to all the AR rosters listing one or both parents is that staff did not know which of the AR rosters, if any, would be used for enumeration.
A child being added to the AR roster at each parent’s address does not necessarily produce duplicate enumerations. The person-place model includes a variable designed to have a higher value when a household member is found at more than one address across the AR sources used in creating the AR rosters [11]. The result is that the score assigned to the AR roster also has a higher value. Therefore, if a household includes a child or other member who appears at more than one address in the AR sources, the address is less likely to qualify to receive an AR enumeration. Such a household is more likely to be contacted by an interviewer during NRFU if it did not submit a self-response. Estimates from the 2020 Post-Enumeration Survey (PES) show a correct enumeration rate of 94.5 percent, an erroneous enumeration rate of 4.3 percent due to duplication, and an erroneous enumeration rate of 1.3 percent due to other reasons [12]. In contrast, the 2020 PES shows an overall correct enumeration rate of 89.4 percent for all NRFU enumerations.
NRFU closeout AR statuses and corroboration
After the 2018 Census Test, which included a test of AR enumeration methodology, the staff identified a need for creating a set of AR Closeout statuses that relaxed the threshold used for the One-Visit Multiple Source AR rosters to help finish the NRFU operation. This strategy permitted AR rosters of slightly less quality than the One-Visit Multiple Source AR rosters to be used for AR enumeration. Fortunately, the distance function approach discussed in Section 3.3 and selected for the AR modeling had the flexibility to create the required AR Closeout statuses in the timeframe available to complete the census enumeration. The development of the AR Closeout statuses was based on research with 2010 Census data and used an approach similar to the methodology discussed in Section 3.3 for the assignment of AR Occupied, AR Vacant, and AR Nonresidential [13]. The addresses assigned an AR Closeout status would not receive additional visits during NRFU Closeout that occurred at the end of NRFU when a specified percentage of the addresses in an area were resolved. However, when the NRFU operation entered its Closeout Phase, these addresses would be assigned their AR Closeout status and would not be reopened for additional contact attempts. The assignment of an AR Closeout roster to an address that received the AR Closeout Occupied status required corroboration of at least one person at the address by two sources.
In September 2020 as the AR processing entered its final stage, IRS approved the use of its data to determine the number of household members at an NRFU address when the household could not be corroborated with other data sources. Medicare and the Indian Health Service also approved the use of their data to determine only household size when corroboration was not possible. Using these sources to obtain a household size provided higher quality data than could possibly be obtained through NRFU Closeout fieldwork or imputation. The rosters created by this procedure were called Household Size Only AR rosters.
The addresses that met the criteria for AR Occupied but their AR rosters were formed using IRS data that could not be corroborated by another source received the designation One-visit Single Source AR Occupied. Similarly, the addresses that met the criteria for AR Closeout Occupied but had AR rosters that could not be corroborated by another source received the status AR Closeout Occupied Single Source.
Administrative record occupied housing units by roster quality category
Administrative record occupied housing units by roster quality category
Note: Closeout household size only combines one-visit single source and closeout occupied single source. Counts are rounded for disclosure avoidance.
Table 3 provides some perspective on the scope of the use of AR rosters for census enumeration and their quality categories. ARs were used to enumerate households only when a census response was not received. Section 4 shows results for occupied addresses for which we had both AR rosters and census responses. The table also sheds some light on the quality of the AR rosters that were used to enumerate some of the addresses in NRFU since they did not submit a self-response and were not resolved by fieldwork. Table 3 shows that 91.95% of the AR rosters used for enumeration were in the category One-visit Multiple Sources, which contains the AR rosters of the highest quality.
Analytical approach
The analyses begin by examining cross-tabulations of counts of self-response (SR) rosters by administrative records (AR) rosters for addresses that have both types of rosters and the SR roster size disagrees with the AR roster size. Next, the analyses examine cross-tabulations of the household compositions of self-response (SR) roster counts by the household compositions of administrative records (AR) roster counts.
The analyses consider two types of responses to the census, which are self-responses and NRFU interviews where the respondent was a household member. The reason for restricting the analysis to these two types of responses is that they are believed to be of the highest quality because the respondent resides at the address.
The research seeks to identify characteristics of the rosters that provide insight as to why the census and AR roster do not agree on the size of the household. The study examines whether the distributions of the differences in household size vary by the quality of the AR roster, by the mode of the census response, and/or by the timing of the submission of the census response. In addition, characteristics of the person on one roster but not the other are examined.
Agreement on size of census roster and AR roster
Agreement rate between AR household size and census self-response household size by mode of self-response
Agreement rate between AR household size and census self-response household size by mode of self-response
Note: Mail includes mailout/mailback and update/leave.
The analysis in this section focuses on Occupied addresses with either a self-response or a NRFU household member response that also had a high-quality AR roster suitable for census enumeration. In Table 4 the column “Same size” displays the percentage of addresses where the administrative record (AR) household size is equal to the census response household size. The column “Different size” displays the percentage of addresses where the administrative record (AR) household size is different from the census response household size. The range of the household size agreement rates for the three self-response modes, Internet, Mail and Telephone, is 79.4% to 80.1%.
Agreement rate between census household size and AR household size when an address has both for two types of census response
In Table 5 the modes of self-response are aggregated for a comparison with NRFU household member responses. Note that 79.5% of the census rosters based on self-responses have a household size that agrees with the AR roster for the same address. The agreement rate for household size between NRFU household member responses and their corresponding AR roster is 58.7%, which is 20.8 percentage points lower than the 79.5% agreement rate observed between self-response rosters and their corresponding AR rosters.
Percentage of self-responses and NRFU household member responses by the difference between the 2020 Census household size and the AR household size
Note: Self-response includes internet, mail, and telephone responses.
Table 6 expands on Table 5 by showing the difference in the household size between the census roster and the AR roster at addresses that have both types of rosters. A negative difference means that the AR roster has more people than the census household roster. However, if the census roster is larger, then the difference is positive. The distribution for the difference in the census roster and AR roster size for the self-responses is reasonably symmetrical. The distribution of the difference in the size of census roster and AR roster for the NRFU household interviews is less symmetrical with the census household size tending to be a little larger than the AR household size.
Household size difference by AR roster type, response type, and whether address was resolved by July 30th
Note: Resolved by July 30th means a response was submitted by July 30th and Unresolved by July 30th means that a response was submitted after July 30th. Census nationwide launch date of Nonresponse Follow-up (NRFU) operations was August 11.
Table 7 provides more detail about distribution of the differences between the census roster size and the AR roster size by type of response and two other criteria. The type of AR roster is one criterion that indicates the quality of the AR roster based on whether the value of the distance function met the threshold for only one visit in NRFU or the relaxed threshold for inclusion in the NRFU Closeout phase. Another criterion is whether the census address was resolved by July 30, 2020, which indicates how close to Census Day the data used in creating the AR roster was collected.
The large majority of the NRFU household member responses were collected after July 30th. For all three categories of AR rosters shown in Table 7, the self-responses resolved by July 30th have the highest agreement rates between the census roster and AR roster for their addresses. Table 6 shows that these agreement rates are 83.8% for the One-visit Multiple Source AR rosters, 51.6% for the Closeout Multiple Source AR rosters, and 68.3% for Closeout Household Size Only AR rosters. Of the three types, the Closeout Multiple Source AR rosters have the highest average household size at 2.9 people which likely presents more opportunities for disagreement on household size.
The self-responses at addresses with a Multiple Source AR roster resolved after July 30th have an agreement rate of 74.4%, and the NRFU household member responses have an agreement rate of 66.3%. For the Closeout Multiple Source AR rosters, the percentages of addresses where the AR roster has one more person than the census roster range from 24.9% to 29.1% across the three time periods. The Closeout Multiple Source AR rosters were permitted to qualify for use with a larger distance measure than the One-Visit Multiple Source AR rosters, as discussed in Section 3.4. The larger distances often were due to the AR sources having the person at multiple addresses. If the census roster for the address did not include that AR person, a possible explanation is that the AR roster had a higher count than the census for these addresses.
The analyses in this section consider addresses where the census roster has one more person than the AR roster. The focus is on providing some information about when the extra census person lived at the address and the relationship of the person to the householder. The investigation uses only the One-Visit Multiple Source AR rosters since these AR rosters have an adequate number of observations to support further analyses while the other two types of AR rosters do not.
An additional criterion for an address to be included in the analyses in this section is that the persons on both rosters can be assigned a PIK, which enables identifying the additional person on either roster. The requirement also enables examining whether the person can be found at the address of the enumeration in the Self-response Verification file [5] which is a composite file created specifically for the census quality assurance operation. The advantage of the Self-response Verification file is that it enables determining whether the person had ARs at one or more other addresses in the Self-response Verification file before Census Day, after Census Day, or both before and after Census Day.
The analyses do not include addresses where the census roster and the AR roster differ by more than one person. As shown in Table 6, there are not enough observations for this type of analysis.
The approach first divides the addresses where the AR roster and the census roster differ by one person into two groups, one where the AR roster has one more person than the census roster and the other where the AR roster has one less person. Then the study examines whether the person on one of the rosters, but not on both can be found in the Self-response Verification file at the same address or a different address and if found, whether the timing is before, after, or including (i.e., before and after) Census Day. In addition, the analyses examine the characteristics of the persons on one of the rosters but not both.
The analyses in this section focus on the relationship between the householder for the address and the person on the census roster but not the AR roster. The census questionnaire includes a question that asks each person’s relationship to the householder. However, the creation of the AR rosters relies mainly on the IRS 1040 and 1099 forms. These IRS forms do not include a similar question about relationship of dependents to the householder, which means the required data are not available for an analysis of the situations where the AR roster has one more person than the census roster. All the addresses included in the analyses have a One-visit Multiple Source AR roster. This analysis uses data with final edit and imputed values for some characteristics but not for inclusion on a census roster or an AR roster.
Relationship distribution for additional census person found in AR composite but not included on AR roster.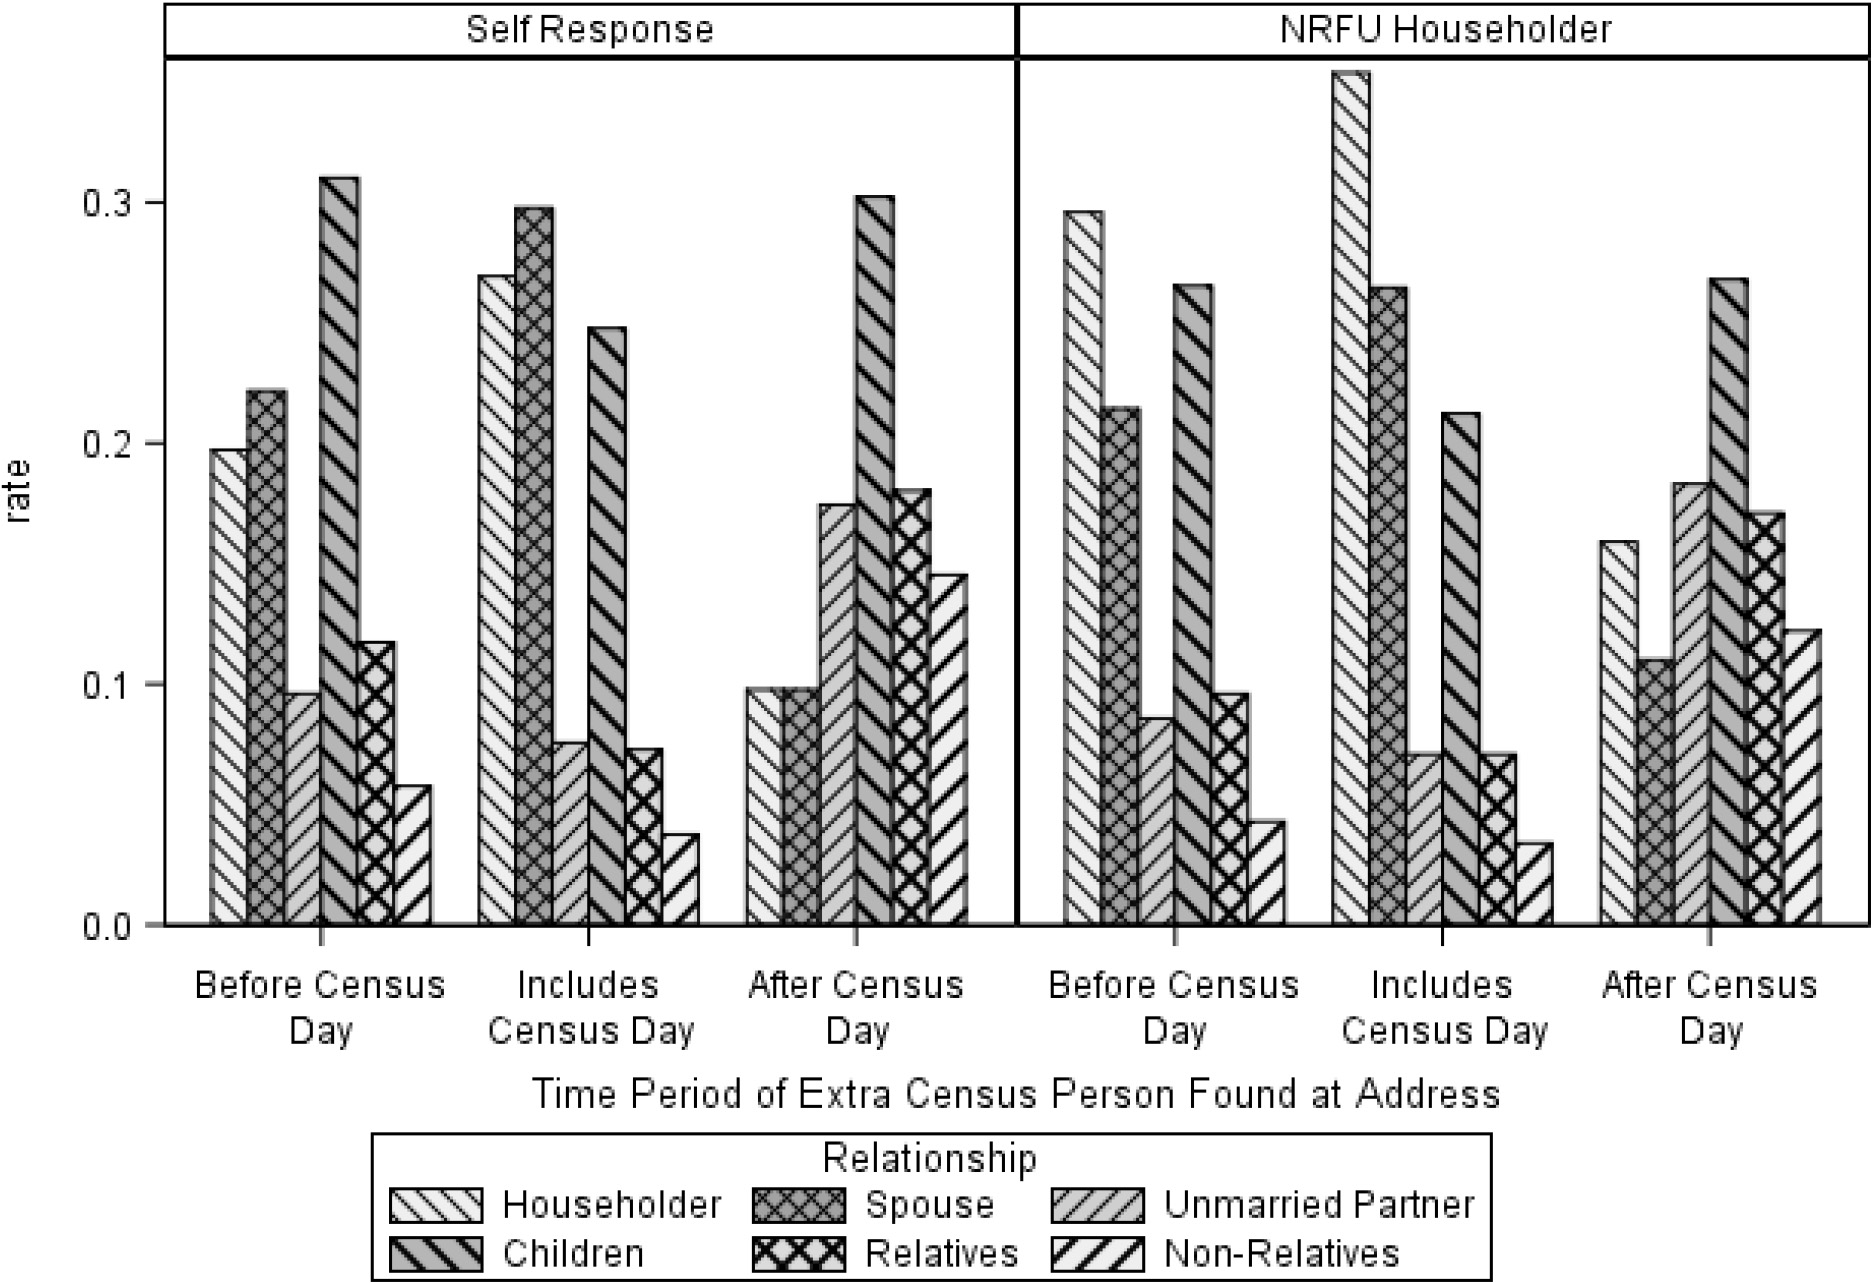
Figure 1 shows the distributions of the relationship of the person on the census roster but not on the AR roster to the householder for self-responses and for NRFU household member responses by the date range of the AR(s) found for the person at the address in the Self-response Verification file. The three date ranges are Before Census Day, Includes (before and after) Census Day, and After Census Day. The proportions for the types of relationship are calculated within each date range and indicated by the shade and pattern of the column.
For some addresses, the census roster and AR roster may disagree because household members filed their IRS 1040 tax returns in October 2020 or later, but the AR modeling process stopped before those returns were delivered. Additionally, children with divorced parents may appear on the census roster at the custodial parent’s address, but also on the AR roster at non-custodial parent’s address if the divorce agreement grants the tax deduction for the child to the non-custodial parent. Designing a method for creating AR rosters that accounts for such situations requires more research.
The similarity in patterns in the distributions of the Relationship to the Householder categories for addresses with a census self-response or NRFU household member response by date group shown in Fig. 1 is noteworthy. The self-responses and NRFU household member responses are thought to be the best census responses and the One-Visit Multiple Source AR rosters have the highest quality so possibly the similarities are to be expected.
The study also examined addresses that had either a census self-response or a NRFU household member response where the One-Visit Multiple Source AR roster had one more person than the census roster. Since the relationship of people on the AR roster to the householder is not available on the datafiles used in creating the AR rosters, the analysis is restricted to investigating whether the extra person was found at the same address or a different address in the Self-response Verification file. Also considered is whether the extra persons had records in the Self-response Verification file before, after, or including (i.e., before and after) Census Day.
Among census self-responses with a person on the One-Visit Multiple Source AR roster but not the census roster, 97.98% of these persons were found at the same address in the Self-response Verification file and 76.05% were found at the address in the time period that included Census Day. The percentages are comparable for addresses with a NRFU household member response and a person on the One-Visit Multiple Source AR roster but not the census roster. At these addresses,97.48% of the extra persons were found at the address in the Self-Response Verification file and 76.05% were found at the address in the time period that included Census Day.
Most of the persons on the One-Visit Multiple Source AR roster for an address but not the census roster when the address has both types of rosters appear to be associated with the address because they were found at the address in the Self-Response Verification file around Census Day. There are reasons why this situation may occur [14]. For example, if a family member is a college student and living in another city, census rules say the student should be enumerated at the college, but the parents may claim the student as a dependent on their tax return which uses the address where the family lives. Creating methodology for identifying the correct location for a family member’s census enumeration when the member appears in ARs at the family address and in the census at a different address is a topic for further research.
Summary
The results of the study show the value ARs can bring to improvements in census enumeration methodology. The evaluation project focused on providing information about AR modeling and AR enumeration that will aid in planning the 2030 Census. In particular, the research concentrated on addresses that had both an AR roster and a census roster and examined whether the two rosters agreed on household size. The analysis was restricted to census self-responses and Nonresponse Follow-up (NRFU) responses from a household member because these are the highest quality census responses. The census rosters were partitioned by the timing of the submission of the response, which were before July 30 and after July 30 for self-responses. and after July 30 for NRFU household member responses. Also considered was the quality category of the AR rosters available for enumerating the address, which are One-Visit Multiple Source, Closeout Multiple Source, and Closeout Household Size Only, listed in the order of their quality,
A key result from Table 7 shows that the 44.54 million addresses with both a One-Visit Multiple Source AR roster and a census self-response submitted by July 30 displayed a household size agreement rate of 83.8% between the two rosters. The original plans for the 2020 Census called for the self-response period to begin on March 12 and last until the end of July, but the disruptions caused by the COVID-19 pandemic caused the self-response period to be extended to October 15. The high level of agreement on the size of the AR roster and the self-response roster implies that AR enumeration has potential for improving the methodology used for future censuses.
Another important result from Table 7 is that the mode of census response and the amount of time between the response and the April 1st reference date impacts the roster size comparisons. Continuing to compare One-Visit Multiple Source AR rosters to census self-responses submitted before July 30 produced a roster size agreement rate of 83.8 percent. A comparison of One-Visit Multiple Source AR rosters to census self-responses submitted after July 30th shows that the household size agreement rate decreased to 74.4 percent. The same comparison to NRFU in-person interview responses after July 31st shows that the agreement rate on household size further decreased to 66.3 percent. Our analysis shows that the mode of response and amount of recall required of the respondent has the potential to introduce errors in census enumerations.
Figure 1 contains information about the relationship of the person to the Householder when the person is on the census roster but not the AR roster at addresses where both types of rosters were available. In addition, Fig. 1 displays whether the extra person was found in AR records at the address in three time periods, Before Census Day, Including Census Day (before and after), and After Census Day. These data provide information that is useful for studying the circumstances where a person is on the census roster but not the AR roster for an address and using the results to develop improvements in AR roster creation for the 2030 Census. We observed children that were on other AR sources and in the 2020 Census, but not on the AR sources used to create AR rosters for the 2020 Census. The improvements could mean pulling in additional AR sources which cover the subpopulations missed by the AR roster creation in the 2020 Census.
The results show the value ARs can bring to improvements in census enumeration methodology. For addresses where the census roster and the AR roster sizes differed by only one person, the analysis used historical person and address information to quantify how often the additional person was associated with the roster address and other addresses and the timing of these associations in relation to Census Day. This information has the potential of being useful in the search to find better ways to account for these types of differences as part of the 2030 Census planning and may aid in identifying other sources and rostering methods to use in the future. More research is needed to identify the important factors in creating AR rosters for census enumeration and to refine the methods used in constructing the AR rosters.