
Abstract
Data cleaning, also referred to as data cleansing, constitutes a pivotal phase in data processing subsequent to data collection. Its primary objective is to identify and eliminate incomplete data, duplicates, outdated information, anomalies, missing values, and errors. The influence of data quality on the effectiveness of machine learning (ML) models is widely acknowledged, prompting data scientists to dedicate substantial effort to data cleaning prior to model training. This study accentuates critical facets of data cleaning and the utilization of outlier detection algorithms. Additionally, our investigation encompasses the evaluation of prominent outlier detection algorithms through benchmarking, seeking to identify an efficient algorithm boasting consistent performance. As the culmination of our research, we introduce an innovative algorithm centered on the fusion of Isolation Forest and clustering techniques. By leveraging the strengths of both methods, this proposed algorithm aims to enhance outlier detection outcomes. This work endeavors to elucidate the multifaceted importance of data cleaning, underscored by its symbiotic relationship with ML models. Furthermore, our exploration of outlier detection methodologies aligns with the broader objective of refining data processing and analysis paradigms. Through the convergence of theoretical insights, algorithmic exploration, and innovative proposals, this study contributes to the advancement of data cleaning and outlier detection techniques in the realm of contemporary data-driven environments.
Introduction
Data can serve as the driving force behind a successful business or as a source of valuable insights to inform strategic campaigns, product launches, and experiments. In fact, all these endeavors are interconnected by one key element: data. In today’s digital era, we generate vast amounts of data on a daily basis, with companies like Flipkart producing over 2TB of data per day. Simply put, data is a systematic collection of digital information in the form of facts and figures extracted from digital interactions. Therefore, before delving into data cleaning, it is essential to understand the main stages of the data life cycle.
Data ecosystem refers to the programming languages, algorithms, packages, cloud-computing services, and general infrastructure an organization uses to collect, store, analyze, and leverage data. There aren’t two data projects similar; each has its own opportunities, challenges, and potential solutions that affect its path. almost all data projects, nevertheless, follow the same basic life cycle from beginning to end. This life cycle can be divided into eight principal phases: Generation, Collection, Processing, Storage, Management, Analysis, Visualization, and Interpretation. However, in this particular endeavor, our emphasis has been placed on the crucial stage of data cleaning [1].
Collecting data from multiple sources is a crucial step in constructing big data repositories to power applications or performing data analysis to obtain richer insights. However, errors such as missing values, typos, mixed formats, repeated entries, and violations of data integrity rules are common during data gathering and acquisition. According to a poll on the state of data science and machine learning (ML), unclean data is the most significant challenge faced by data professionals [2]. As data science gains popularity, it has become clear that data curation, unification, preparation, and cleaning are essential for unlocking the value of data. A survey of 80 data scientists conducted by CrowdFlower and published in Forbes revealed that three data scientists spend more than 60% of their time cleaning and organizing data, and 57% of them consider it the least enjoyable part of their job. Finding effective and efficient data cleaning methods is challenging and poses theoretical and engineering difficulties. Data cleaning is a critical step in the data analysis process, and it is closely related to data collection because the quality of the data being collected will ultimately determine the level of effort required for data cleaning [3].
Data cleaning is the process of identifying and rectifying corrupt or inaccurate records within a dataset, table, or database. It involves detecting incomplete, erroneous, inaccurate, or irrelevant data, and then modifying, replacing, or deleting the affected data. In essence, data cleaning encompasses all tasks and activities related to identifying and resolving errors in data [4]. The aim of data cleaning is to ensure that a dataset is consistent with other similar data sets within the system. Errors in the data may arise due to mistakes in user input, corruption during transmission or storage, or discrepancies in data definitions across different data stores. Data cleaning is different from data validation in that validation typically involves rejecting data at the time of entry, whereas data cleaning is carried out during data entry rather than after data has been entered in batches [5].
In this paper, we delve into the critical task of data cleaning and outlier detection. The first section underscores the significance of data, outlines the primary stages of the data ecosystem, and elucidates the role of data cleansing within the realms of data science and machine learning. The second section provides an overview of data cleaning, including its process, tasks, and challenges. In the third section, we explore the different types and applications of outlier detection, as well as its role in machine learning and the various types of supervision used. We also classify outlier detection techniques and discuss their advantages and disadvantages. Moving on to the fourth section, we present a detailed analysis of outlier detection algorithms, including a comparative analysis of some major algorithms. We also propose a new algorithm based on clustering and Isolation Forest and explain its implementation. Finally, in the last section, we conduct experiments to validate the performance of Isolation Forest and our proposed algorithm. We provide results and discussions on the efficacy of each method. Through this paper, we aim to provide a comprehensive understanding of data cleaning and outlier detection, as well as a practical solution for improving outlier detection algorithms.
Related work
Many research endeavors delve into the realm of data cleaning and outlier detection algorithms, yet our focus rests on selecting the most crucial ones that encapsulate the breadth of research and studies in this domain. The following is a selection of notable articles that contribute to this discourse: E Rahm et al. [6] delve into the intricacies of data cleaning: problems and current approaches, while H Müller et al. [7] provide insights into problems, methods, and challenges in comprehensive data cleansing. The work of Xu et al. [8] sheds light on data cleaning in the process industries, while Chu et al. [9] expound upon data cleaning: overview and emerging challenges. Ridzuan et al. [10] engage in a review on data cleansing methods for big data. Additionally, Xu et al. [4] provide insights into data cleaning tasks, Pahuja et al. [11] present a review on outlier detection for different applications, and Zhang [12] provides a comprehensive survey of advancements in outlier detection. Moreover, Divya et al. [13] delve into methods to detect different types of outliers, Mandhare et al. [14] provide a comparative study of Cluster-Based outlier detection, Distance-Based outlier detection and Density-Based outlier detection techniques, Wang et al. [15] provide an ongoing survey of progress in outlier detection techniques, while Karczmarek et al. [16] explore a Fuzzy c-means-based isolation forest. Lastly, the work of Mensi et al. [17] uncovers Enhanced Anomaly Scores for Isolation Forests. This collective literature covers also emphasizes the integration of clustering methods with other algorithms to achieve optimal results in outlier detection. Furthermore, numerous books extensively delve into the realm of utilizing machine learning for data cleaning and detecting outliers. Notable works that deserve mention include Outliers Analysis, Second Edition authored by Charu et al. [18], the comprehensive work Data Cleaning realized by Ihab et al. [4], and the volume Data Preparation for Machine Learning, which covers data cleaning, feature selection, and data transformations in Python, crafted by Brownlee [5]. These literary works serve as valuable sources that provide substantial emphasis on effectively incorporating machine learning methodologies to address data cleaning and outlier detection challenges.
Data cleaning
Processed and organized data may contain duplicates, obsolete information, missing values, or errors. When combining multiple data sources, there are numerous opportunities for data to be duplicated or mislabeled. Inaccurate data can lead to unreliable algorithms and outcomes. Data cleaning is a critical process in data analysis as it ensures that data is free from inaccurate or corrupt information, ultimately improving the overall quality of the data. Data quality issues can arise not only in single data sets, such as files and databases, but also in multiple data sources, such as data warehouses, federated database systems, or global web-based information systems. Consequently, the need for data cleaning has become increasingly important. As the process of data cleaning differs from dataset to dataset, there is no single absolute way to determine the exact steps involved [6,10,19,20].
Data cleaning process
Data cleaning, a pivotal aspect of data preparation, undergoes a systematic process to enhance data quality. This process, guided by Ridzuan and al, comprises distinct stages. First, in the data analysis phase, potential errors, discrepancies, and missing values are identified. Following this, the transformation phase involves crafting workflows and mapping rules to address the detected issues. Subsequently, data verification ensures the effectiveness of the cleaning procedure and the upliftment of data integrity. Transitioning into the transformation phase, the actual cleaning takes place, where issues are resolved, and data is purged of inconsistencies. Ultimately, the backflow phase entails revalidating the cleaned data, assuring its quality for downstream use (Fig. 1). This comprehensive procedure, championed by authors such as Abdelaal and their contemporaries, aims to eradicate errors and inaccuracies, rendering data optimally prepared for subsequent stages of the data life cycle, notwithstanding the intricate challenges encountered. [6,10].
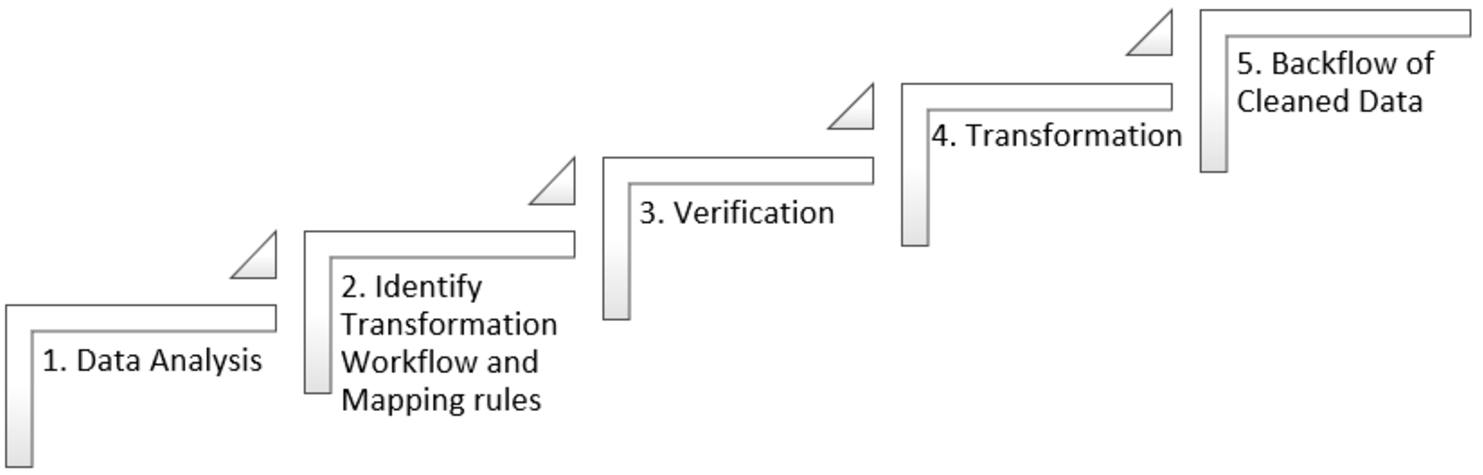
Data cleaning process.
Data cleaning performs several tasks to finally have useful and ready data to use in the next stage of the data life cycle. Specifically, Chu and al cover four of the most common and important data cleaning tasks, namely, outlier detection, data deduplication, data transformation, and data imputation. Since there is a very large number of work on these tasks. Data cleaning is a key step in various data analytics. many data cleansing tasks target different types of errors [4].
Data cleaning challenges
Data cleaning is a complex and challenging task that involves various obstacles that can impact the quality and accuracy of data. Some of the common challenges of data cleaning according to Cai and al include [25]:
Outliers detection
As per Liu and al an outlier is an observation that looks different from the rest of that set of data. Term outlier originates from statistics. Informally, an outlier can be explained as every information which occurs to be dissimilar with reverence to the remainder data. Many definitions have been suggested for outliers, such as outlier is defined as outline study. Second definition proposed by Barnett and Lewis that an outlier is an observation that appears to be inconsistent with the rest of that set of data [5]. It is an anomaly in the dataset that may be produced by a range of errors in catching, treating or processing data. They are rare, distinct, or do not fit in some way. For Example, you can visibly see the outlier in this list: [15,23,20,19,29,18,7800,32,17] [26].
Outlier detection, also known as anomaly detection as stated by Wang al, is the process of identifying data points that are significantly different from other data points in a given dataset. An outlier or anomaly is a data point that does not follow the expected pattern or behavior of the rest of the dataset. The detection of outliers can be performed using statistical techniques, machine learning algorithms, or a combination of both [15,26].
Outliers detection types
As indicated by Divya and al, there are three types of outliers relevant to machine learning models; point outliers, contextual outliers, and collective outliers. Each type differs by how the anomalous data can be observed and what makes the data point stand apart from the rest of the data set. Types are a key consideration for outlier analysis as each has a different pattern to detect [13].
As per Wang and al Outliers can be categorized into different types, such as vector outliers, sequence outliers, trajectory outliers, and graph outliers, depending on the types of data being analyzed [15].
Outliers detection applications
Anomaly detection has numerous applications in various fields according to Pahuja, Chandola, Wang, Aggarwal, and al. These applications encompass [11,15,18,28]:
Outlier detection in machine learning
Outlier Detection in Machine Learning is an essential consideration in the development and deployment of machine learning models and algorithms. Accuracy of data is crucial during the development and training of algorithms, and outlier detection is performed after deployment to ensure the effectiveness of models. Models are generally developed to implement outlier detection for various organizations that depend on huge datasets to function.
The identification of outliers in training datasets is a necessary phase of ensuring higher-quality data. Machine learning algorithms depend on huge arrays of accurate data to learn spot and trends patterns. Machine learning models learn from data to understand the trends and relationships between data points. Concerning supervised machine learning models, a data scientist may detect and delete outliers when preparing and labeling training data. However, for unsupervised machine learning models that categorize unlabelled datasets, outlier detection may need to be performed later in the analysis. This can add extra time and resources to the machine learning process. Outlier detection remains crucial for the ongoing maintenance and surveillance of machine learning models.
Once machine learning models are deployed, they need to be continually monitored to ensure ongoing accuracy. A rise in abnormal data or recurring outliers within predictive models can signal a concept drift. The challenge here is to determine whether an outlier points to a systemic issue with the model. In case it does, the model can be retrained or recalibrated for better efficiency. Apart from training and monitoring, outlier detection often forms a critical component of a machine learning algorithm’s intended use. Algorithms that are trained to classify data or detect trends can also identify anomalies through outlier detection. For instance, machine learning is widely used in finance to identify fraudulent transactions. Through outlier detection methods, the model detects any activity that lies outside the normal account behavior, and this information can be used to freeze the account and escalate the issue for human intervention. There are various supervised and unsupervised outlier detection methods available, including k-nearest neighbors, local outlier factor, isolation forest, and one-class support vector machines. These methods can be used to identify outliers in different types of data and can be tuned for optimal performance [18].
Types of supervision in outlier detection
Outlier detection can be performed using various methods that differ in the amount of supervision required. Generally, three types of supervision can be identified: supervised, unsupervised, and semisupervised outlier detection [13,28]. These methods utilize different strategies to classify data points as normal or outliers, such as using a training dataset with labeled normal and outlier data, clustering techniques, or assuming the availability of labeled instances for only one class.
Eventually, outlier detection identifying what is a regular data pattern and what is an outlier may be challenging because what is deemed normal varies depending on the data and application [29]. To characterize normal behavior, several alternative detection approaches have been presented. As the number of dimensions (attributes) in the dataset gets enormous, many outlier identification approaches lose their efficacy; this phenomenon is known as the curse of dimensionality.
Taxonomy of outlier detection techniques
Various techniques have been developed to detect outliers, each with its strengths and weaknesses. One way to categorize outlier detection techniques is by the approach they use to identify outliers. This classification includes statistics-based methods, distance-based methods and model-based methods (Fig. 2):
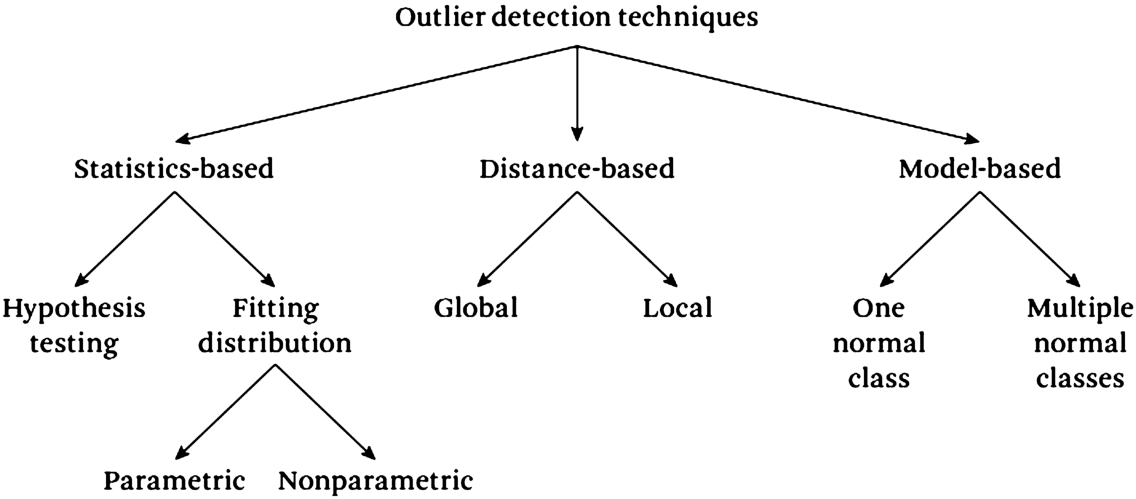
Classification of outlier detection techniques.
Statistics based techniques have many advantages such as:
If the underlying data follows a specific distribution, then the statistical outlier detection techniques can provide a statistical interpretation for discovered outliers. Statistical techniques usually provide a score or a confidence interval for every data point, rather than making a binary decision. The score can be used as additional information while making a decision for a test data point. Statistical techniques usually operate in an unsupervised fashion without any need for labeled training data.
But there is also many disadvantages such as:
Statistical techniques usually rely on the assumption that the data is generated from a particular distribution. This assumption often does not hold true, especially for high-dimensional real datasets.
Even when the statistical assumption can be reasonably justified, there are several hypothesis test statistics that can be applied to detect anomalies; choosing the best statistic is often not a straightforward task. In particular, constructing hypothesis tests for complex distributions that are required to fit high-dimensional datasets is nontrivial [30].
There are many advantages of distance-based techniques:
A major advantage of distance-based techniques is that they are unsupervised in nature and do not make any assumptions regarding the generative distribution of the data. Instead, they are purely data-driven. Adapting distance-based techniques to different data types is straightforward, and primarily requires defining an appropriate distance measure for the given data.
There are disadvantages of distance-based technique:
If the data has normal instances that do not have enough close neighbors, or if the data has anomalies that have enough close data points, distance-based techniques will fail to label them correctly.
The computational complexity of the testing phase is also a significant challenge since it involves computing the distance of every pair of data points.
Performance of a nearest neighbor-based technique greatly relies on a distance measure, defined between a pair of data instances, which can effectively distinguish between normal and anomalous instances. Defining distance measures between instances can be challenging when the data is complex, for example, graphs, sequences, and so on.
The advantages of model-based techniques include:
Model-based techniques, especially the multiclass techniques, can make use of powerful algorithms that can distinguish between instances belonging to different classes. The testing phase of model-based techniques is fast, since each test instance needs to be compared against the precomputed model.
The major disadvantages of model-based techniques is that they must rely on the availability of accurate labels for various normal classes, which is often not possible.
Outlier detection algorithms methodology
In this section, we will conduct a comparative study of several outlier detection algorithms, including Isolation Forest [34], Local Outlier Factor [35], Minimum Determinant Covariance [33], and One-Class SVM [36]. Firstly, we will select a conventional machine learning dataset and establish a baseline performance. This will serve as the reference point for the subsequent session, which will focus on outlier detection and removal techniques in data preparation. Each technique will be defined and then fitted to the training dataset. After that, the fitted model will predict whether each sample in the training dataset is an outlier or an inlier. Outliers will be removed from the training dataset before fitting the model to the remaining samples and evaluating its performance on the entire test dataset. Fitting the outlier detection technique to the entire training dataset is not appropriate because it would result in data leakage, which means that the model would have access to test set data that was not utilized during training. As a result, the model’s performance may be overestimated. Therefore, we should attempt to identify outliers in “fresh data,” such as the test set, before generating predictions.
The dataset used in this study is the House Price Regression dataset is a popular dataset used in machine learning for regression tasks, which includes 13 input variables describing the properties of the house and suburb. The goal is to predict the median value of houses in the suburb in thousands of dollars. When you examine the raw data, you’ll see that the first few rows of data are displayed below. As we can see, it is a regression predictive modeling problem with numerical input variables of various sizes.
Comparative analysis of outlier detection algorithms
After examining various outlier detection algorithms and their complexity, we performed a benchmarking study on four algorithms: Isolation Forest, Local Outlier Factor, Minimum Covariance Determinant, and One Class SVM. Based on the benchmark results, Isolation Forest had the best performance with the minimum mean absolute error. However, before proposing a solution to improve the number of outliers detected with minimum calculations, it is important to understand the complexities of these algorithms.
Isolation Forest stands out as it does not require distance or density measures to detect anomalies, which reduces the computational cost of distance calculation in other methods. This results in a linear time complexity with a low constant and a low memory requirement. Additionally, Isolation Forest can handle extremely large data sizes and high-dimensional problems with many irrelevant attributes.
On the other hand, the Local Outlier Factor algorithm (LOF) is density-based and identifies local outliers by assigning a degree of outlierness called the local outlier factor (LOF). However, LOF’s computation time grows exponentially with the number of dataset dimensions, known as the curse of dimensionality. This can lead to high computational complexity, particularly for high-dimensional data.
The Minimum Covariance Determinant (MCD) algorithm is useful when the dataset has two input variables and both are Gaussian, as the feature space forms a multi-dimensional Gaussian distribution. However, MCD is limited by the requirement that the dimension p must be less than the number of observations in any h-subset to be non-singular, resulting in a void in the availability of high breakdown techniques for “fat data” with fewer observations than variables.
Lastly, the One Class SVM algorithm uses supervised learning for knowledge training and gives a global solution for data classification. However, it has a high time complexity and can be complicated to implement. In summary, based on my analysis, Isolation Forest is the most promising algorithm for outlier detection in large, high-dimensional datasets with many irrelevant attributes.
Comparison of outlier detection algorithms based on performance, execution time, advantages, and disadvantages
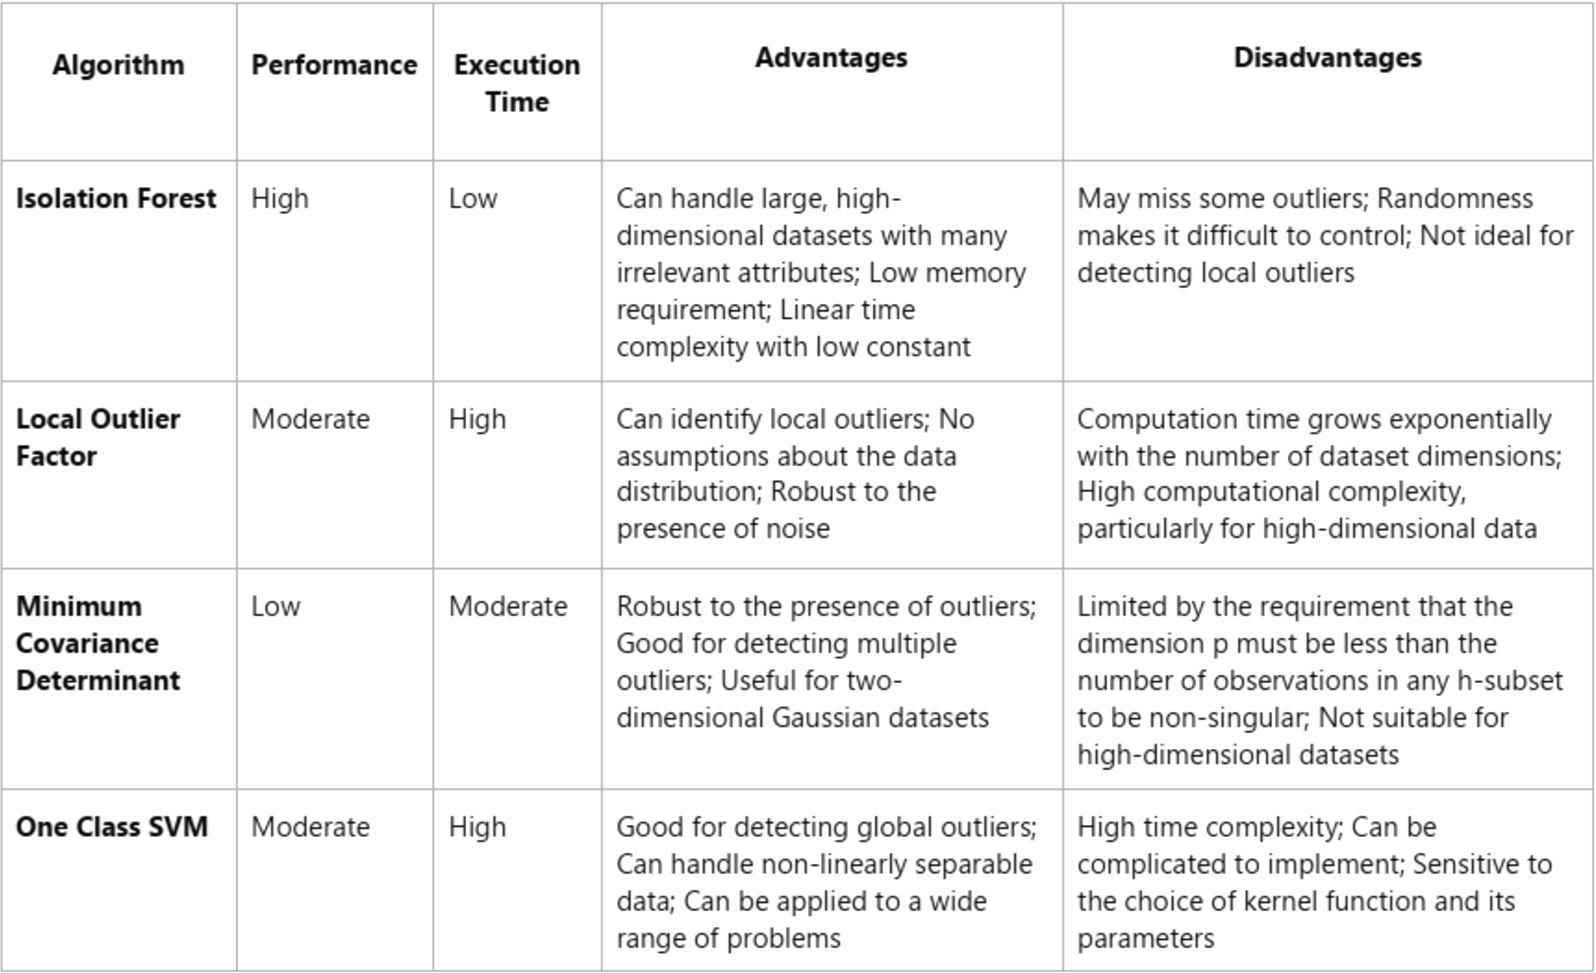
Comparison of outlier detection algorithms based on performance, execution time, advantages, and disadvantages
The table compares four outlier detection algorithms: Isolation Forest, Local Outlier Factor, Minimum Covariance Determinant, and One Class SVM – based on their performance, execution time, advantages, and disadvantages. One potential approach is to utilize a clustering algorithm to group similar data together, and then apply the Isolation Forest algorithm to each cluster individually. By doing so, the algorithm can run pathlength on the data without being affected by unrelated data points. This approach can improve the detection of local outliers.
To address the issue with the Isolation Forest algorithm, we propose merging the iForest model with a clustering algorithm. This involves slicing the dataset into subsets using the clustering algorithm and then running the Isolation Forest algorithm on each subset. This approach reduces the number of subsets generated and also fixes the problem with path length calculation, which is related to the anomaly score calculation. For the clustering step, we have chosen the K-means algorithm [37].
K-means Clustering is a vector quantization approach derived from signal processing that seeks to divide n observations into k clusters, with each observation belonging to the cluster with the closest mean (cluster centers or cluster centroid), which serves as the cluster’s prototype. As a result, the data space is partitioned into Voronoi cells. Within-cluster variances (squared Euclidean distances) are minimized by k-means clustering, but not regular Euclidean distances, which would be the more difficult Weber problem: the mean optimizes squared errors, but only the geometric median reduces Euclidean distances. Better Euclidean solutions, for example, can be discovered by employing k-medians and k-medoids. There is multiple inherited algorithms from the k-means clustering algorithm but the standard algorithm employs iterative refining. Because of its prevalence, it is commonly referred to as “the k-means algorithm”; it is also known as Lloyd’s algorithm, notably in the computer science community. It is also known as “naive k-means” because there are considerably quicker alternatives. The method proceeds by alternating between two stages, given an initial set of k means m1(1),…,mk(1).
The result of the k-means algorithm will be sub datasets that will applicate the Isolation Forest algorithm which will calculate the pathlength of every subset separately from the other subsets, it basically considers every cluster as a new dataset, this will enhance the probabilities of detecting the local outliers. Depnding on every clusters size we can either calculate it’s probabilities or consider the whole cluster as a group of outliers, for example if the majority of the clusters is > 20000 rows and we have 2 or 3 clusters with a size close to 1000, then my proposal consider it as a group of outliers. This preserves the time of executing the algorithm.
Experiments and results
Isolation forest implementations
In the first part, Isolation Forest is generated with external and internal nodes. The external node contains only one parameter, which is the size, and the internal node contains left and right nodes, split attributes, and split values. The second segment defines the iForest class, which requires three attributes: X for the dataset, noOfTrees for the number of trees in the forest, and sampleSize for subsampling. The iForest contains an nd array named forest and a variable named hlim, which is calculated as log2 of the sample size. The for loop takes a sample from the dataset X with the same sample size and self-calls the same class iForest, and appends the sample named Xtrain as a tree. The iForest class stores the itrees object and subsamples. The third step defines the Isolation-tree class, which requires attributes X for the dataset, the height of the tree in the forest, and the hlim that we have calculated in the iForest class. The Isolation-tree class stores the node as external whenever the height is above or equals the hlim or the length of the dataset is less or equals 1. When one of these two conditions is not satisfied, it stores the current tree as a left node with the data sample, which has a random q that is less than the value of the q index in the dataset. If the data sample has a value greater than or equal to the value of q index, it is stored as a right node. The final task is the pathlength calculation class, which takes three attributes: X for the dataset, the desired tree to calculate the length, and currentHeight.
To test this approach, we use a credit card dataset with many transactions and define the anomaly transactions. The dataset contains 30 columns, and we randomly select 100000 rows from the data as a training set and a sample size of 20000 rows to make the forest. After successfully making the forest, we calculate the pathlength for each data point. After plotting the data, we observe that the points with the lowest pathlength are the anomalies, and there is no anomaly with a long pathlength.
Proposal implementation:
In this section, we will implement our algorithm and evaluate its performance in detecting outliers, including local outliers, on the dataset used for The Third International Knowledge Discovery and Data Mining Tools Competition. This database contains a standardized set of data for auditing purposes and includes a wide range of simulated intrusions in a military network environment. Initially, we load the dataset to make necessary changes before applying the algorithm. We examine the first five rows of the dataset and observe that it contains several categorical columns. Before handling these columns, we remove the rows that have empty data (NA’s) and assign column headers. The resulting first five rows of the dataset are presented below. Next, we define a function to analyze the data and plot the results. (Fig. 3) illustrates the outcome of the analysis.
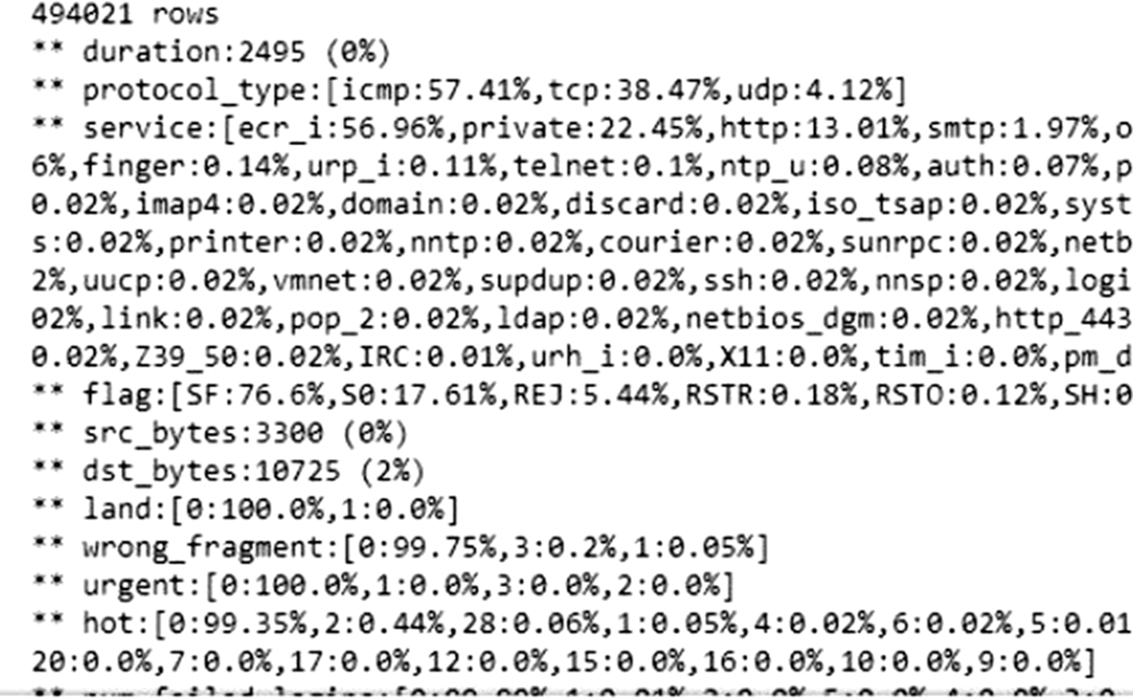
Outcome of the analysis.
Next, we will create two functions to preprocess the data. The first function encodes Z-Scores for each column, and the second creates dummy variables from the categorical columns. We will then use these functions to encode the feature data. The outcome column specifies the type of attack. A value of ‘normal’ indicates that no attack is currently ongoing. We have found that certain attack types are far more common than others, so to reduce the computational load, we will consider every non-normal connection as an anomaly. The next step is to cluster our data using the k-means algorithm. Firstly, we need to specify an appropriate value for k. To do this, we will use the elbow curve method.
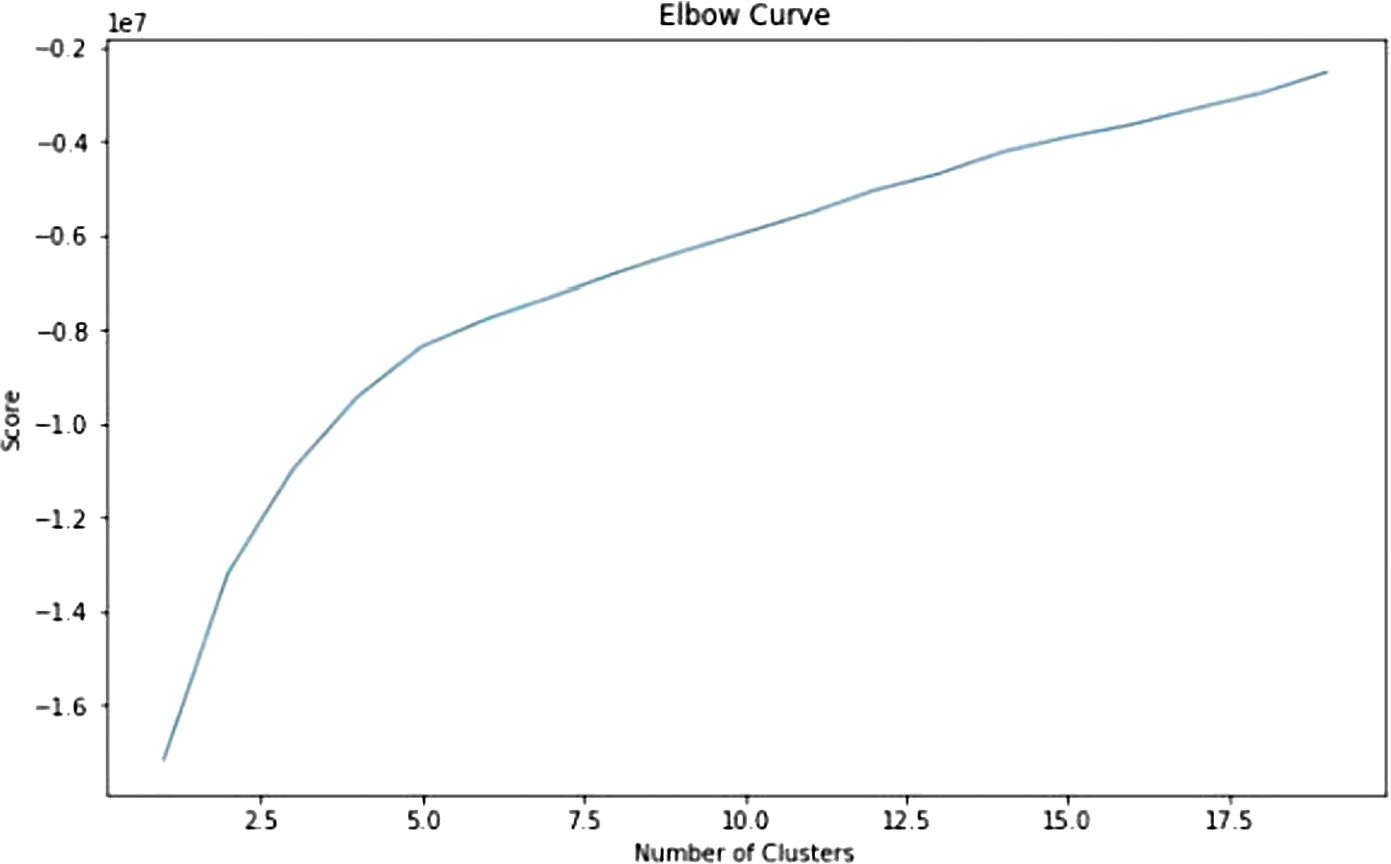
Elbow curve for clusters.
The elbow method runs k-means clustering on the dataset for a range of values for k (e.g. from 1 to 20) and then computes an average score for all clusters for each value of k. After examining the curve, we see that the score doesn’t change significantly after k = 15 (Fig. 4), so we will use this value for our analysis. (Note: 5 and 10 are also good values to consider).
We will run the k-means clustering algorithm with k = 15 and transform our data using the k-means transform method (Fig. 5), which transforms the dataset to a cluster-distance space. After the clustering is done (Fig. 6), we will extract all the data points and store them in an nd array based on which cluster they belong to, and we will use the last column as the validation column which indicates whether the connection is normal or not.
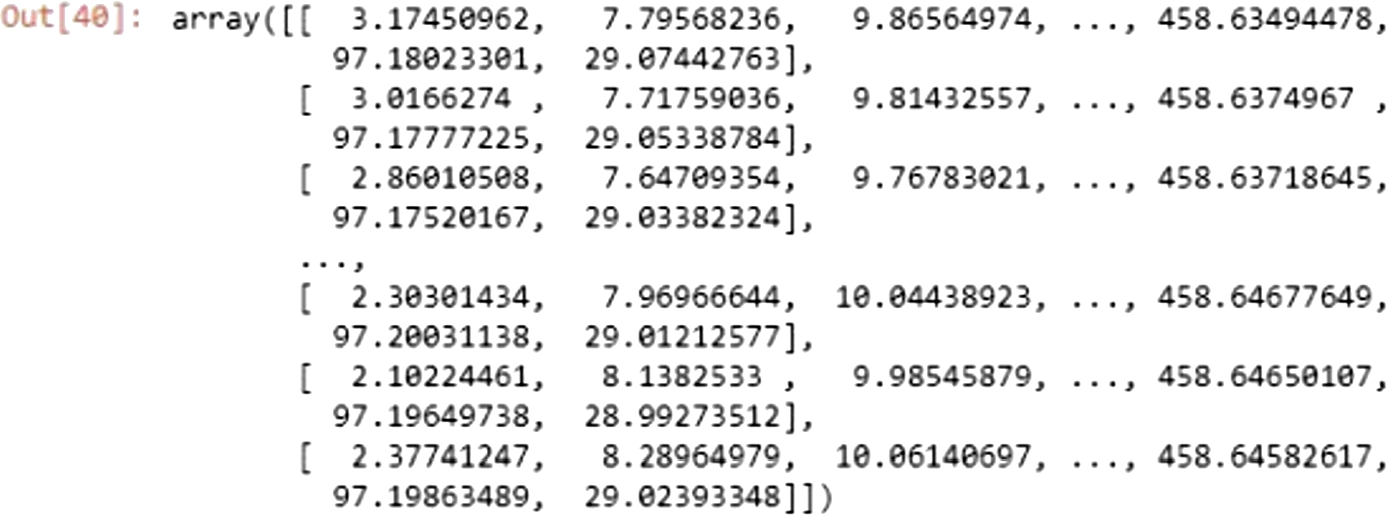
Dataset transformation.
Created clusters.
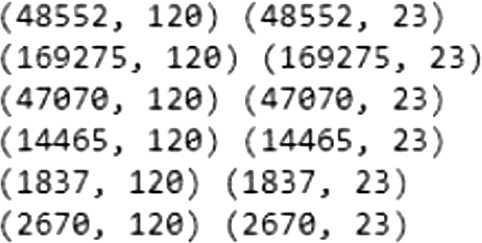
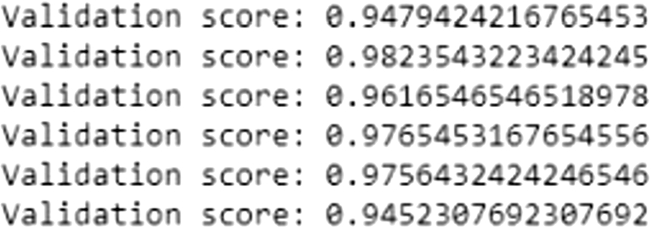
Then for each subset we will split them into small x_train x_test and y_train and y_test datasets and reshape our data into the same shape of the original data (which is 1,120) We see that the 9th dataset contains a single row which automatically means that it’s an outlier. We will also consider the (3,5,7,8,9,11,12,13,14) as a group of outliers based on the size difference between them and the other subsets.After it’s done, we simply select all rows that don’t contain outliers and summarize the shape of out dataset. Then we will fit our model and evaluate it with y_hat column and calculate the validation score between the predicted y_eval and the actual y_test. We observed that our model yielded superior results to the algorithm with an overall accuracy of 98% (Fig. 7).
Validation score.
Data cleaning is a vital process in ensuring that the data used for machine learning is accurate and reliable. Outlier detection is an essential task in data cleaning, and various techniques have been developed to detect outliers. We have discussed statistics-based, distance-based, and model-based outlier detection techniques. Additionally, we benchmarked major outlier detection algorithms and proposed a new algorithm that combines k-Means clustering and Isolation Forest for improved results. Our proposed algorithm achieved an accuracy of 98%, albeit with a higher time complexity. In future work, we propose the use of autoencoder algorithms to address the time complexity issue and predict future results accurately.
While writing this article, we realized that there are many other topics related to data cleaning that we didn’t cover, such as rule-based data cleaning approaches that discover and fix mistakes based on data quality standards, which are often referred to as different types of integrity constraints. However, manually developing data quality rules is a time-consuming task that requires human knowledge, so researchers have developed approaches for automatically identifying data quality rules in various languages. Despite the progress in data cleaning research, academic solutions are seldom implemented in practice. Most of the current data cleaning methods are inadequate for dealing with real-world situations where errors interact in complex ways. Additionally, many approaches are not scalable, either requiring several runs through the entire dataset or being quadratic in complexity. Finally, there is often a gap between where errors are generated and where they are detected. In conclusion, the effectiveness of data cleaning methods depends on the quality of the input dataset and where the data is harvested from. In other words, if the input data is of poor quality or insufficient, the chances of obtaining significant and informative data as output are low. On the other hand, having a well-harvested dataset that adheres to certain rules can increase the probability of obtaining useful results.
Conflict of interest
None to report.