
Abstract
Radio Frequency Identification (RFID) is a burgeoning technology pivotal for optimizing intricate supply chains. Although its potential benefits in healthcare and pharmaceuticals are substantial, RFID implementation in these sectors has been slow-moving. Surprisingly, limited research has probed RFID performance on pharmaceutical products and their packaging. This study aims to explore the influence of diverse liquid drug formulations on RFID performance, utilizing a pre-optimized Ultra High Frequency (UHF) RFID tag. Five distinct drug formulations, encompassing water, saline, and lipids, were studied, alongside deionized (DI) water and empty vials as control subjects. The products were transferred to separate vials, each affixed with a pre-optimized UHF RFID tag. Performance evaluations, including Threshold Sweep, Orientation Sweep, and Population Analysis, were conducted to assess tag readability, focusing on sensitivity, backscatter, and theoretical read range. The results underscore how the composition of different pharmaceutical drug formulations significantly impact RFID tag readability in a controlled, reflection-free environment. These findings provide valuable insights for designing intelligent packaging to enhance the readability of RFID-tagged pharmaceutical products.
Introduction
In the healthcare industry, particularly within the pharmaceutical sector, the introduction of complex supply chains and the shift towards digitalization and online sales have given rise to a range of challenges. These challenges include the production of counterfeit drugs, diminished product quality, untraceable transportation of drugs, and the limited customer involvement in the entire supply chain process (Abdallah & Nizamuddin, 2023). Such issues have been highlighted as areas of concern, as they have the potential to negatively impact public health, increase costs, and compromise the integrity of the pharmaceutical supply chain. These complex and multifaceted supply chain issues have led pharma manufacturers to look more closely at the topic of Industry 4.0, which has been described as the fourth industrial revolution, and includes the advent of technologies such as artificial intelligence (AI), internet of things (IoT) and radio frequency identification (RFID) (Saha et al., 2022).
RFID is a sightless wireless communication technology that is used to obtain real-time data which may be linked to identification attributes (Chetouane, 2015) such as serial number, lot number and expiration date. All of which are crucial identifying factors within the pharma industry. A UHF RFID tag contains an integrated circuit, tag antenna, and an inlay. A multitude of RFID tag designs and materials are employed to optimize the success of an implemented RFID system in a supply chain depending on environmental factors and cost (Bouazza et al., 2019; Hsieh & Cheng, 2007). The data collection process is facilitated by an exchange of radio waves between an RFID transponder (tag) attached to an object and an RFID interrogator (reader) (Ajami & Rajabzadeh, 2013).
Common hurdles connected with RFID systems can be associated with environmental factors that affect the electromagnetic performance required to garner an effective tag response. It is frequently incorporated into assessments of RFID systems to test the performance of tags in the presence of metals and liquids, as they are the primary contributors to this disruption (Bertolini, 2009). Deionized water can be used to test in instances where the substances have similar electric permittivity (Caredda et al., 2016), but this is not always the case. The vast arrangement of substances contained in drugs contribute heavily to the varied effects they can have on RF performance (Maffia et al., 2012).
The use of RFID has grown largely over the last few years, especially in terms of number of RFID tags sold (Costa et al., 2021). As mentioned in the 2022 RAIN Alliance Report on Global Markets and Applications from VDC Research, the worldwide RAIN RFID market was estimated to exceed $3 billion in 2021 (RAIN RFID Market Research Report, 2022). This estimation encompasses various components, such as finished tags/transponders, fixed readers, handheld scanners, and printer/encoders. Specifically, there were approximately 28.9 billion units of tag Integrated Circuit (IC) shipments in 2021, while finished tag/transponder units amounted to 27.7 billion units. Furthermore, reader shipments surpassed 261,000 units. This in part is due to the new chipsets available for High Frequency Near -Field Communication (HF - NFC), and Ultra High Frequency (UHF) ranges making it easier and cheaper to build, coupled with the wide scale adoption of RFID reader infrastructures across markets (Costa et al., 2023). The implementation of RFID in the pharma industry is extremely beneficial for increasing visibility and safety in a supply chain. Despite this recognized value in enhancing patient safety through the mitigation of medical errors and the prevention of counterfeit drugs entering the illicit market (Profetto et al., 2022), adoption has been slow. Integrating RFID technology into a supply chain has shown to lower cost, improve product quality/safety, minimize inventory discrepancy, improve real time information exchange, enhance data integrity, improve visibility, and collect large amounts of data in a short amount of time (Bevilacqua et al., 2013; Sriram et al., 2021; Vlachos, 2013). Although RFID technology has come a long way, there are still plenty of issues, such as cost effectiveness for maintenance and testing, difficulty training, ethical and privacy issues, and narrow channel bandwidth (Abugabah et al., 2020; Bevilacqua et al., 2013). These issues affect the large-scale implementation into the healthcare and pharmaceutical industries. In terms of RFID technical feasibility, RFID performance and testing is one issue that needs to be widely studied and clarified. Research surrounding the optimization of tag positioning, antenna angles, and orientation of a tag on a container is available (Buyurgan et al., 2007; Rossi et al., 2023; Wang & Alexander, 2014). Others studied the effect of material compositions on RFID feasibility (Gonçalves et al., 2014; Wang et al., 2022). Two of the most known environmental factors that greatly reduce RFID readability and performance are in the presence of polarized liquids and metals (He et al., 2019; Periyasamy & Dhanasekaran, 2014; Yu & Qu, 2020). Both are found widespread throughout pharmaceutical products. Another limitation in this field is the lack of testing laboratories with the authorization to receive, store, and test on controlled substances and other types of critical pharmaceutical drugs. This has pushed the researchers toward testing on practice solutions, which although are similar to the real drug formulations they do not include the same exact components and thus might affect the accuracy of the results (He et al., 2019; Periyasamy & Dhanasekaran, 2014; Rossi et al., 2023; Yu & Qu, 2020).
To the best of our knowledge, scarce research has addressed the assessment of the influence of various liquid drug formulations in proximity to UHF RFID tags (Barge et al., 2019; Zhang et al., 2023). Thus, the objective of this study was to investigate the impact of diverse liquid drug formulations on RFID performance by leveraging a pre-optimized UHF RFID tag. Five major drug formulations were used in this study and the results were compared with deionized water and an empty vial. The selected drugs cover the wide range of available drug formulations from water-based to lipid-based formulations. The major performance characteristics of the tagged products were assessed. These included tag tuning frequencies, sensitivity, backscatter, and orientation pattern (Nikitin & Rao, 2009; Wang & Alexander, 2014). Complications with tag readability tend to occur when in a dense population (Ustundag et al., 2007), thus the effect of tag interaction in a population was also assessed. The results of this study will be able to shed new light on how different complex liquids could impact the performance of the UHF RFID. Understanding of the product-tag interaction will facilitate the adoption and implementation of the RFID into the pharmaceutical industry. Results can also be used to predict the RFID performance for food applications with similar properties extending the topics explored by Rossi et al., 2023 (Rossi et al., 2023).
Materials and methods
Drug formulations and RFID tags
Vials of Progesterone (500 mg/10 mL), Sensorcaine-MPF (50 mg/10 mL), Etoposide (100 mg/5 mL), Potassium Phosphate (10 mM/5 mL), Polymyxin B (500,000 units/10 mL) and empty 10 mL sterilized clear glass vials were provided by Fresenius Kabi located in Lake Zurich, Illinois, USA. Empty vials and vials filled with deionized (DI) water were used as the control samples. Drugs were kept in closed containers prior to analysis. It should be noted that the glass vials used for testing included metal caps in the top portion of the vial, which is known to prevent RF waves from passing through via reflecting (Catarinucci et al., 2012).
UHF RFID tags were provided by eAgile located in Grand Rapids, Michigan, USA. The tags label dimensions are 83 mm×35 mm with antenna dimensions of 70 mm×3 mm (Fig. 1).
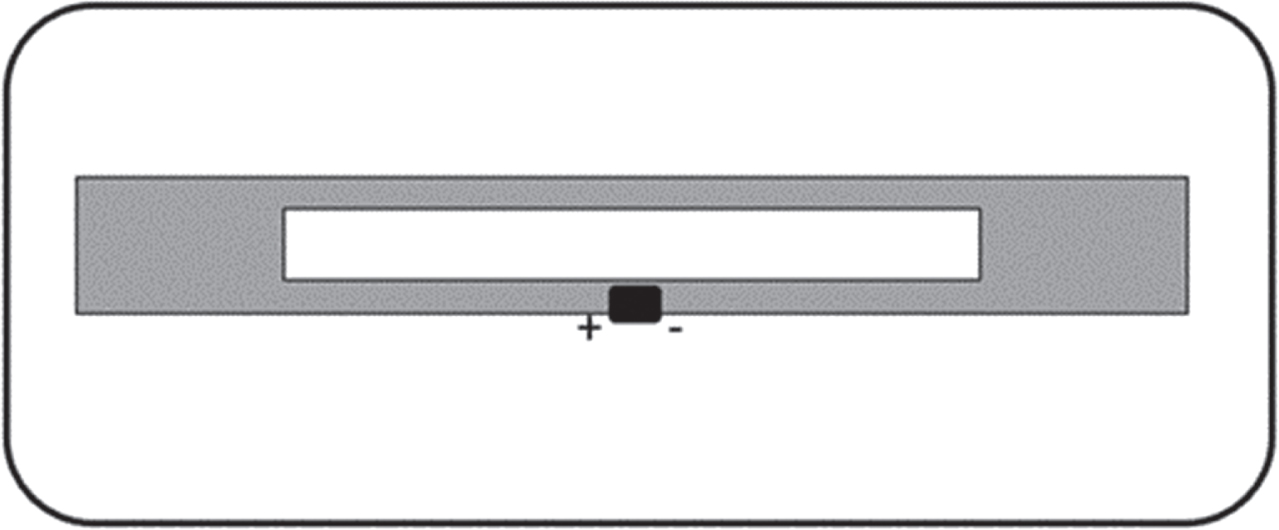
UHF RFID tag design used in this study.
The tag is operating at a UHF band of 915 MHz within the 902–928 MHz Federal Communications Commission (FCC) approved North America UHF regulation range. The cavity helps with providing a wider bandwidth than a straight dipole but shares a similar radiation pattern and the antenna is omnidirectional owing to an isotropic radiation pattern.
Vials filled with the drug formulations or DI water as well as empty vials were tested individually or in a group of nine (for population analysis) using a C50 anechoic chamber equipped with the Tagformance pro software provided by Voyantic Ltd located in Helsinki, Finland (Colella et al., 2016). The anechoic chamber shown in Fig. 2 is a highly sophisticated measurement system used for evaluating the functionality and performance of UHF RFID.
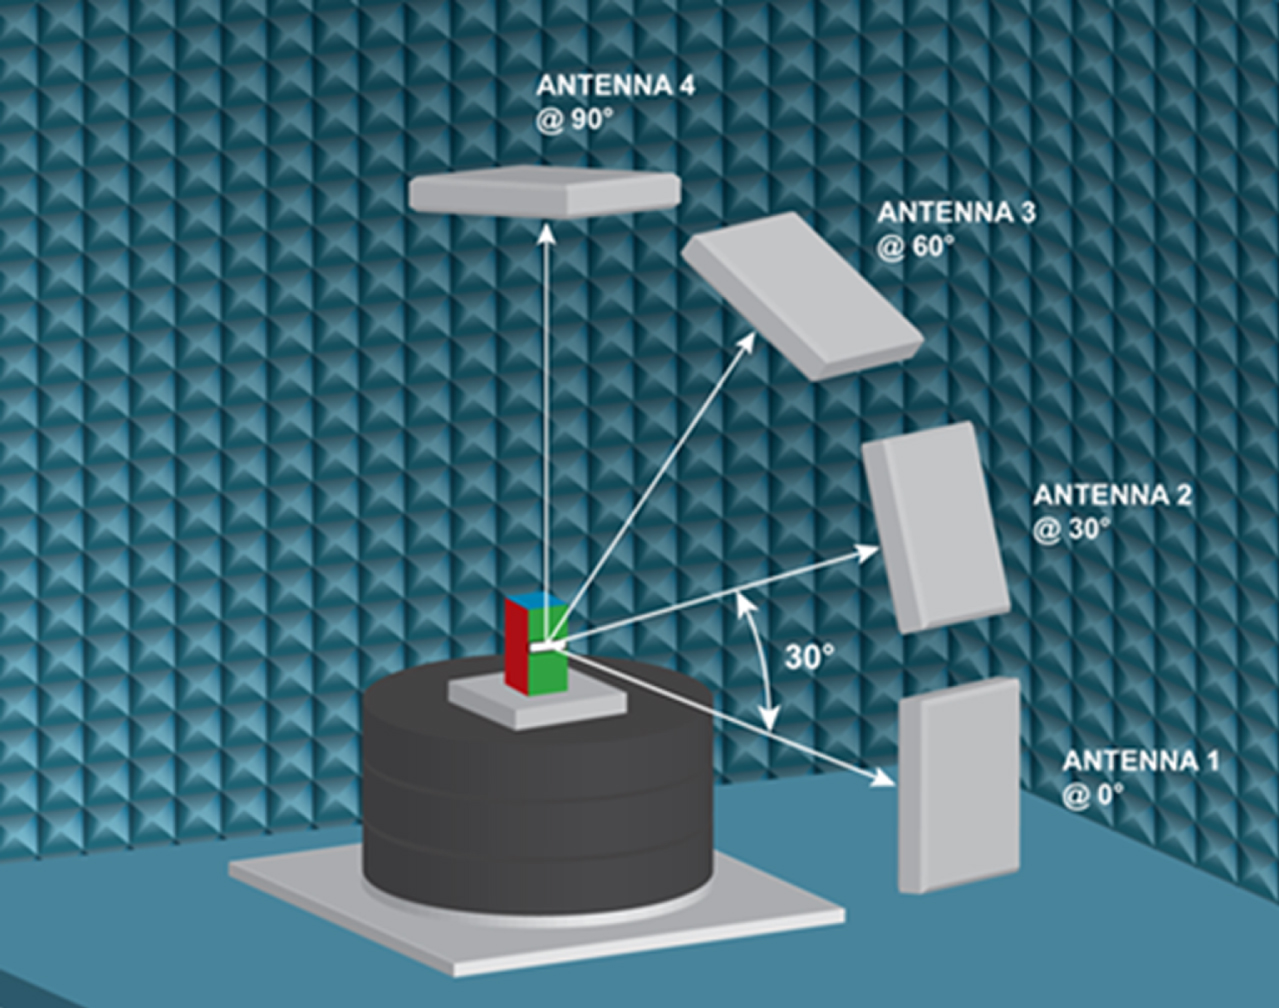
Voyantic C50 Test Chamber Setup.
The measurement unit is effectively a network analyzer optimized for RFID measurements that processes the properties of the transponder while it is active. The anechoic Voyantic C50 test chamber includes four antennas that are mounted at 0°, 30°, 60°, and 90° with respect to the test platform. The antennas are mounted with their horizontal polarization plane parallel to the floor of the anechoic chamber. The test platform rotates 0° to 360°. For each test, the chip was located at a focal point set 50 cm from antenna 1 in the C50 antenna array (Barge et al., 2019) and tested in 30° steps from 0° to 330° (Félix et al., 2015) for the threshold sweep and 0° to 350° in 10° steps for the orientation sweep. The operational or central frequency for the Voyantic C50 is 915 MHz for the FCC band of 902–928 MHz which is based on the US standard and produces signal strengths of up to 30 dBm per measurement. For this study only antenna 1 was used. The limits of the Tagformance Pro Measurement system are –20 to 30 dBm for the Carrier signal and for the received signal 12 dBm for the recommended input power and –76 to –85 dBm as the minimum backscatter for query- based tests.
To assess the tag performance, three separate performance tests were executed with the Voyantic software which uses a variety of forward and reverse link measurement units to calculate the results for sensitivity, backscatter, and the theoretical read range. The major tests that were conducted for each drug formulations are: Threshold Sweep –Describes how much energy is needed to wake up or stimulate a response from the tag (sensitivity or power on tag forward) and how much power is reflected after a successful response of the tag (backscatter or power on tag reverse). The wake-up energy corresponds with the read range (theoretical read range forward). The less energy is needed, the further away the tag can be from the reader. In summary, sensitivity is the minimum power required for the item to respond to an RFID interrogator. Backscatter is the measured power level of the tag’s response back to the interrogator. Orientation Sweep –Shows how well the tag is readable from different angles. Population Analysis –Shows readability and unreadability of the samples individually and as a group of items.
In passive UHF RFID, the forward link works by sending a signal sent out by the reader to energize the RFID tags in the vicinity to receive a response, while the reverse link modulates its antenna’s load impedance from the tag to encode its information in reflections back to the reader (Kuester et al., 2010). The Voyantic measurement system used for testing includes an elementary version of the ISO 18000-6C or EPC Class1 Gen2 protocol which describes the forward link protocol as DSB-ASK, Tari: 25 and the reverse link protocol as 40 kHz FM0. Power on Tag Forward (PoTF)) and Theoretical Range Forward (Rmax) are two Forward Link measurement units used by the software and those results are determined by the following equations (1) and (2), respectively. Transmitted power (Pt) is the unmodulated radio frequency (RF) carrier power at the Devices OUT Port, which can be seen in Fig. 3.
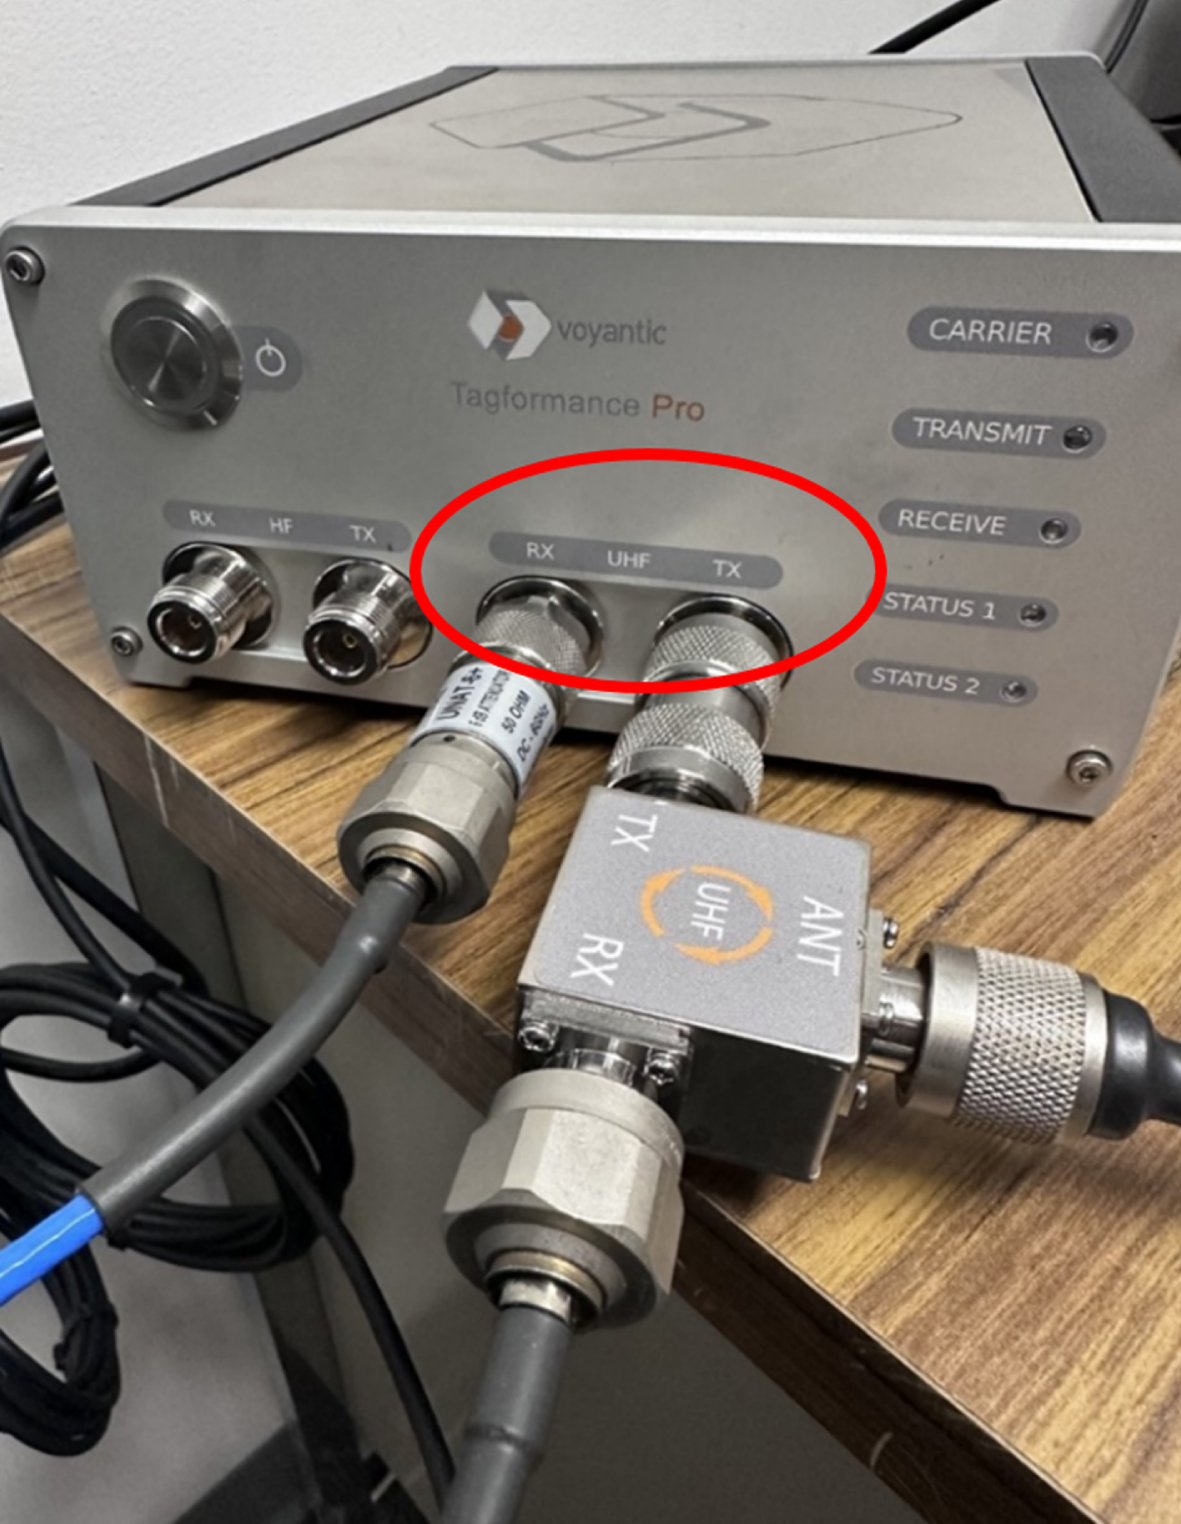
Image of the Voyantic Tagformance Pro Measurement showing the UHF Transmitted or (Tx) power at the OUT port and the UHF Received or (Rx) power at the IN port.
Backscatter Power and Power on Tag Reverse are two components of the Reverse Link and can be calculated using Equations (3–5), respectively.
Backscatter Power is the received RF signal power of the RFID tag backscatter measured at the Devices IN port, which can be seen in Fig. 3. The level of the unmodulated (bias) or transmitted carrier power at the IN port does not influence the reading and is calculated from the two complex power levels Power 1 (P1) & Power 2 (P2) between which the backscatter modulation occurs as seen in Fig. 4. Power on Tag Reverse is the effective backscatter transmit power (EIRP) of the RFID tag when answering to a command from the reader and is calculated from the Backscatter power.
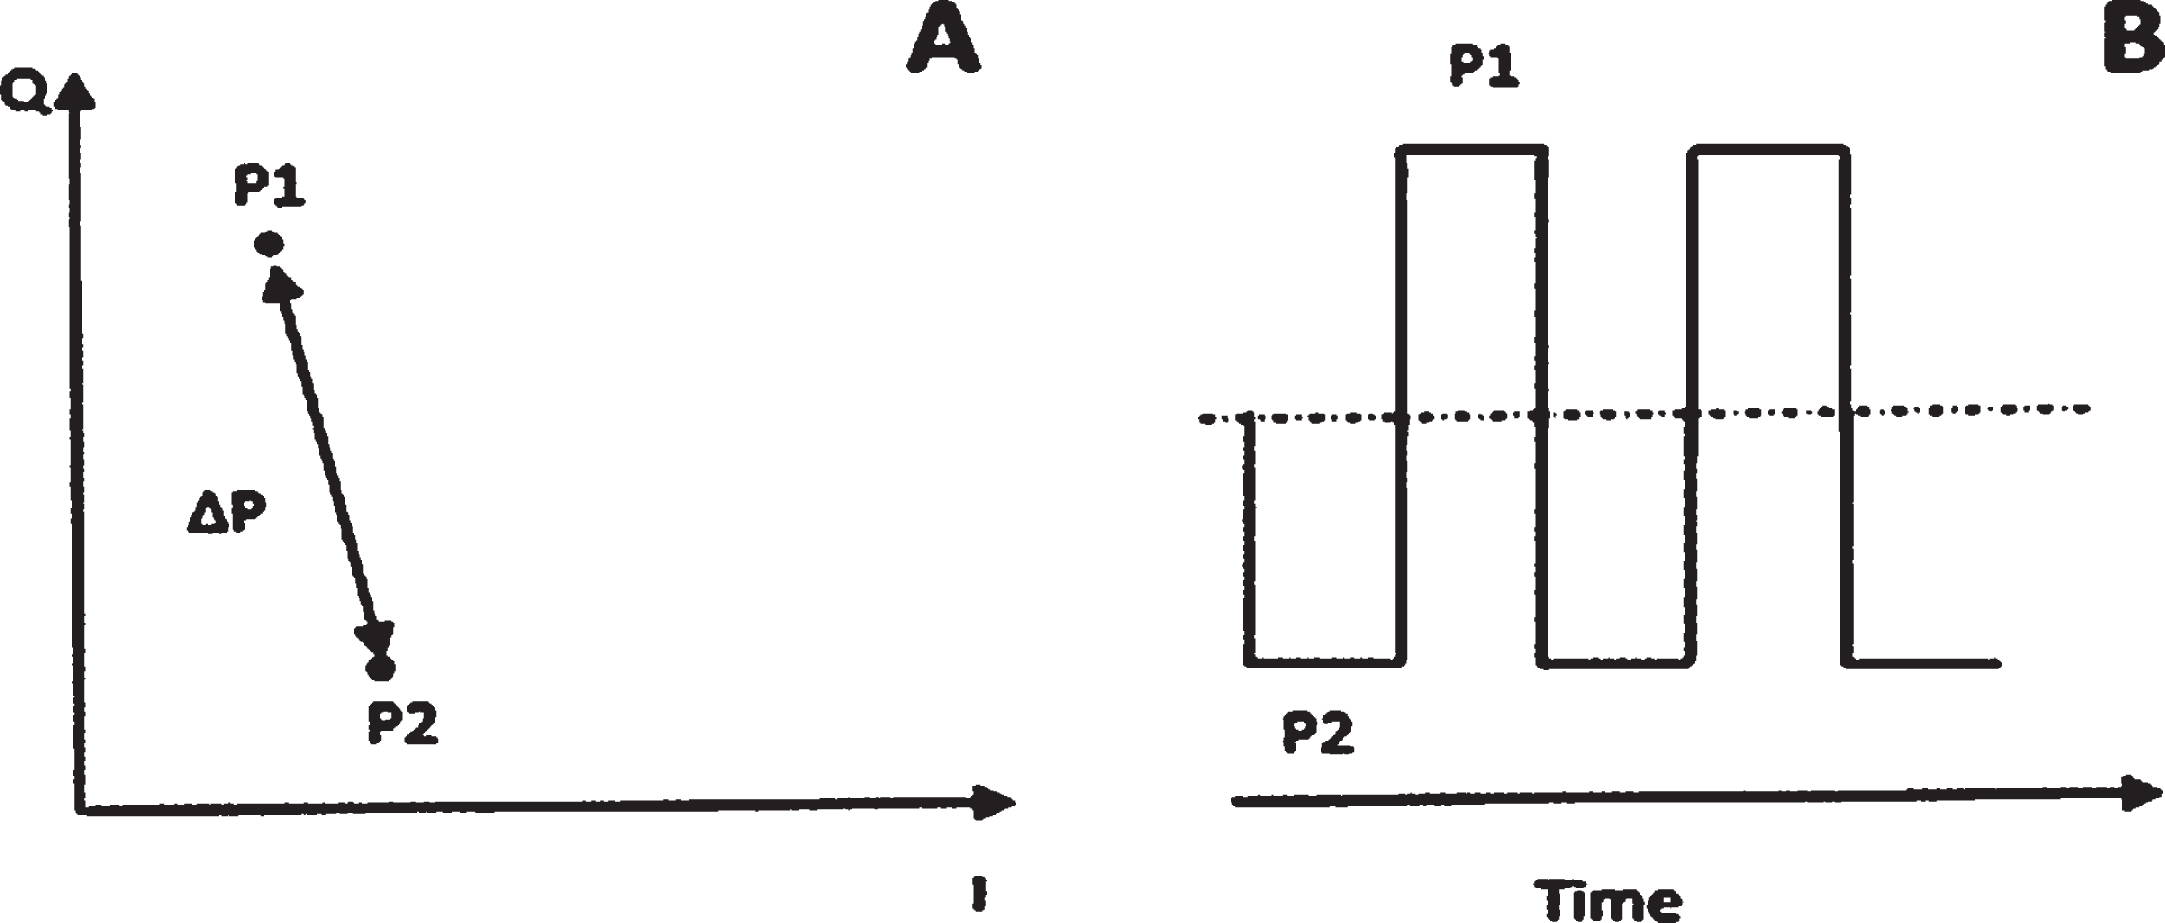
Graphical representation of A) The backscattered power as a magnitude of the complex amplitude (PBS = 0.5*ΔP) of the receiver, and B). How the backscatter power is calculated from the two complex power levels P1 & P2.
The fifth Equation (5) demonstrates how the backscatter results or Power at Tag Reverse results were calculated for the Threshold Sweep, which is based on the testing methodology from GS1’s (TIPP) Tagged Item Grading: Testing Methodology Guideline which considers only both side tones as backscatter strength (40%) power, whereas the Voyantic backscatter definition sums the whole spectrum power (100%) of the power. A summary of the symbols for the equations for both the forward and reverse links can be found in Table 1.
Forward and reverse link symbols
Ten mL of each formulation was removed from their original products and injected into a RFID tagged empty sterilized vial using commercially available disposable 10 mL syringes with a 22-gauge needle. The commercially available vials used for this study were selected based on a conversation with the pharmaceutical manufacturer to match the major characteristics of the original pharmaceutical vials. For testing, thirty vials of each drug formulation were used. Deionized (DI) water and empty tagged vials were used as the control samples. All pharmaceutical products were handled using proper PPE (nitrile gloves, lab coat and splash goggles).
Results and discussion
Effect of drug formulation on RFID tag sensitivity and backscatter
A preliminary threshold sweep was performed from 800 MHz to 1000 MHz to cover the UHF Gen 2 standard for passive UHF tags or so-called RAIN RFID which operates between 860 MHz and 960 MHz (Roggero et al., 2022). Tests were performed on a single vial for all seven products to gauge how the drug or other formulation (water or air) affects the tags capabilities. The results shown in Fig. 5 demonstrate that within the highlighted FCC band range of 902–928 MHz, the worst performing solution in terms of sensitivity, or power on tag forward is Potassium Phosphate, followed by the empty vial, Progesterone, Etoposide, Sensorcaine, Polymyxin B, and then DI Water.
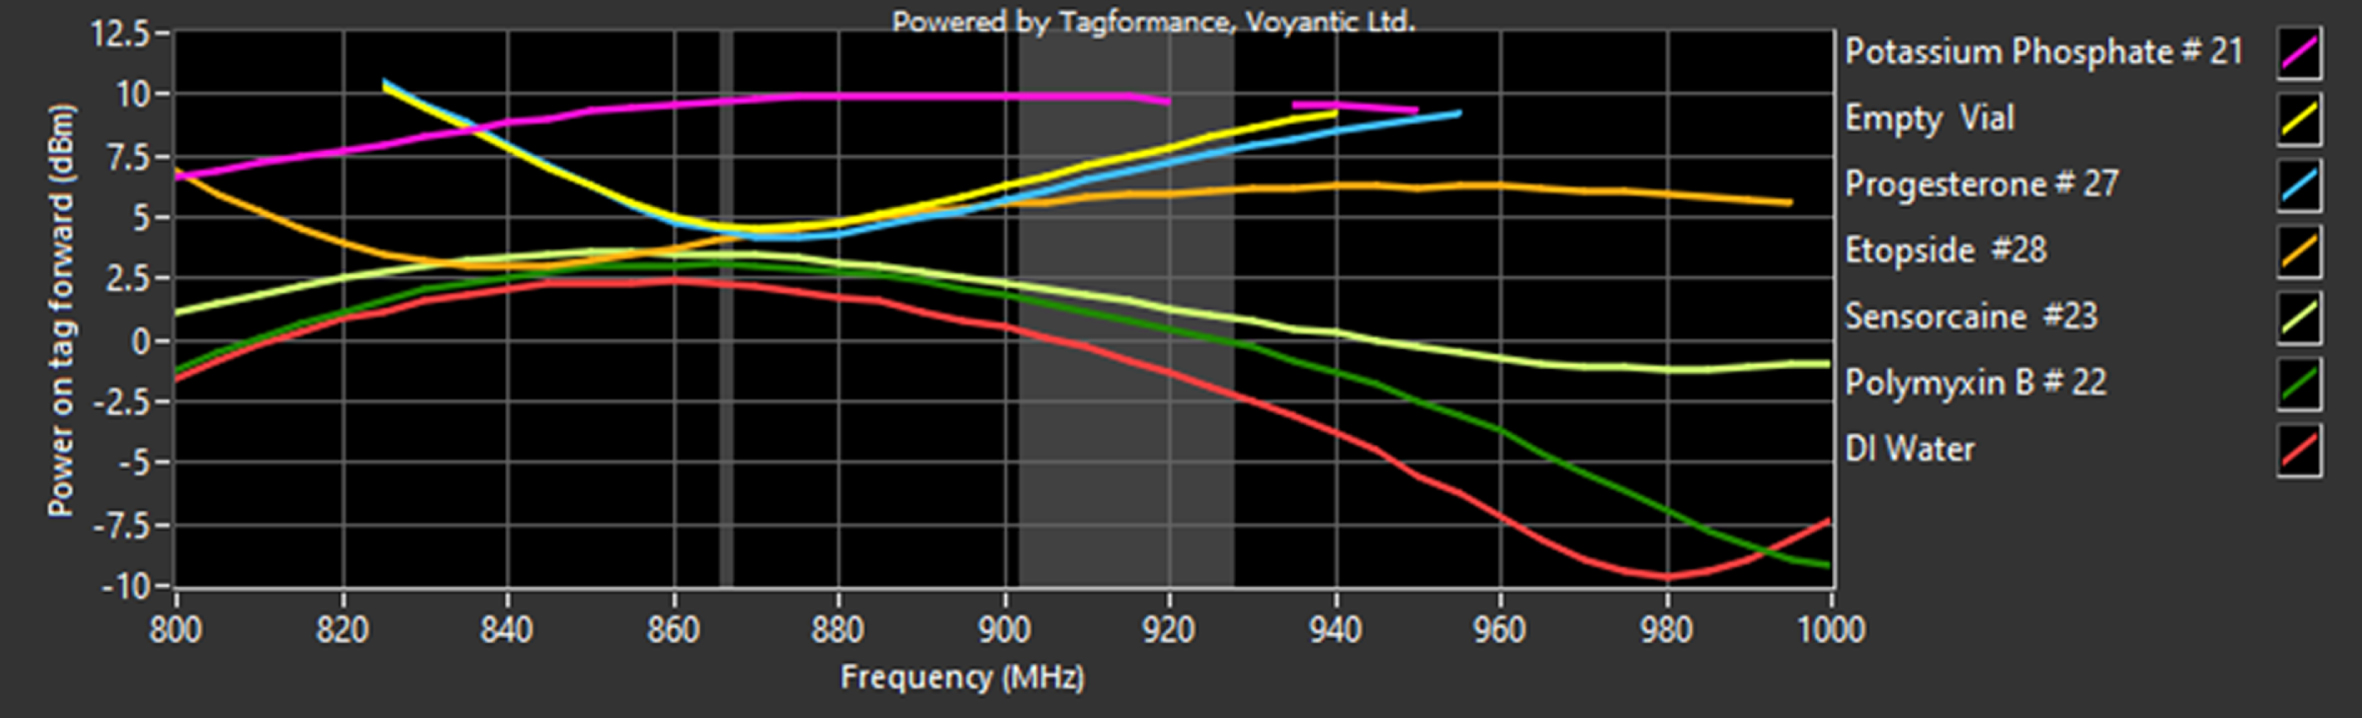
Preliminary Threshold Sweep from 800-1000 MHz showing Power on Tag Forward (PoTF) or tag sensitivity from five different drug formulations, DI water and empty vial.
To confirm these preliminary results with a more statistically sound analysis, a separate threshold sweep was performed within the FCC range using thirty vials of each solution. The results from this threshold sweep are presented in Fig. 6 and Table 2.
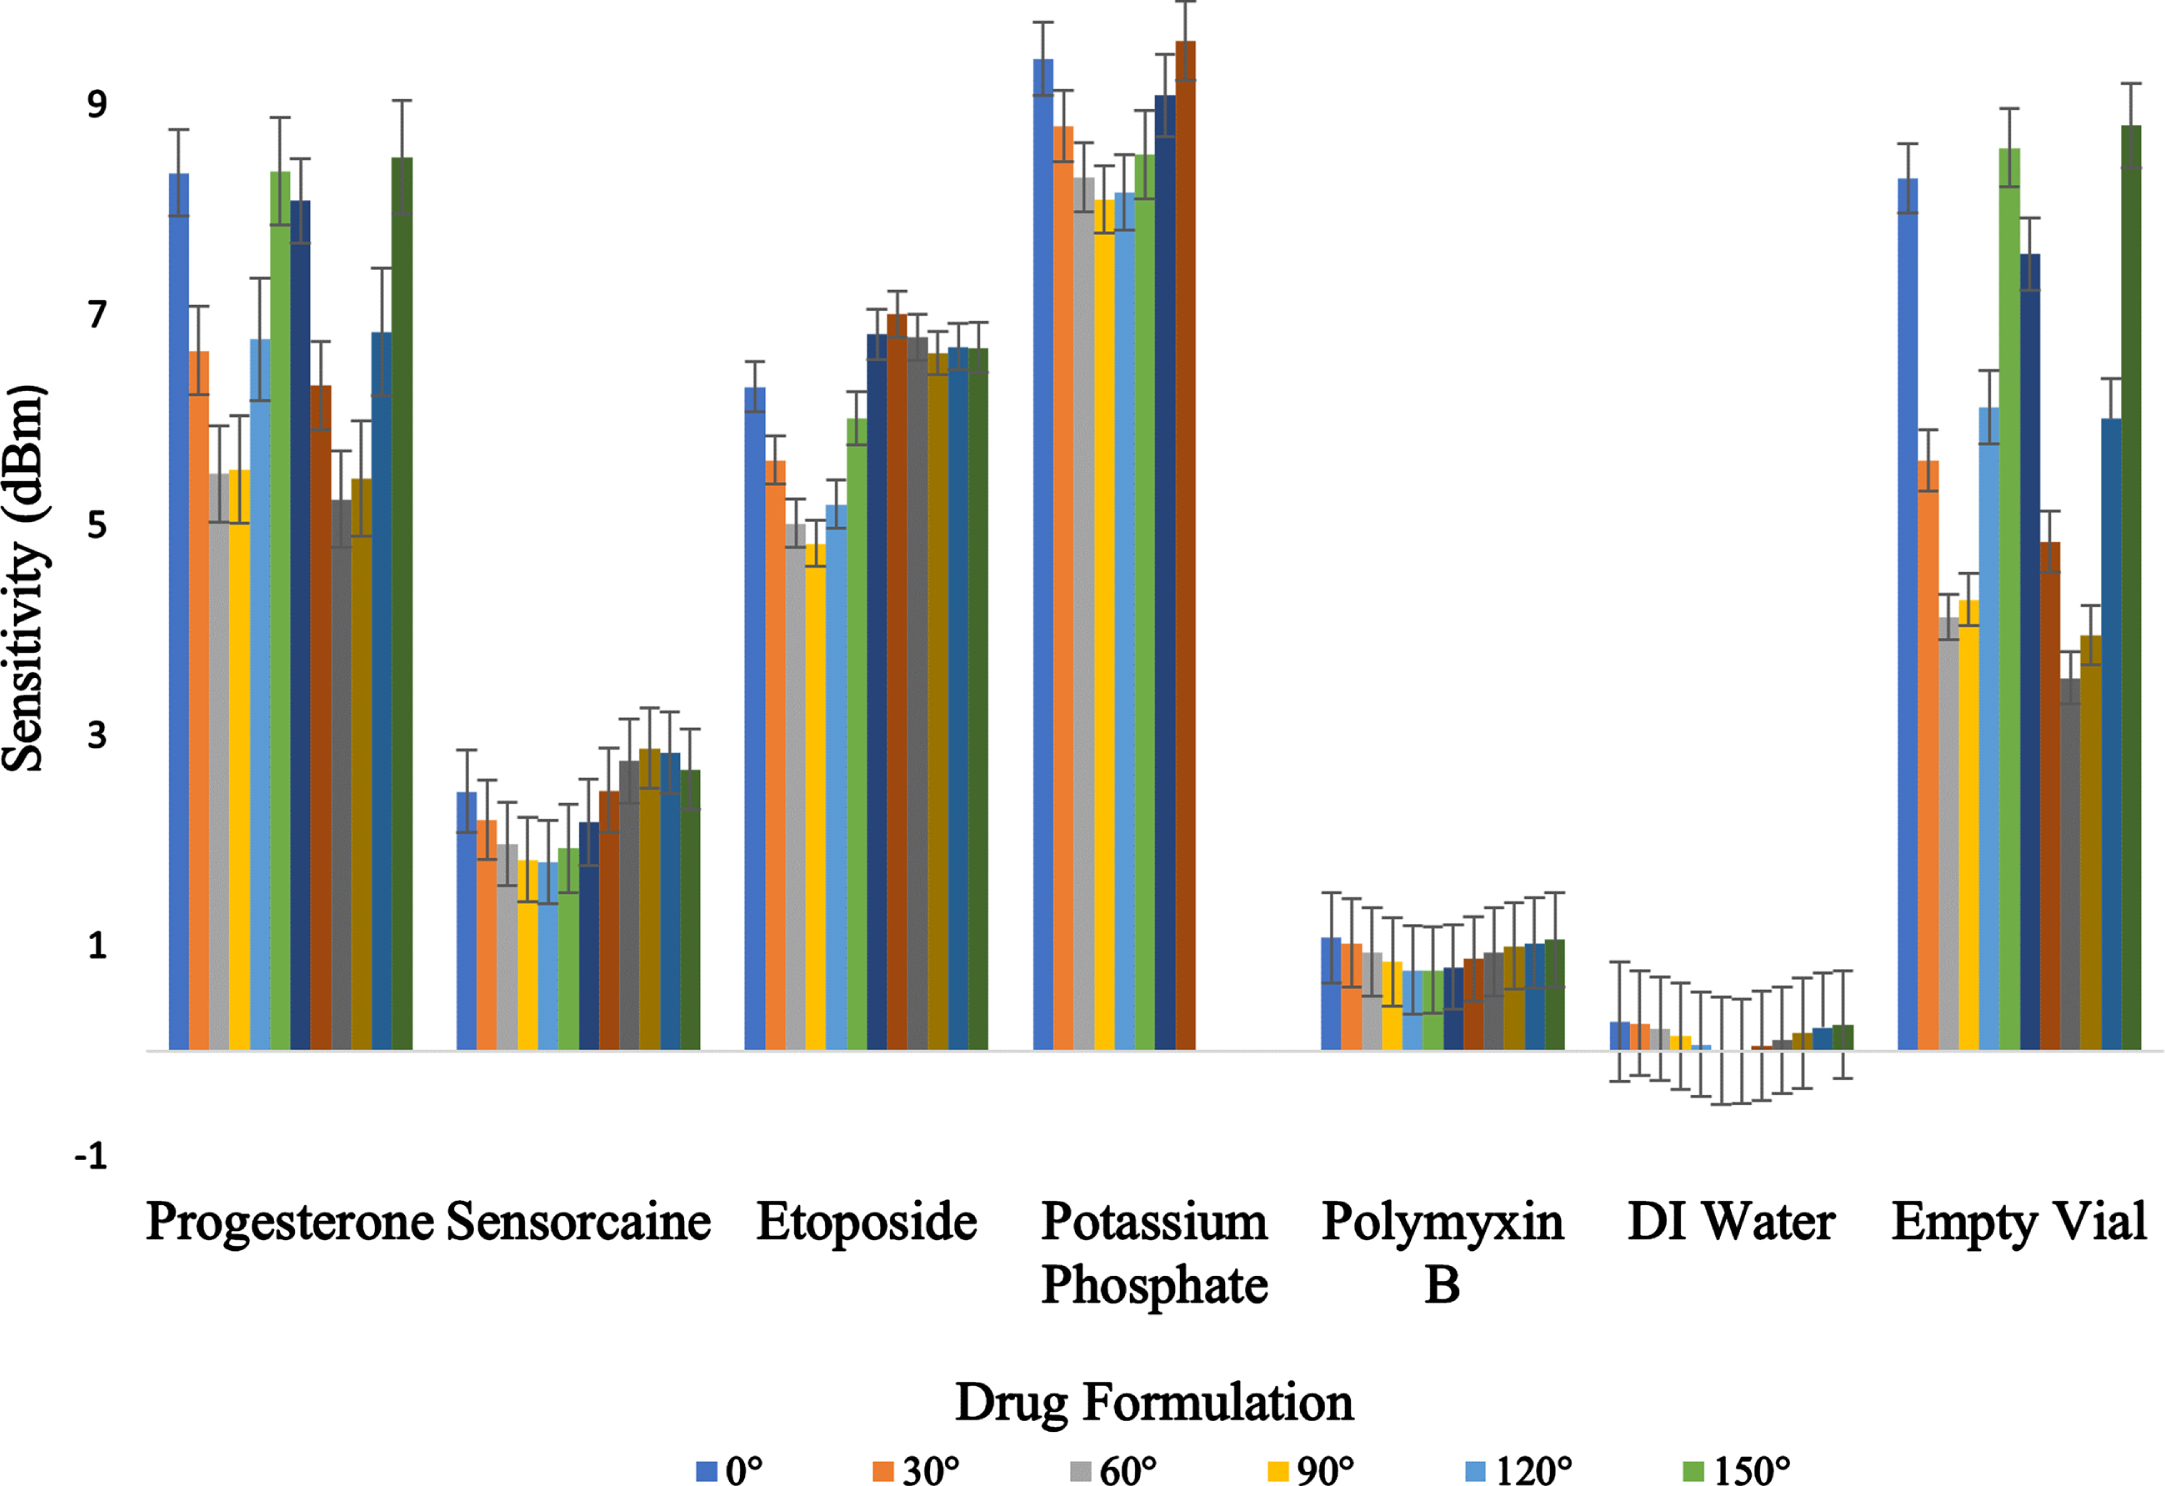
Power on Tag Forward (PoTF) or tag sensitivity±standard deviation (dBm) of 5 different drug formulations, DI water, and empty vial. Thirty samples were tested for each angle.
The results confirmed the preliminary outcomes with the worst sensitivity and backscatter being Potassium Phosphate ranging from 8.31±0.19 dBm to 9.67±0.22 dBm and –38.05±0.80 dBm to –39.30±0.80 dBm, respectively. The best performing solution being DI water whose backscatter values fluctuated between –22.53±1.55 dBm and –22.85±1.77 dBm and had sensitivity values ranging from –0.67±0.55 dBm and –0.97±0.59 dBm. The large discrepancy in the performance on these different solutions is found to have an average of sixty-eight (68) percent change between the water and Potassium Phosphate backscatter and theoretical read range values. This is thought to be due to various raw materials which include base materials as well active and inactive ingredients with differing ion concentrations which constitute the bulk of the products in terms of weight (Erdem et al., 2009). Additionally, these liquid formulations cause attenuations on the RF waves by absorbing their energy (Blasi et al., 2010). Because there was a low standard deviation between vials across all solutions, testing was narrowed to five randomly selected vials for the theoretical read range and orientation sweeps. The standard deviations ranged from 0.32–0.47 for Progesterone, 0.50–0.55 for Sensorcaine, 0.50–0.61 for Etoposide, 0.79–0.82 for Potassium Phosphate, 0.52–0.58 for Polymyxin B, 1.54–1.77 for DI water and 0.19–0.49 for the empty glass vial.
Backscatter (dBm) for five different drug formulations, DI water and empty vial (dBm)
Read range is regarded as one of the most crucial parameters for a RFID tag which is described as the maximum interrogation distance between the reader and the tag (Rakotomalala et al., 2020). Five randomly selected vials were chosen from a population of thirty for each solution to obtain the theoretical read range forward. It is known that researchers have investigated the effects of read range reduction in the vicinity of water, wine, and other chemical compounds (Yu & Qu, 2020), however there still is a need to analyze the performance of RFID tags when attached to various dosage forms (Erdem et al., 2009) especially passive RFID tags on liquid pharma products. Amin et al. 2012 worked on developing antennas resistant to environmental factors, specifically water and metals (Amin et al., 2012). This testing was performed in an anechoic chamber and the tag was placed next to or above a cube of water for testing. They found that a close reading distance of 5 mm to the water resulted in a theoretical read range of 1.15 m (Amin et al., 2012). This result is similar to the average results for DI water in this study whose theoretical read range average at an angle of 0°was 1.66 m. In another study, Sohrab et al. tested the read ranges of different tags on bottles made of several different materials (Sohrab et al., 2016). This testing took place in an anechoic chamber and the tags were placed directly onto the bottles. Their reading range for a glass bottle was between 0.13 m and 0.31 m, which is comparable to the theoretical read ranges found for an empty glass vial seen in Table 3. The results presented in Table 3 show the average theoretical read range forward±standard deviation for each solution at each of the test angles. The standard deviations of the theoretical read ranges in Table 3 show little variation, the highest occurring in the DI water results at 0.11. The results again show that the worst performing solution was Potassium Phosphate with four of the test angles resulting in a dead zone following angle 240 with the highest read range of 0.59 m at 90°. The best performing formulation was DI water with the highest read range of 1.71 m at 180°.
Theoretical read range forward for five different drug formulations, DI water, and empty vial (Ft.)
Theoretical read range forward for five different drug formulations, DI water, and empty vial (Ft.)
The orientation sweep is another important performance parameter that is commonly found on a RFID tags data sheet. This parameter measures how well an RFID tag can be read from different angles. Five randomly selected vials were chosen from a population of thirty for each solution to obtain the sensitivity or power on tag forward (dBm). The results which are presented in Table 4 show the radiation sensitivity expressed as average power on tag forward±standard deviation for seven test solutions at each of the test angles.
Sensitivity (dBm) from orientation sweep for five drug formulations, DI water, and empty vial
Sensitivity (dBm) from orientation sweep for five drug formulations, DI water, and empty vial
Figure 7 shows the radiation pattern for each of the five replicates for all seven of the test solutions. The orientation sweep shows how well the tag is readable from different angles. The test was performed at 915 MHz (Roggero et al., 2022) with a step of 10°; as it is right in the middle of the FCC range. The results show the slight differences each vial can have in the controlled environment. The results confirm that the worst performing solution was Potassium Phosphate with fifteen of the test angles resulting in a dead zone, and the best performing solution being DI water with the best sensitivity reading coming from angles 170–190°.
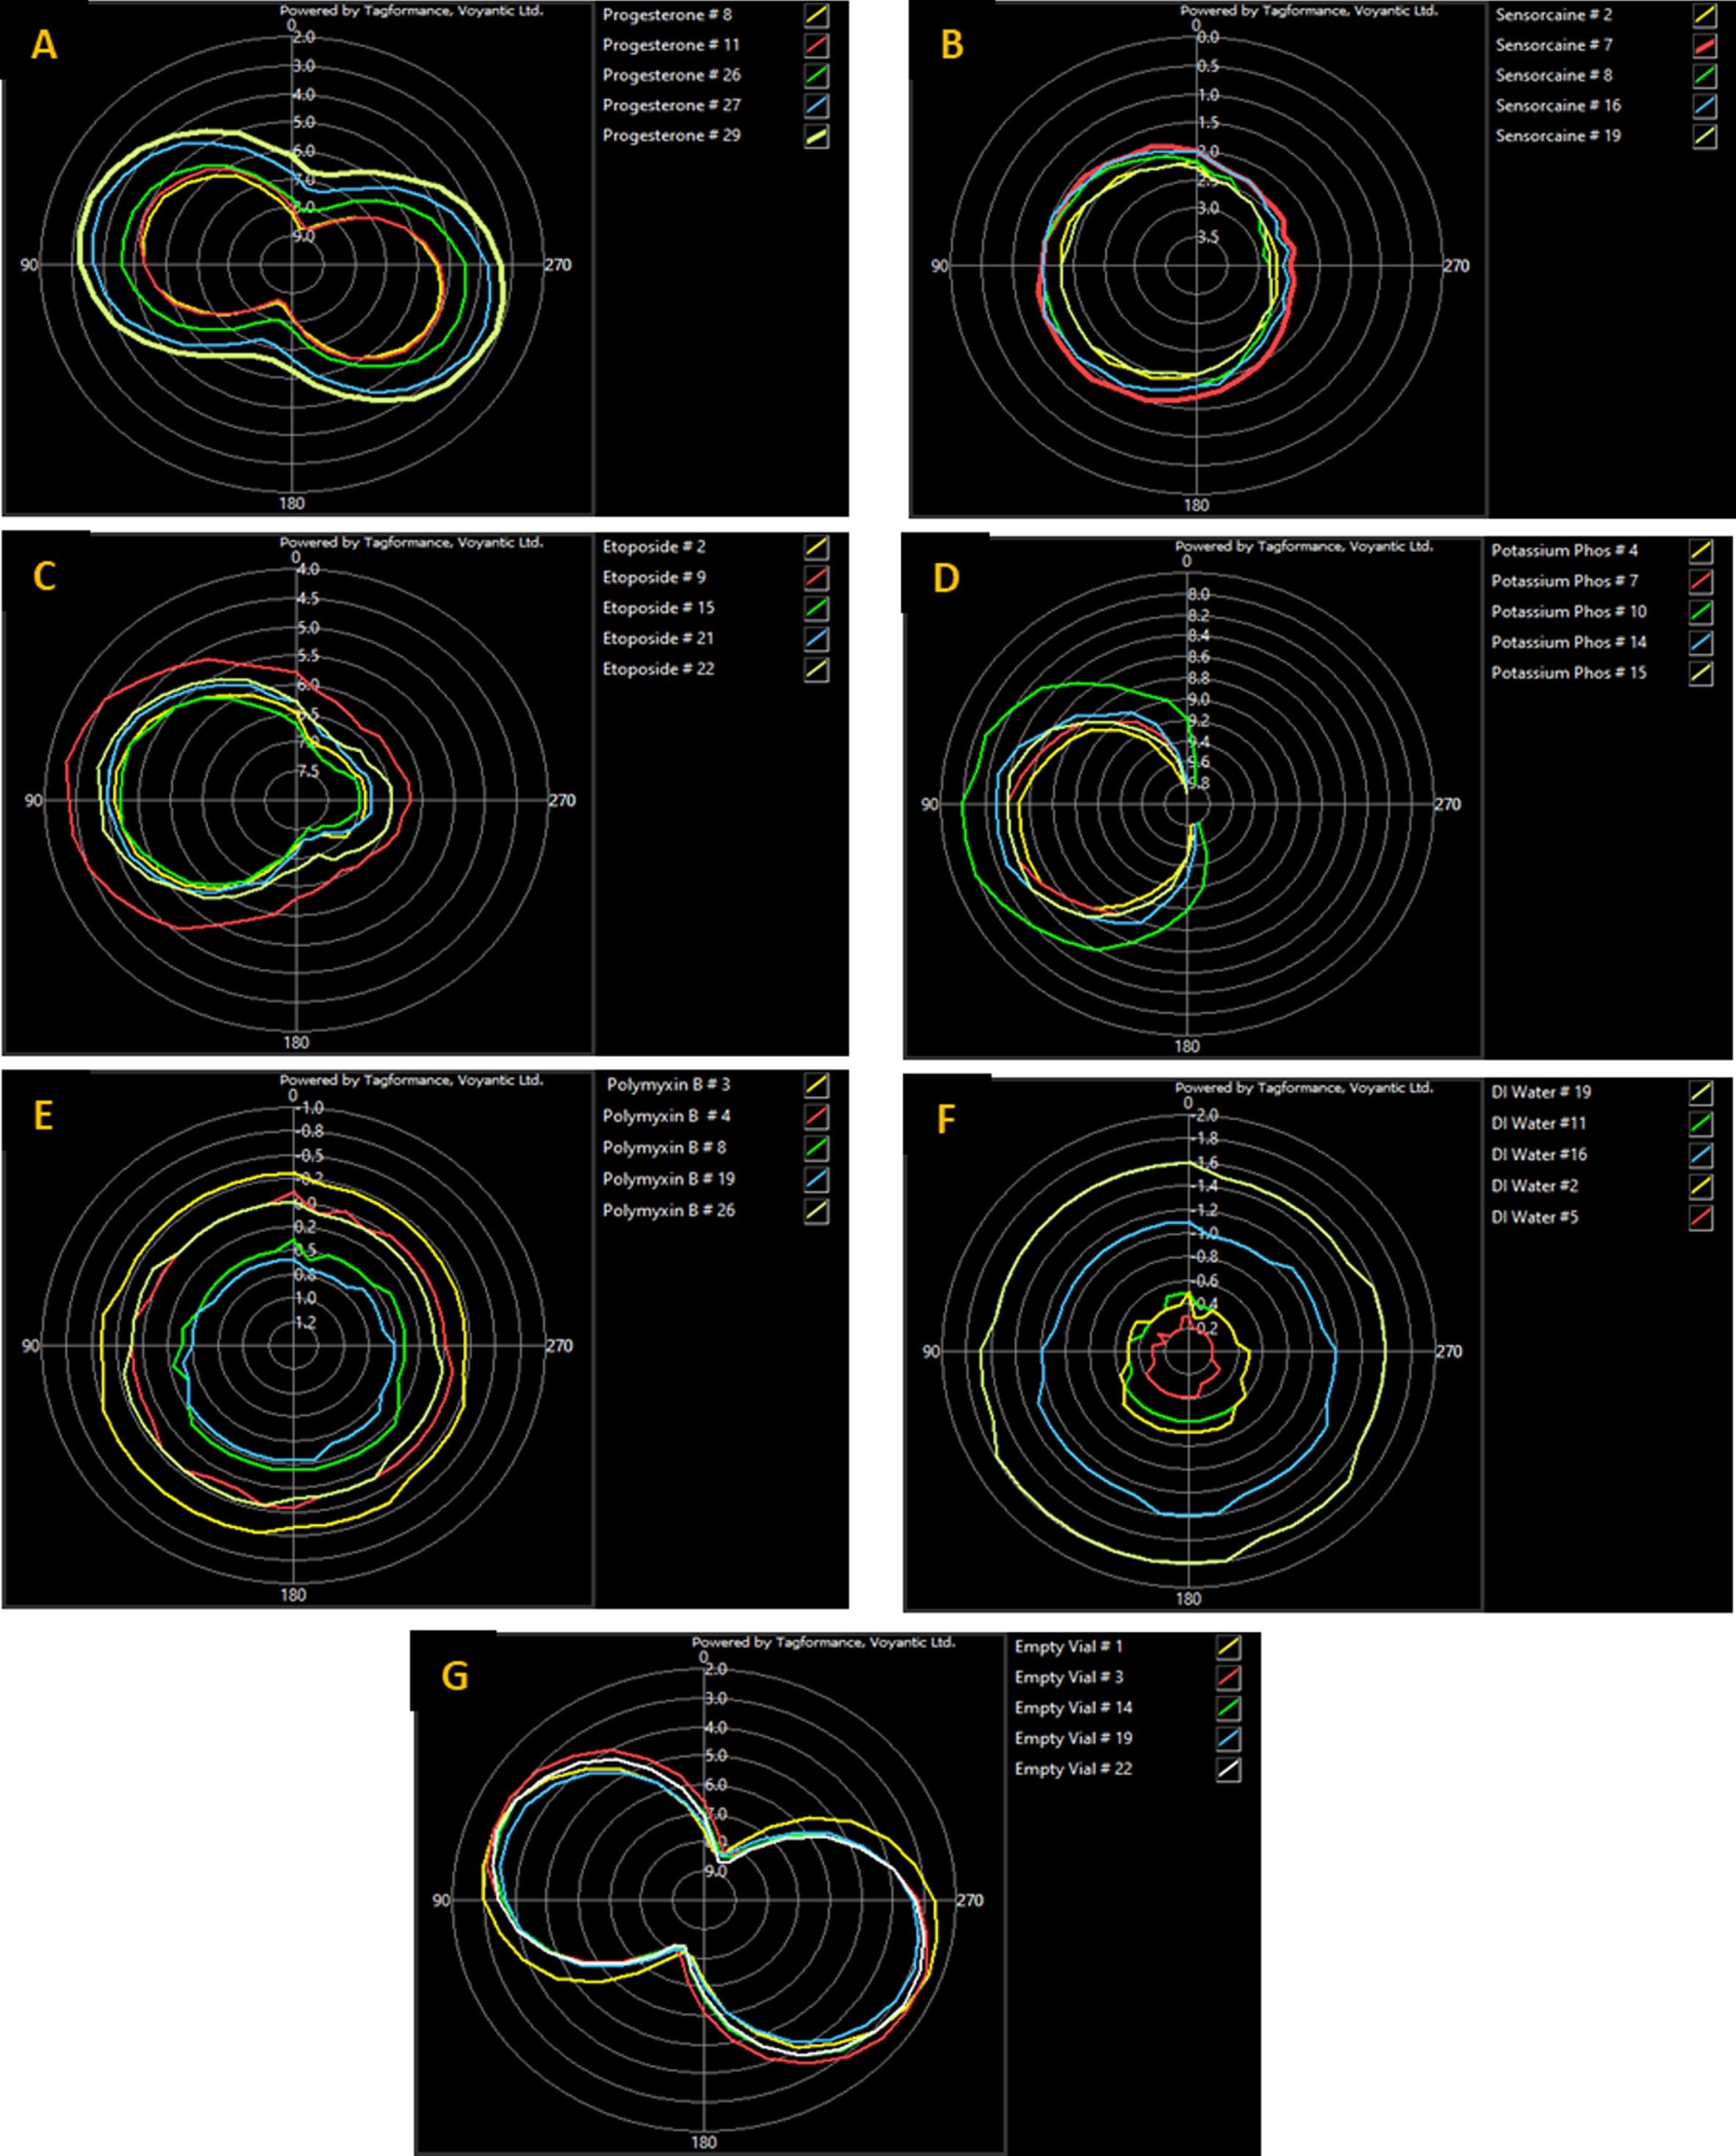
Orientation sweep showing the Power on Tag Forward (PoTF) or tag sensitivity of A) Progesterone, B) Sensorcaine, C) Etoposide, D) Potassium Phosphate, E) Polymyxin B, F) DI water, and G) Empty vial. Five samples were tested for each product and angle.
The orientation sweep results for DI water, Polymyxin, and Sensorcaine are indicative of omnidirectional radiation gain patterns. This pattern formation demonstrates that the tag antennae is emitting radiation equally in all directions, which is optimal for performance. This behavior is reflected by the performance metrics where DI water, Polymyxin and Sensorcaine function the most effectively, in respective sequence.
The results of Progesterone (A) and the empty vial (G), seen above in Fig. 7, model bidirectional radiation gain. Similar results were found by Palani et al. during their development of a RFID tag intended for military use. In this research, they modelled radiation gain for a dipole antenna and produced a bidirectional gain pattern (Palani et al., 2022). The tag performance results of Progesterone and the empty vial are affirmed by this pattern formation as they underperformed in comparison to DI water, Polymyxin, and Sensorcaine. This is to be expected as the signal for Progesterone and the empty vial is only strong in two directions.
The graphs produced by Etoposide (C) and Potassium Phosphate (D), seen in Fig. 7, express that the substances caused the radiation gain to have higher directivity. Etoposide outperformed the substances with bidirectional gain but underperformed comparatively to substances with omnidirectional gain. This is likely caused by its irregular directivity. Potassium Phosphate, however, had such high directivity that it only appears on the left-hand side of the graph. The tag performance metrics for Potassium Phosphate reflect this, as it produced the least favorable results for all data categories.
The population analysis is another performance parameter which allows the user to test the readability of a tag or tags to identify how well they operate within a dense tag population. This is important because in a passive UHF system, a tag’s readability can be affected by additional factors including reflections off the floor and wall and by objects near the tag, known as multipath (Choi et al., 2011). Nine randomly selected vials were chosen from a population of thirty for each solution to see how formulation affects the RFID performance alone and within a population.
Figure 8 A-G shows the setup of all nine vials of each formulation in reference to antenna 1 (Left) as well as the transmitted (Tx) and received (Rx) power (dBm) for a single test (Right).
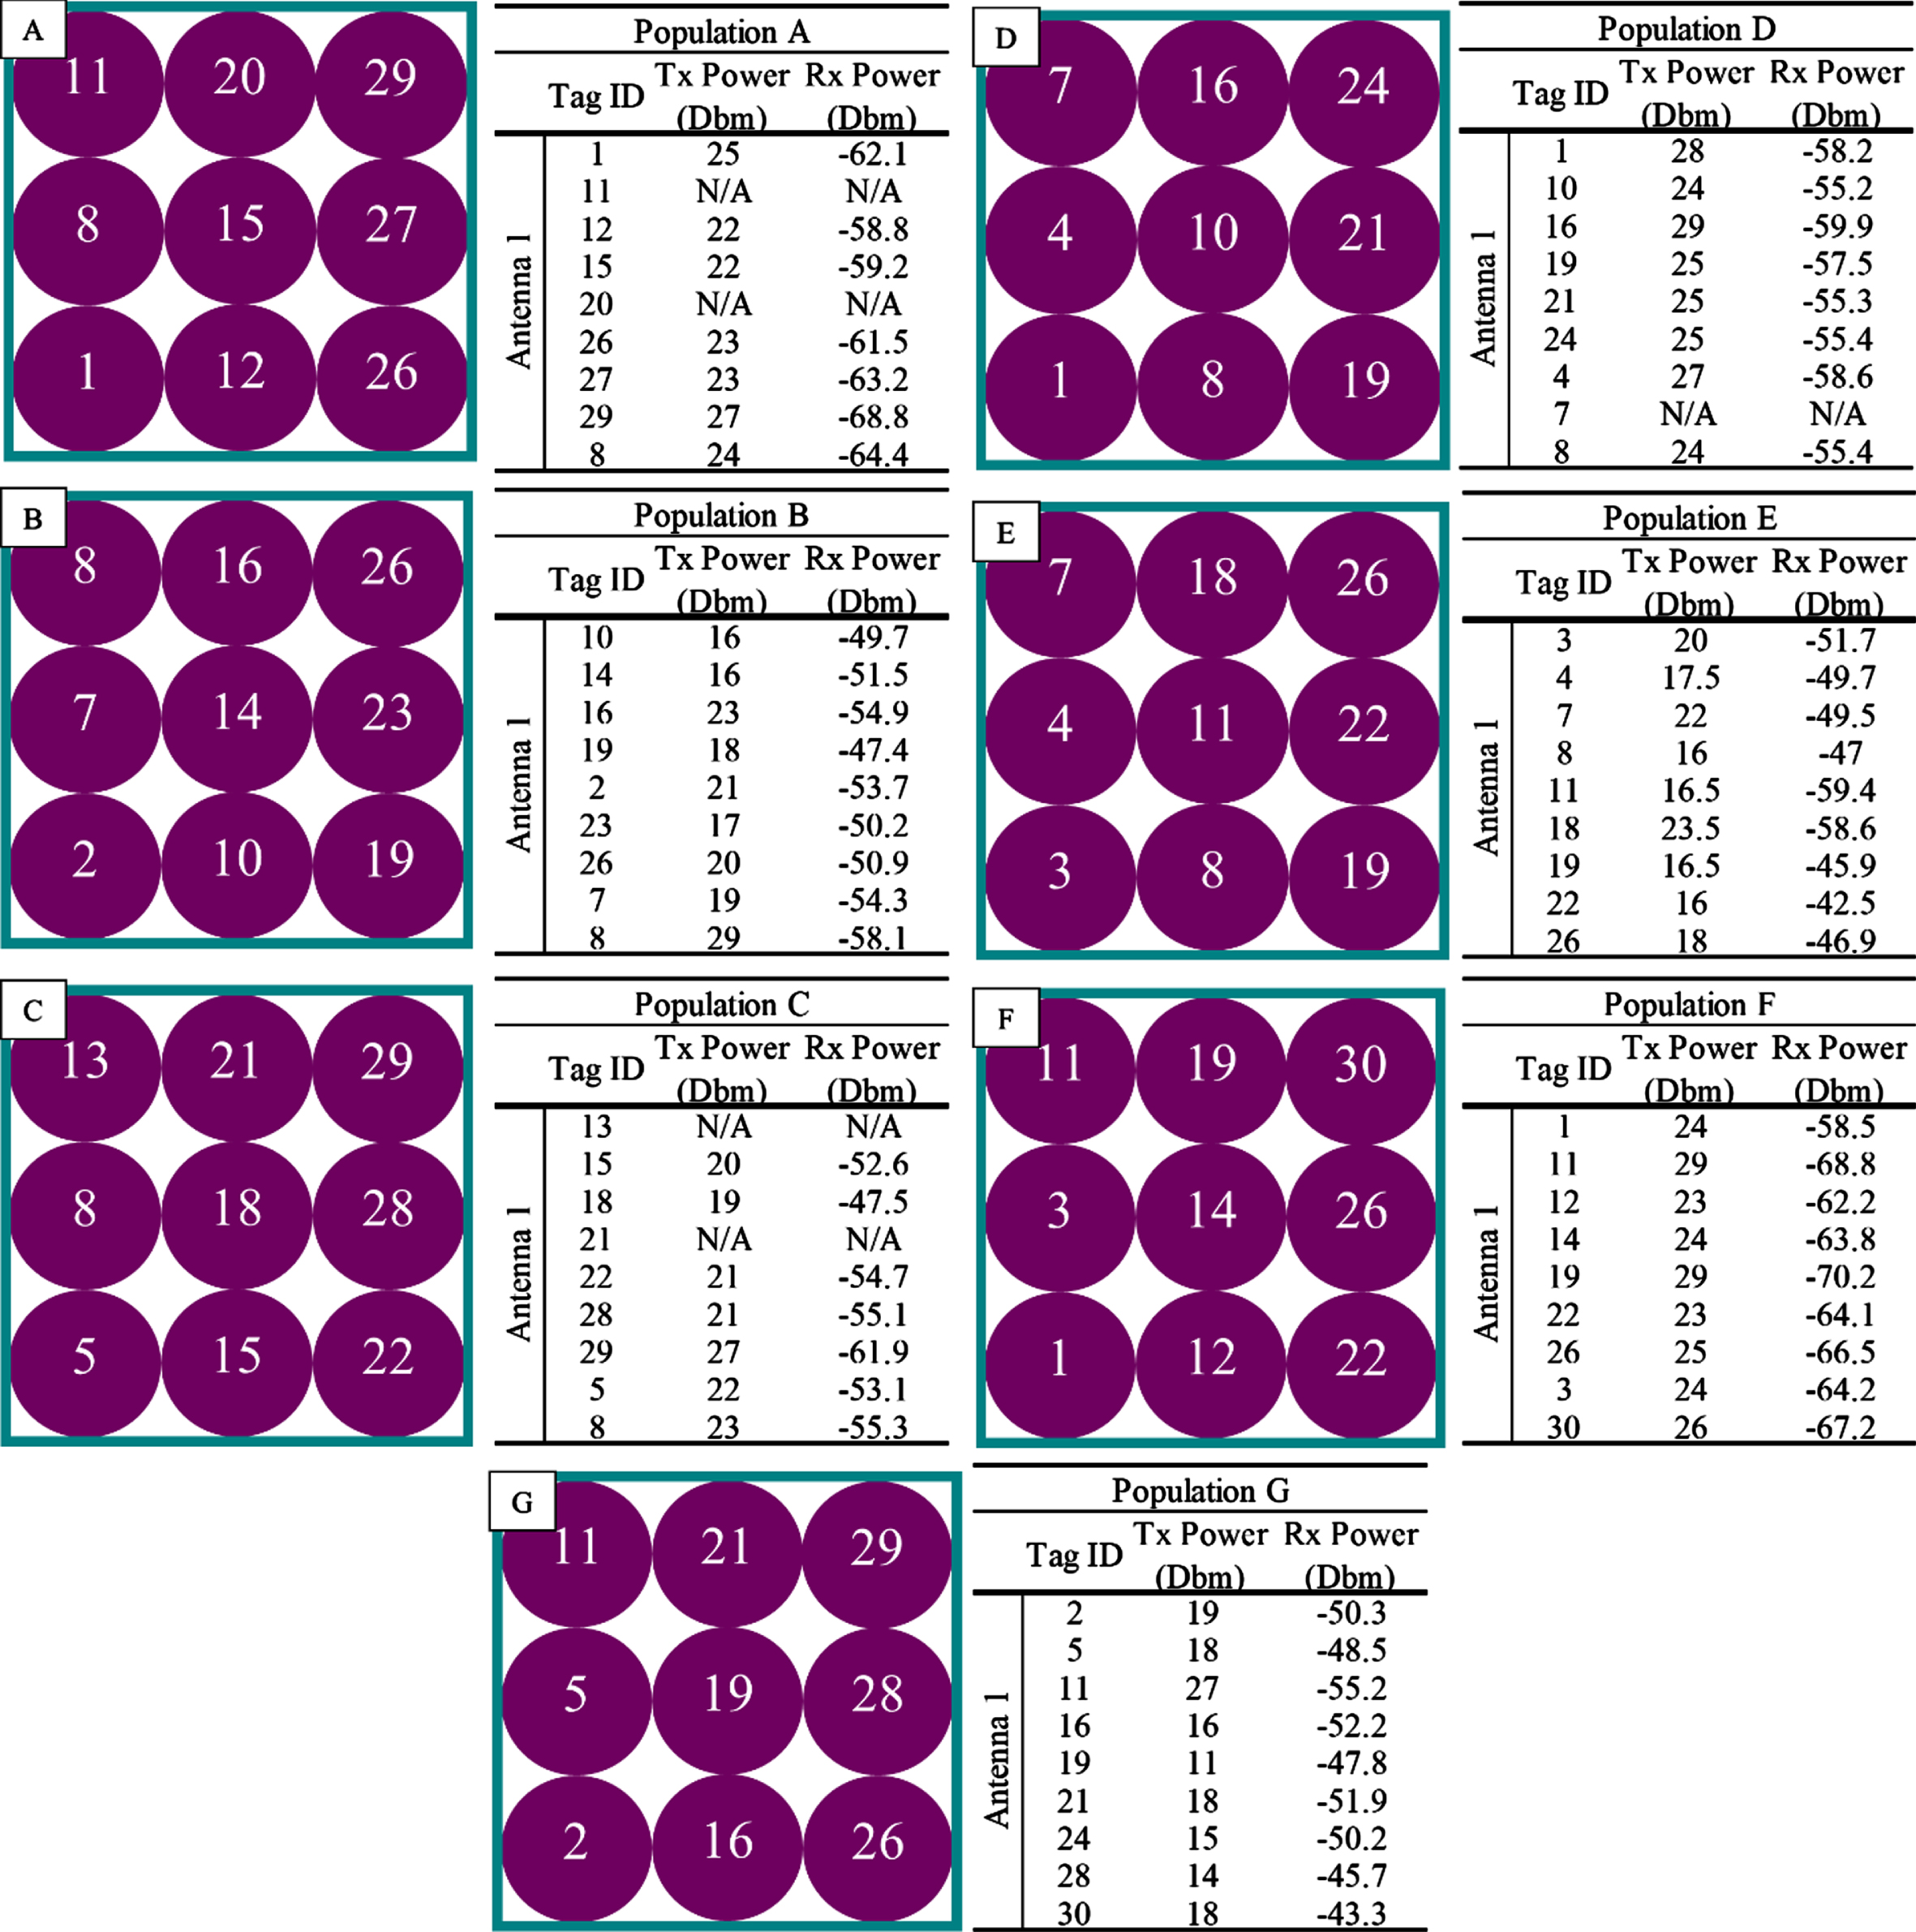
Population analysis setup with the corresponding transmitted (Tx) and received (Rx) power (dBm) of A) Progesterone, B) Sensorcaine, C) Etoposide, D) Potassium Phosphate, E) Polymyxin B, F) DI water, and G) Empty. Five samples were tested for each product.
The results from five replicates are also summarized in Table 5.
Transmitted (Tx) & Received (Rx) power
Results of Table 5 show the average Tx and Rx power±standard deviation for the vial closest to the antenna in each formulation group at the threshold level. Across all solutions the results indicate that both the Tx and Rx power increased more in a population than when evaluated as a single vial. This difference can be seen in Table 5, where the values for received power increased from –69.3±0.25 dBm as a single vial to –66.44±0.11 dBm in a population. This is likely due to the presence of ambient RF power that reflects off other tags in the population. Although results potentially could perform better in the population, the more tags in proximity would have differing results when compared to other vials in the population, which can be seen in the images on the right side of Fig. 8. Other studies have assessed RFID feasibility in a population focus on tag performance, positioning schemes, and optimal time points (Chai et al., 2023; Salah & Gaydadjiev, 2023; Wang et al., 2007). Moving forward, further investigation of the effects of liquids in a population can be expanded upon.
In this paper, a complete item level performance analysis was performed on five different liquid pharmaceutical drugs and the results were compared with the DI water and empty vials being used as controls. These drugs were provided by a pharmaceutical manufacturer and advised by a pharmacist to cover a broad range of liquid drug properties. The items’ performance was tested using a single optimized RAIN RFID tag designed for liquids in a controlled environment (anechoic chamber). The performance tests demonstrated how different liquid products with different compositions influenced RFID tag readability. The results confirmed that the product exhibiting the highest levels of sensitivity, backscatter, and read range was DI water, followed by Polymyxin B, Sensorcaine, Etoposide, Progesterone, Empty vial, and Potassium Phosphate. These findings substantiate the hypothesis regarding the influence of material composition on RF performance and underscore the necessity of conducting tests on actual products rather than solely on water.
The results of this study provide a foundation for a broader exploration, with the goal of constructing a predictive mathematical model that links material composition to RF performance. This potential development has the capacity to transform the incorporation of RFID technology in healthcare supply chains, reinforcing traceability and bolstering patient safety. This innovative investigation marks a substantial advancement in RFID research, as it specifically targets actual drug formulations. The profound insights generated empower professionals to make precise forecasts concerning RFID performance in drug formulation item-level tagging. Furthermore, it deepens their comprehension of efficient product tagging strategies to maximize read rates. In the forthcoming endeavors to tackle the hurdles obstructing the implementation of RFID for liquid pharmaceutical products, it would be prudent to conduct analyses on several fronts, including: 1) assessing the impact of viscosity on liquid pharmaceuticals, 2) investigating ion concentrations within liquid pharmaceuticals, and 3) optimizing packaging strategies for liquid pharmaceuticals.
Footnotes
Acknowledgments
This work was funded by Fresenius Kabi. The internship of the D.C. to work on this project was funded by the Axia Institute –Michigan State University. The authors would like to thank eAgile for providing RFID tags for this project.