
Abstract
PURPOSE:
To identify the accuracy of Body Mass Index (BMI) to categorize body weight in a sample of children with spina bifida and Down syndrome as compared to typically developing peers.
METHODS:
A secondary analysis of 32 children with spina bifida, Down syndrome or no chronic illness. A calculated BMI was plotted on the Centers for Disease Control and Prevention age- and sex-specific BMI growth charts to determine each child’s weight status. Percentage of body fat, obtained by labeled water, was plotted on two different body fat percentile reference curves, one derived from a whole body measure (DXA) of body fat and one by skin-fold measure. Differences in weight categories between calculated BMI and body fat percentile curves were reported.
RESULTS:
The calculated BMI for children with a disability had significant misclassifications as a screening tool for body fat when compared to children without a disability. Misclassifications were increased with the body fat percentile reference curve derived from skin-fold measures and for children who primarily used a wheelchair.
CONCLUSION:
The current recommendation to use BMI to categorize weight status is not useful for many children with disabilities. Further research to identify an alternative pragmatic strategy is necessary.
Introduction
Childhood obesity is a high-priority public health challenge [1]. In 2015-2016, its prevalence in children in the United States was 18.5%[2], a significant increase from 5%in the 1970s [3]. Obesity in children often persists into adulthood and has been associated with a variety of medical, psychological and psychosocial concerns [4]. Based on the negative consequences of obesity and difficulties in treating it, increased efforts have focused on the early detection and prevention of overweight and obesity in children [5].
The recommended screening tool for relative weight status in children is a body mass index (BMI), in kg/m2 [4]. For children, it is plotted on age- and sex-specific graphs with weight categories determined by cutoff criteria based on the Centers for Disease Control and Prevention (CDC) BMI-for-age growth charts [3]. Body mass index has proven to be a reliable screening tool to describe a typically developing individual’s weight status. When categorizing obesity, the BMI cutoff point (BMI≥95%) for age and sex has demonstrated moderately high (70–80%) sensitivity and has a positive predictive value and high specificity (95%) [6]. While a BMI does not directly measure body fat, it is moderately correlated with direct measures of body fat and is strongly correlated with negative health outcomes secondary to carrying excess body weight [7, 8]. Furthermore, it is feasible for use in primary care settings due to being cost-effective and simple to obtain data used in its calculation [4]; therefore, it has been recommended for use in health maintenance visits where anticipatory guidance and intervention can occur as needed [9]. The American Academy of Pediatrics recommends annually plotting BMI for children starting at two years of age. The United States Preventive Services Task Force recommends starting to screen for overweight and obesity at six years of age [4].
Body mass index measures are used within nationally representative databases to report the prevalence rates of obesity [10]. Current reports demonstrate population level statistics and variation that occur among subpopulations of children based on age, gender and race/ethnicity [4]. While this has been useful to classify children with an abnormal weight status it does not provide information on some subsets of children, specifically those with certain intellectual and developmental disabilities [11]. These children may not be included in the population reference samples if they are unable to stand [11] or the BMI may provide inaccurate representation as these children may have an atypical body habitus or physical challenges with measuring height [12].
While BMI is promoted as a reliable indicator to screen for overweight and obesity in the typically developing population, concerns for error in individuals with disabilities have been reported [11, 13–19]. Two primary concerns have emerged when using BMI in individuals with disabilities. First is the BMI’s reliance on an accurate measure of height and the second is the assumption that the individual’s muscle mass will be similar to that of the representative sample [11]. Obtaining an accurate measure of height in children with certain disabilities may be challenging due to their inability to stand independently or stand straight due to secondary paralysis or orthopedic complications (e.g., kyphosis, contractures, or scoliosis). In these circumstances, a measurement of arm span is a recommended surrogate measure of standing height [20]. Additionally, some disabilities may present with a decreased height velocity and/or muscle hypoplasia that alters their lean mass relative to age and height [18, 22]).
Individuals with specific disabilities are known to have a higher prevalence of obesity compared to typically developing peers [12, 25]. However, the aforementioned measurement challenges create barriers in the ability to accurately report obesity prevalence rates for this at-risk population. For some disabilities (i.e., Down syndrome), BMI growth charts exist but current recommendations from the American Academy of Pediatrics are that the CDC’s age and sex-specific BMI charts remain the primary screening tool for obesity in children with Down syndrome [26]. The measurement challenges associated with individuals with disabilities were addressed in 2015 when the Eunice Kennedy Shriver National Institute of Child Health and Human Development brought together experts in the field of obesity and disability to develop a research agenda to address this critical problem. One of the priorities that emerged from this meeting was the need to develop an appropriate measure of obesity for individuals with disabilities that would not only be reliable and valid but feasible for use in both the clinic and for epidemiologic assessment [13]. While the consequences of obesity are detrimental for all individuals, it further exacerbates already present medical complications and creates additional challenges by inhibiting self-management, transition to independence and also burdens the caregivers of those with disabilities [27]. To appropriately prevent or treat obesity, the ability to accurately identify and track an individual’s weight status is a non-negotiable priority.
Purpose
The purpose of this study was to identify the ability of BMI to accurately categorize weight status in a sample of children with spina bifida and Down syndrome compared to typically developing peers. A secondary aim was to examine the influence of an individual’s mobility status on misclassification. It was predicted that BMI would underestimate or misidentify the weight status of a child with a disability significantly more than it would in children without a disability.
Methods
Design and ethical approval
This work was a secondary analysis of data from the cross-sectional primary study that examined energy expenditure in children with and without disabilities [28]. Approval was granted from the Institutional Review Board of the Children’s Hospital where the study was conducted.
Setting and sample
The study was conducted within the Pediatric Translational Research Unit of a Midwestern Children’s Hospital. The original one included a convenience sample that consisted of 36 children between 4–18 years of age stratified by diagnosis, age group (i.e., 4–7, 8–12 and 13–18 years of age) and mobility status due to inherent lean mass differences based on age and diagnosis [28]. This secondary analysis included children from the original sample between 5–18 years to match the age range of the body fat percentile reference curves used. The current sample was stratified by diagnosis and mobility to form four groups of children: 1) with spina bifida who primarily used wheelchairs for mobility, 2) with spina bifida who ambulated independently, 3) with Down syndrome, and 4) without a disability. Participants were recruited from study advertisements and mailings to patients of diagnosis-specific clinics within the hospital and community and family organizations. Diagnosis of study participants was based on parent report. Children and families who were unable to read and speak English and/or were traveling in excess of 200 miles during the 14-day test period, secondary restrictions related to the doubly labeled water protocol, were excluded.
Measures and procedures
Standing height
If able to stand independently, a height was obtained with the participant removing shoes and/or assistive devices and standing erect against a calibrated wall-mounted stadiometer. Height was measured to the nearest 0.1 of a centimeter three times and averaged.
Arm span
If unable to stand independently, an arm span was measured by having the participant abduct shoulders 90° and fully extend arms and hands. A flexible tape measured distance between the tip of the longest finger of each outstretched hand. Arm span was measured to the nearest 0.1 of a centimeter three times and averaged.
Body weight
Shoes and excess clothing were removed and participant was weighed on a medical grade calibrated scale. If they used a wheelchair or assistive devices, they were first weighed with the chair and/or device(s) and then the chair/device(s) were weighed independently and subtracted from original weight.
Body mass index
A BMI was calculated with the child’s height and weight (kg/m2) and subsequently plotted on the age- and sex-appropriate CDC BMI graph. This provided the child’s BMI percentile.
Weight status based on BMI calculation
After the BMI was calculated and plotted on the age and sex appropriate CDC BMI graph, the BMI percentile was used to determine the child’s weight status based on the CDC 2000 cut off criteria: < 5th percentile representing underweight, 5th percentile to < 85th percentile normal weight, 85th percentile to < 95th percentile overweight and ≥95th percentile obese [29].
Labeled water
Participants fasted for a minimum of six hours and a baseline urine sample was collected at the beginning of appointment. Participants were then provided an oral dose of doubly labeled water based on the child’s body weight and a 50 mL rinse of the bottle. Energy expenditure was reported elsewhere [28]. This analysis utilized the total body water (TBW) determined. After consumption of the doubly labeled water, four urine samples were obtained hourly. The baseline, 3 h and 4 h post-dose urines were used to measure TBW. Total body water was calculated as follows TBW = ((W×A/a)×(ΔDD/ΔBW)/(1000×C1)) –(weight of water consumed between dosing and 4h) [30]. In the calculation, “W” is the mass of diluent water and “a” is the mass of dose water used in the dilution, and “A” is the mass of dose water. “ΔDD” is the enrichment measured in the diluted dose and “ΔBW” is the enrichment measured in body water based on post-dose urine sample minus pre-dose baseline sample. C1 is the correction for nonaqueous distribution of isotopes which is 1.041 for 2H and 1.007 for 18O [30].
Body fat percentage
The water content of the body at birth is 70–75%but decreases into adulthood. Water (intra and extracellular) is contained exclusively within the fat-free mass [30]. Doubly labeled water was used to determine body fat percentage based on the calculation of total body water/hydration factor of fat-free mass based on child’s age and sex [31]. The equation uses hydration factor of fat-free mass for children from Foman et al. as modified by Schoeller [32] after correcting for the low estimate of nonaqueous distribution of 2H2O.
Weight status based on body fat percentile
The body fat percentage obtained by the doubly labeled water assessment was applied to two body fat percentile reference curves for children [33, 34]. Body fat percentile reference curves for children are limited and vary depending on the method of measuring body fat. Moreover, the reference values may not cover all ages. A reference curve based on a whole-body measure of body fat is preferred. The authors were aware of only one that used dual x-ray absorptiometry (DXA) but the minimum age of reference values provided started at age eight [34]; this will be referred to as Ogden. The age range of this reference curve did not cover the entire sample so another reference curve based on skinfold measures [33] that has a wider age range starting at age 5 was also used and will be referred to as Laurson. The body fat percentage was applied to the age and gender specific body fat percentile reference curves and the CDC cutoff criteria were applied to determine child’s weight status [29].
Analysis
Statistical analysis was conducted with SPSS 22 [35]. Demographic and anthropometric measures were described with descriptive statistics. A Fisher’s exact test was performed to examine if there was a significant difference between the accuracy of BMI classification between diagnosis groups with significance based on α= 0.05.
Results
The study sample included 32 children between the ages of 5–18 years of age with 15 females (47%) and 17 males (53%). Four participants from the original sample of 36 were excluded, three for quality control issues or not completing the labeled water protocol and one due to age lower than reference curves used. Fourteen had spina bifida, seven of whom primarily used wheelchairs for mobility and seven of whom ambulated without assistance. Nine had Down syndrome. The fourth group consisted of nine without a disability. Based on BMI using the height and weight measures and the CDC cutoffs for weight status, the weight status of three of the children were considered underweight (9%), 21 were considered normal weight (66%), five overweight (16%) and three obese (9%). See Table 1.
Participant Characteristics
Participant Characteristics
Abbreviations: % = percent, BMI = Body Mass Index, CDC =Centers for Disease Control, Laurson = body fat percentile reference curve by skin fold for ages 5–18, Ogden = body fat percentile reference curve by dual x-ray absorptiometry for ages 8–18.
Based on the body fat percentile reference curve by Laurson [33] the TBW derived percent body fat of the 32 children indicated that 16 (50%) of the children met the criteria for having a normal weight, five (16%) overweight and 11 (34%) met the criteria of obesity. For the whole sample, when BMI based on the CDC cutoffs for weight status was compared with this classification based on Laurson, 15 of the 32 children (47%) were misclassified. When only assessing children with a disability, the BMI misclassified the weight status for 14 (61%) of the 23 with a disability as compared to misclassifying only one (11%) of the nine without a disability (p = 0.018, Fisher’s exact test). Of the 14 with a disability whose weight status was misclassified, all seven with spina bifida who used a wheelchair, three of the seven with spina bifida who ambulated without assistance and four of the nine with Down syndrome were misclassified. Of the 14 misclassifications in those with disabilities, 12 (86%) were due to the BMI calculation underestimating the child’s weight status up to three weight categories (e.g., underweight compared to obese) and two (14%) overestimated the child’s weight status by one category. When comparing the accuracy of weight status classification against the Laurson curves based on having a disability and mobility status, there was a significant difference of those with spina bifida misclassified by BMI who primarily used a wheelchair as compared to the remaining sample who ambulated without assistance (p = 0.019, Fisher’s exact test). See Fig. 1. Further, the children with spina bifida whose weight status had more disparate misclassifications (e.g., two or three categories) tended to be younger (mean±sd: 8.3±4.0 years) when compared to those misclassified by one category (mean±sd: 12.2±4.5 years) or those without misclassification (mean±sd: 13±2.3 years).
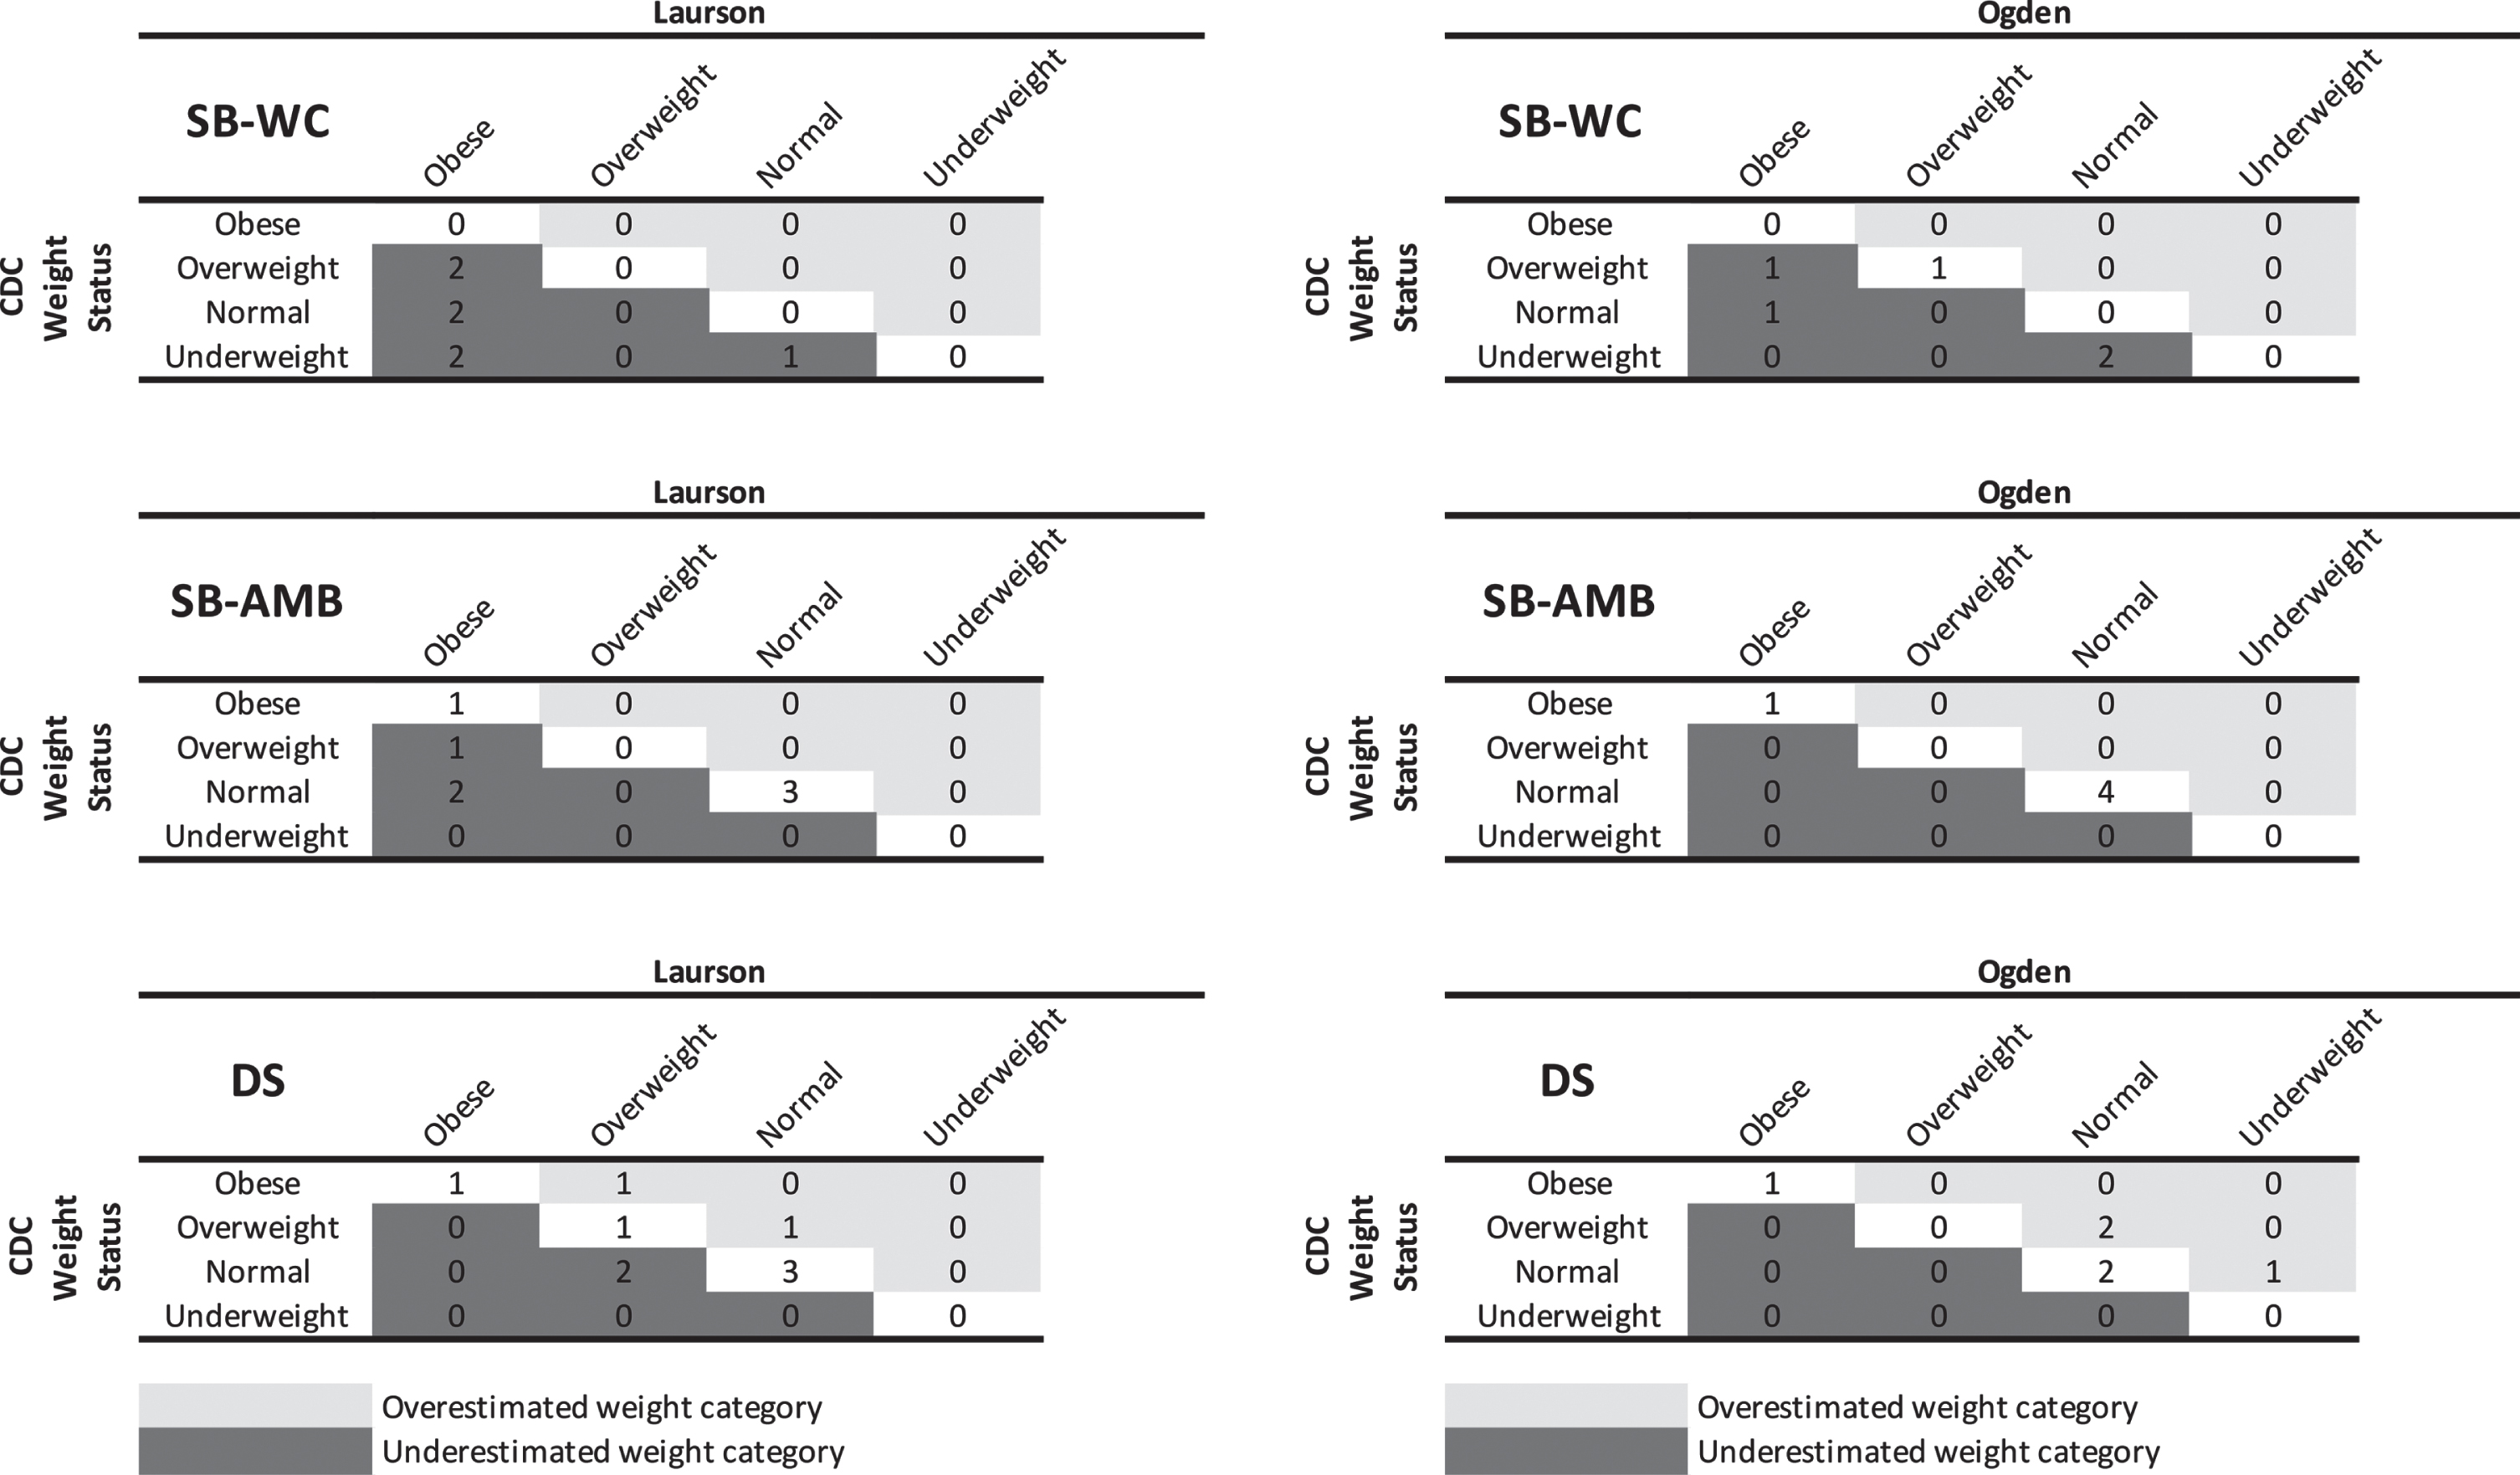
Misclassification of Weight Status Based on Body Mass Index Derived from Body Fat Percentile Reference Curve.
The body fat percentile reference curve and adiposity classification by Ogden [34], which were derived from a DXA measure of body fat, could only be used in the evaluation of weight status classification by BMI in 22 children (16 with a disability and 6 without) because the reference curve was limited to children 8–19 years of age. Of those 22, two children (9%) were underweight, 15 (68%) normal weight, one overweight (5%) and four obese (18%). When Ogden was used as the criterion, BMI using the CDC cutoffs for weight status misclassified the weight status for eight (36%) of the 22; seven (43.7%) with a disability (four with spina bifida who primarily used a wheelchair for mobility and three with Down syndrome) and one (16.6%) without a disability (p = 0.35, Fisher’s exact test). The degree of misclassification of weight status was mixed with four (50%) being underestimated by up to two weight categories and four overestimating the child’s weight status by one weight category. No statistically significant difference in misclassification of weight status of children who primarily used a wheelchair (4/5) compared to those who ambulated without assistance (3/11) was present (p = 0.11, Fisher’s exact test). See Fig. 1.
Discussion
Obesity is an urgent public health concern with a variety of associated health consequences. The origins of obesity are multifactorial. Once established, obesity is difficult to treat [5]. The negative consequences magnify and increase for children with disabilities [13, 36]. Recognizing this public health threat and the challenges associated with treating obesity, healthcare and pediatric focused organizations have concentrated their efforts on prevention and early detection. The success of preventive efforts relies on the ability to accurately screen and track a child’s weight status. Concurrently, the tool used to screen should be feasible for use in a clinical environment mandating that it is cost-effective and efficient. Body mass index meets these criteria for the population in which it is developed, i.e., children who are typically developing. Unfortunately, for those with disabilities, BMI has been criticized and often reported to provide erroneous information. This is a critical oversight that negates prevention efforts for this population that is already known to be at higher risk of having obesity [13].
While the study had a small sample, the misclassification of weight status by BMI was most notable when comparing children with disabilities who used a wheelchair for mobility. It was still less than ideal in those who ambulated without assistance when compared to classification based on percent of body fat. The misclassification occurred with both spina bifida and Down syndrome at a higher rate when compared to their typically developing peers. This was evident with both body fat percentile reference curves although the Ogden curve that was developed based on a whole-body measure of fat had lesser inaccuracies. Unfortunately, the age limitations of the Ogden curve limited the ability to examine the entire sample with this reference curve.
The explanation of these misclassifications may be due to fundamental issues inherent to the diagnoses of spina bifida and Down syndrome. Spina bifida, associated with physical impairments and potential lower extremity weakness or paralysis, has particular challenges with measurement of height as well as an atypical body composition. The level of lesion in spina bifida is associated with the orthopedic challenges (e.g., contractures, scoliosis) that the child encounters as well as the use of a wheelchair for mobility. These orthopedic complications create challenges in obtaining an accurate height measurement that is a primary component of the BMI calculation. In addition, the orthopedic challenges often involve the lower extremities and can include muscle weakness or paralysis. This furthers the loss of muscle mass creating an atypical body habitus that can contribute to inaccuracies when using BMI. For the lower number of misclassifications present in children with spina bifida who ambulated without assistance, the rationale may be related to the wide variation of those who meet this category but would inherently have a lower level of lesion and thus decreased orthopedic complications and/or loss of muscle mass. In future studies, in addition to a larger sample, it would be beneficial to assess the misclassifications based on the child’s lesion level. Unfortunately, this information for the current study was not accessible. By the age required to enter the study, individuals with Down syndrome typically are able to stand independently without orthopedic issues so an accurate measurement of height is not the primary challenge. Potential issues that can facilitate the misclassification of BMI for this population is their shorter stature, including a shorter limb length, atypical growth pattern that starts earlier and is stunted and decreased fat-free mass [14].
For the children with spina bifida a consistent and important finding was that all misclassifications by BMI underestimated the children’s weight status. This underestimation occurred with both reference tables. The direction of the misclassification is important as it can contribute to the understanding of the origin of the BMI inaccuracy. For the same body mass, if height is underestimated, a BMI would overestimate weight status whereas if percentage of fat was increased and low muscle mass was present, an underestimated weight status would be expected. The number of categories that the weight status was underestimated for in children with spina bifida varied. Of the 10 misclassifications for children with spina bifida based on BMI being compared to the Laurson curve, the child’s weight status was underestimated by one category for four (40%) children, two categories for four (40%) and three categories for two (20%). Those who were misclassified by two or three categories tended to be younger, suggesting that underestimation of weight status may be more severe among younger children. This is an unexpected finding as one would consider loss of muscle mass or discrepancy with height occurring more as the child ages. This warrants further study with a larger sample. Overall, a consistent underestimation of weight can hinder the ability to accurately diagnose overweight and/or obesity at its earliest stages, delaying interventions for behavior change and weight loss.
For children with Down syndrome, misclassification was still present, but the severity of misclassification was less severe and the direction of the BMI misclassification was mixed. When the BMI was compared to the Laurson curve, it misclassified four of the nine children’s weight status; two (50%) were underestimated and two (50%) were overestimated. While the direction of the misclassification varied, none of the discrepancies were by more than one category. The variation in direction of the misclassification may be related to children with Down syndrome having issues with reduced stature and an atypical body composition with decreased muscle mass.
The misclassifications were present at a higher rate for children who had a disability compared to those without for both reference curves (Laurson 61%vs. 11%; Ogden 44%vs. 17%). These rates worsened dramatically for children who primarily used a wheelchair for mobility compared to their typically developing peers (Laurson 100%vs. 11%; Ogden 80%vs 17%). The small sample size limited the ability to analyze these discrepancies, but even with the use of a reference curve that was developed based on a whole body measure of body fat, 44%misclassifications for all disabilities and 80%for those who use a wheelchair highlight the concern with using BMI as a screening tool for children with disabilities.
Once obesity is present, the ability to reverse the condition is extremely difficult. The earlier obesity sets in, the easier it is for behaviors that support obesity to become engrained. Obesity that begins in childhood is known to have a higher likelihood of continuing into adulthood. To continue the use of BMI for this at-risk group further challenges the child, family members and the healthcare provider by hindering their ability to screen or accurately assess changes in the child’s weight status. Limitations to the current study exist. The small sample size and lack of assessment of severity of the condition (e.g., degree of hypotonia in Down syndrome and level of function for spina bifida) limits the generalizability of the findings, representativeness of the sample, the ability to assess the range of differences in body composition by characteristics accompanying the diagnoses beyond that of mobility status and may have hindered the ability to detect statistical significance. In addition, the inability to have a whole-body measure that covered all ages of the sample was a limitation. A final one was the use of arm span as a surrogate measure of height for individuals who primarily use a wheelchair. While this is a recommended measure of height for this population [20], there is limited literature supporting its substitution for standing height. Studies that identify the implications of this substitution and/or any correction that needs to be made in the clinic setting should be addressed in future research.
The results of this study demonstrate that there is variance by diagnosis and ages of children. Further work with larger, more diverse samples that assesses the severity of the condition is needed to increase the generalizability of these findings. As identified by the workgroup convened by the Eunice Kennedy Shriver National Institute of Child Health and Development [13], the need for an accurate method to assess a child’s weight status for those with a disability is a priority. Further research needs to be developed that will integrate the differences of an individuals’ decreased muscle mass and height velocity in a measure of weight status. This may include the use of alternative height measures or the creation of an algorithm to accommodate the range in low muscle mass. As the decrement in muscle mass further decreases in adulthood, including those with disabilities will benefit future work. In the interim, clinicians need to be aware of the potential for misclassification of weight status with the use of a calculated BMI for this population and deliver anticipatory guidance accordingly. In addition, further work in this area is a priority in order to provide personalized and equal care for all children.
Conclusion
While routine screening for obesity risk and documenting weight status is recommended for all youth, a disservice is occurring for children with disabilities with the inability to accurately identify individuals’ weight status in a cost-effective and efficient manner within the clinical environment. The current recommendation to use a calculated BMI is not useful for many individuals with spina bifida and Down syndrome and probably other disabilities. Further research to address and identify an alternative pragmatic strategy is necessary.
Footnotes
Acknowledgments
The authors would like to thank the families who participated in the study, staff of the Children’s Wisconsin Pediatric Translational Research Unit and researchers at Isotope Ratio Core Lab within the Biotechnology Center at the University of Wisconsin –Madison, who supported data collection and analysis.
Conflict of interest
The authors have no conflicts of interest to report.
Funding
This work was supported by the National Institutes of Nursing Research (NINR) of the National Institutes of Health (NIH) under Award Number P20NR015339. Additional support for this project was provided in part by the Clinical and Translational Science Institute of Southeastern Wisconsin through the Advancing a Healthier Wisconsin Endowment of the Medical College of Wisconsin Award 8UL1TR000055 from the Clinical and Translational Science Award Program of the National Center for Research Resources and the National Center for Advancing Translational Sciences. The content is solely the responsibility of the author(s) and does not necessarily represent the official views of the NIH.