
Abstract
BACKGROUND:
Fatigue is the most prevalent symptom among people with multiple sclerosis (PwMS). Although exercise effectively reduces fatigue, the relationship between daily physical activity and fatigue has only recently been demonstrated.
OBJECTIVE:
The aim of this study was to evaluate the prevalence of fatigue and to understand the relationship with several variables in French PwMS.
METHODS:
Data were collected from 191 PwMS using Modified Fatigue Impact Scale (MFIS) and Fatigue Severity Scale (FSS) for fatigue, and the Godin Leisure-Time Exercise Questionnaire (GLTEQ) for physical activity.
RESULTS:
110 PwMS (57%), 35 PwMS (18%) and 46 PwMS (24%) were considered as fatigued, non-fatigued and in the grey zone, respectively. Greater physical activity was observed in non-fatigued PwMS (20.2±19.8) compared to fatigued PwMS (12.5±14.1). FSS and MFIS scores were associated with physical activity (r = –0.28 and r = –0.25, respectively, p < 0.05). Using multivariate analysis, disability, physical activity and being unemployed explained 21% of the variance of the MFIS.
CONCLUSIONS:
The present study confirms that physical activity and fatigue are associated. Disability and unemployment status should also to be consider when assessing fatigue. Activity-oriented health policies should be redesigned to improve fatigue among PwMS.
Keywords
Introduction
Multiple sclerosis (MS) is an auto-immune disease characterized by the demyelination of the axons from the spinal cord and brain. More than 2,500,000 people worldwide and 115,000 in France are affected by this neurological disorder. MS is the first cause of disability in the young adults after car accident consequences. Progressive damage to the myelin sheaths induces numerous impairments of functional capacity. Among the manifestations of the disease, fatigue is one of the more frequent and disabling symptoms reported by people with MS (PwMS) (Lerdal, Celius, Krupp, & Dahl, 2007). This symptom has been defined as a “subjective lack of physical and/or mental energy, perceived by the individual or caregiver, that interferes with usual and desired activities” (Multiple Sclerosis Council for Clinical Practice guidelines, 1998). It is distinct from the fatigue observed in healthy individuals due to its disabling nature and the fact that fatigue is not relieved by rest or sleep. PwMS describe a disproportionately high level of effort required to perform everyday tasks, resulting in a major physical, psychological, and socio-economic burden (Krupp, Serafin, & Christodoulou, 2010). Unemployment is an unfortunate consequence of MS-related fatigue (Kavaliunas, Danylaitė, Binzer, & Hillert, 2021), along with decreased quality of life. The term fatigue is complex and must be distinguish from performance fatigability (Kluger, Krupp, & Enoka, 2013), which refers to an objective measurement (e.g. decrease of force production). Fatigue can be evaluated by self-report using questionnaires such as the Fatigue Severity Scale (FSS) or the Modified Fatigue Impact Scale (MFIS) which are the most used scales of fatigue in PwMS (Krupp, LaRocca, Muir-Nash, & Steinberg, 1989). These self-report questionnaires do not rate the same parameters. For instance, FSS primarily rates the physical dimension while the MFIS include physical, cognitive and psychosocial dimensions (Tellez et al., 2005).
PwMS have lower physical activity than healthy populations (Motl, 2014). Physical activity can be measured by objective (accelerometers) or subjective (i.e. questionnaires, logs) methods (Motl, Bollaert, & Sandroff, 2018). A large survey conducted on 1,011 PwMS indicated low physical activity in this population, one of the main barriers being MS-related fatigue (LaRocca, 2011). In fact, for many years PwMS were advised to reduce their physical activity level and adapt their lifestyle because exercise was thought to worsen MS-related symptoms (Tallner, Mäurer, & Pfeifer, 2013). This policy has substantially contributed to the phenomenon of physical deconditioning and has led to the emergence of co-morbidities such as type II diabetes in this population (Giesser, 2015). It has been shown that PwMS with less physical activity show more severe fatigue (Motl, McAuley, Snook, & Gliottoni, 2009). Energy conservation strategies have long been advised for PwMS, favoring a sedentary lifestyle. However, this lifestyle induces deconditioning and may exacerbate fatigue due to a low resistance to fatigability during exercise (Eldadah, 2010). Thus, activities of daily living may become more fatiguing, leading PwMS to perform less physical activity, thereby dragging them into the vicious cycle of fatigue.
Moreover, numerous studies have shown that physical rehabilitation programs have led to reduced fatigue and improved quality of life in PwMS (Motl & Sandroff, 2015). Despite the clinical importance of MS-related fatigue, there are no specific recent data on fatigue prevalence in relation to physical activity in PwMS in France. The introduction of new pharmacological drugs in the treatment of MS has led to an evolution in the medical management of PwMS that may have consequences on treatments’ side effects such as fatigue (Cao et al., 2021; Tran et al., 2017). It is therefore necessary to make regular updates to ensure that fatigue does not significantly increase in PwMS. The aim of this study was thus to characterize fatigue and understand the relation between with physical activity, disability and socio-economic status in French PwMS. It was hypothesized that (i) the majority of PwMS would rate themselves as clinically fatigued, (ii) fatigued PwMS would be less physically active, more disabled and have a higher unemployment rate than non-fatigued PwMS, and (iii) disability, physical activity and socio-economic status would be explicative variables of fatigue.
Methods
Research design
Participants
All individuals (24–78 years old) from the EDMUS (European Database for Multiple Sclerosis) database of the University Hospital of Saint-Etienne, France were screened for this study. The survey took place in September 2020. Age, sex, body mass index (BMI), subtypes of MS, beginning of the MS, the last relapse and the treatment were obtained from EDMUS database. This study was approved by the local ethic committee (Comité Ethique Territorial Terre d’Ethique, IRBN762019/CHUSTE) and written informed consent was obtained from all persons. This study was conducted in conformity with the declaration of Helsinki.
Data collection
A letter explaining study goals and protocol with the questionnaires attached was sent to all of those in the database. These individuals were asked to fill in all the corresponding cases of questionnaires with detailed information (profession, phone number) and return them with a stamped envelope. Reminder calls were sent to those contacted after 3 and 6 week delays.
EDSS
The disability level of PwMS was quantified by the expanded disability status scale (EDSS) (Kurtzke, 1983). This scale examines different neurological functional systems (cerebral, pyramidal, cerebellar, brainstem, sensory, bowel/bladder, visual) and walking capacity to identify a score between 0 to 10, when 0 corresponds to no disability, 6 corresponds severe disability and need assistance to walk and 10 corresponds to the death. The EDSS was scored by a neurologist.
Fatigue questionnaires
The Modified Fatigue Impact Scale (MFIS) rates 3 components of fatigue (physical, cognitive and psychosocial) (Tellez et al., 2005). The MFIS is the short version (21 items) of the fatigue impact scale (Fisk et al., 1994). We used the version validated in French (Debouverie, Pittion-Vouyovitch, Louis, & Guillemin, 2007). MFIS is recommended by the Multiple Sclerosis Council for Clinical practice and Guidelines (Guidelines, 1998). Answers are scored from 1 (completely false) to 4 (completely true) so that the final score varies from 21 to 84. Flachenecker et al. (2002) used the MFIS score of 38 as the cut-off used to categorize PwMS as fatigued or non-fatigued. The FSS is a scale which rates physical aspects of fatigue through 9 components (Krupp et al., 1989). The final score varies from 1 to 7. For this study, the French version was used (Debouverie, Pittion, Guillemin, & Vespignani, 2002). From the study of Flachenecker et al. (2002), 4 was the cut-off used to categorize PwMS as fatigued or non-fatigued. There is a positive association between level of fatigue and score for both questionnaires, i.e. a high score indicates that the PwMS is considered to be highly fatigued and vice-versa. To determine whether PwMS were fatigued or not, we used the two fatigue questionnaire scores. The use of the two questionnaires that rate different components of fatigue allows for a more rigorous PwMS selection based on their fatigue. PwMS with both scores above the cut offs were considered as fatigued and inversely, when the both scores were below the cut offs, they were considered as non-fatigued. Those who do not have both scores above or below the cut-offs (FSS = 4; MFIS = 38) were removed from the analysis. In other words, if a PwMS was in a grey zone, i.e. scored as fatigued in one questionnaire and non-fatigued in the other one, he/she was not considered for the group comparison analysis. Yet, all PwMS were taken into account for the Least Absolute Shrinkage and Selection Operator (LASSO) and correlation analysis.
The Godin Leisure-Time Exercise Questionnaire
The Godin Leisure-Time Exercise Questionnaire (GLTEQ) is a questionnaire that rates physical activity. The GLTEQ is largely used on clinical populations, including MS people (Motl et al., 2018). This questionnaire quantifies the frequency of sessions of physical activity lasting at least 15 minutes, over periods of one week. Three levels of physical activity are proposed (low, moderate, high) to report the intensity of activity, so as to calculate a weekly leisure time activity rate from a corresponding Metabolic Equivalent of Task value. For this study, the French validated version was used (Vernay et al., 2000).
Socio-economic classification
The profession of each people was classified according to French national institute for statistical and economic studies. This is the correspondence for each class: 1-Farmer; 2-Storekeeper, craftman, and company manager; 3-Executives and higher intellectual professions; 4-Intermediate professions; 5-Employees; 6-Worker; 7-Retired people; 8-Other people without professional activity.
Statistics
Analyses were performed with Statistical software R/statistical environment (R Core Team, 2021). For all tests, significance level was set at p < 0.05. Missing data were inputted using the k-nearest neighbor (k = 5) method, from the ‘VIM’ package wherein 5 (‘k’) samples were used to estimate the value of the missing data points. Relevant predictors were selected using LASSO regression. This technique uses a coefficient to minimize excessive weighting of individual data points and selects for only the most relevant predictors (Tibshirani, 1996). Ten-fold cross-validated linear LASSO regression was performed using the glmnet package (Friedman, Hastie, & Tibshirani, 2010). Selected independent variables were entered into a linear regression model with FSS or MFIS as a dependent variable. Data normality was verified using the Shapiro-Wilk test. To compare differences between fatigued and non-fatigued groups, the Mann-Whitney U-test was used. Pearson’s correlation coefficient was used to determine the relationship between questionnaires and people’ characteristics. Results are expressed as mean values±standard deviation (SD).
Results
The questionnaires were sent to 533 PwMS, of whom 191 (36%) replied. Among the 191 responses received, 110 people (57%) were considered as fatigued, 35 people (18%) were considered as non-fatigued and 46 people (24%) were in the grey zone. PwMS of the grey zone were not included in the between-groups analysis, giving a total of 145 PwMS analyzed (Fig. 1).
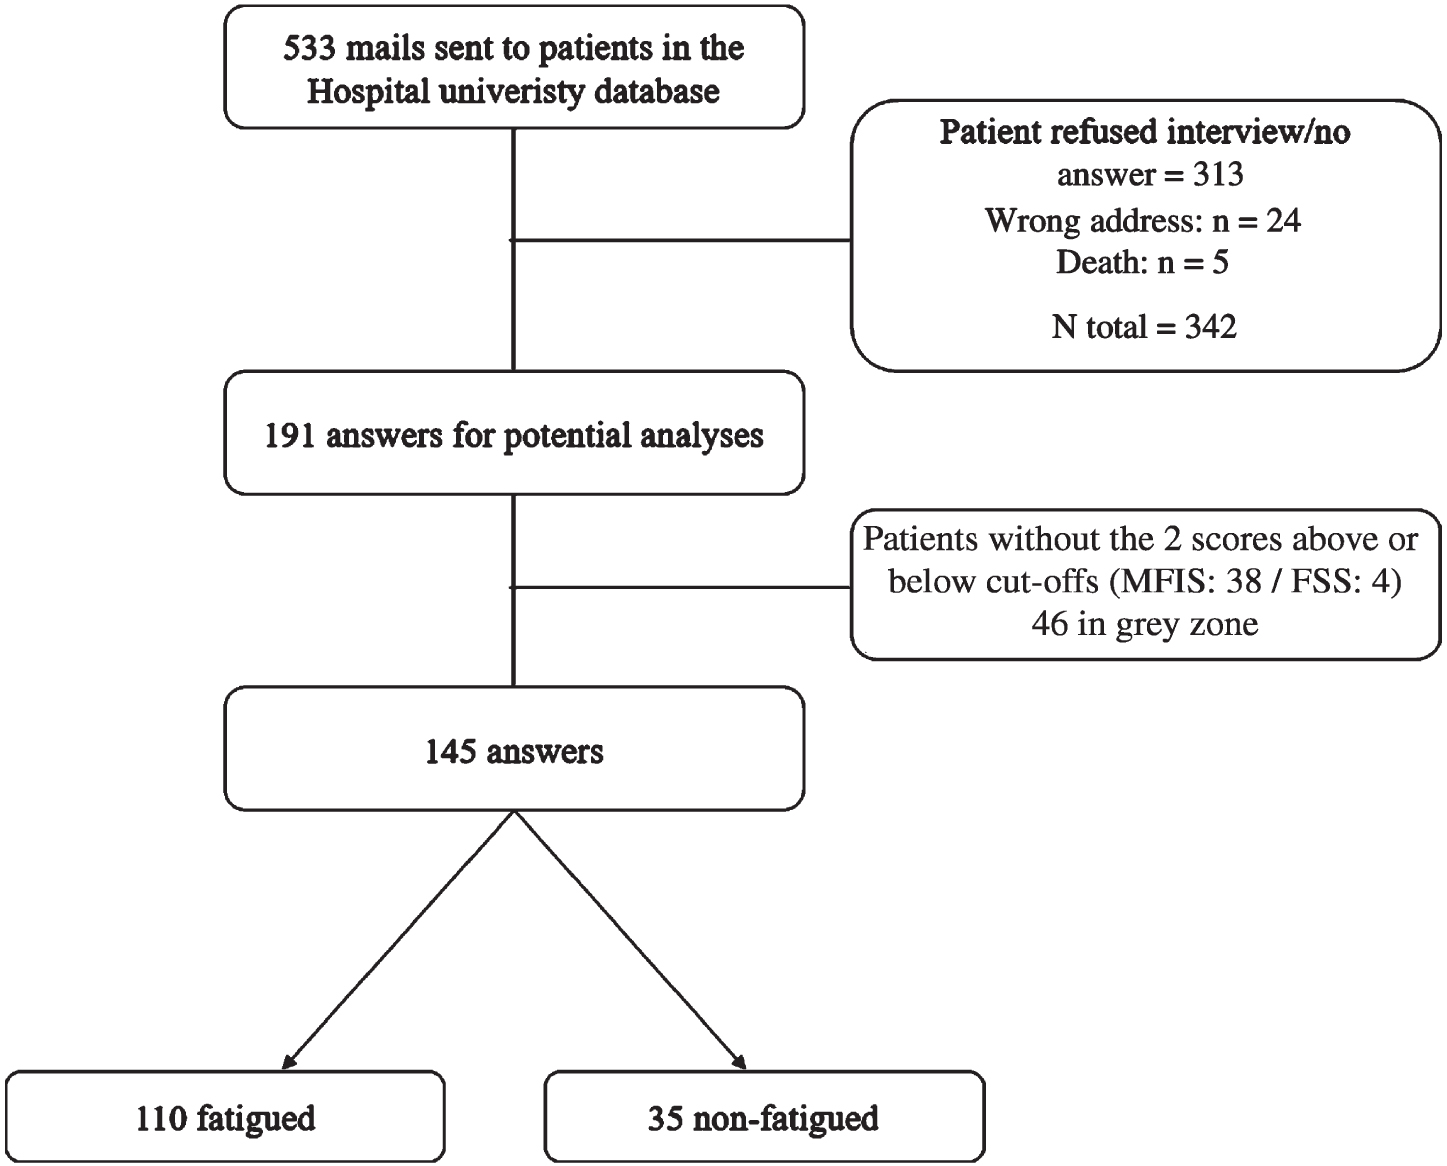
Flowchart of the answers and selection process.
The characteristics of PwMS are presented in Table 1. The percentage of men and women were not significantly different between the fatigued and non-fatigued groups. The duration since the beginning of the disease (fatigued 16.3±8.8 vs non-fatigued 12.4±8.5 years) and the type of MS were different between the two groups (Table 1). In fact, the percentage of recurrent-remittent MS was greater in the non-fatigued group compared to the fatigued group (86.1% vs 71.0%, respectively) and it was the opposite for secondary-progressive MS (8.3% vs 22.0 %, respectively).
Characteristics of the participants (mean±SD)
Characteristics of the participants (mean±SD)
*Significantly different between fatigued and non-fatigued groups (p < 0.05). EDSS, Expanded Disability Status Scale; FSS, Fatigue Severity Scale; GLTEQ, Godin Leisure-Time Exercise Questionnaire; MFIS, Modified Fatigue Impact Scale; BMI: Body Mass Index; MFIS.phy: Physical subscale of the MFIS; MFIS.cogn: Cognitive subscale of the MFIS; MFIS.psycho: Psychosocial subscale of the MFIS. RR: recurrent-remittent multiple sclerosis; SP: secondary progressive multiple sclerosis; PP: primary progressive multiple sclerosis.
The raw medians for fatigued groups were 5.7 (4.1–7) for the FSS and 64.0 (50–83) for the MFIS compared to non-fatigued groups were FSS score was at 2.4 (1–4) and the MFIS score was at 34.5 (21–47) (p < 0.05). The three subscales of the MFIS were significantly lower for fatigued compared to non-fatigued PwMS. The EDSS of the fatigued group was also higher compared to that of the non-fatigued group (3.9±2.3 vs 1.5±1.6, respectively). There was a moderate but significant association between fatigue questionnaires and EDSS (FSS: r = 0.44, p < 0.05; MFIS: r = 0.38, p < 0.05). Moreover, the 3 subscales of the MFIS were associated with EDSS (r = 0.45 physical, r = 0.20 cognitive and r = 0.34 for psychosocial, all p < 0.05) (Fig. 2).
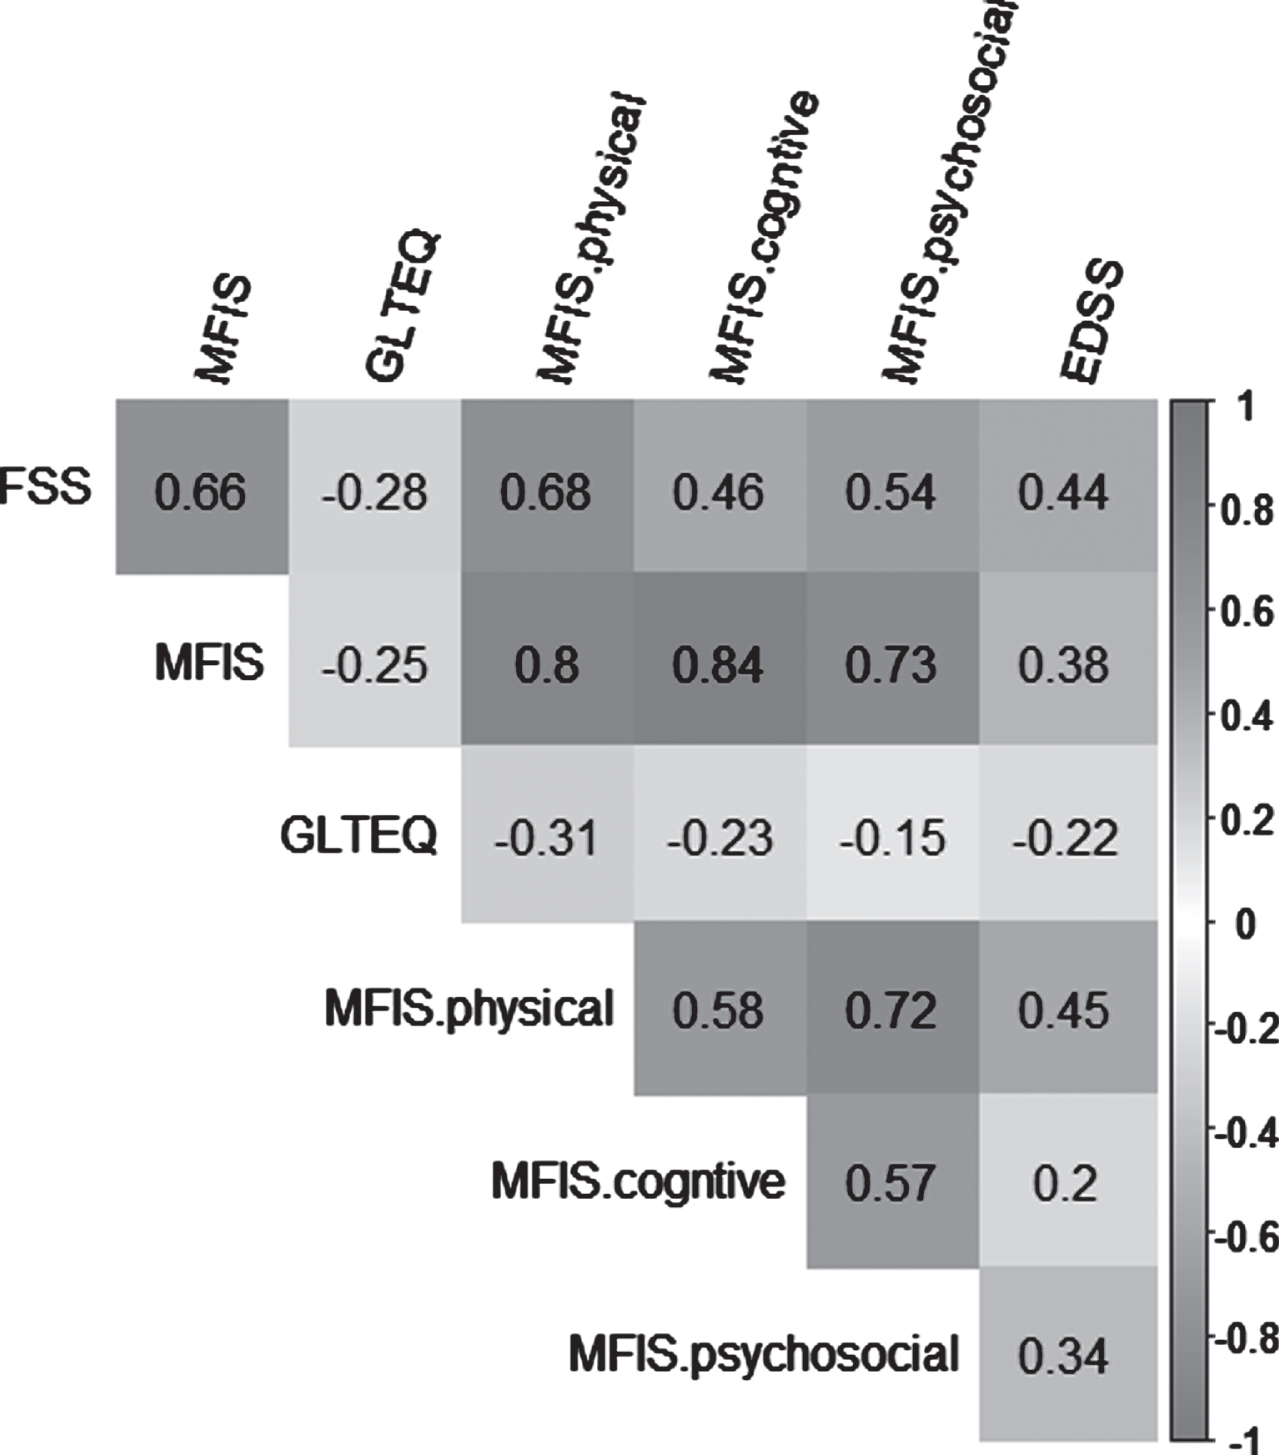
Correlation matrix containing Pearson’s correlation coefficients for fatigue questionnaires, level of physical activity and disability status.
Fatigued PwMS had a significantly lower level of physical activity when compared to non-fatigued PwMS, with a GLTEQ score of 12.5±14.1 vs 20.2±19.8, respectively (p < 0.05). There were significant associations between FSS and GLTEQ scores (r = –0.28, p < 0.05) and between MFIS and GLTEQ scores (r = –0.25, p < 0.05). Similar findings were observed for physical (r = –0.31, p < 0.05), cognitive (r = –0.23, p < 0.05) and psychosocial (r = –0.15, p < 0.05) subscales of the MFIS (Fig. 2).
Socio-economic classification
There was no dependence between fatigue and socio-economic categories. Yet, the level of disability was different between unemployed PwMS and other socio-economic categories combined (4.1±2.2 vs 2.9±2.4, p < 0.05).
Predictors of fatigue severity in function of Fatigue Severity Scale (FSS) and Modified Fatigue Impact Scale score (MFIS)
Predictors of fatigue severity in function of Fatigue Severity Scale (FSS) and Modified Fatigue Impact Scale score (MFIS)
The LASSO regression identified four explicative variables of FSS, namely GLTEQ, time from the last relapse, EDSS and unemployment status. Using a multivariate linear regression model, the GLTEQ, the EDSS score explained 24% of the variance of the FSS score (r2 = 0.241; p < 0.001). For the MFIS model, GLTEQ, EDSS, age and unemployment status were identified from the LASSO as explicative variables of fatigue that the resulting model including only GLTEQ, EDSS and unemployment explained 21% (r2 = 0.213; p < 0.001) of the variance of the MFIS (Table 3).
Socio-economics characteristic of the participants
Socio-economics characteristic of the participants
The aim of this study was to investigate the prevalence of fatigue and the role of physical activity amongst French PwMS. We hypothesized that there would be more fatigued than non-fatigued PwMS and that the level of physical activity would be higher for non-fatigued PwMS compared to fatigued PwMS. The present results confirm our two main hypotheses since it was shown that (i) over 50% of the PwMS were considered as clinically fatigued, and (ii) fatigued PwMS were less physically active than non-fatigued PwMS. Our third hypothesis was also confirmed given that physical activity, disability level and unemployment were retained as independent variables associated with fatigue scores.
Fatigue prevalence in MS
Compared to healthy controls, a greater prevalence of fatigue exists in PwMS as often reported with other diseases is survivors of intensive care units (Morel et al., 2022), cancer (Stone & Minton, 2008 ) or cardio-vascular diseases (Casillas, Damak, Chauvet-Gelinier, Deley, & Ornetti, 2006). In fact, a substantial proportion of PwMS complain about fatigue, varying from 36.5% to 78% of people (Oliva Ramirez et al., 2021). The present finding, that represent the lastest update of fatigue status of PwMS in France, confirmed the prevalence of fatigue since the majority of PwMS were clinically fatigued (57%). Higher proportions of fatigued PwMS compared to non-fatigued PwMS was reported in the latest survey studies (Bakshi et al., 2000; Broch et al., 2021; Lerdal et al., 2007). In a large survey (N = 1,011), among the symptoms experienced at least twice a week by people with MS, fatigue was the most reported symptoms (76%) (LaRocca, 2011). Interestingly, when fatigued and non-fatigued PwMS were combined, the median of fatigue questionnaires was largely above the cut-off (FSS: 5.3; MFIS: 60.0) used in the current literature (Flachenecker et al., 2002), confirming the prevalence of the fatigue in this disease despite new treatments.
Given that fatigue is a physical and social burden, general quality of life scores and their 3 dimensions (physical, social, cognitive) has been found to be lower when fatigue scores are higher (Pittion-Vouyovitch et al., 2006). Unlike physical activity (Motl & Pilutti, 2012), pharmacological treatments remain fairly ineffective in preventing or treating fatigue.
Physical activity and fatigue in MS
In the present study, a greater GLTEQ score was observed in non-fatigued compared to fatigued PwMS. Recently, Rzepka, Toś, Boroń, Gibas, and Krzystanek (2020) presented results similar to the present study, i.e. higher physical activity for non-fatigued PwMS compared to fatigued PwMS and similar moderate negative association between fatigue and physical activity questionnaires (MFIS: –0.33 vs –0.25; FSS: –0.38 vs –0.28, respectively). This provides further confirmation that fatigue and physical activity levels are linked. It has been previously shown that (i) PwMS had a significantly lower level of physical activity than healthy controls (Beckerman, de Groot, Scholten, Kempen, & Lankhorst, 2010; Klaren, Motl, Dlugonski, Sandroff, & Pilutti, 2013) (ii) less than 25% of PwMS are active (Marrie et al., 2009) and (iii) 45% of PwMS did one exercise session per week (LaRocca, 2011). Using accelerometry, Cederberg, Jeng, Sasaki, and Motl (2022) observed that fatigued PwMS performed fewer steps during the day, had a greater sedentary time and a lower moderate to vigorous physical activity compared to non-fatigued PwMS.
The present findings are not surprising because historically, it has been recommended that PwMS reduce physical activity to avoid worsening symptoms of the disease (Tallner et al., 2013). The energy conservation strategy may be useful in the short term, but the inactivity of PwMS is detrimental for many symptoms of MS, including fatigue (Giesser, 2015). Indeed, fatigue is the main reason people do not engage in physical activity (LaRocca, 2011). Low physical activity induces deconditioning which can increase fatigability. In line with our recent findings with fatigued vs non-fatigued people with cancer (Brownstein et al., 2022), we found that motor fatigability explained around 50% of the variance in fatigue questionnaires on PwMS (Coates et al., 2020). It can be speculated that higher fatigability, due to deconditioning induced by low physical activity levels, exacerbates daily life activities effort, which could contribute to fatigue (Twomey et al., 2017). Thus the energy conservation strategy is not sustainable, especially considering studies that have shown the benefits of different physical rehabilitation programs among PwMS. In addition to the direct effect on fatigability resistance, training interventions have other benefits such as limiting sleep disturbances and depressive feelings (Motl & Sandroff, 2015).
Predicting variables of fatigue
The causes of fatigue in PwMS remain unknown but categorization in primary and secondary fatigue was established to better understand this symptom. Primary fatigue refers to factors directly affected by the physiopathology of MS such as the central nervous system (cerebral atrophy, axonal demyelination), immunological (anti/pro inflammatory cytokines) and neuroendocrinological (hypothalamic-pituitary-adrenal axis dysfunction) pathways (Langeskov-Christensen, Bisson, Finlayson, & Dalgas, 2017). Secondary fatigue corresponds to factors non-specific to the MS (e.g. depression, sleep disorders, deconditioning) (Langeskov-Christensen et al., 2017).
In this study, we focused our reflection on secondary fatigue, as rated by self-reported questionnaires (Kluger et al., 2013). Using a robust multivariable analysis, we determined that EDSS, physical activity levels and being unemployed were the most significant factors explaining the variance of FSS and MFIS scores. Given that the relationship between fatigue and physical activity was previously considered in the above section, specific attention will be given to unemployment and disability in relation to fatigue.
An association was found between the score of the fatigue questionnaires and the EDSS score (r = 0.44 for FSS and r = 0.38 for MFIS), which is in line with previous studies showing associations between neurological deficits and fatigue severity using different fatigue questionnaires (Koch, Mostert, Heerings, Uyttenboogaart, & De Keyser, 2009; Pittion-Vouyovitch et al., 2006). However, as factors, EDSS and fatigue questionnaires were weakly (Šabanagić-Hajrić, Suljić, & Kučukalić, 2015; Tellez et al., 2005) or no longer associated after adjusting for depression (Bakshi et al., 2000), a symptom not considered in the present study. Recently, it was hypothesized that lower mobility due to disability could co-occur with fatigue in PwMS (Neal, Cederberg, Jeng, Sasaki, & Motl, 2020). Professional status also appeared to be an explicative variable. In fact, fatigue is gradually becoming a burden in the working environment, and there are higher proportions of unemployed among PwMS (range from 32% to 80%) than in the general population (Strober, 2020). Moreover, fatigue was one of the most important factors (i.e. the factor with the largest effect size) in explaining unemployment rate compared to other factors such as disease course, exercise/diet, self-efficacy (Strober, 2020). The need to reduce fatigue is thus necessary in order to give people the opportunity to work again. Although fatigue remains the main issue behind unemployment, disability level is likely also a factor. We observed that unemployed PwMS had greater disability levels than other socio-professional categories combined (4.1 vs 2.9). These findings are consistent with a recent systematic review (Kavaliunas et al., 2021) highlighting the impact of requiring PwMS to work part-time or to stop working completely because of their level of disability.
Limitations
One of the main limitations of this present study is the sample size (N = 191). A larger sample of PwMS would have given a better representation of the French MS population. The second limitation of our study is the number of independent variables to explain fatigue severity since a greater number of explicative variables would have allowed us to refine the explanatory analysis of fatigue.
Conclusion
The present study provides an updated view of fatigue, a highly debilitating symptom, among French PwMS. Fatigued PwMS were less physically active than non-fatigued PwMS and had a higher disability level. We determined that disability status, physical activity level and unemployment were independently associated with fatigue severity. Promoting physical activity is an important challenge in the fight against fatigue and other comorbidities. In the future, activity-oriented health policies are needed to provide a better quality of life for PwMS.
Conflict of interest
The authors declare that they have no conflict of interest.
Footnotes
Acknowledgment
The authors would like to acknowledge Vincent Visneux for his contribution to the data collection.