
Abstract
BACKGROUND:
Alternate day fasting (ADF) is a novel diet therapy that reduces body weight, but its effect on bone health remains unknown.
OBJECTIVE:
This study examined the impact of ADF versus traditional daily calorie restriction (CR) on markers of bone metabolism in a 6-month randomized controlled trial.
METHODS:
Overweight and obese subjects (n = 100) were randomized to 1 of 3 groups for 6 months: 1) ADF (25% energy intake fast day, alternated with 125% intake feast day; 2) CR (75% intake every day); or 3) control (usual intake every day).
RESULTS:
Body weight decreased similarly (P < 0.001) by ADF (–7.8±1.2%) and CR (–8.8±1.5%), relative to controls by month 6. Lean mass, total body bone mineral content and total body bone mineral density remained unchanged in all groups. Circulating osteocalcin, bone alkaline phosphatase, and C-terminal telopeptide type I collagen (CTX) did not change in any group. IGF-1 increased (P < 0.01) in the CR group, with no change in the ADF or control group. When the data were sub-analyzed according to menopausal status, there were no differences between premenopausal or postmenopausal women for any marker of bone metabolism.
CONCLUSION:
These findings suggest that 6 months of ADF does not have any deleterious impact on markers of bone metabolism in obese adults with moderate weight loss.
Keywords
Introduction
Daily calorie restriction (CR) regimens are some of the most widely used diet strategies for weight loss [1]. These regimens involve reducing energy intake by 15–40% of needs each day [1]. While CR has resulted in successful weight loss for some individuals, adherence can be challenging because of the need for daily calorie counting. Alternate day fasting (ADF) may be an effective alternative for weight loss, because this diet only requires calorie counting every other day [2, 3]. ADF generally allows for 25% of energy needs (∼500 kcal) to be consumed on the “fast day”, and ad libitum food consumption on alternating “feast days”. Previous trials of ADF generally report reductions in body weight of 3–8% after 2-3 months, accompanied by decreases in triglycerides, blood pressure, and increases in HDL cholesterol levels [3–10].
Fluctuations in body weight play an important role in bone health [11, 12]. Data from recent human trials show that weight loss by daily CR can result in bone loss [13–16], but not always [17–20]. Daily energy restriction regimens may also result in unfavourable changes in markers of bone metabolism. For instance, some controlled trials of CR have demonstrated decreases in markers of bone formation, including osteocalcin [14], bone alkaline phosphatase [15, 17], accompanied by increases in markers of bone resorption, i.e. C-terminal telopeptide type I collagen (CTX) [14, 17]. Whether weight loss by ADF produces similar deleterious modulations in markers of bone metabolism is an important question that has yet to be addressed. Accordingly, the goal of this study was to compare the effects of ADF to that of daily CR on markers of bone metabolism in a 6-month randomized controlled trial. We also performed a sub-analysis to examine if changes in these markers are influenced by menopausal status.
Subjects
This is a secondary analysis of a study that examined the impact of these diets on body weight [21]. Men and women (n = 100) aged 18–65 years with a BMI of 25 to 39.9 kg/m2 were recruited from the University of Illinois at Chicago campus and surrounding community by flyers, as reported previously [21]. Individuals were excluded if they had a history of cardiovascular disease, diabetes mellitus, were taking weight loss medications, were not weight stable for 3 months prior to study initiation, were peri-menopausal, pregnant, or smokers. All participants provided informed consent to participate in this study. The protocol was approved by the Office for the Protection of Research Subjects at the University of Illinois, Chicago.
Experimental design
Subjects were randomized by a stratified random sample (based on age, sex, and BMI) to 1 of 3 groups for 6-months: 1) ADF (n = 34); 2) CR (n = 35); or 3) control (n = 31) (Fig. 1). The 6-month trial was divided into a 3-month “controlled feeding period”, followed by a 3-month “self-selected feeding period” (Fig. 2).
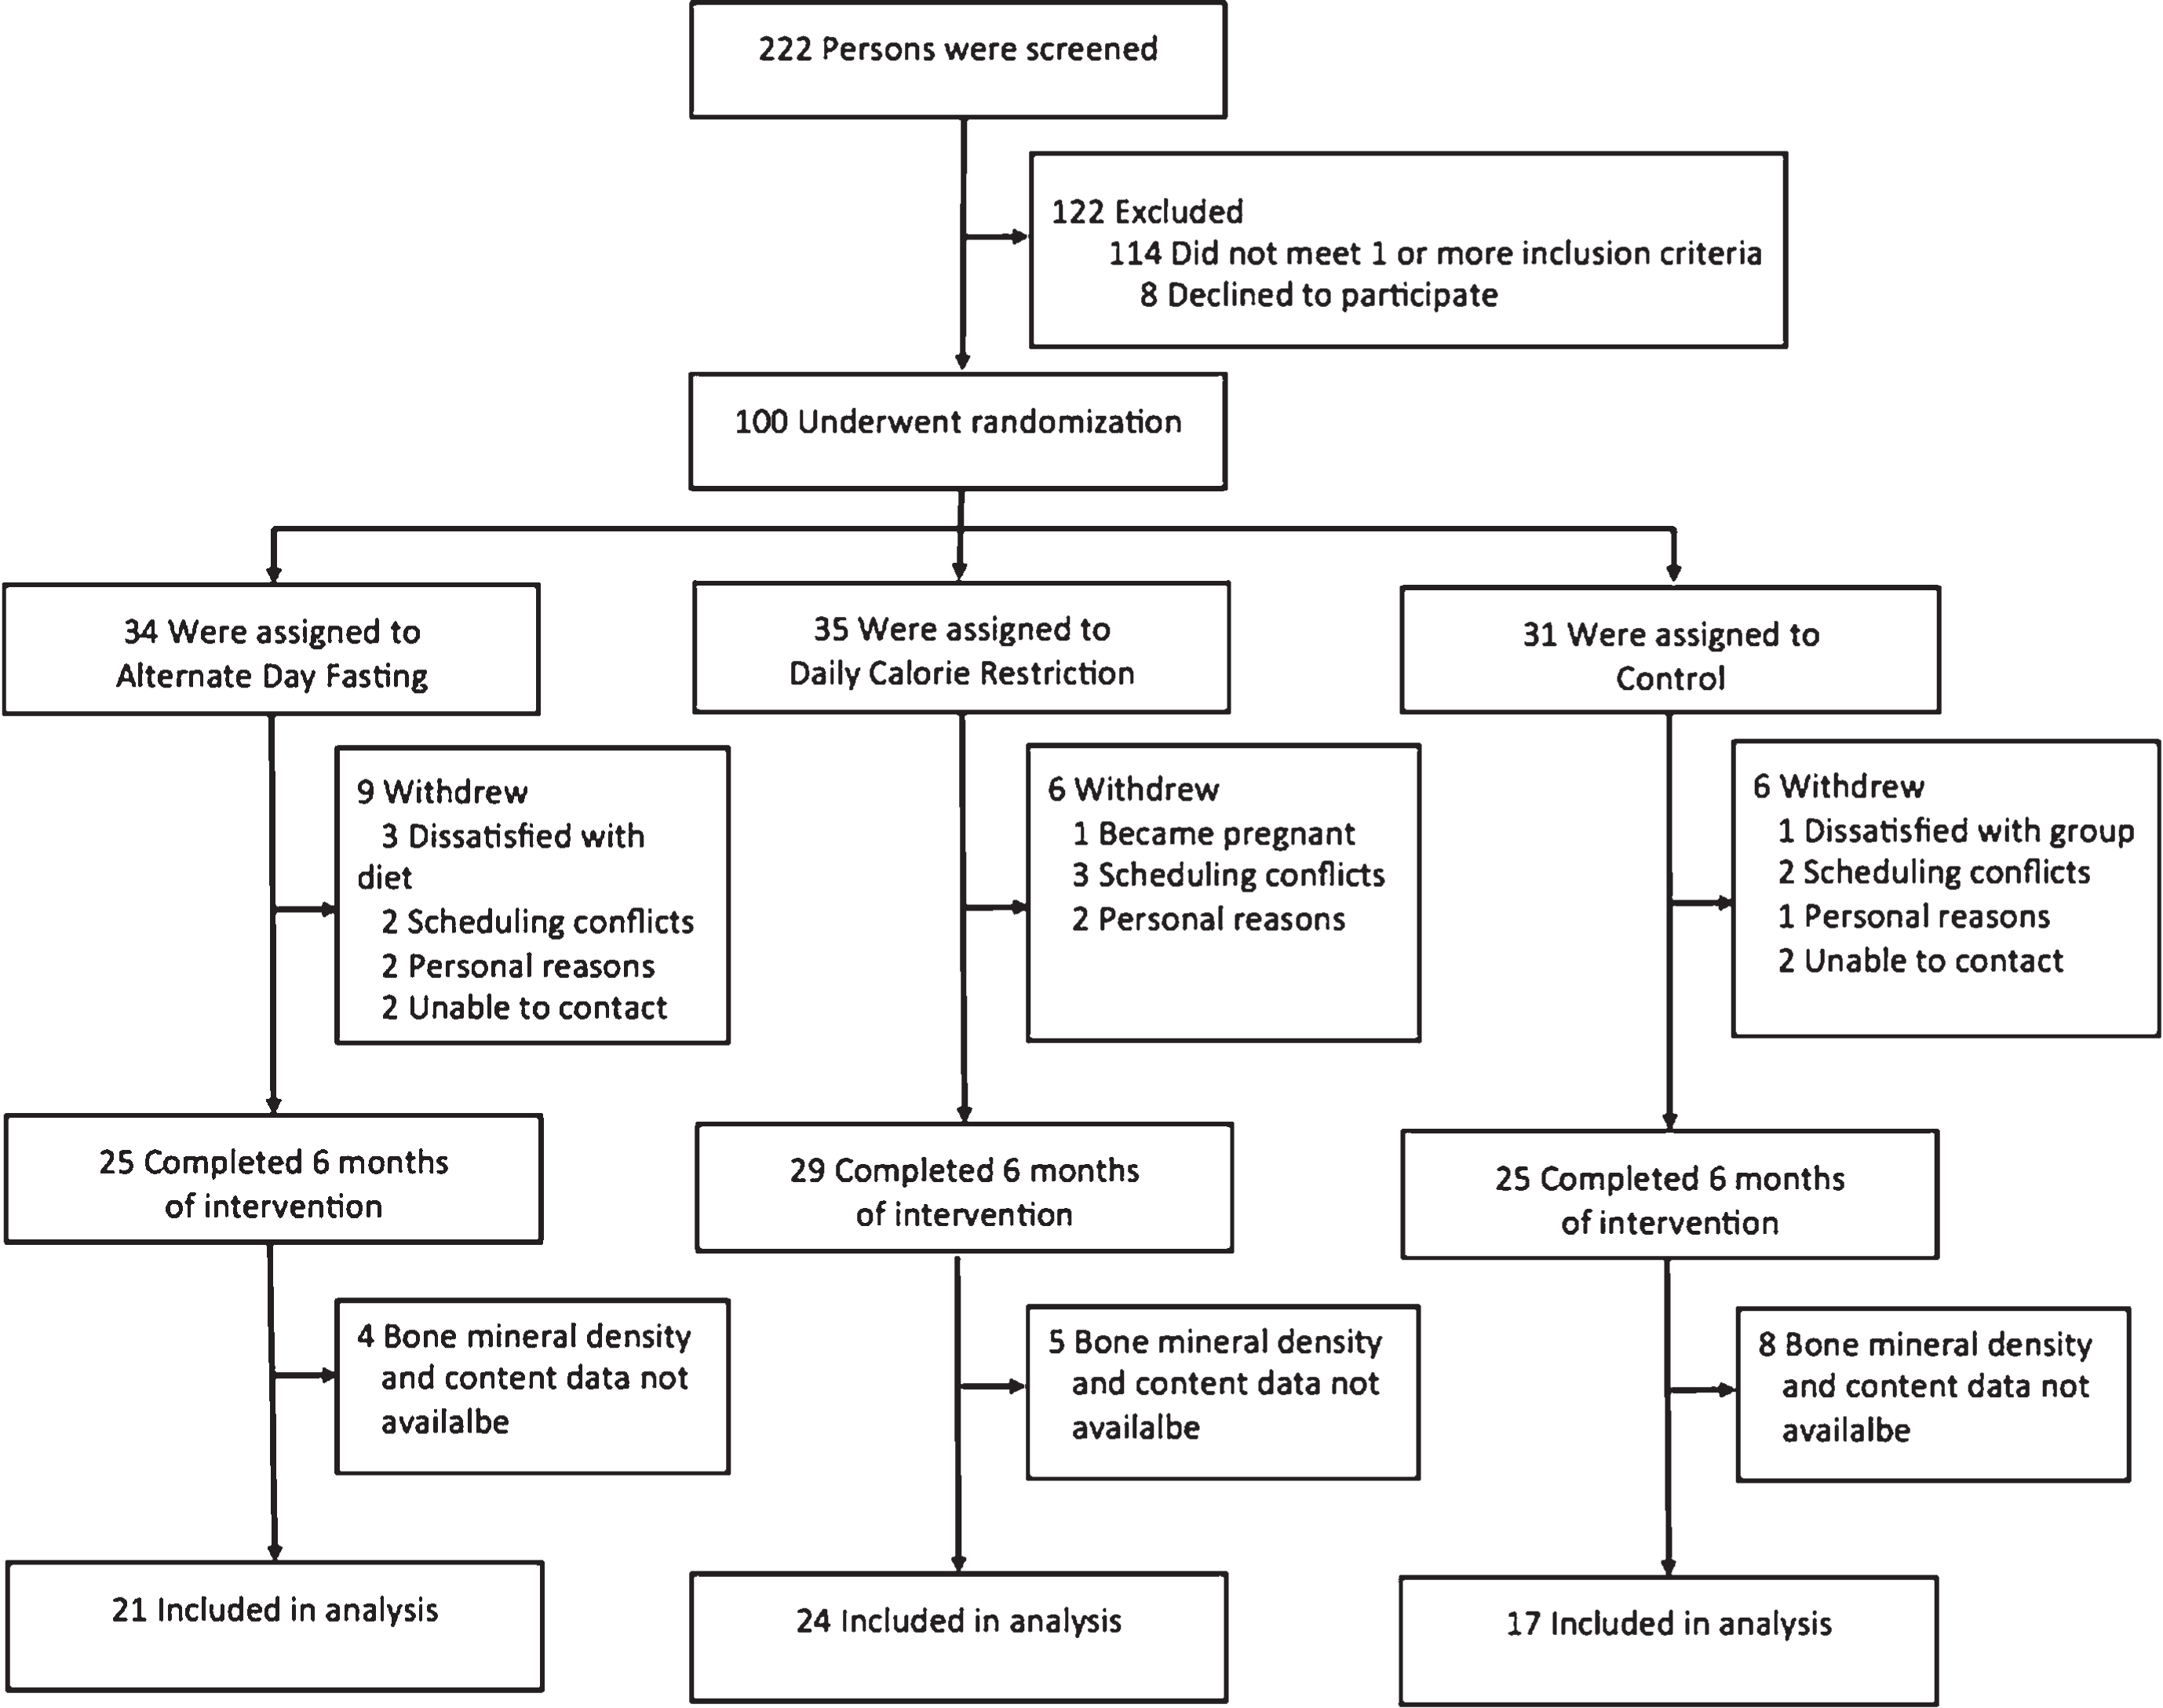
Study flow chart.

Experimental design.
During the “controlled feeding period” (Fig. 2), ADF and CR groups were provided with all meals. Diets were structured as a 3-day rotating menu with the following macronutrient composition: 30% kcal from fat, 15% from protein, and 55% from carbohydrates [22]. Total energy expenditure at baseline was calculated by the doubly labeled water technique, as previously described [21, 23], which informed calorie targets for each subject. Subjects in the ADF group consumed 25% of energy needs on each fast day (between 12.00 pm –2.00 pm) and 125% of energy needs on the feast day. Subjects in the CR group consumed 75% of their energy needs every day. All meals were consumed outside of the research center. During the “self-selected feeding period” (Fig. 2), ADF and CR subjects were no longer provided with meals. Instead, subjects received one-on-one weekly dietary counselling to learn how to continue with their intervention assignments on their own. Briefly, subjects were provided with their individualized daily calorie targets and taught how to monitor calories, portion sizes, and macronutrient composition according to American Heart Association guidelines [22].
Control group protocol
Controls were asked to maintain their body weight by continuing their usual eating and activity habits throughout the trial. Control subjects did not receive any food or dietary counselling, but visited the research center at the same frequency as the intervention groups to control for any investigator-interaction bias.
Dietary intake and physical activity
Dietary intake was assessed at baseline and month 6 by a 7-day food record, and analyzed using Nutritionist Pro software (Axxya Systems LLC) as described previously [21]. Calcium and vitamin D supplements were permitted during the study, but were not recorded in the food records. Thus, only dietary calcium and vitamin D intake is reported in the results. As for physical activity, all groups were asked to maintain their level of activity throughout the trial. Maintenance of activity was assessed by a validated [24] pattern recognition monitor (Sense Wear Mini, Bodymedia, Pittsburg, PA). Subjects wore the monitor on their upper arm for 7 days at baseline and the end of month 6.
Body weight and body composition
Body weight was measured to the nearest 0.1 kg at baseline and month 6 after an overnight fast in a hospital gown by a digital scale (HBF-500, Omron, Bannockburn, IL). Fat mass, lean mass, total body bone mineral content, and total body bone mineral density were assessed in the fasted state at baseline and month 6 by dual energy X-ray absorptiometry (DXA; QDR 4500W, Hologic, Arlington, MA).
Circulating markers of bone metabolism
Blood samples were obtained following a 12-hour fast at baseline and month 6. All participants were asked to avoid exercise, alcohol, and coffee for 24 h before each visit. Samples were centrifuged for 10 min at 520 Í g at 4°C to separate plasma from red cells and were stored at –80°C until analyzed. Markers of bone metabolism were measured by ELISA: osteocalcin (R&D Systems, Minneapolis, MN); bone alkaline phosphatase and CTX (MyBioSource, San Diego, CA). Insulin-like growth factor-1 (IGF-1) was also assessed by ELISA (R&D Systems, Minneapolis, MN).
Statistics
Results are presented as means±standard error of the mean (SEM). Normality was assessed by the Kolmogorov-Smirnov test, and no variables were found to be not normal. One-way ANOVA was used to test the differences among groups at baseline. Repeated measures ANOVA was used to evaluate main effects of diet, time, and diet×time effects. When main effects were detected, pairwise comparisons using the least significant difference test were applied. A P-value of less than 0.05 was used for statistical significance. Data were analyzed by using SPSS software (v.21, SPSS Inc., Chicago, IL).
Results
Subject flow through the trial
A total of n = 100 subjects were randomized to the three intervention groups (ADF n = 34, CR n = 35, control n = 31) (Fig. 1). After 6 months, n = 9 dropped out of the ADF group, n = 6 dropped out of the CR group, and n = 6 dropped out of the control group. Reasons for subject withdrawals included: dissatisfaction with study diets, scheduling conflicts, and personal reasons. The number of completers in each group was as follows: ADF n = 25; CR n = 29; and control n = 25. Of these completers, bone mineral density and content data were available for n = 21 ADF, n = 24 CR, and n = 17 control subjects. Consequently, only these subjects were used for the purposes of the present study.
Baseline characteristics
Baseline characteristics did not differ among the groups (Table 1). A comparison between premenopausal and postmenopausal women’s baseline characteristics was also performed. As expected, postmenopausal women were older than premenopausal women (56±5 y versus 37±6 y; P < 0.05); otherwise the two subgroups had similar baseline characteristics.
Baseline characteristics of the subjects who completed the study
Baseline characteristics of the subjects who completed the study
Mean±SEM. F: Female, M: Male, BMC: Bone mineral content, BMD: Bone mineral density. P-values reported for comparison of baseline variables between the alternate day fasting, daily calorie restriction and control groups (One-way ANOVA).
In the analysis of all participants (Fig. 3A), body weight decreased significantly (P < 0.001) in the ADF (–7.8±1.2%) and CR group (–8.8±1.5%), relative to controls, by month 6, with no difference between ADF and CR. Fat mass was reduced (P < 0.01) by ADF and CR, versus controls, with no differences between ADF and CR. Lean mass and total body bone mineral content did not change in any group. Total body bone mineral density did not change over 6 months in the ADF group (baseline: 1.23±0.02 g/cm2; month 6 : 1.24±0.02 g/cm2) or CR group (baseline: 1.19±0.03 g/cm2; month 6 : 1.20±0.03 g/cm2), relative to controls (baseline: 1.17±0.03 g/cm2; month 6 : 1.16±0.02 g/cm2).
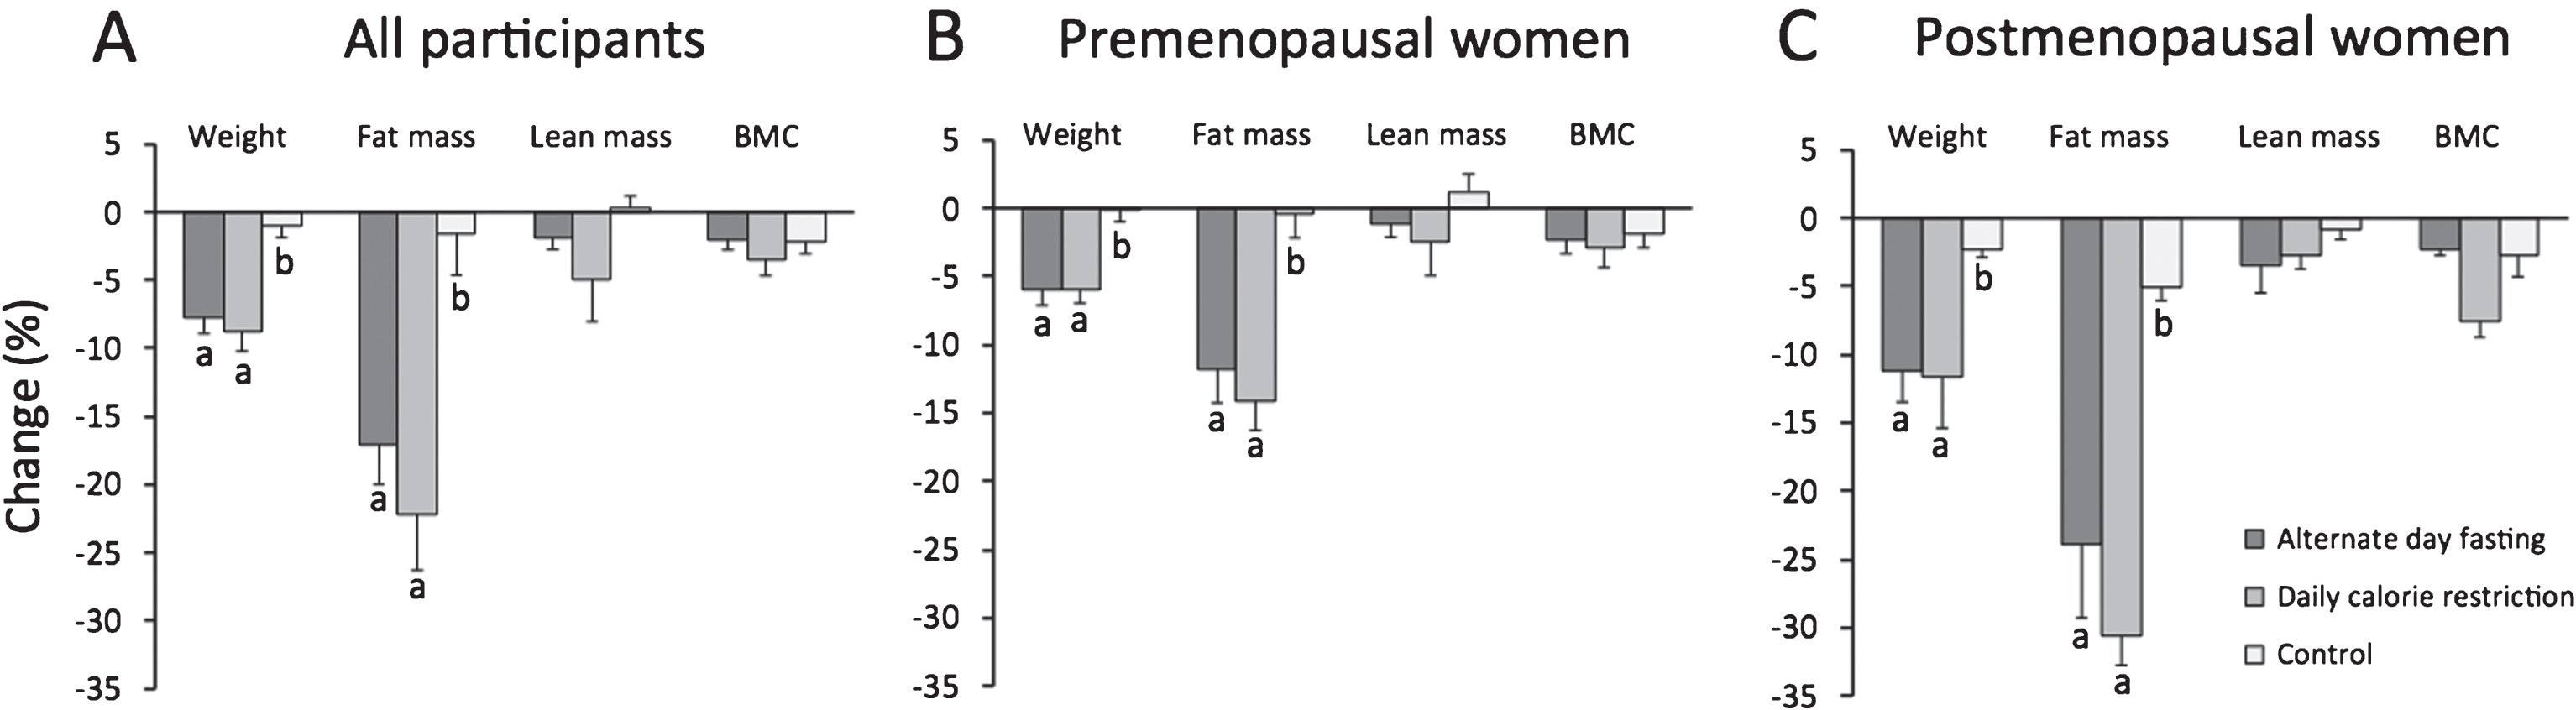
Change in body weight and body composition after 6 months. Mean±SEM. BMC: Bone mineral content. Means with different superscript values are significantly different (P < 0.01) for each body composition parameter. A. All participants: Body weight and fat mass decreased significantly (P < 0.01) in the ADF and CR groups, relative to controls. Lean mass and BMC remained unchanged in all groups. B. Premenopausal women: Body weight and fat mass decreased significantly (P < 0.01) in the ADF and CR groups, relative to controls. Lean mass and BMC remained unchanged in all groups. C. Postmenopausal women: Body weight and fat mass decreased significantly (P < 0.01) in the ADF and CR groups, relative to controls. Lean mass and BMC remained unchanged in all groups. Postmenopausal women lost more (P < 0.05) body weight and fat mass relative to premenopausal women in the same intervention group.
In our sub-analysis (Fig. 3B and 3C), weight loss was greater (P < 0.05) in ADF postmenopausal women (–11.2±2.3%) versus ADF premenopausal women (–6.0±1.1%). Additionally, weight loss was greater (P < 0.05) in CR postmenopausal women (–11.6±3.7%) versus CR premenopausal women (–6.0±1.0%). Fat mass loss was also greater (P < 0.05) in postmenopausal women versus premenopausal women in the ADF and CR groups. Changes in lean mass and bone mineral content did not differ between premenopausal and postmenopausal women in any group. Total body bone mineral density did not differ at month 6 between ADF premenopausal women (1.22±0.02 g/cm2) and ADF postmenopausal women (1.21±0.04 g/cm2), or between CR premenopausal women (1.24±0.04 g/cm2) and CR postmenopausal women (1.10±0.04 g/cm2).
Energy intake decreased (P < 0.01) from baseline to month 6 in the ADF and CR groups, but did not change in the control group (Table 2). Percent energy intake from protein, carbohydrates, and fat did not differ significantly between groups or over time. Dietary calcium and vitamin D intake remained constant from baseline to month 6, and did not differ between groups. Physical activity did not change significantly over the course of the trial in the ADF group (baseline: 8172±751 steps/d; month 6 : 8324±477 steps/d), CR group (baseline: 6923±543 steps/d; month 6 : 8406±878 steps/d) and control group (baseline: 6861±682 steps/d; month 6 : 6467±363 steps/d), with no difference between groups at any time point. There were no differences in activity level (steps/d) at baseline or month 6 between premenopausal women versus postmenopausal women in any group.
All participants: Dietary intake at baseline and month 6
All participants: Dietary intake at baseline and month 6
Mean±SEM. 1Repeated measures ANOVA. 2Energy intake decreased in the ADF and CR group, with no change in the control group. 3Estimated from dietary intake alone. Calcium and Vitamin D supplements were permitted during the study, but were not recorded in the food records.
In the analysis of all participants (Table 3), IGF-1 increased in the CR group, but did not change in the ADF or control group. Circulating osteocalcin, bone alkaline phosphatase and CTX did not change over the course of the trial in any group. In our sub-analysis (Table 4), premenopausal and postmenopausal women in the ADF and CR groups did not exhibit any changes in markers of bone formation or resorption after 6 months, relative to controls. There were no differences between premenopausal or postmenopausal women for any marker of bone metabolism.
All participants: Change in markers of bone metabolism after 6 months
All participants: Change in markers of bone metabolism after 6 months
Mean±SEM. Bone ALP: Bone alkaline phosphatase, CTX: C-terminal telopeptide of type I collagen, IGF-1: Insulin-like growth factor-1. 1Repeated measures ANOVA. 2IGF-1 increased in the CR group, with no change in the ADF or control group.
Premenopausal and postmenopausal women: Change in markers of bone metabolism after 6 months
Mean±SEM. Bone ALP: Bone alkaline phosphatase, CTX: C-terminal telopeptide of type I collagen, IGF-1: Insulin-like growth factor-1. 1Repeated measures ANOVA.
This is the first study to examine the impact of ADF on markers of bone metabolism. We show here that 6 months of ADF has no effect on markers of bone formation (osteocalcin, bone alkaline phosphatase) or bone resorption (CTX) when compared to daily CR or weight stable controls. We also demonstrate that total body bone mineral density and content remain stable after 6 months of ADF. In our sub-analysis of premenopausal versus postmenopausal women, it was shown that ADF has no impact on markers of bone metabolism or total body bone mineral content or density in either of these groups of women.
The bone formation marker, osteocalcin, remained stable in our analysis of all participants, and also in our sub-analysis of premenopausal versus postmenopausal women. Previous studies of CR generally demonstrate no change in osteocalcin levels after 6 months [11, 20]. In the few studies that have specifically examined premenopausal versus postmenopausal women, osteocalcin levels have also been shown to remain unaffected [11, 20]. The lack of change in osteocalcin may partly explain why total body bone mineral density and content remained stable in the intervention groups. It is also possible that bone mineral content and density did not change because subjects in the present trial were more physically active than the average obese American. More specifically, their activity level was ∼1000–2000 steps/d higher than what has been reported [26]. Since higher levels of physical activity can help preserve bone mass [27, 28], this could explain why bone mineral density and content remained stable in the present study.
Neither ADF nor CR affected circulating levels of bone alkaline phosphatase, a marker of bone formation. This parameter also remained stable in our sub-analysis of premenopausal and postmenopausal women. We are aware of only one other trial of similar duration that examined the impact of dietary restriction on bone alkaline phosphatase. In this study by Redman et al. [17], 6 months of CR decreased body weight by 10% and bone alkaline phosphatase by 16% in overweight young men and premenopausal women. Our findings showed a statistically insignificant 44% decline in bone alkaline phosphatase in the CR group, even though we had double the number of treated subjects. However, subjects in the Redman study [17] were excluded if they were obese or if they ever had a history of obesity. Given that the bone response to weight loss is greater in leaner versus heavier individuals [29], this could explain differences in findings between these studies.
Circulating levels of the bone resorption marker, CTX, did not change in the ADF or CR groups after 6 months of treatment. Our findings for CTX are contradictory to previous 6-month controlled trials of CR, which show that CTX and other markers of bone resorption increase in response to moderate weight loss [14, 30]. Levels of CTX also remained unchanged in premenopausal and postmenopausal women undergoing ADF or CR. These preliminary findings suggest that ADF may not increase bone resorption with moderate weight loss, though it is not known whether a longer duration of ADF would have a different effect.
IGF-1 is a critical mediator of bone growth [31]. In the present study, we found that IGF-1 levels remained stable in the ADF group, but increased in the CR group. Some CR trials report decreases in IGF-1 levels after 6–12 months [32, 33], though others show no change [14, 34]. Since IGF-1 helps promote bone growth [31], increased levels of this mediator may positively affect bone long-term. It remains uncertain why IGF-1 levels were not affected by ADF, as average energy restriction and weight loss was similar to that of the CR group. Harvie at al [35] also reported no change in IGF-1 concentrations after 6 months of intermittent fasting in obese premenopausal women. Higher protein intakes increase IGF-1 which may indirectly help to preserve bone mass [36]. However, average protein intake over the course of the trial was similar in the ADF and CR groups (∼18% of energy), thus it is unlikely that this factor played a role. While this finding may suggest that CR has a protective effect on bone versus ADF, we found no differences in bone changes, suggesting that more research is required before solid conclusions can be reached.
Dietary intakes of calcium and vitamin D were below the recommended intakes of 1000–1200 mg Ca/d and 15 ug vitamin D/d for men and women in this age group. However, intakes reported in this study were similar to the average intake for US women (∼850 mg/d for calcium and 4 μg/d for vitamin D) and men (∼1100 mg/d for calcium and 5 μg/d for vitamin D) [25].
Our study has some limitations. First, this is a secondary analysis of a larger study [21] which focused primarily on changes in body weight with these diets. Thus, our study may not have been powered adequately to detect differences between ADF, CR, and controls for changes in markers of bone metabolism. However, other studies found changes in bone markers with weight loss with smaller sample sizes [16, 30]. Second, the study was not designed to examine whether these diets have any impact on site-specific bone mineral density (e.g. hip, lumbar spine, etc.).
In summary, these findings suggest that moderate weight loss with ADF does not have any deleterious impact on markers of bone metabolism or total body bone mineral density in obese adults. A future ADF randomized controlled trial designed to measure bone at multiple high-risk fracture sites is needed to confirm these findings.
Funding source
National Institutes of Health: NHLBI (R01HL106228, T32HL007034), NIDDK (F32DK107157).
Conflict of interest
Krista Varady is the author of the book, “The Every Other Day Diet”. The other authors have no competing interests.
Footnotes
Acknowledgments
AB preformed the laboratory analyses, analyzed the data, and wrote the manuscript. CMK, JFT, MCK, SB, KKH, KG coordinated the clinical trial, and assisted with manuscript preparation. SAS assisted with interpretation of the data and wrote the manuscript. KAV designed the experiment, analyzed the data, and wrote the manuscript.