
Abstract
The sillenite-structured bismuth titanate (Bi12TiO20) is thought to be a viable photocatalyst for environmental remediation. However, the performance of Bi12TiO20 as a photocatalyst is severely constrained by its limited range of light sensitivity and the rapid photoinduced electron-hole pair recombination. A practical and effective way to overcome these limitations is to combine Bi12TiO20 with adequate photocatalysts to create heterojunctions. Here, a one-step solvothermal technique is used to synthesize Bi12TiO20/Bi4Ti3O12 heterojunction (BTO). The electric field that exists between B12TiO20, Bi4Ti3O12 and the closed interfacial contacts had a synergistic effect on the constructed composites, which resulted in high charge transfer abilities. Therefore, the BTO heterojunction demonstrated increased photocatalytic efficacy in the presence of ultraviolet irradiation. The MO removal efficiency of optimal BTO was 97.15%, significantly higher than that of pure Bi2O3 (46.9%). Furthermore, the cycling experiment demonstrated that the BTO heterojunction is stable and reusable. The probable mechanism of photocatalytic MO oxidation over BTO heterojunction was studied by various scavengers. The •OH radicals and holes played essential roles in BTO system of photocatalytic oxidation process.
Introduction
Heterogenous photocatalysis process can successfully degrade organic pollutants by utilizing electrons and holes generated by semiconductors under light excitation. This is an effective engineering method for alleviating environmental concerns.
Several studies have been focused on Bi-based photocatalysts such as Bi4Ti3O12, a typical Aurivillius structure semiconductor composed of [Bi2O3] layers and [TiO6] octahedrons alternately arranged along the c-axis [1, 2]. This unique alternant layered structure aids in the separation of photoinduced carriers. According to the literature, the capacity of holes for oxidation is the primary cause of photocatalytic activity [3], Bi12TiO20, a p-type semiconductor,has generated significant interest owing to its low cost, distinct structure, and exceptional oxidizing capacity. However, the photocatalytic performance of Bi12TiO20 is still limited by low quantum yield, the narrow range of light sensitivity, and the fast recombination of photoinduced electron-hole pairs, which significantly restricts its application in industry. Numerous strategies exist to improve its photocatalytic activity, developing heterostructure is one of them (Bi12TiO20/BiFeO3 [4], or Bi12TiO20/ Bi2WO6 [5]).The construction of the heterojunction is an effective strategy for improving photocatalytic performace [6]. Contact surface between semiconductors causes charge redistribution at the interface due to different Fermi levels, forming an internal electric field directed from one semiconductor to the other [6]. The internal electric field can speed up the spatial separation of photoinduced charge carriers and suppress their subsequent recombination, thus improving the photocatalytic efficiency.
In this research, we aimed at synthesizing the Bi12TiO20/Bi4Ti3O12 heterostructures via one step solvothermal method. Different methodologies were used to characterize these composites (XRD, Raman, Fourier transform infrared and SEM analysis). The photocatalytic degradation of methyl orange was employed to assess the photocatalytic activity. The tests reveal that the Bi12TiO20/ Bi4Ti3O12 heterostructures have higher photocatalytic activity for degrading MO than the pure Bi2O3 Additionally, the potential mechanisms of junction creation and photoexcited electron and hole separation were discussed.
Experimental method
Materials synthesis
The analytical-grade compounds utilized in this study were all used without further treatment. The BTO-based heterostructure was created via a one-step solvothermal technique using Bismuth trinitrate (Sigma-Aldrich, 98%) and Titanium (IV) butoxide (Sigma-Aldrich, 97%) as precursors and anhydrous citric acid 99.5% (Fulka) was selected as a chelating agent. Citric acid plays two roles in the synthesis process: (1) It chelates metal ions in solution and (2) during the calcination process, it serves as an organic fuel [7].
In brief, 0.814g Bi(NO3)3.5H2O and 0.340g C6H8O7 are mixed in 15 ml of acetone and stirred until a homogenous white solution is obtained. Then a certain amount of Ti(OC4H9)4 was slowly added dropwise under vigorous stirring to the solution for 3 hours. The mixture was transferred into a Teflon-lined autoclave and heated at two different temperatures (120 and 150°C) for 12 h. The precipitates were collected by centrifugation, washed twice, with distilled water and ethanol separately, followed by drying process at 105°C for 12 h. Finally, the products were ground for 10 minutes in an agate mortar and were heated at two different temperatures (500 and 600°C) with a heating ramp of 3°C/min for 4 h. The light yellow samples were obtained.
For comparison, the pure phase Bi2O3 was prepared using a Ti/Bi molar ratio of 0%.
For the convenience of description, the products was prepared with an 8.33% Ti/Bi molar ratio at 120–500°C, 120–600°C, 150–500°C and 150–600°C were abbreviated as B25, B26, B55 and B56.
Materials characterization
X’Pert-Philips Panalytical diffractometer (CuK α1, λ= 1.5406 Å) was used to analyze the as-synthesised powders. All powders were scanned from 20 to 90° of 2θ range, with an applied current of 40 mA and a accelerating voltage of 40 kV. The scan speed and the step size were 121.0152 s/step and 0.067 degrees, respectively.
A micro-Raman spectroscopy SENTERRA II with a laser power set at 532 nm was used to confirm the phase purity of the samples.
The JASCO FTIR-450 spectrometer was used to record the FTIR spectra over the 400–4000 cm–1 spectral range.
The morphological properties were performed by SEM analysis via a Quanta FEG 450 with an acceleration voltage of 10 KV associated with an EDX equipment. All analyses were performed in the foundation MAScIR-Rabat.
Photodegradation of Methyl orange
Methyl orange was used as a common dye indicator to assess the BTO photocatalytic performance. A 125 W mercury lamp used as a source of UV irradiation and a 250 ml pyrex beaker serve as a reactor.
In a typical experiment, the beaker was filled with an aqueous suspension of MO (0,1 g.L–1, 100 mL) and 0,1 g of as-synthesized products. The suspensions were magnetically stirred in the dark for 60 minutes prior to irradiation to achieve an adsorption/desorption equilibrium between the dye and the catalyst surface. After that, UV irradiation was applied and 5 ml samples were collected periodically, centrifuged to remove the catalyst, and used for analysis. A JASCO V-630 UV-Vis spectrophotometer was used to measure absorbance at 464.9 nm in order to calculate the concentration of MO.
The percentage of degradation efficiency is computed using the equation below:
At and A0 are the absorption of MO at time t and the initial absorption at the start, respectively.
Under the same conditions, a blank test is carried out without a photocatalyst. Furthermore, experiments involving the capture of free radicals were carried out by adding 1 mmol of a capturing agent into the MO solution. Ethanol, Potassium iodine (KI), and Sodium nitrate (NaNO3) were used as the sacrificial agent of the active species •OH, h+ and •O 2–, respectively. Finally, five recycling experiments are carried out consecutively to test the photocatalyst stability and reusability.
The pH can influence the entire photocatalytic process and the decolorization rate as well [8]. Due to this, some experiments are conducted to investigate how the initial pH affects the MO photodegradation. To better comprehend this influence, the zero-charge point (pHzcp) of the examined catalyst must be determined. A potentiometric mass titration method is used to determine the pHzcp value for the heterostructure [4, 9]. Three solutions have been prepared: A (blank), B, and C. To begin, we add 2 mL of 0.1 N Sodium hydroxide to 50 mL of 0.01 N Sodium chloride to obtain A; to obtain B and C, we separately add 70 and 90 mg of the photocatalyst to the solution, then 50 mL of 0.01 N Sodium chloride, followed by 2 mL of 0.1 N Sodium hydroxide. The solutions are titrated with 0.01 N HCl. The pH of each suspension was measured with 1 minute time interval using a digital pH meter, the outcomes are plotted. The pHzcp is obtained at the intersection of the titration curves of the three solutions.
Characterization of the samples
XRD results
The composition of the product is affected by the reaction and calcination temperatures in the solvothermal method [10]. The XRD patterns of B25, B26, B55, and B56 are combined. The composite diffraction peaks in Fig. 1 may all be indexed using the standard data of cubic Bi12TiO20 with space group I23 (JCPDS file No. 00-034-0097) and Bi4Ti3O12 (JCPDS file No. 00-035-0795), which can indicate the coexistence of Bi12TiO20 and Bi4Ti3O12 phases in all the composites.
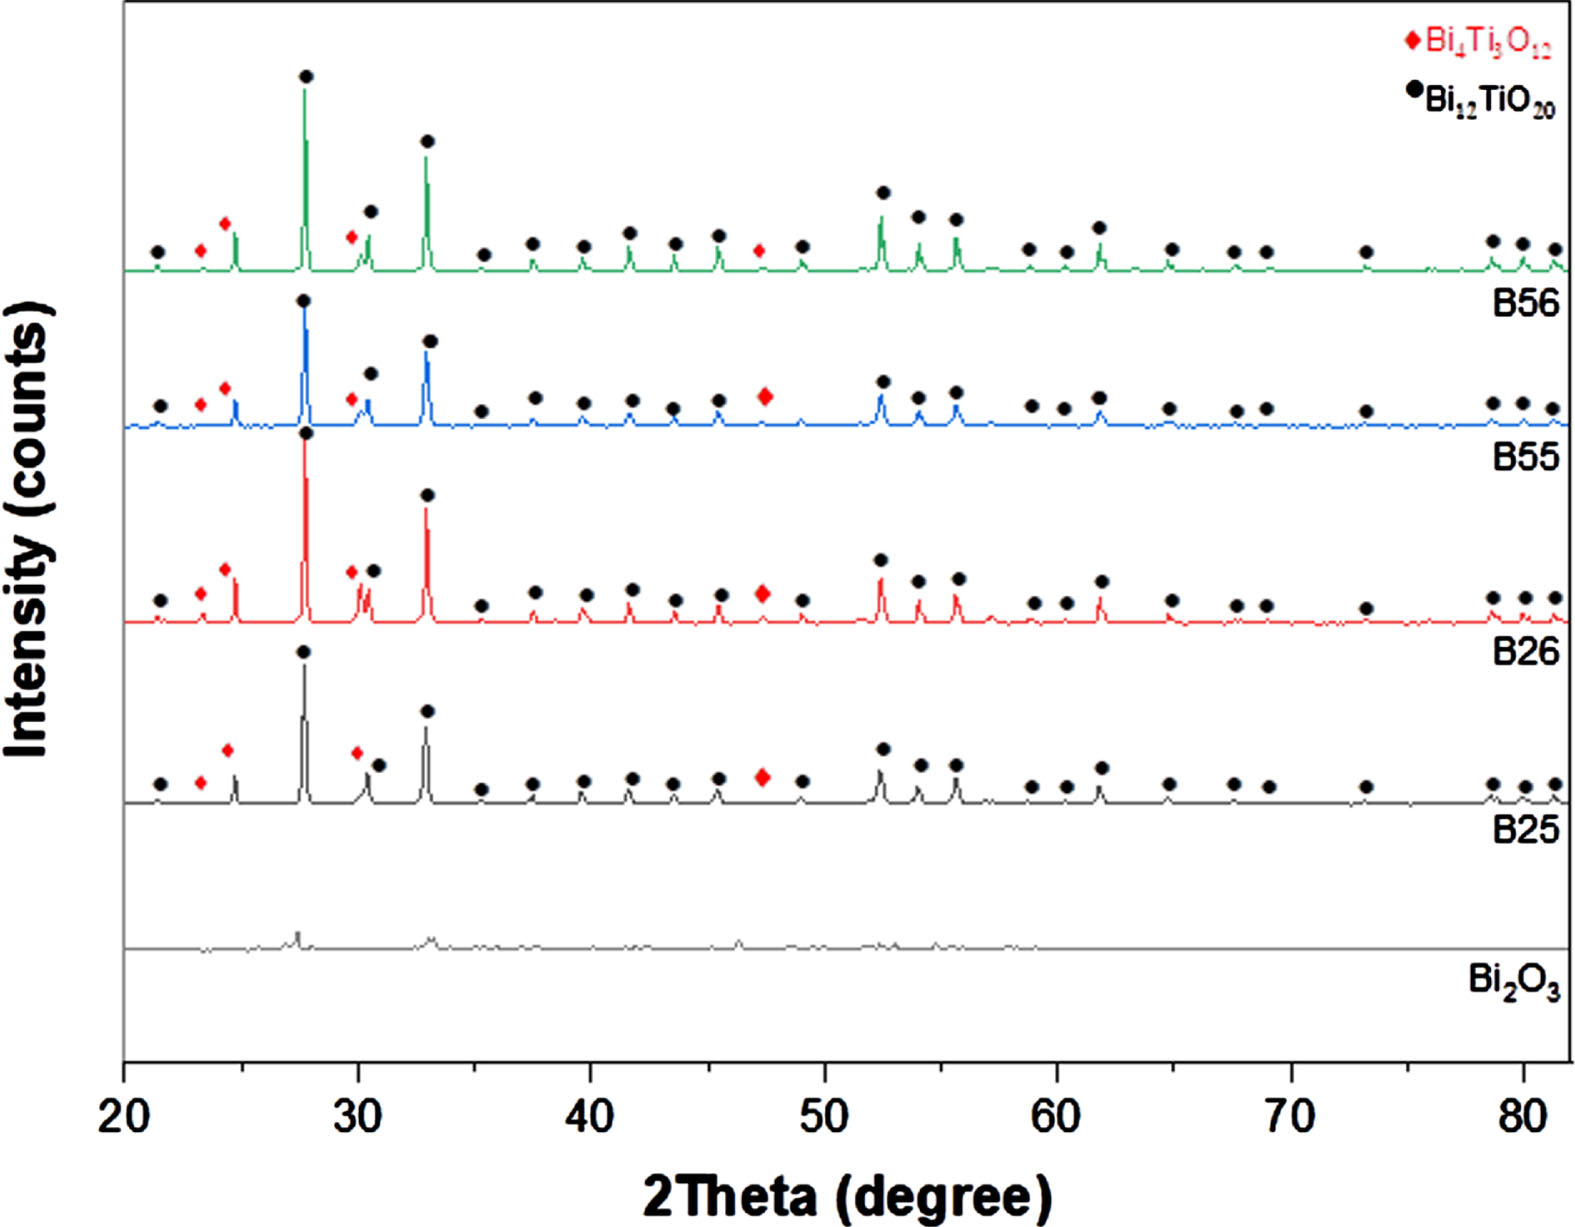
The photocatalysts XRD patterns.
Taken B26 composite as an example, there are two diffraction peaks of (171) and (222) near to 30° (2θ) which belong to Bi4Ti3O12 and Bi12TiO20, respectively, as shown inset in Fig. 1. The main X-ray diffraction peaks at 2θ= 23.3°, 24.55°, 30.05° and 47.32° can be indexed to (111), (131), (171) and (202) planes of Orthorhombic Bi4Ti3O12 (JCPDS file No. 00-035-0795), respectively.
The average sizes of the nanocrystallite fractions in the samples were determined using the Debye-Scherrer Equation [11, 12], using the most significant peaks from the diffraction data in Fig. 1.
Here, λ is the incident X-ray wavelength (λ= 0.15418 nm), D is the crystallite mean size, K is a Scherrer constant which is 0.9, θ is diffraction angle in radian and β is the full width at half maximum of the diffraction peaks.
The obtained values of crystallite sizes of the studied samples are presented in Table 1. The crystallite sizes in the samples grows gradually as the calcination temperature rises, as shown in the table. The diffraction peaks becomes sharper as the calcination temperature rises since the atoms from the grain boundary diffused into the grain, resulting in an increase in crystallite size. The experiment results clearly indicate that the crystallite size is proportional to the sample annealed temperature.
The obtained nanocrystallite sizes according to the annealing temperature
To understand the local crystal structure, Raman spectroscopy analysis was recorded in the 50–800 cm–1 range and found the Bi12TiO20 phase in all of the as- synthesized samples, proving the high phase purity of as-synthesized samples (Fig. 2).
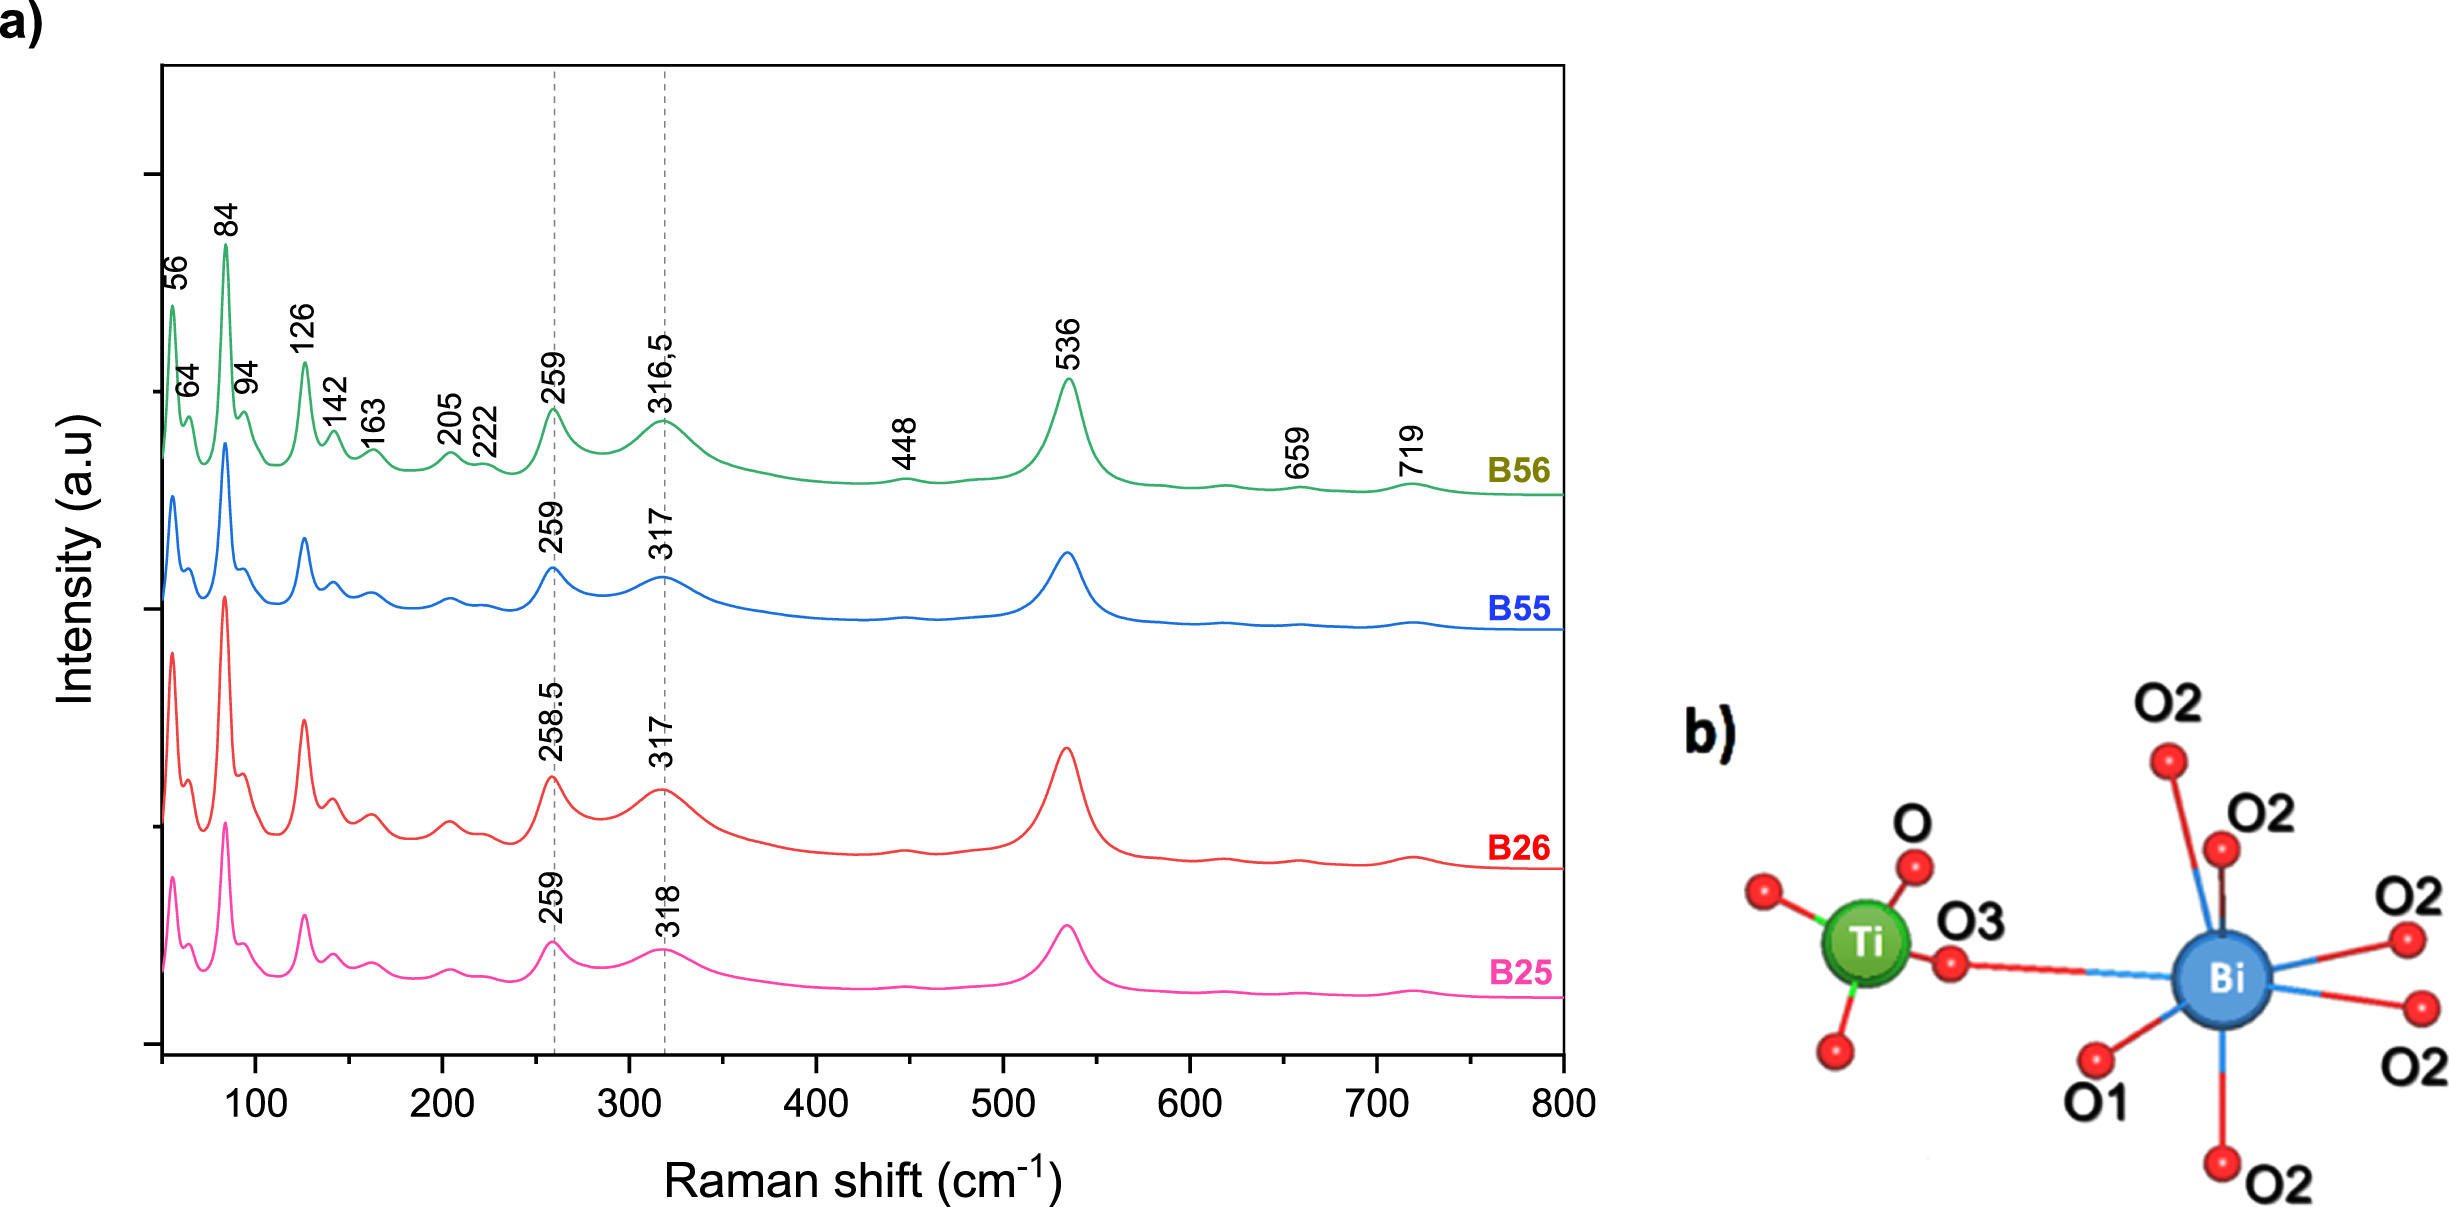
Raman spectroscopy of the as-prepared samples (a), BiO7 polyhedral and TiO4 tetrahedral local crystal structure interconnectivity (b).
The symmetric stretching of the tetrahedral TiO4 is responsible for the weak peaks found at ∼720 and 660 cm–1 [13, 14]. The bands in the range 206–320 cm–1 were attributed to the Bi–O bond vibrations of BiO7 polyhedral [14]. the ∼128 cm–1 is attributed to the Bi and O2 vibrations elongating of the cluster along the [1 0 0] or [0 1 0], the ∼144 cm–1 to the “breathing mode” of Bi and O2 atoms, the ∼166 cm–1 to the “breathing mode” of Bi and all O atoms [14, 15], the ∼85 cm–1 to Bi-O2 and Bi-O3 vibrations elongating the cluster. The peak at 536 cm–1 corresponds to the “breathing” of O1 atoms.
The distinctive Raman bands at ∼278 and 328 cm–1 are very sensitive to interatomic distance variations [14]. As a result, they can be employed as markers of subtle structural changes in the samples Bi-O framework. Furthermore, in complex metal oxides, the average bond lengths of metal-oxygen bonds are known to be inversely relatedl to their Raman stretching wave number [16, 17].
Around 260 and 319 cm–1 the Raman wave numbers of the two bands decrease in the order: B56 > B55 > B26 > B25, as shown in Table 2. This result supports the XRD findings by showing that B25 has a longer Bi-O bond and a larger interatomic distance.
Variation in the two distinctive Raman bands
Figure 3 shows the Fourier transform infrared spectra of the as-synthesized simples B25, B26, B55 and B56 obtained using KBr as reference material at room temperature, respectively.The bands around 1640–1000 cm–1 were attributed to water and residual molecules from partially degraded precursors that remained adsorbed on particle surface [18, 19]. The O–H stretching, which results from the free adsorbed water (nearly 1500 cm–1), the NO2 (1200 cm–1 –1000 cm–1), which comes from the free NO3–, and the C–H stretching (1200 cm–1 –800 cm–1), which corresponds to the organic subproducts of the titanium precursor, are the probable infrared interactions and their respective groups present on the samples.
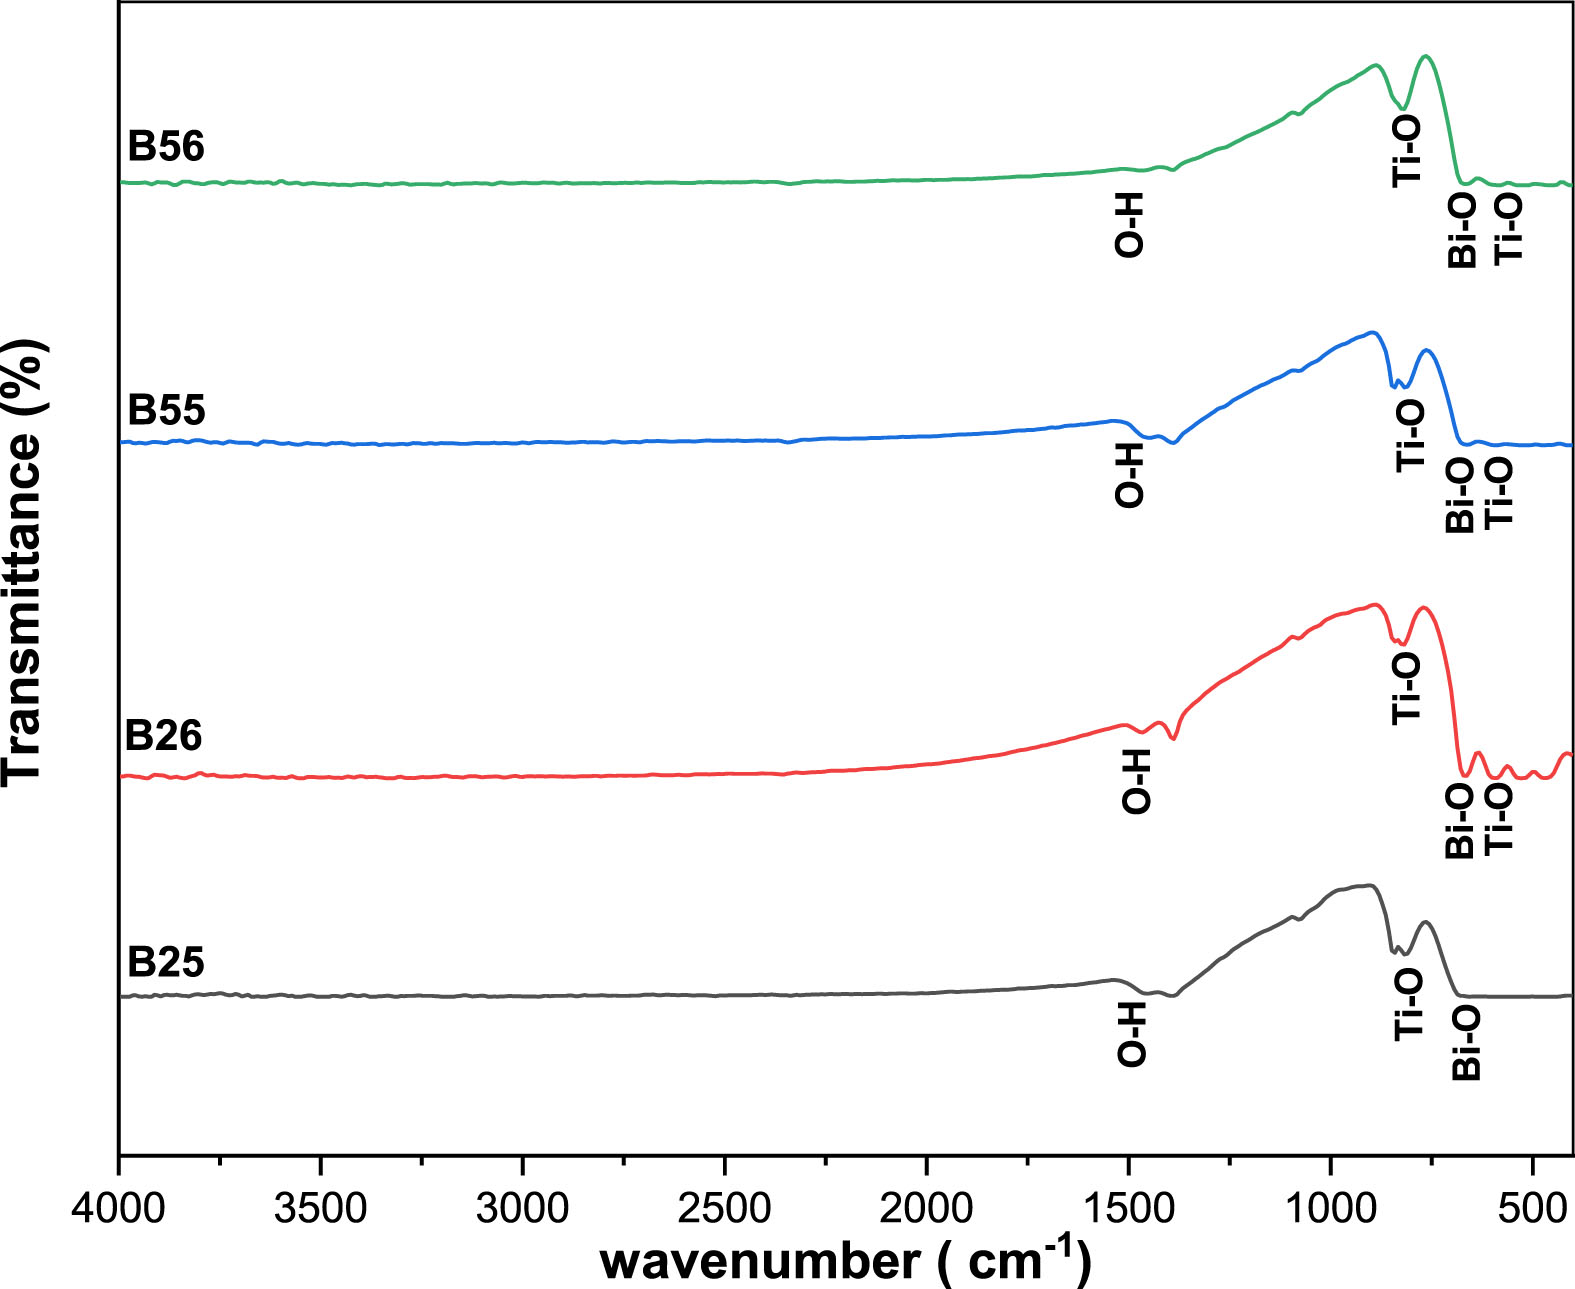
FTIR spectra of B25,B26,B55 and B56 samples.
The two bands that were detected in all samples, around 591 and 813 cm–1, respectively, correspond to the Ti–O stretching vibration [20]. The absorption peaks at 664 cm–1 were related to the vibration of the Bi-O bond [21, 22].
Figure 4(a) shows the scanning electron microscopy images of B25, B26, B55 and B56 heterostructures respectively. As observed in Fig. 4(a,b) the B25 and B26 powder mainly consists of spherical nanoparticles with a few of these spherical nanoparticle aggregates, which are transformed into cylindrical-shaped nanostructures. However, the B55 and B56 particles are smaller and more irregular in shape.
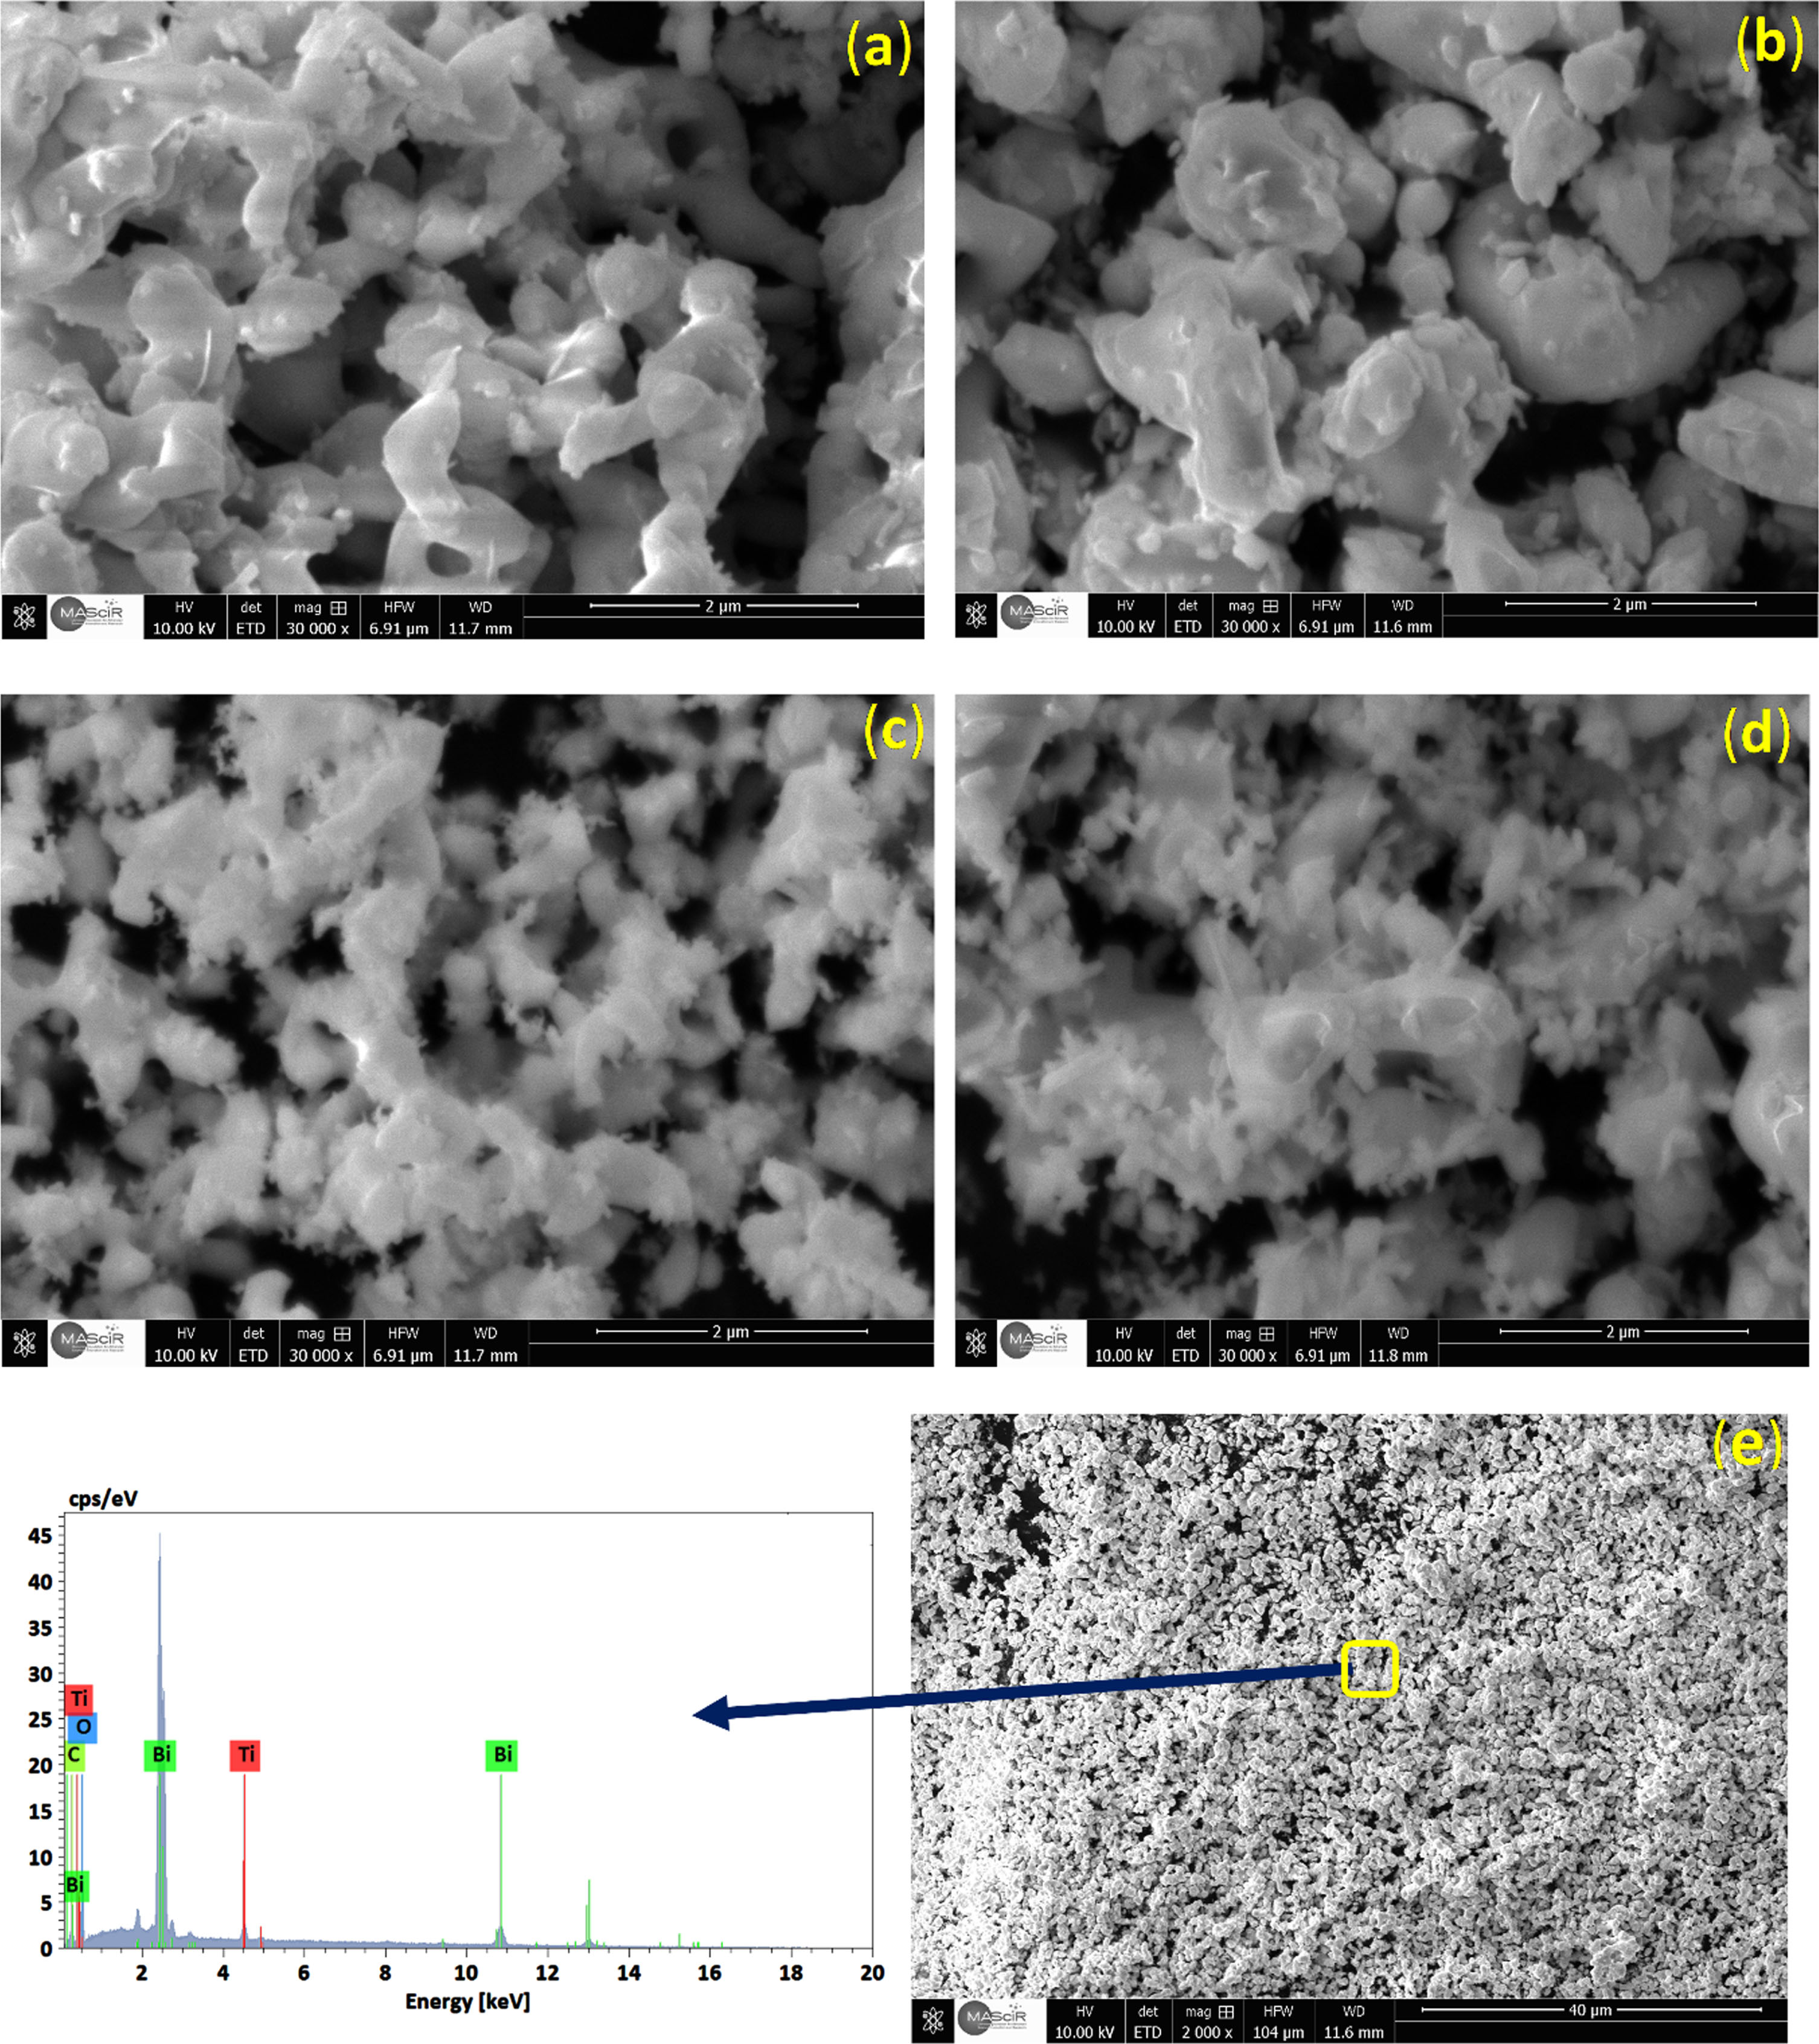
The SEM images of B25(a), B26(b), B55(c), B56(d), and the EDS analysis of a part in the B25 composite (e).
Increased solvothermal reaction temperature leads preferential nucleation and development of agglomerates of nanoparticles, as a result a few spherical nanoparticles were transformed into cylindrical nanostructures [22].
The EDS diagram of a part in the B25 sample was shown in Fig. 4(e), the graphic showed three elements: Ti, Bi, and O. When coupled with XRD examination, it is demonstrated that Bismuth titanate is the only substance present in the sample.
The photocatalytic activities of the as-synthesized samples were investigated using photodegradation of Methyl orange dye solution. The variation in maximal absorption in the UV-Vis spectra at 464.9 nm was used to monitor temporal changes in MO concentration. Figure 5 shows the UV-vis spectra of the initial and decolored dye solutions when several photocatalysts are present at various UV irradiation periods. In the case of B25, a picture of the MO solution is either shown. After 120 min, the catalytic removal rates reach 97, 88, 96, 86, and 47% in the presence of photocatalysts B25, B26, B55, B56, and Bi2O3, respectively. The dark adsorption capacity of MO over B25, B26, B55, B56, and Bi2O3 for 120 min were 22.46, 5.37, 11.6, 10.75, and 5.79%, respectively; Fig. 5(a) shows their profiles. The as-prepared samples present poor adsorption ability but had a great photocatalytic potential.
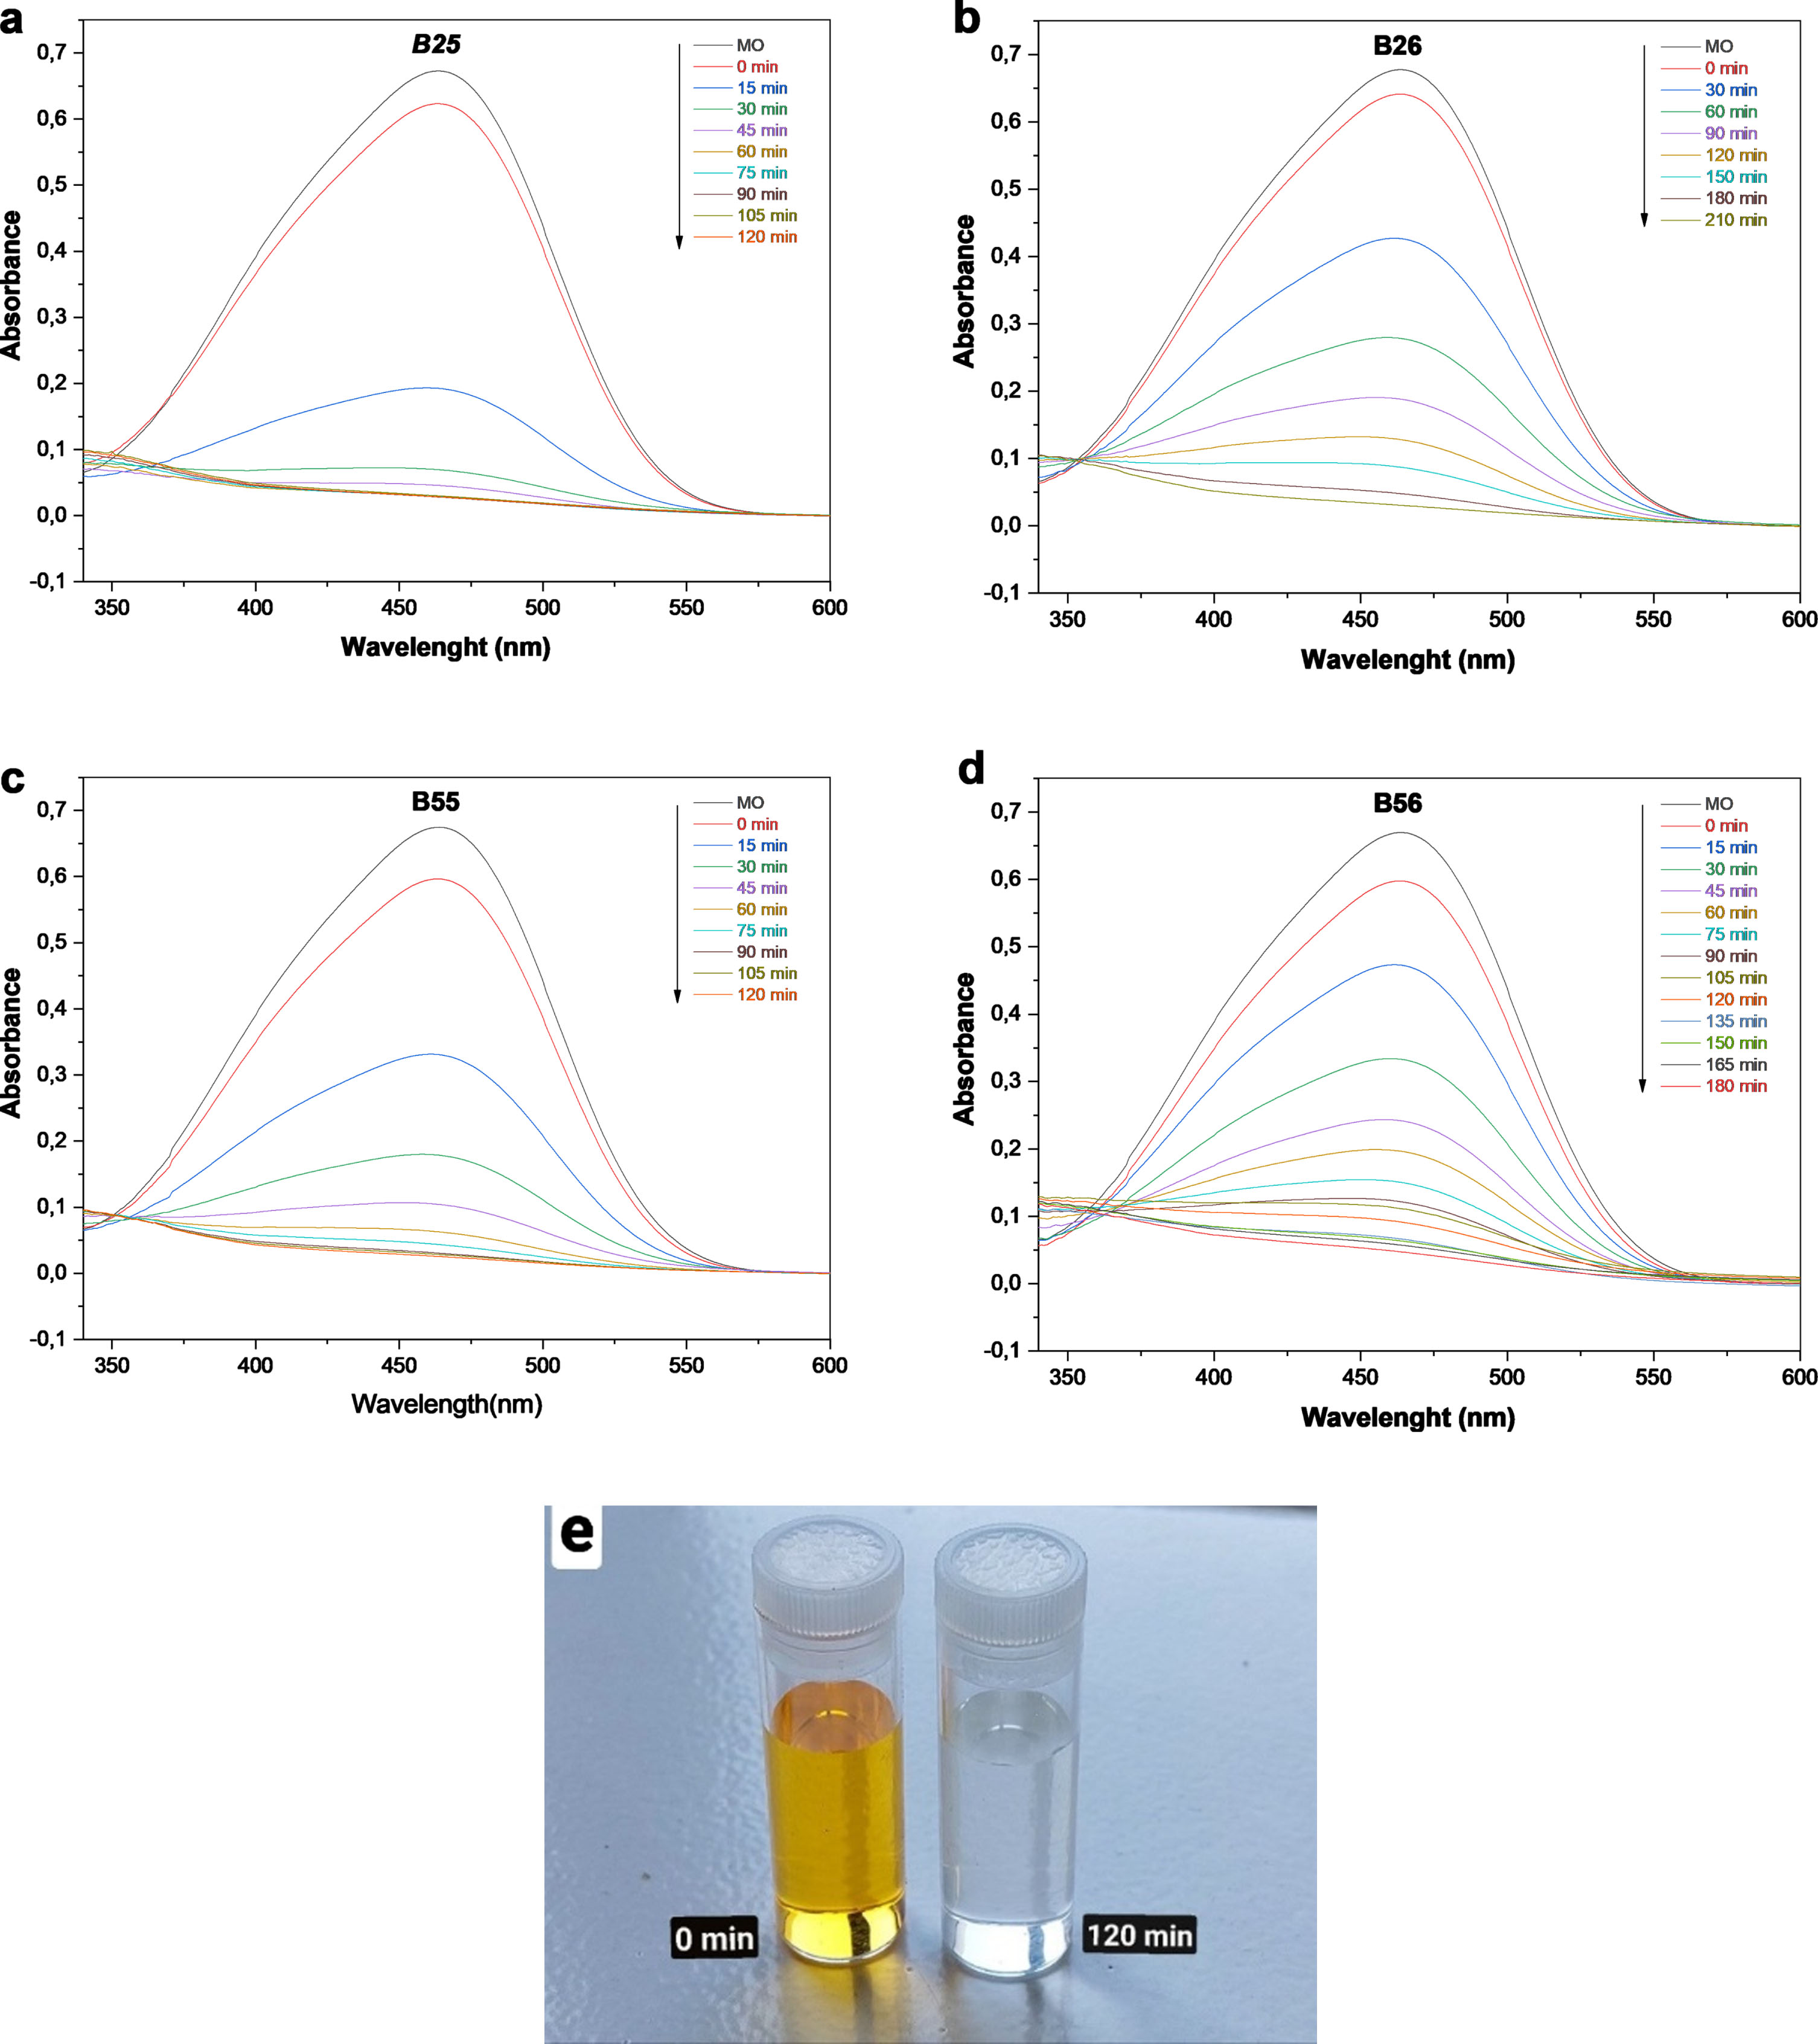
The MO absorption spectrum of B25 (a), B26 (b),B55 (c), B56 (d) and the B25 MO discoloration over time picture (e).
From Fig. 6(a), After 120 minutes, the MO dye discoloration reached its peak, according to the results of the kinetic adsorption process. A variation in the concentration of the MO dye solution is observed up to 60 min of reaction, and then remains constant. This means that the adsorption-desorption equilibrium has been reached.
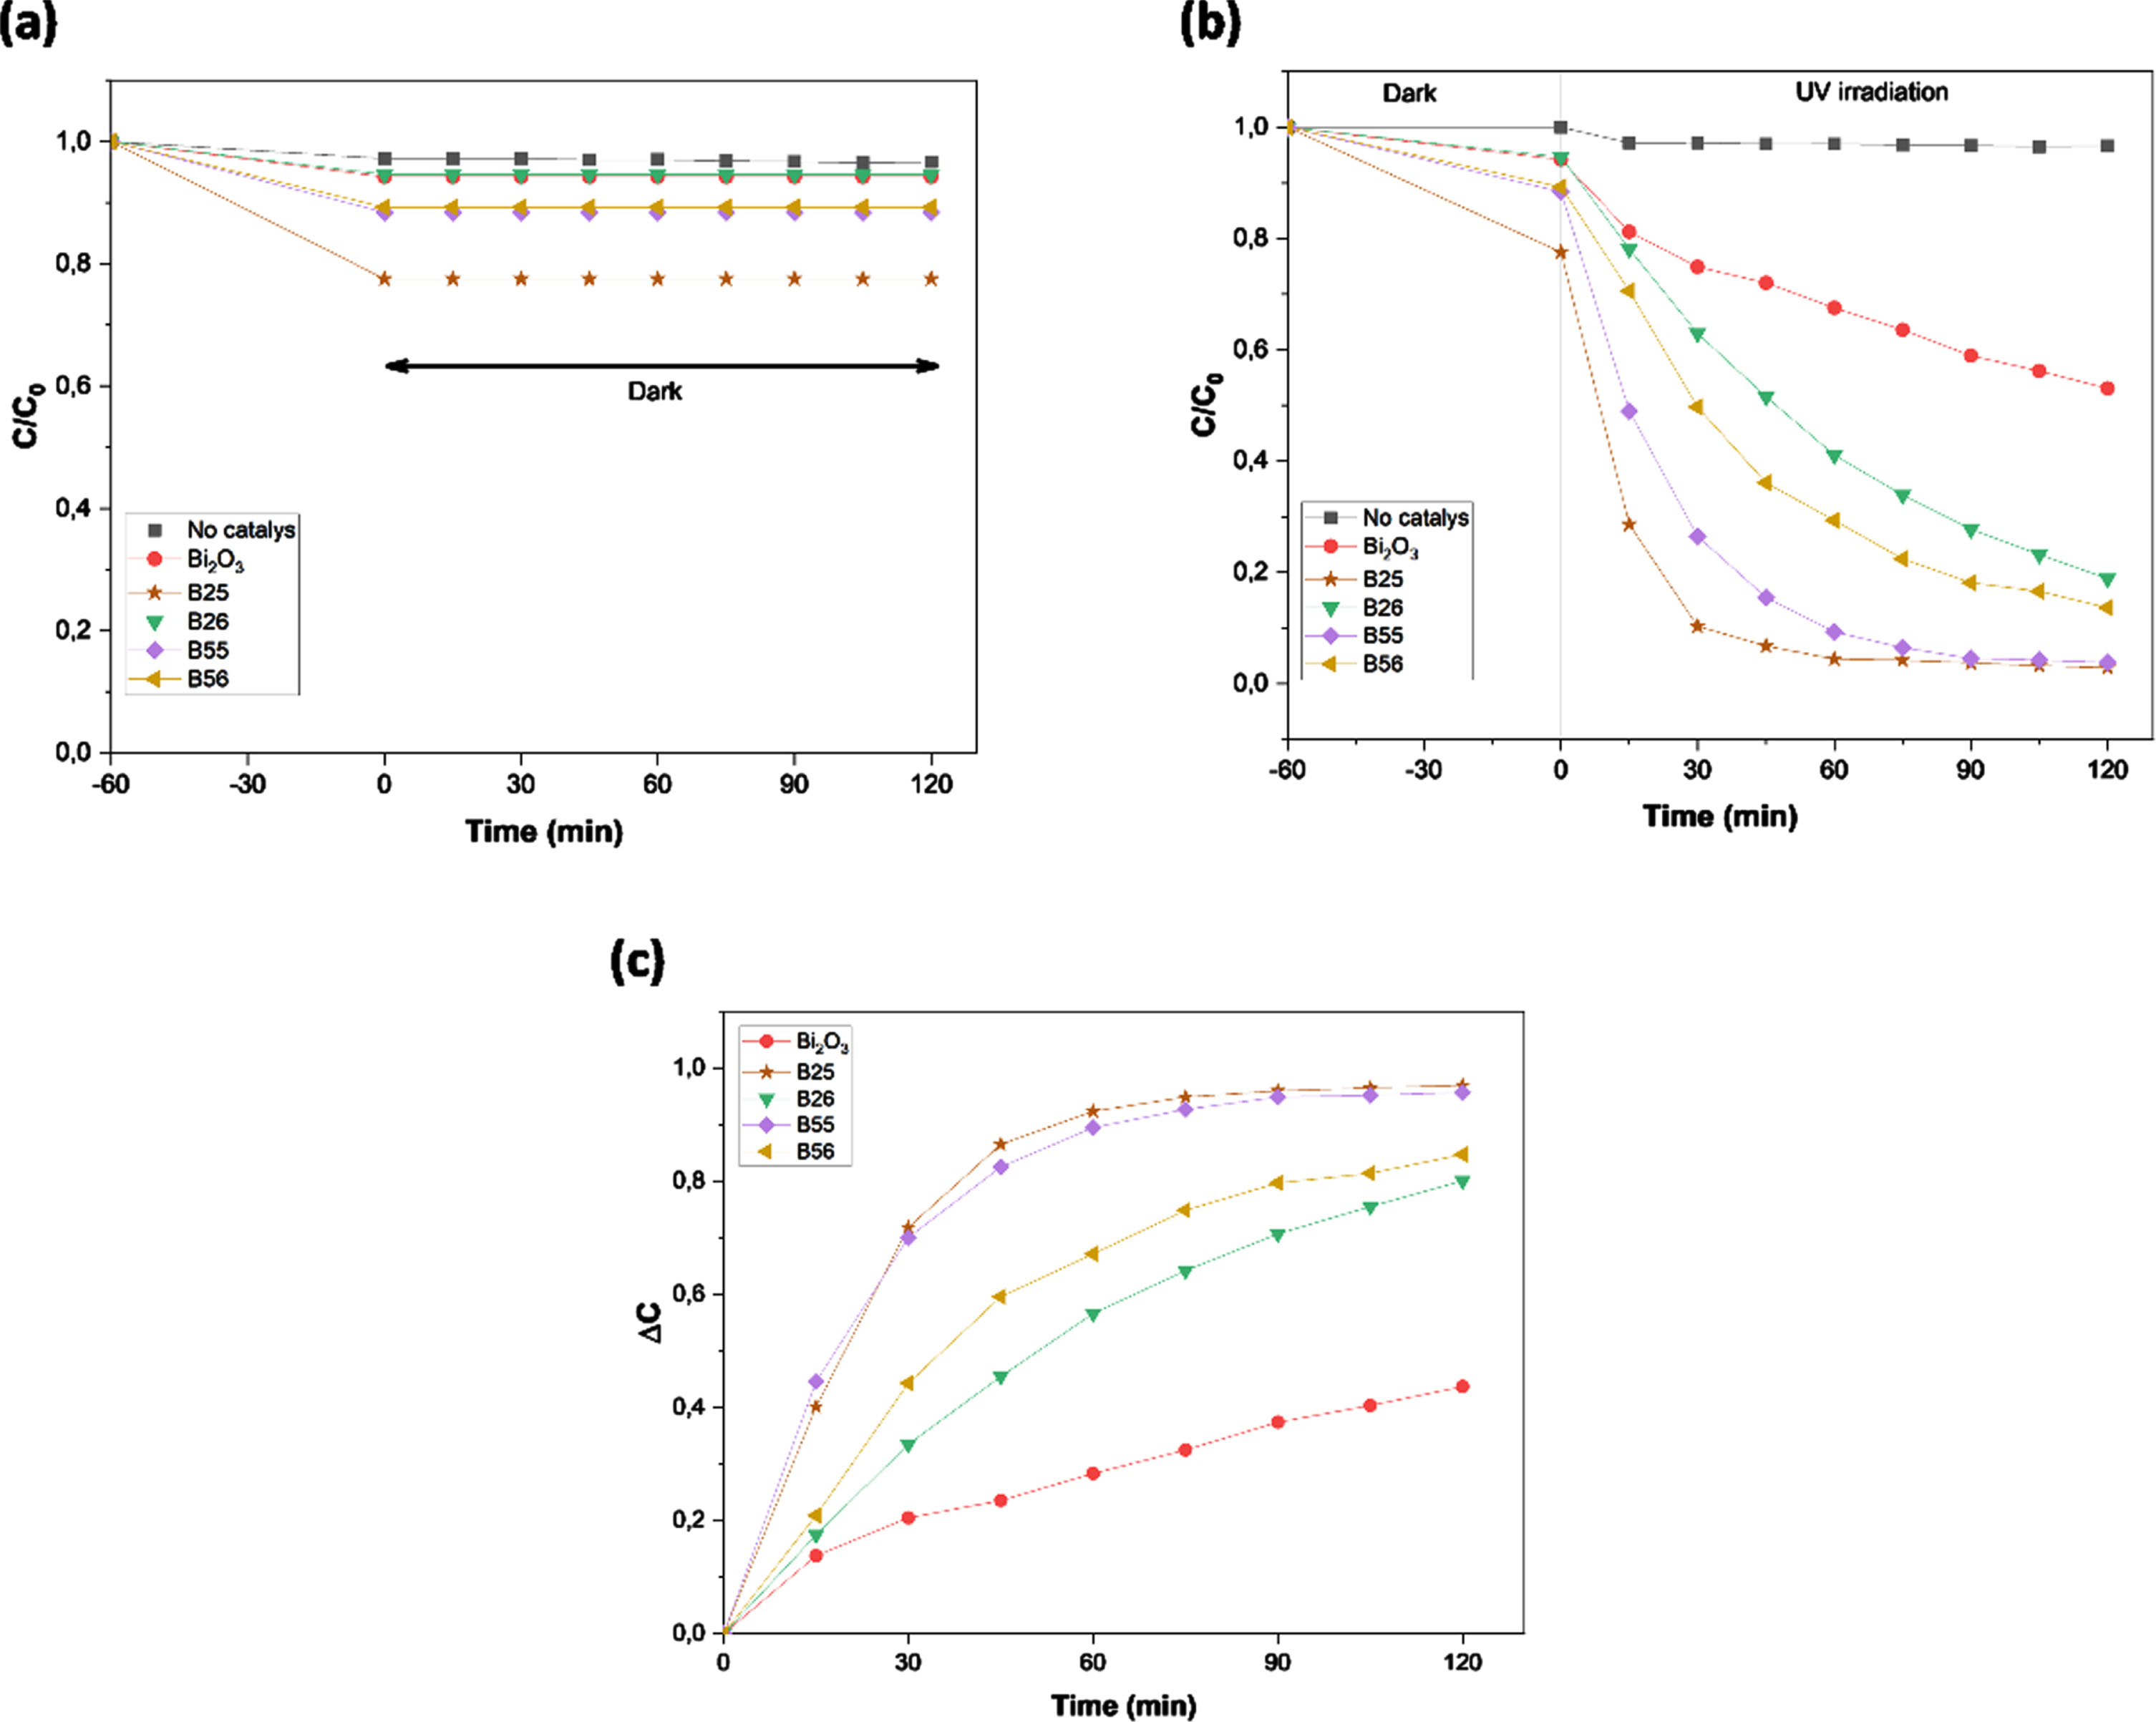
Dark MO adsorption profiles over various catalysts (a), MO photodegradation and adsorption of various composites (b), photodegraded MO quantity normalized (c).
Two experiments were carried out under comparable reaction conditions to illustrate the true photocatalytic contribution to MO degradation across numerous photocatalysts: one under UV light and the other in the dark to detect only the adsorption component. As a result, two MO concentrations (CLight and CDark) were measured simultaneously. The following equation, given in Fig. 6(c), provides the true value of photodegradation, excluding the amount of MO adsorption:
As seen in Fig. 6 (b and c), adding 100 mg of each Bi12TiO20/Bi4Ti3O12 heterostructures decreases the MO concentration considerably faster. Furthermore, following irradiation for 120 minutes, the photocatalytic activities of B25, B26, B55, B56, and Bi2O3, respectively, reaches approximately 96.9, 80, 95.7, 84.7 and 43.6%, showing that the MO photodegradation rate over the Bi12TiO20/Bi4Ti3O12 heterostructures are higher, especially for the B25 composite.
An experiment of the methyl orange degradation using B25 directly under sunlight was performed between 3 and 5 p.m in July 2022 at the LAMSE Laboratory, Faculty of Science and Technology, Tangier.
Two samples of dye solution were used: one in the presence of the catalyst and the other without catalyst. Both were prepared and maintained under the same conditions. The discoloration of the first solution was observed, this indicates the degradation of the dye, and the color of the second one was maintained (Fig. 7c). Samples from the first one were taken at different time intervals such as 30, 60, 90, and 120 min for analysis (Fig. 7b). This experiment shows that the catalyst is efficient under natural sunlight and gives the same result as under irradiation of the mercury lamp (Fig. 7a). After 120 min, the catalytic removal rates reach 96.11%, so B25 will be a promising photocatalyst.
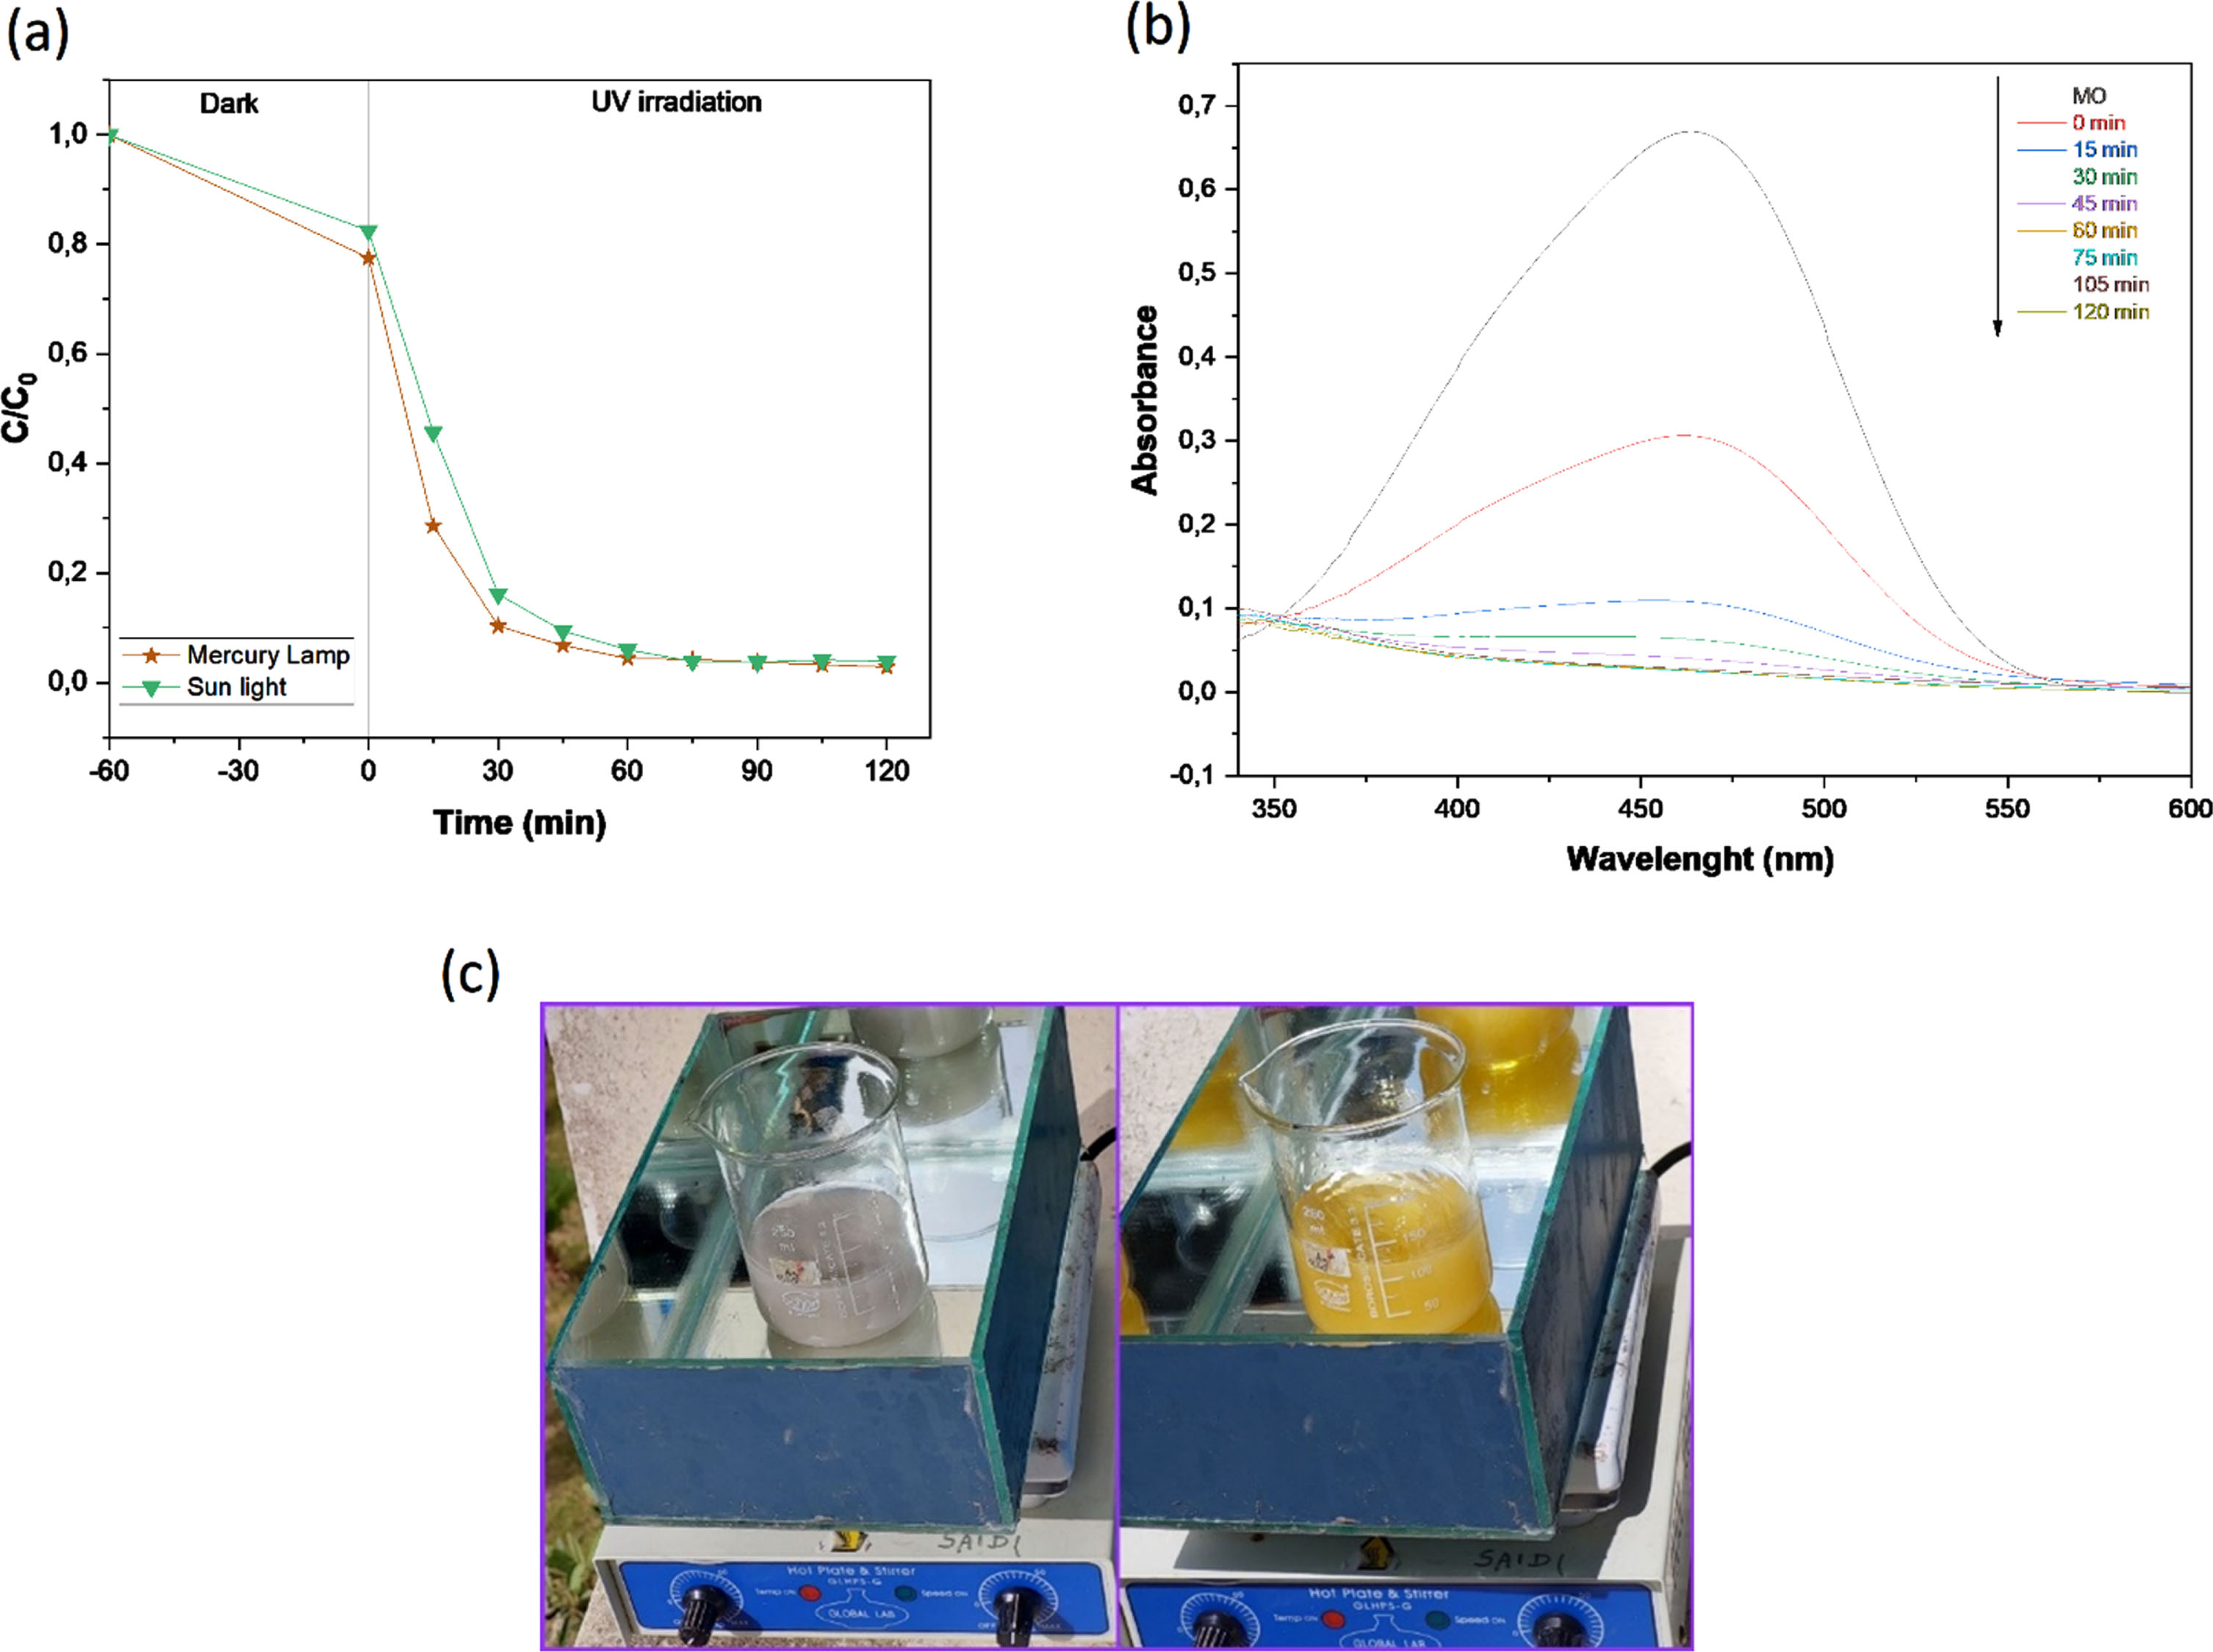
Photodegradation of MO over B25 photocatalysts (a), the MO absorption spectrum in the presence of B25 (b) Decolourization of MO under sunlight (c).
Table 3 summarizes some of the most current approaches for preparing Bismuth-based heterojunctions. The solvothermal process is the most convenient and fast way to directly combine and calcine the oxides for heterojunction production.
Comparison of several techniques for creating Bi-based heterojunctions
The pseudo-first-order kinetic model is used to investigate the kinetics of dye photodegradation over photocatalysts [26].
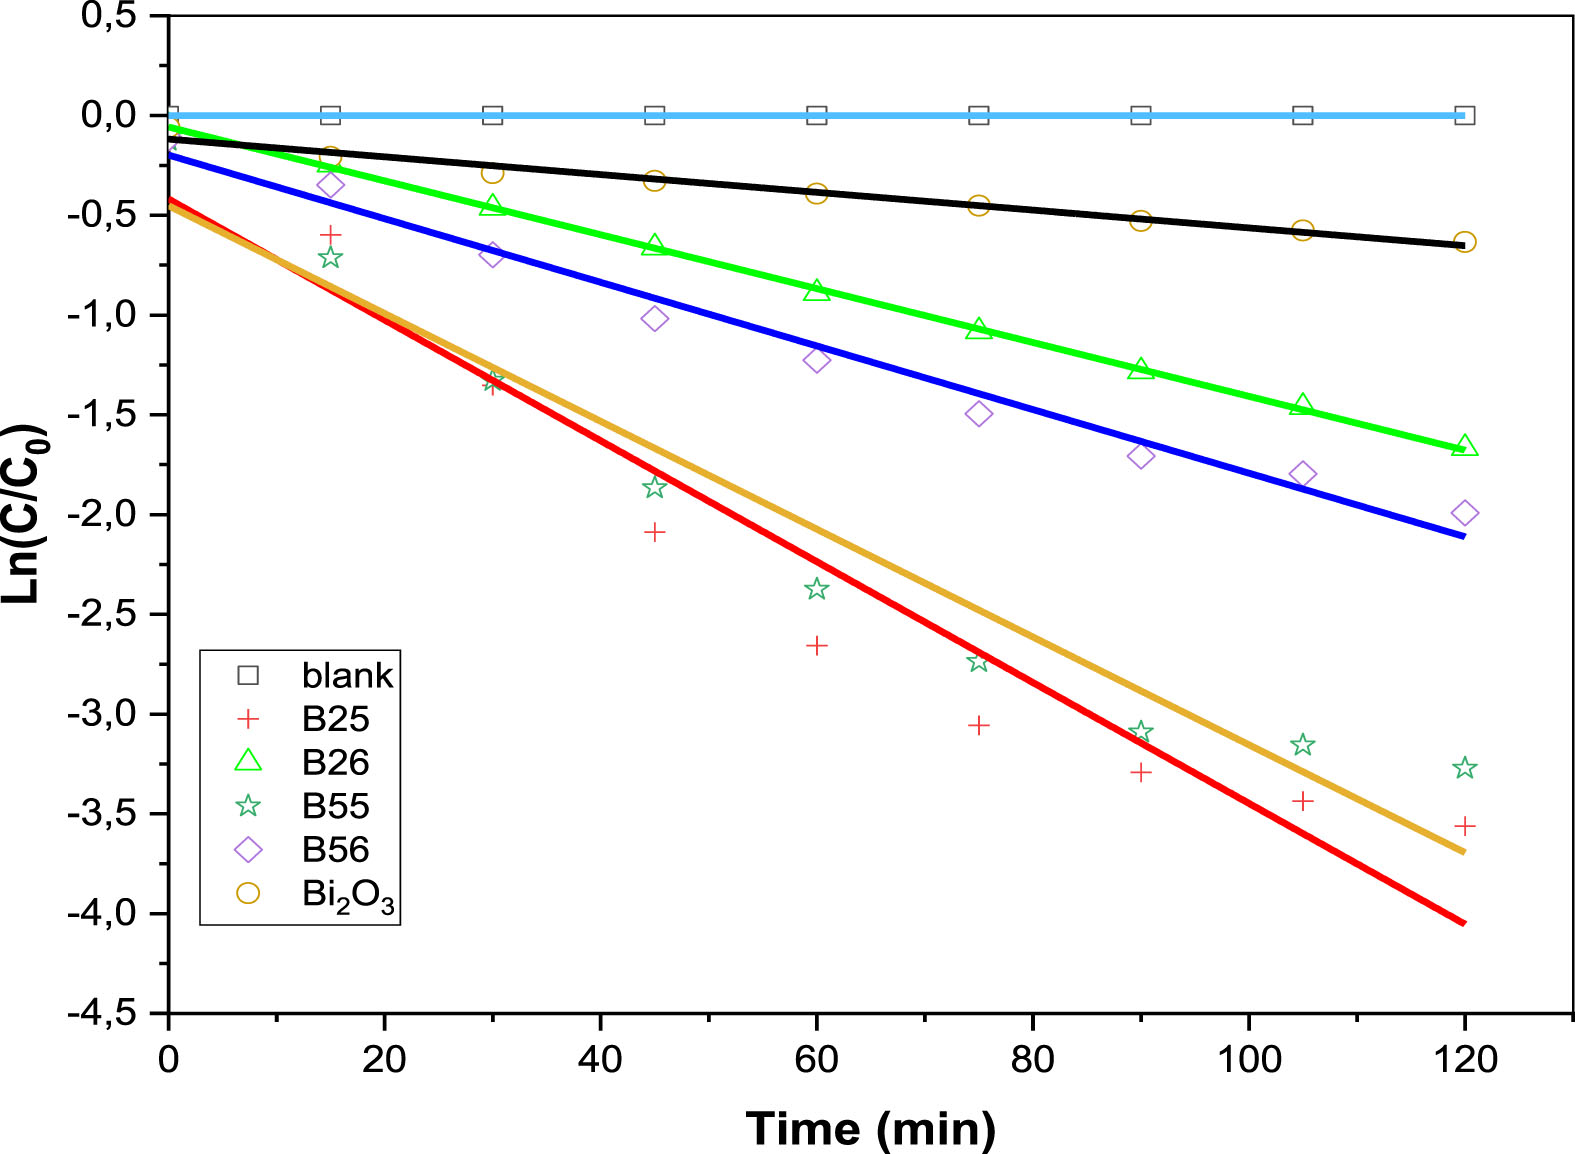
The pseudo-first order rate constants k for MO dye over various catalysts.
Apparent first-order rate constants obtained
Bi12TiO20/Bi4Ti3O12 heterostructures exhibit better photocatalytic performance than pure Bi2O3 phases, on the basis of the calculated k values in Table 4. It indicates that the composites could transfer electrons to prevent electron-hole pair recombination. However, the B25 exhibits the highest photocatalytic activity of these composites, proving that the appropriate ratio contributed to the development of active species [27]. For the B25 composite, the photodegradation of MO in the presence of ultraviolet irradiation is more significant, which presents the suitable composition of the Bi12TiO20/Bi4Ti3O12. Moreover, the comparison of the apparent rate constant k of the samples B25 and B55 on the one hand, or B26 and B56 on the other hand, clearly shows the effect of heat treatment temperature on the efficiency of the photocatalysts. Thus, sintering the samples at 500°C is sufficient to achieve optimal results. This could be explained by the size of the nanocrystallites, which is lower in the case of B25 or B55 (Table 1).
The optimal quantity photocatalyst necessary for the photodecomposition of MO dye is evaluated by modifying the quantity of added B25 from 80 to 120 mg under UV light irradiation. In contrast, the MO dye concentration of 10 mg.L–1 at pH of 5.8 remained unchanged. The results revealed that the MO dye removal efficacy is significantly influenced by the amount of the added photocatalyst (Fig. 9). When 80 mg of photocatalyst is employed, only 91.98% of MO dye degradation occurs. When the photocatalyst dosage was raised to 100, 110, and 120 mg, respectively, 97.15, 93.38, and 92.17% MO degradation was detected. However, increasing the photocatalyst amount to 120 mg gives the lowest percent removal. This decrease in degradation is directly related to the fact that when the photocatalyst dose surpasses a critical limit, the nanoparticles require more space to disperse in the solution, and the particles can stick to each other to form aggregats, causing light penetration to be blocked [28]. Therefore, a catalyst dose of 100 mg was selected in the following experiments.
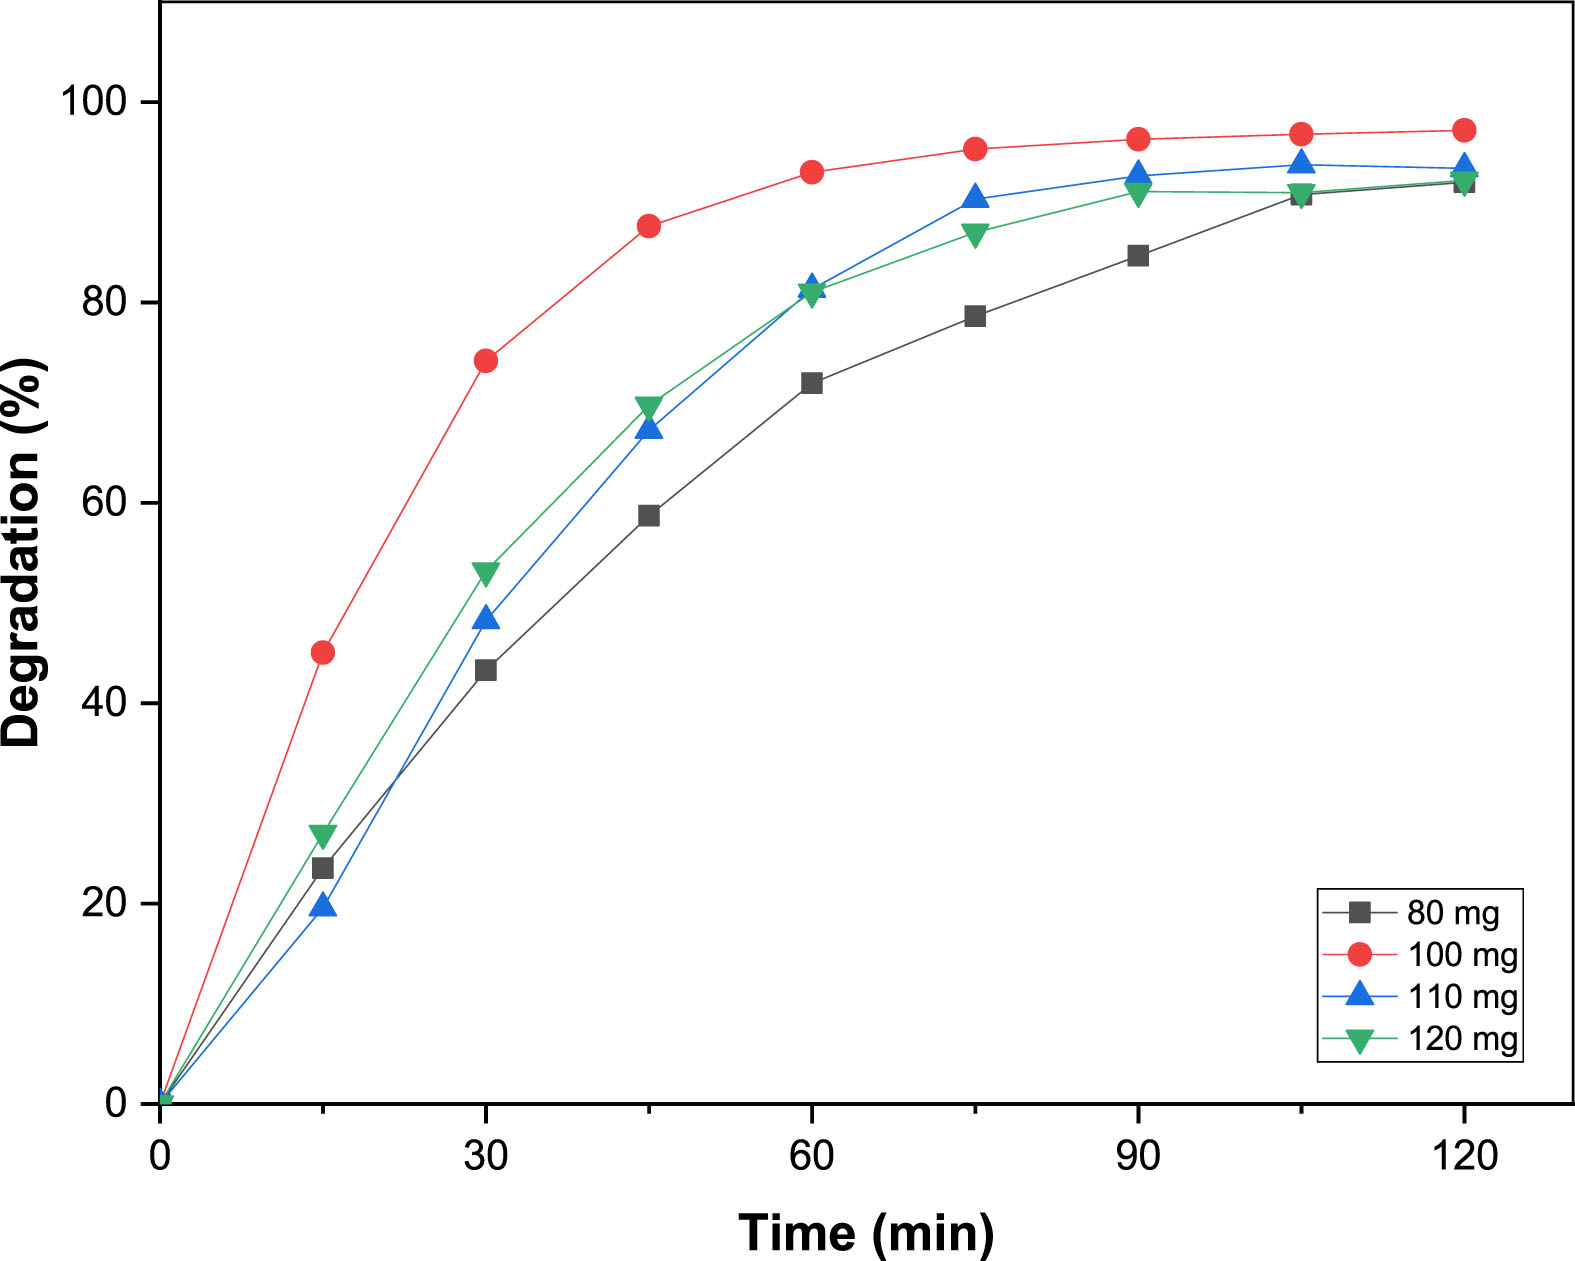
Effect of catalyst dose on the photodegradation of MO.
The impact of MO dye concentration (8–20 mg.L–1) on its elimination by 100 mg of B25 composite is shown in Fig. 10. MO decolorization, after an irradiation time of 120 min, achieves 96.7, 97.1, 92.1 and 86.4% at a concentration of 8, 10, 12 and 20 mg.L–1, respectively. It appears that at high dye concentrations, the active sites of the photocatalyst may be covered with dyes. This reduces the production of •OH radicals on the photocatalyst surface, resulting in lower photocatalytic activity. Photons, on the other hand, can easily reach the photocatalyst surface at low dye concentrations, simplifying the generation of •OH radicals [29]. Since the maximum photodecomposition performance is obtained at a concentration of 10 mg.L–1 of MO, this dye concentration was chosen and employed in the further optimization tests.
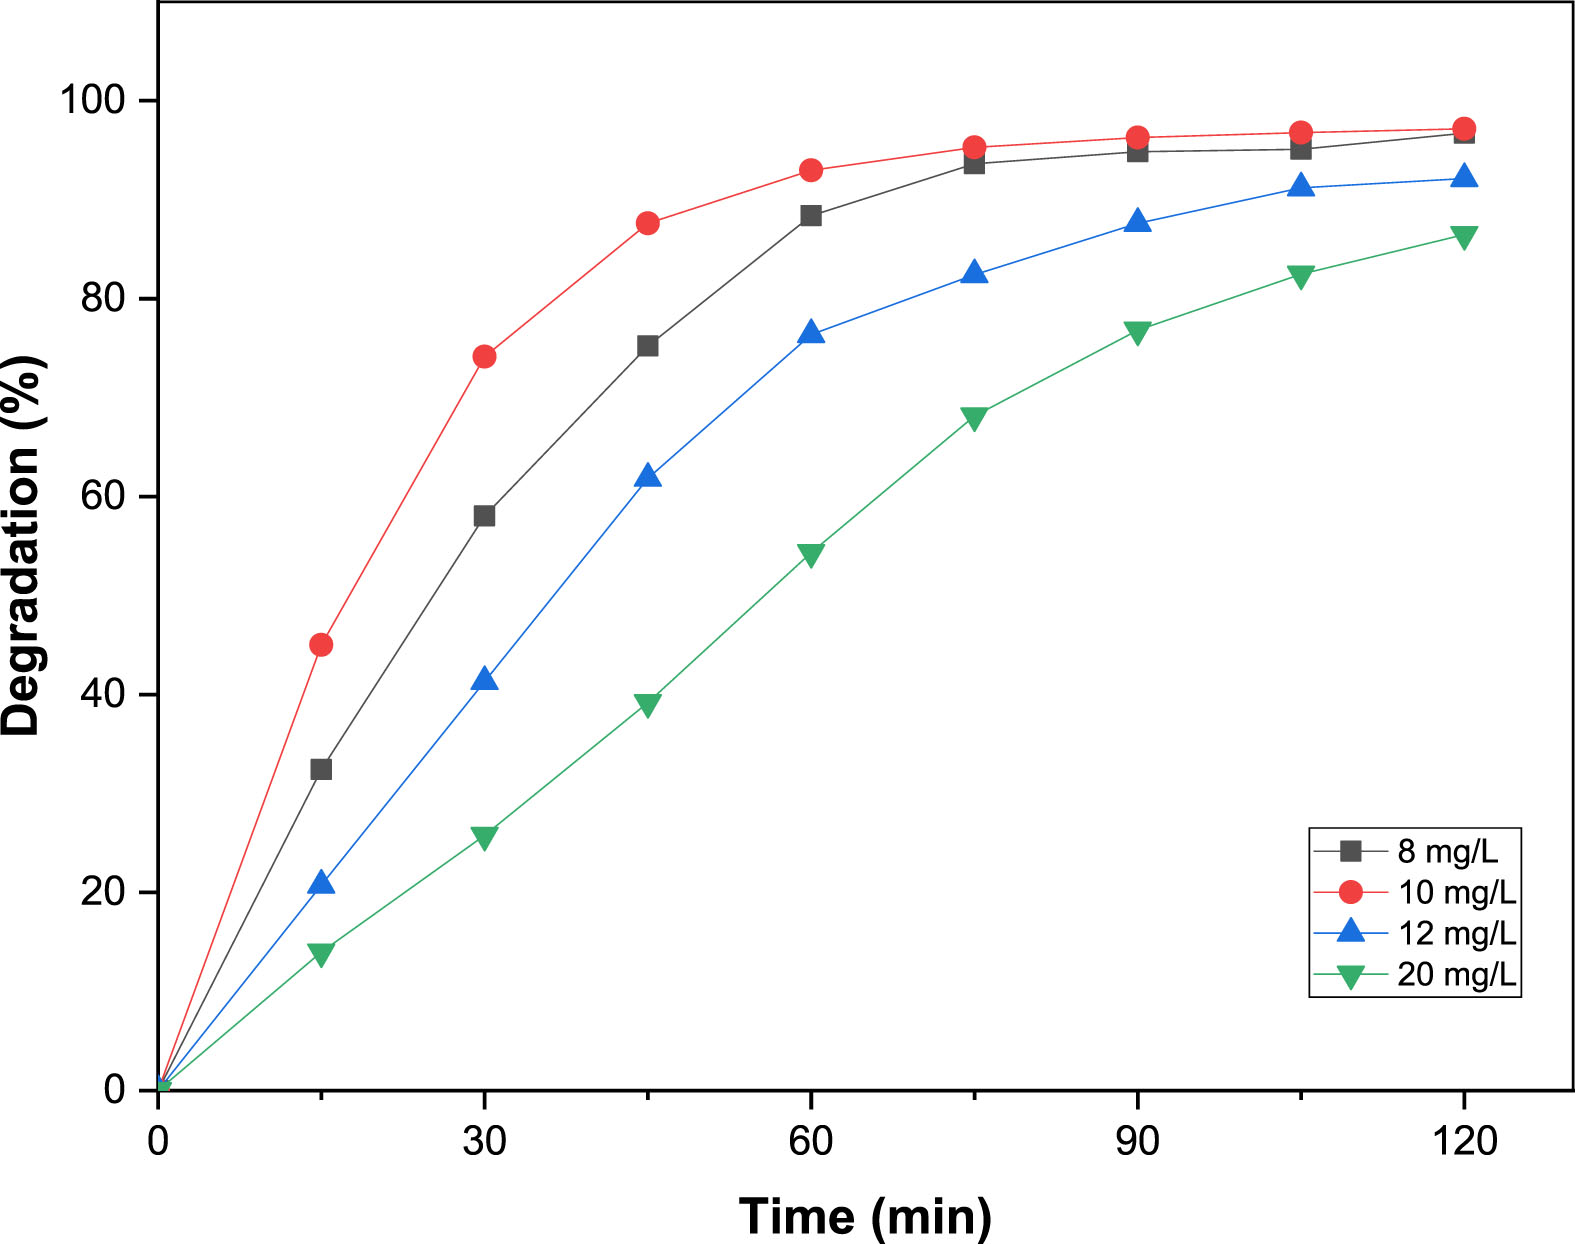
Effect of initial dye concentration on the photodegradation of MO.
The pH value is one of the most essential parameters in the photodegradation of organic dye solutions. MO is a popular anionic dye with an azo group that connects to aromatic sp2 hybridized C-atoms [30, 31]. The absorption spectra in Fig. 11(a) show that the maximum absorption peak changes from 464.9 nm at pH 5.8, 8, and 10 to 504 nm at pH 3, indicating a shift in MO structure for the reason that, in an acidic medium, as the pH value increased, MO changed gradually from a quinoid structure to an azo structure (Fig. 11b). In comparison to its azo structure, MO dye’s quinoid structure was much more unstable and therefore much easier to decolorize [32].
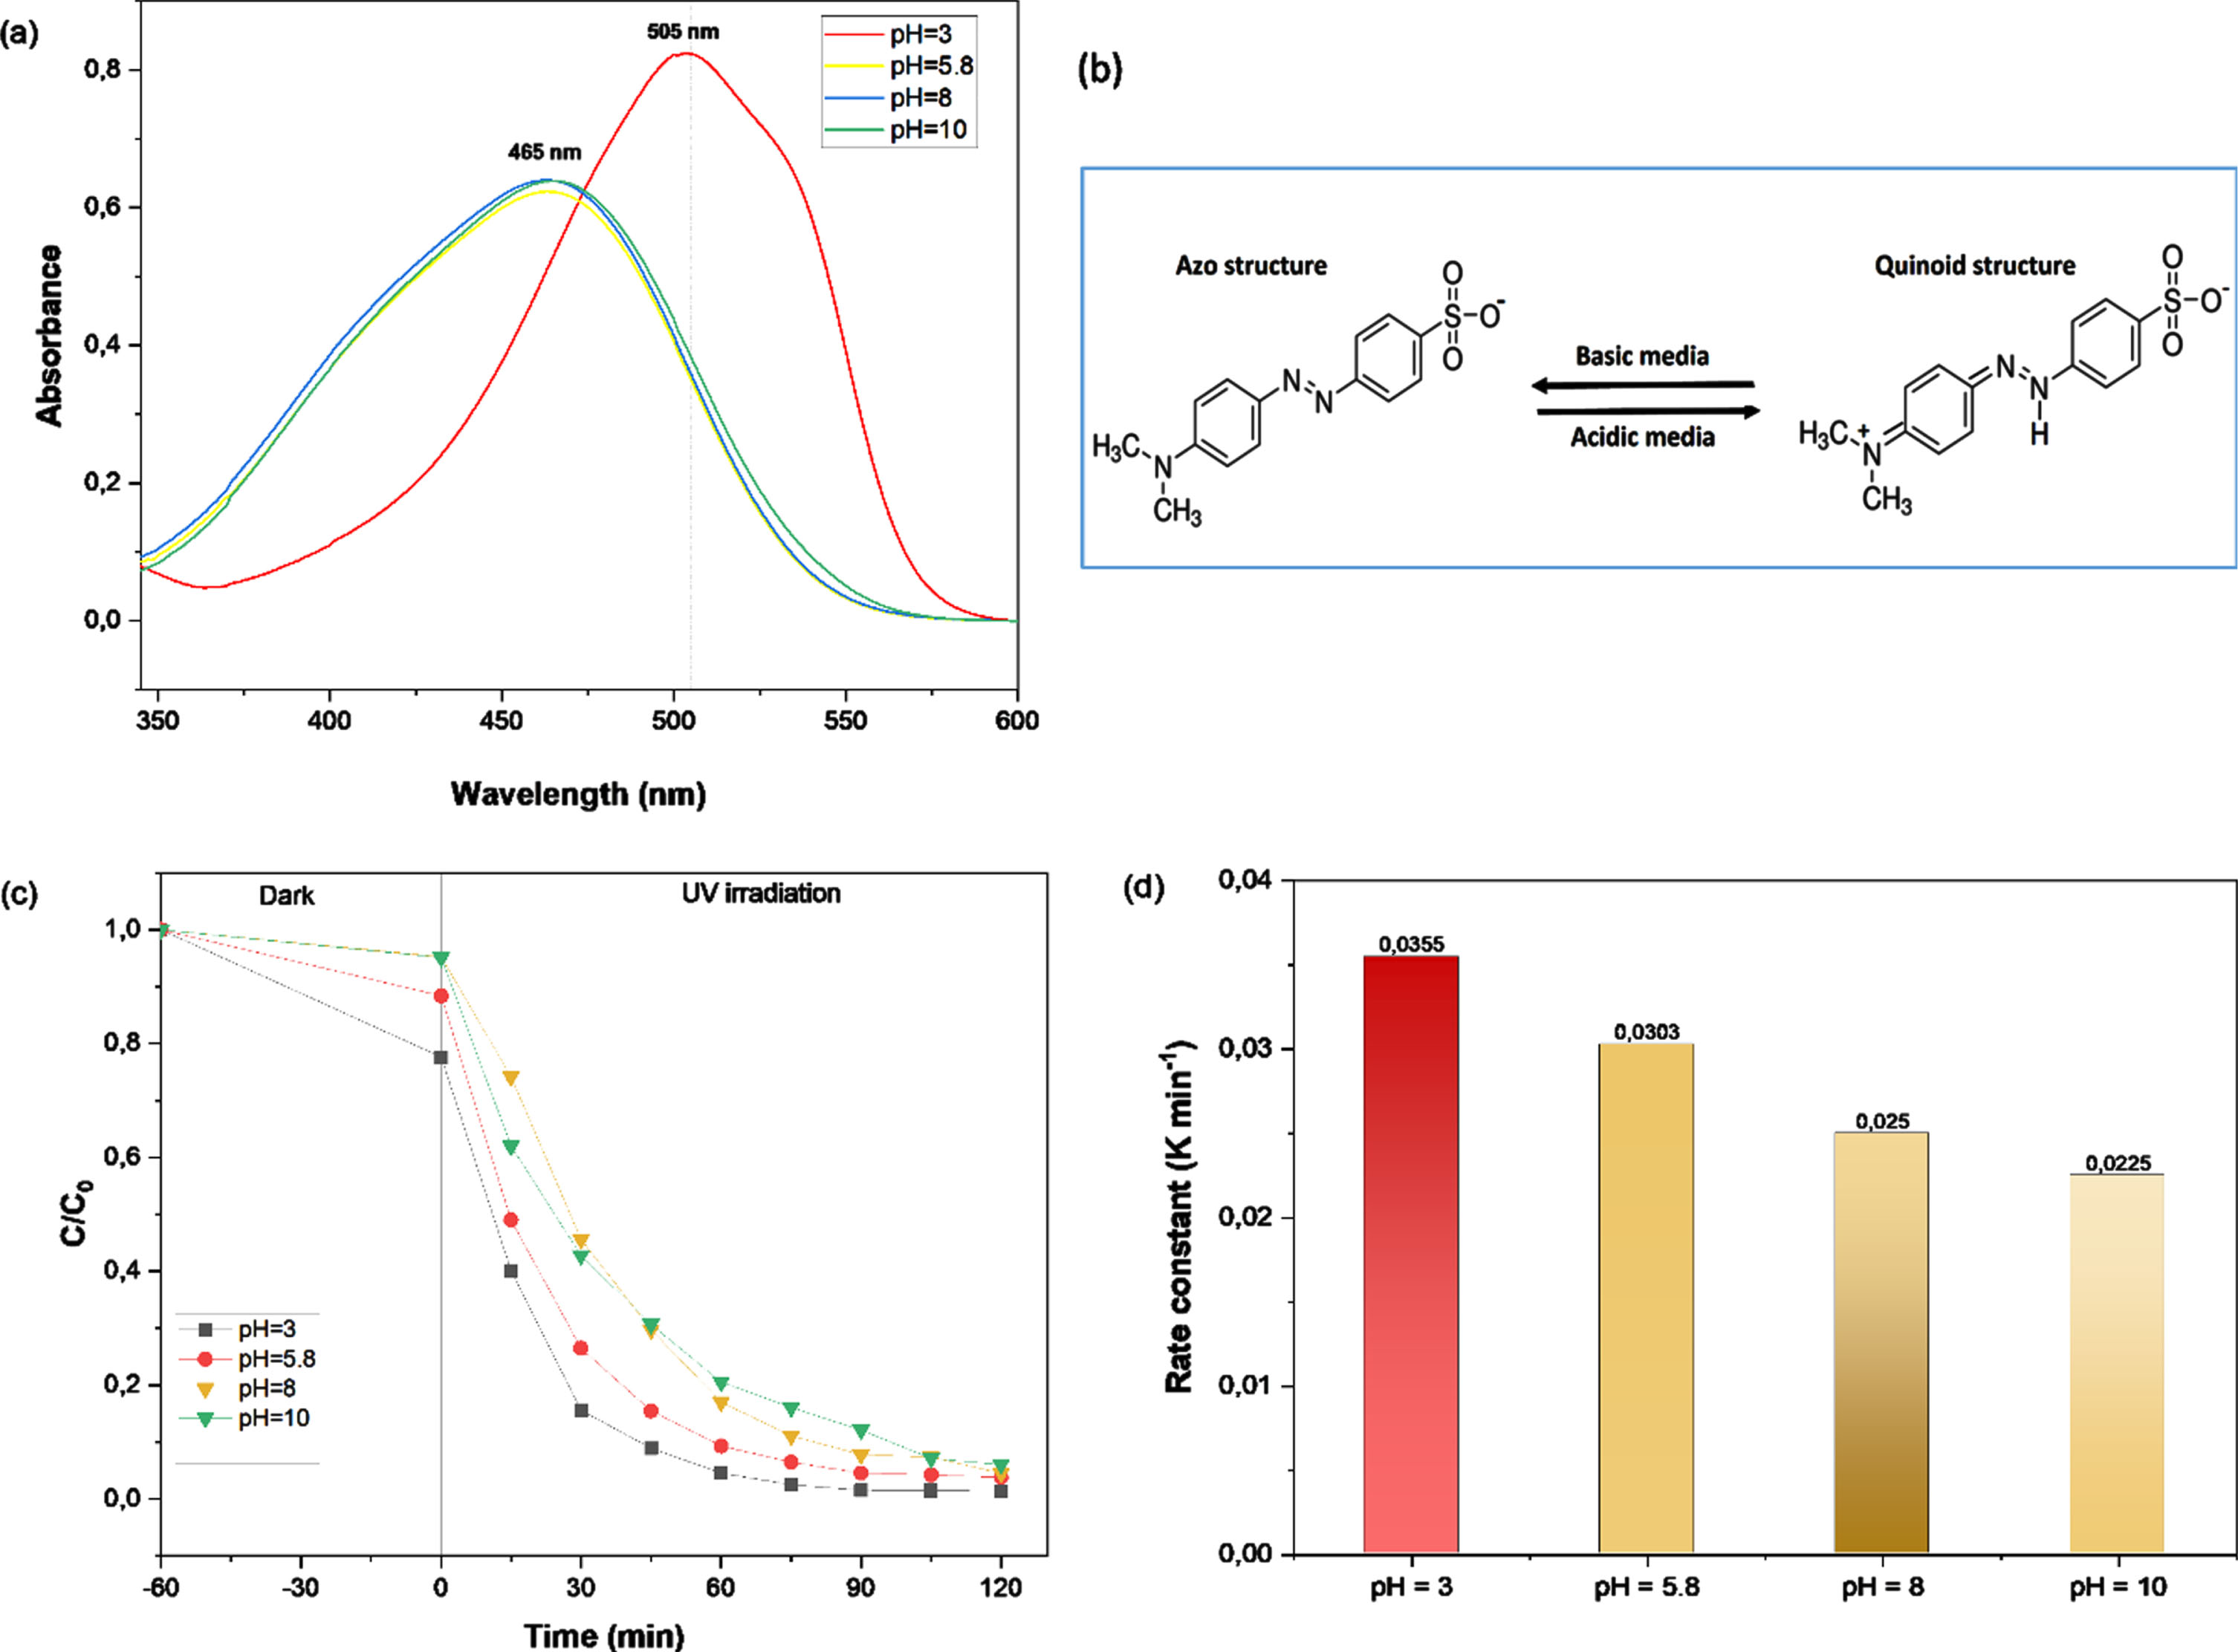
UV–visible absorption spectra of MO (a), MO structural forms at acidic and basic environments (b), time courses of photocatalytic breakdown of MO over B25 photocatalyst at various pH values (c) and the pseudo-first order rate constants (d).
Figure 11(c) reports the starting pH effect on the photodegradation process in the presence of synthesized samples. To evaluate this influence, four tests were performed with pH values of 3, 5.8, 8 and 10 are carried out in B25 suspension. A suitable amount of 0.02 N H2SO4 or 0.02 N NaOH solutions were added to adjust the pH. According to the figure, the catalytic removal rates of B25 for MO were 98.6, 97.15, 95.5, and 93.4%. Initially, MO solution’s pH levels were 3, 5.8, 8, and 10, respectively. The efficiency of MO decolorization decreased slightly as the pH climbed. The experimental results show that the rate of MO decomposition did not vary much in the pH range of 3–8, just slightly decreasing. This indicates that the B25 sample has strong photocatalytic activity in both alkaline and acidic medium and may be utilized throughout a wide pH range.
Figure 11(d) shows the kapp (Apparent rate constants), estimated from the slopes of the plots ln(C/C0) vs ultraviolet irradiation time curve. The kapp values fall as the pH increases; the maximum is 0.0355 min–1 at pH 3 and the lowest is 0.0225 min–1 at pH 10. The photodegradation closely matches the kinetics of the pseudo-first order at the pH levels studied, with correlation coefficients over 0.998.
Following 60 min of darkness, the adsorption ability of dyes varies considerably when the pH increases from 3 to 10, the color removal decreases from 22.3 to 4.8%. This can be explained in part by how the surface charge of the photocatalyst changes with the pH value, which results in varying degrees of repulsion forces between catalysts and MO molecules [30]. This has an effect on the photocatalytic activity, as polluting molecules are little attacked by •OH radicals, the rate of degradation decreases [30, 33].
The point of zero charges is critical in defining the surface charge of a solid material since it impacts adsorption and photocatalytic performance. When the initial solution pH is lower than pHzcp, the semiconductor’s surface charge is positive, and the opposite is true. According to titration curves shown in Fig. 12, the pHzcp of the B25 heterostructure is around 3.6. There are two main pH ranges found: The first, which has a pH < pHzcp (in acidic media), the solution generated H+ ions into the B25 photocatalyst leading to the suspension’s pH values to increase. When these H+ ions are adsorbed, the surface acquires a positive charge. Hence, At pH ∼ 3 MO had a powerful electrostatic attraction to the catalyst’s surface. This increases the degree of adsorption and photodegradation. The second, with pH > pHzcp (in alkaline media), The photocatalyst released H+ ions, resulting in lower pH levels and a negative surface charge. The photocatalyst surface and the negatively charged MO were electrostatically repelled, consequence, the decolourization efficiency decreased slightly.
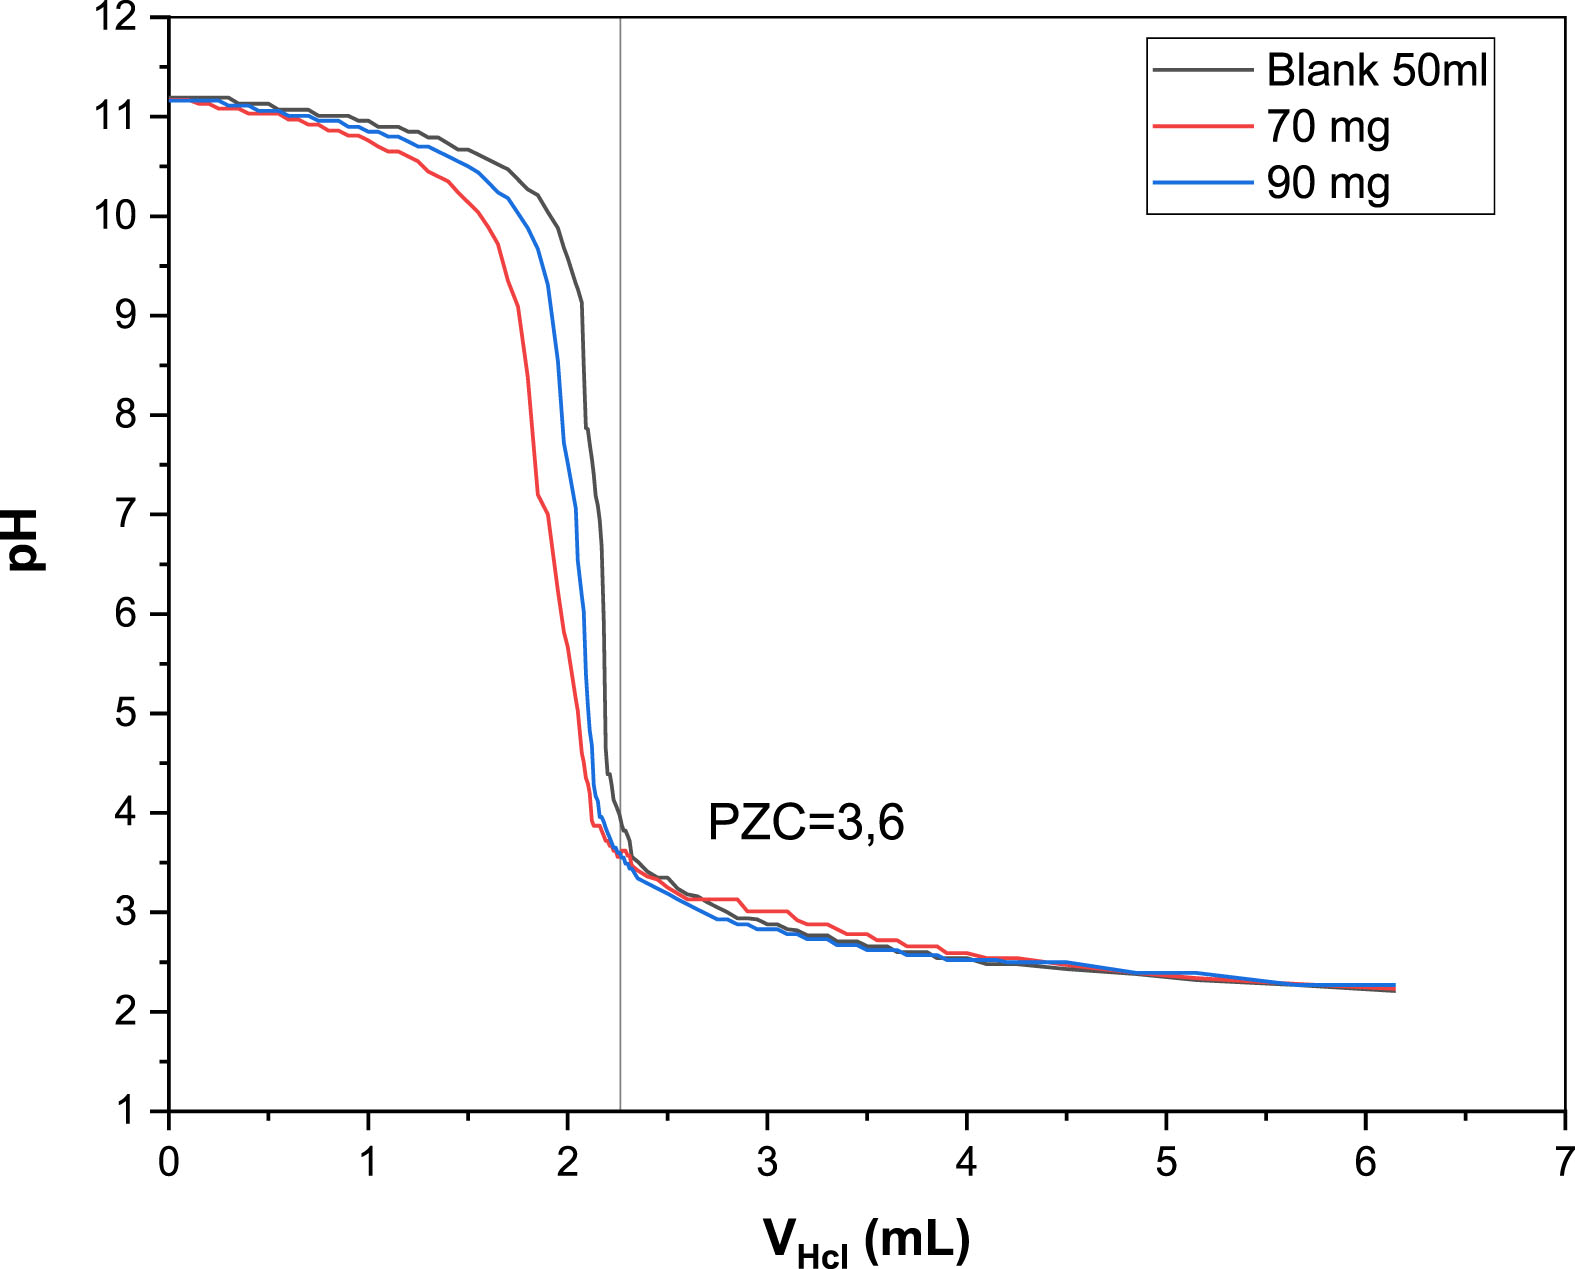
Potentiometric mass titration curves.
Based on the scavenger study, the photocatalytic mechanism of MO degradation was developed (Fig. 13a,b), where it was discovered that MO photodegradation was attributed to reaction pathways controlled by the main active species responsible for dye degradation comprise
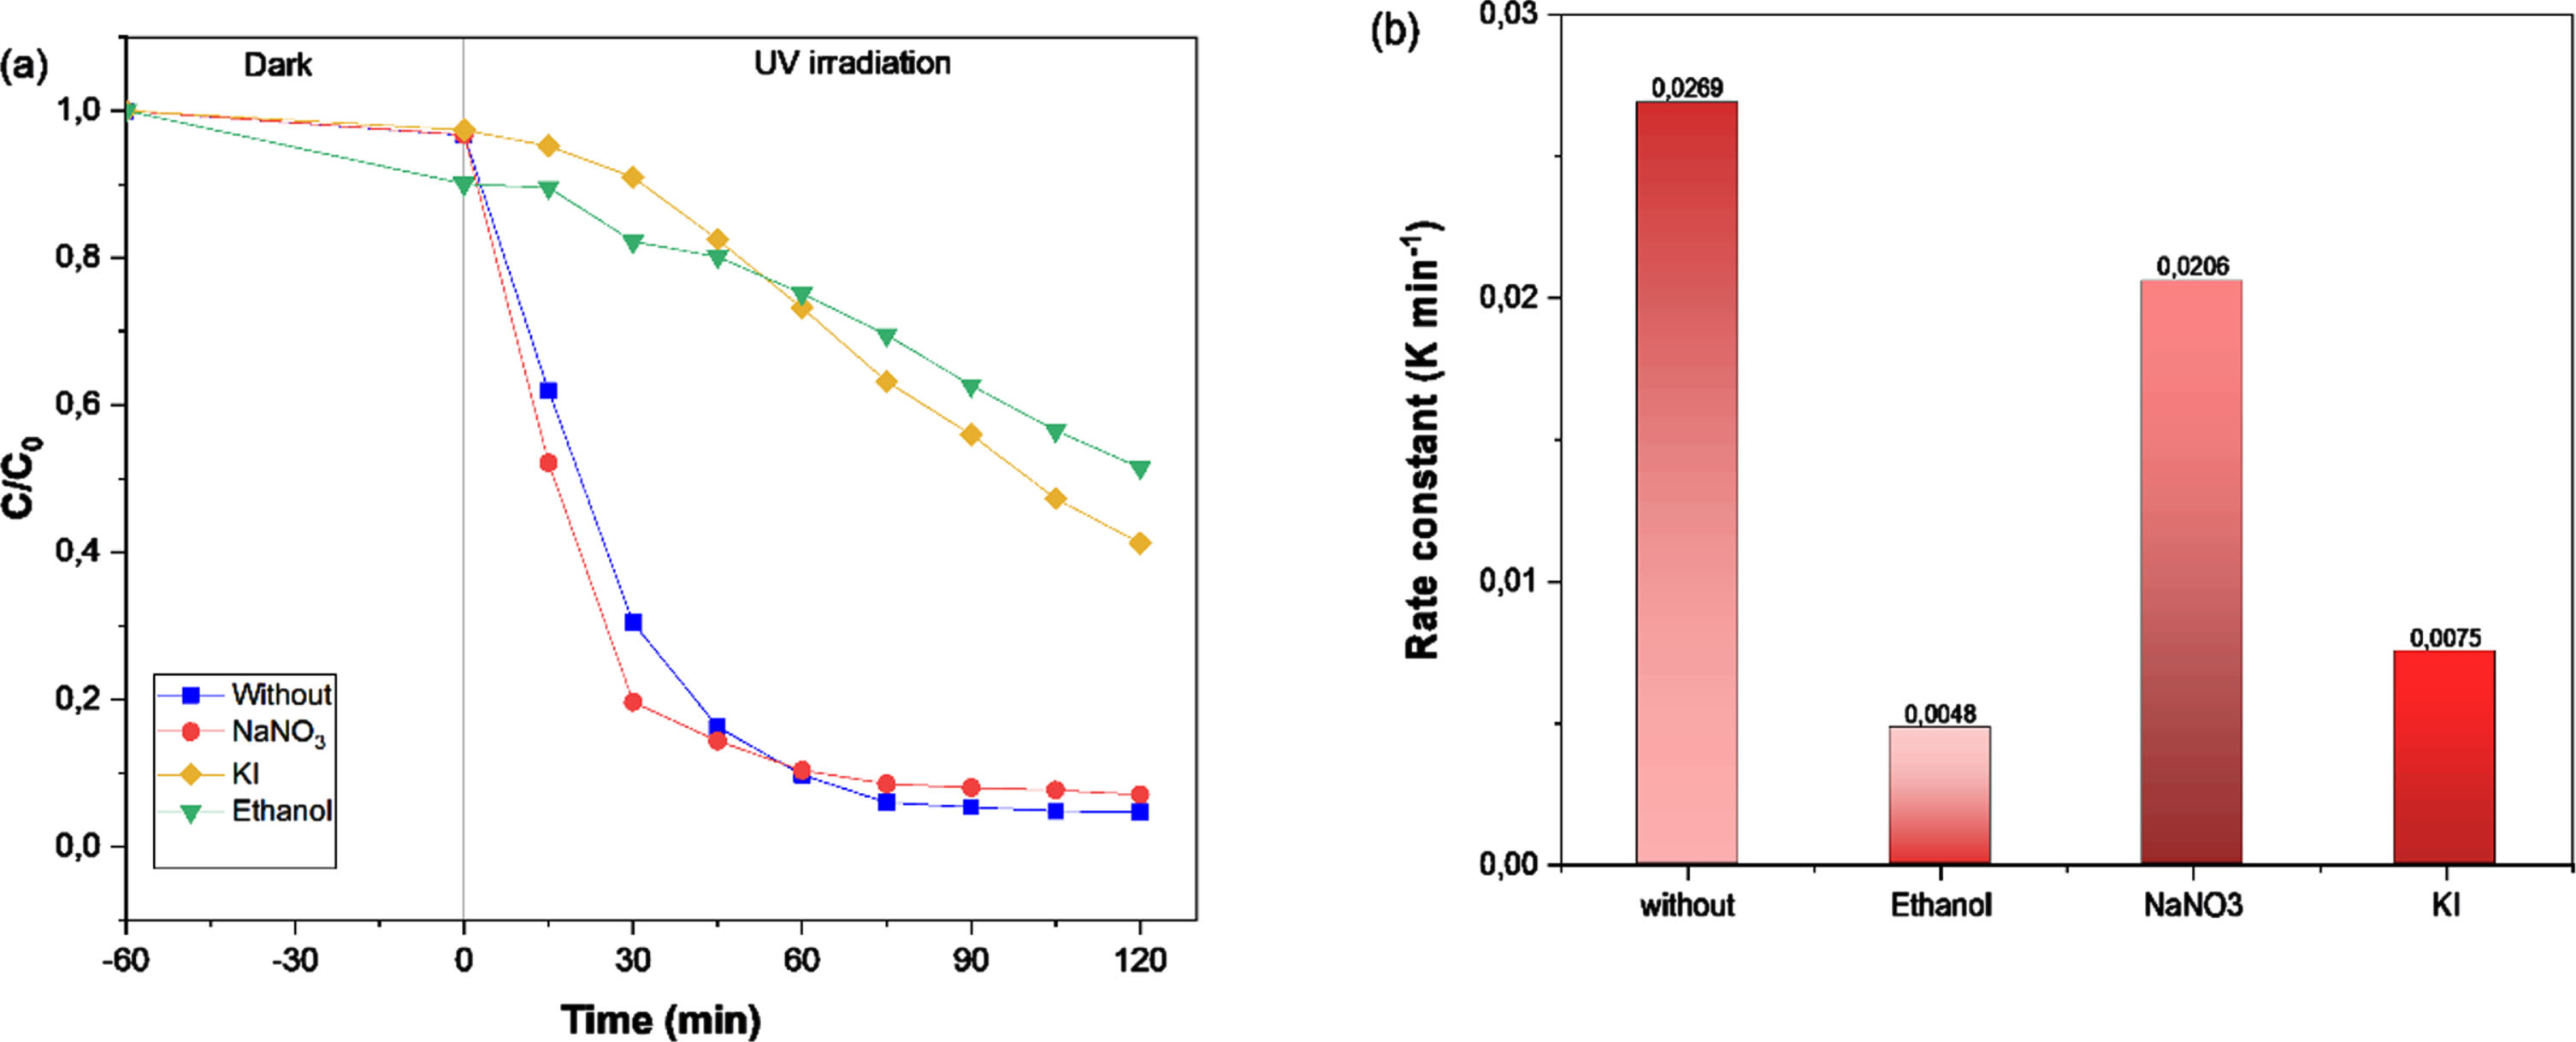
The trapping experiment of various scavenger agents in MO degradation (a), Rate constant, k, of the as-experiments (b).
The band gap energy of Bi4Ti3O12 was 2.92 eV, while its valence band energy and conduction band energy were 2.943 and 0.023 eV, respectively [20, 37], Bi12TiO20 has a band gap energy of 2.57 eV, a valence band energy of 2.33 eV, and a conduction band energy of 0.24 eV, respectively [5]. The difference between the conduction band edge potentials of Bi4Ti3O12 and Bi12TiO20 allowed the photogenerated electron transfer from the conduction band of Bi12TiO20 to that of Bi4Ti3O12 (Fig. 14a).
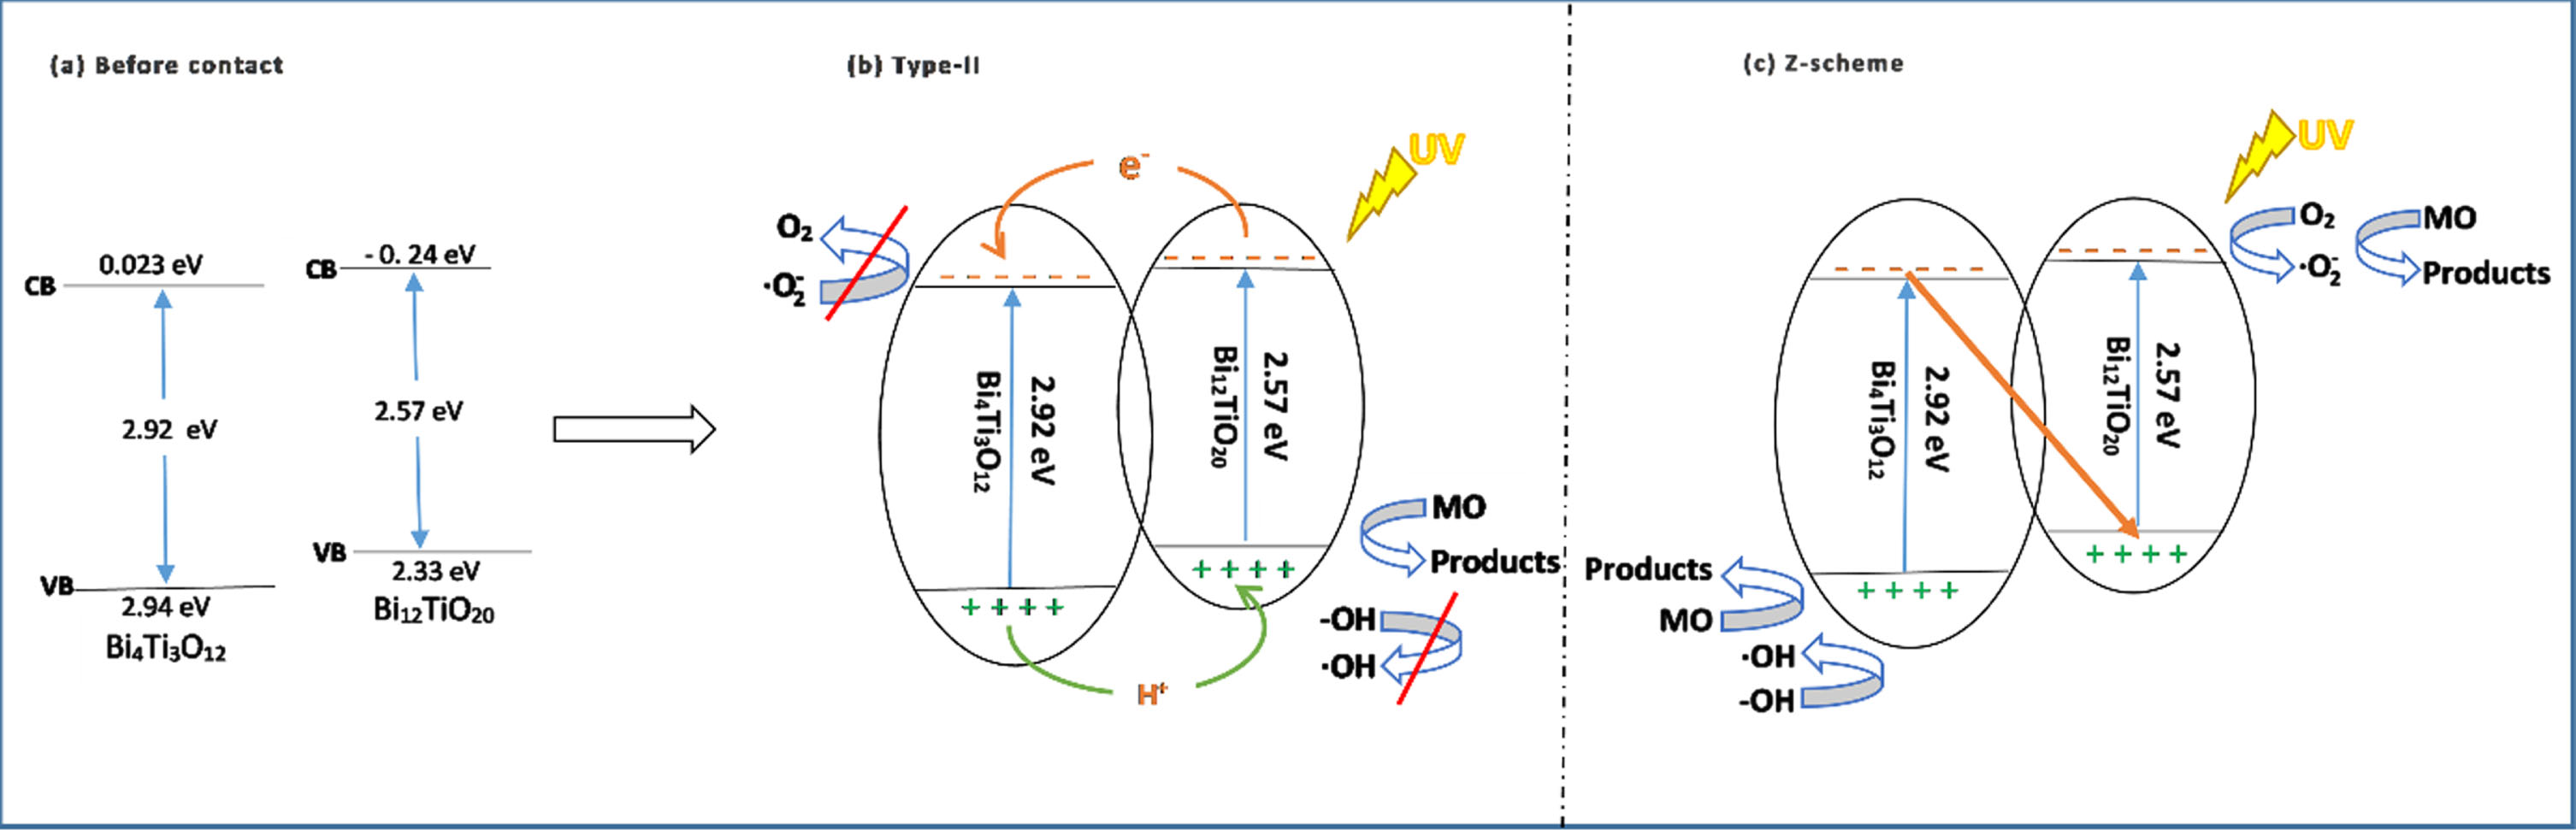
The band potentials of Bi12TiO20 and Bi4Ti3O12 before contact (a), suggested B25 photocatalytic mechanism: II type mechanism (b), Z-scheme mechanism (c).
A potential catalytic mechanism for the B25 photocatalyst was suggested based on the scavenger study and the band position, as shown in Fig. 14(b). Bi12TiO20 is a p-type semiconductor [38], and Bi4Ti3O12 belongs to an n-type semiconductor [39]. Therefore, between the interfaces of Bi12TiO20 and Bi4Ti3O12, a p-n type heterojunction was created.
Since the Bi12TiO20 has a lower conduction band value than E (•OH /H2O = 2.72 eV) and E(•OH /OH– = 2.38 eV) [40], Therefore, the holes in Bi12TiO20 cannot react with OH– or H2O to generate •OH radicals, but instead directly react with MO dye. In addition, the conduction band position of Bi4Ti3O12 was higher than that of E(O2/
The proposed photocatalytic mechanism might be as follows [4, 43]:
Bi4Ti3O12 + hν ⟶ Bi4Ti3O12 (e– + h+)
Bi12TiO20 + hν ⟶ Bi12TiO20 (e– + h+)
Bi4Ti3O12 (e–) + Bi12TiO20 ⟶ Bi4Ti3O12 (h+) + Bi12TiO20 (e–)
Bi4Ti3O12 (h+) + MO ⟶ CO2 + H2O or intermediate products
Bi12TiO20 (e–) + O2 ⟶
HO2• + H2O ⟶ •OH + H2O2
H2O2 ⟶ 2•OH
•OH + MO ⟶ H2O+CO2 or intermediate products
The B25 photocatalyst was reused in five consecutive MO removal experiments to evaluate the heterostructure’s durability and reusability, using the same photocatalytic activity evaluation methodology. The photocatalytic reaction durability was measured by the duration of time needed to remove 97% of the initial MO concentration when exposed to ultraviolet light. After the first cycle of the photocatalysis was finished, the solution was let to stand for 12 hours before the supernatant was decanted. After thoroughly rinsing the photocatalyst with distilled water to remove deposited ions, it was dried at 110°C for 24 hours. In the following cycle of the photocatalytic experiment, the recovered photocatalyst was used in a brand new MO solution under the same conditions (Fig. 15(c)).
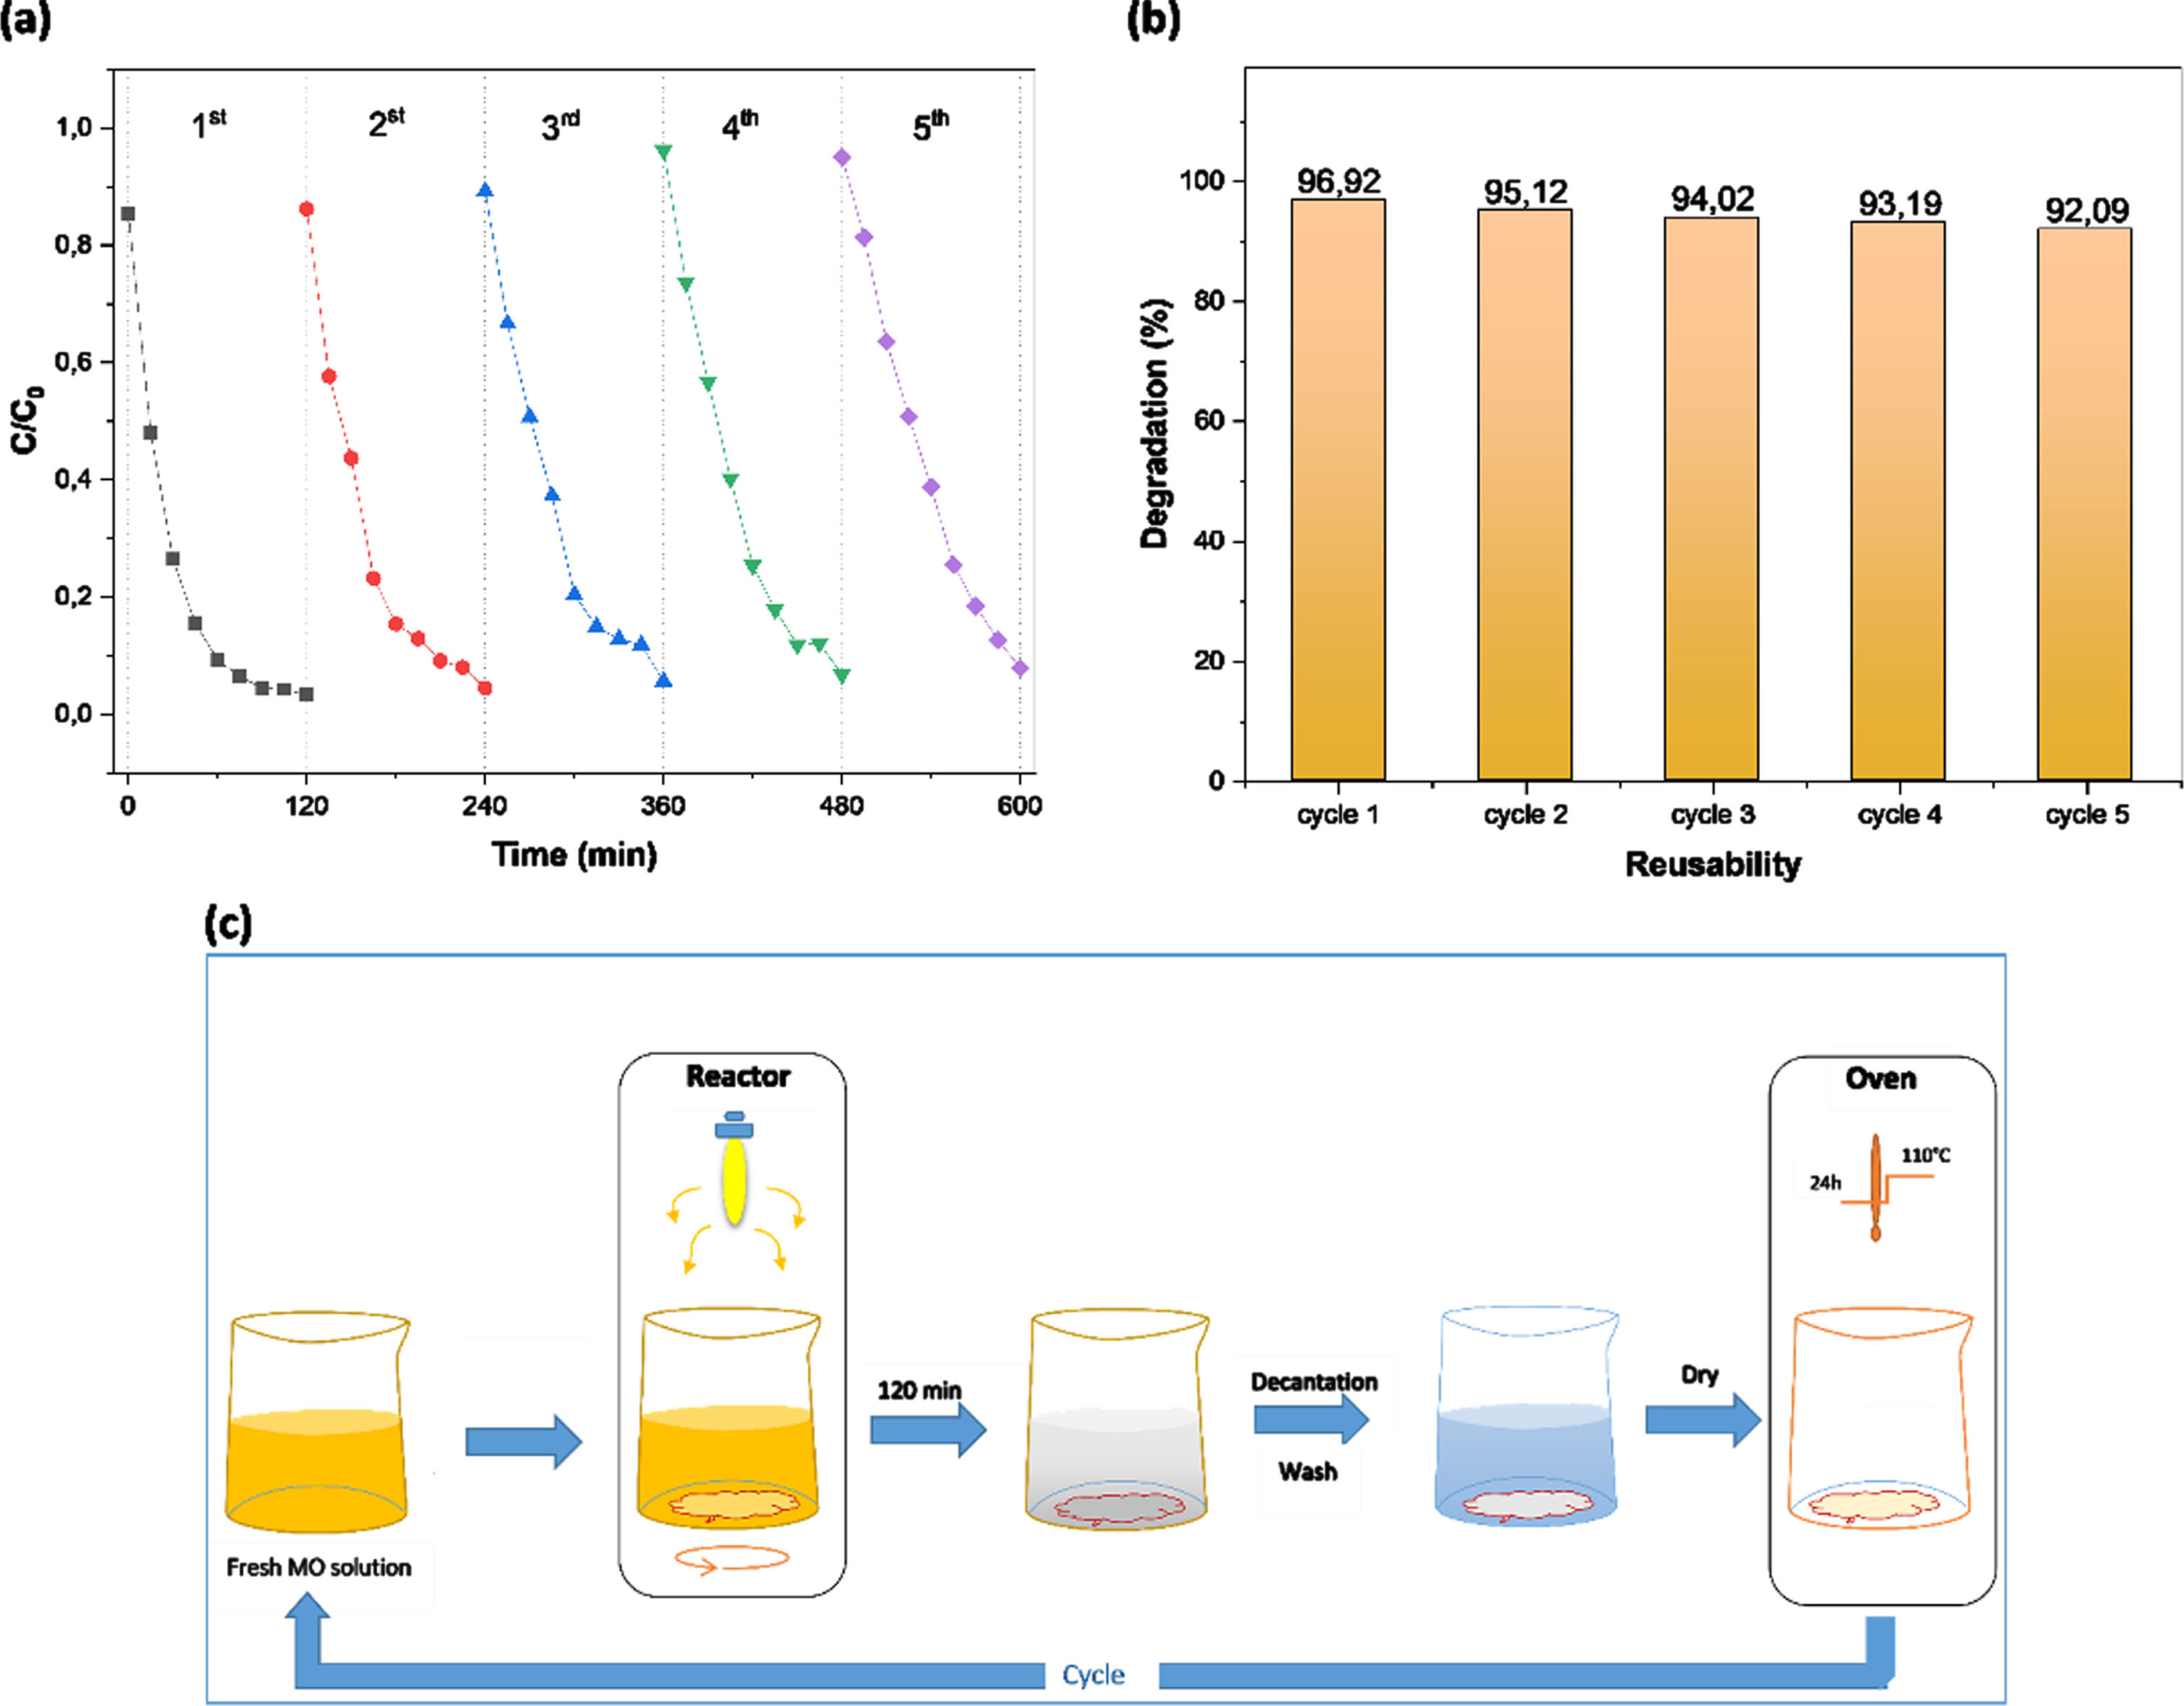
The photocatalytic degradation of MO over B25 under UV irradiation recycling runs (a), Reusability of B25 photocatalyst (b), the cycle and regeneration process of the B25 (c).
The photodegradation of MO accross the five photocatalytic cycles over B25 is shown in Fig. 15(a,b). In the fifth photocatalytic cycle, MO degradation after 120 min of irradiation reaches 92.9%, This indicates that the photocatalyst has good photocatalytic stability after recycling. Therefore, these results indicate that the B25 heterostructure could be repeatedly used in many cycles in the degradation of MO dye. This makes it an attractive photocatalyst for industrial water filtration.
To summarize, a series of Bi12TiO20/Bi4Ti3O12 heterostructures are successfully synthesized via a one-step solvothermal –calcination method. The existence of Bi12TiO20 and Bi4Ti3O12 in all samples is confirmed by XRD data. SEM analysis reveals that the as-prepared samples include spherical and cylindrical nanoparticles. The Bi12TiO20/Bi4Ti3O12 heterostructures demonstrate higher photocatalytic activity in the MO degradation under UV irradiation than the Bi2O3, as a result of the structure-property connection. The improved photocatalytic activity of heterostructures can be attributed to the efficient separation of photogenerated carriers caused by the photoinduced potential difference formed at the junction interface of Bi12TiO20 and Bi4Ti3O12. Furthermore, according to the photocatalytic experiments using capture agents, the primary active species are •OH and holes. The recycling experiments have revealed that the Bi12TiO20/Bi4Ti3O12 catalysts has strong catalytic stability and might be used in a variety of applications, particularly in the case of the B25, which is a promising candidate as an UV-visible light photocatalyst.