
Abstract
This work elucidates the impact of strain on the optical and electronic properties of Fe-doped lithium niobate using density functional theory. The Fe-doped lithium niobate is applied with the tensile and compressive strain (10% and 20%) and optical properties are analyzed. Lithium niobate, a large bandgap material (bandgap 3.56 eV), has absorption limited to the UV region of the optical spectrum only. For the Fe-doped lithium niobate, the bandgap is 1.38 eV, with low absorption in the visible region. The computed results show that the tensile and compressive strains have significantly narrowed down the bandgap of Fe-doped lithium niobate in compression to the unstrained structures. The decrease in the bandgap is largest for the tensile strain of 20% among all the applied strains. Further, visible light absorption is also improved due to the application of strain. The improvement in visible light absorption is highest for the tensile strain of 20% with absorption completely shifted in the desired visible region. The improved visible absorption due to the applied strain makes Fe-doped lithium niobate a potential candidate for optoelectronics and solar applications.
Introduction
Perovskites have high absorption, excellent charge transport capability, low optical absorption losses, and extraordinary diffusion coefficient [1]. These properties of widely used perovskites make them appropriate for optoelectronics-based applications [1, 2]. These materials are extensively accepted in the optoelectronics industry for the fabrication of LED, photodetectors, and optical waveguides [2–4]. Among the available perovskite structures, lithium niobate is an oxide with ferroelectric properties and showed significant importance in the production of photonic and optoelectronic-based devices [6]. Lithium niobate (LiNbO3 widely known as LN) is a widely used dielectric oxide that can be grown using common pulling techniques [5, 6]. It exhibits stable chemical and physical properties and is abundant in raw materials. LN has exceptional piezoelectric, pyroelectric, nonlinear optical, and electro-optic properties, making it a versatile material for nonlinear optical and photonic devices [7–10]. It is often referred to as the “silicon of nonlinear optics” or “silicon of photonics". The extraordinary piezoelectric and optoelectronic properties of LN make it an essential material for optoelectronic applications. Due to its properties such as piezoelectricity, ferroelectricity, nonlinear optics, and pyroelectricity, it is widely used for optical modulators, and optical second harmonic generators [10]. The physical properties of LN are primarily determined by factors such as the ratio of lithium and niobate, impurities, and vacancies on the cation sublattice. In the past few decades, the crystal of LiNbO3 has been synthesized in different sizes through various methods with the Czochralski method being the most commonly used for producing high-quality LN crystals [11–13]. However, these crystals contain intrinsic defects of high concentration such as Nb anti-sites and Li vacancies which negatively impact their optical properties [14–16]. Numerous investigations have been performed to evaluate the impact of these defects on the calculated properties of LN using techniques such as XRD, TEM PL, and Raman spectroscopy [10–15]. To improve the optical response of the crystal alternative growth methods such as flux growth and the modified Cz method has been developed in the last few decades. These approaches have been shown to produce LiNbO3 crystals with reduced levels of intrinsic defects leading to improved performance in optical devices [16]. LN is considered a promising platform for integrated photonics due to its availability, versatility, and widespread use. However, its integration density is limited by low index contrast in weak waveguides. The development of LN devices with high refractive index contrast for strong confinement is favorable for optoelectronic applications. The crystal of LiNbO3 faces challenges such as the lack of compatibility with semiconductor fabrication processes and the limitations of the microfabrication technique in some applications [17–19].
In the last few years, computational techniques have proved themselves significant and essential for research in the field of the study of materials. These techniques facilitate the calculation of a wide variety of comprehensive characteristics like structural, electronic, and optical materials with great accuracy [7, 21]. Computational methods are a vital part of material science research and allow researchers for the accurate calculation of various material properties [7, 21]. As long as the previous researches on the LN are concerned, Inbar et al. [22] investigated the occurrence of ferroelectric behavior in lithium niobate. Weis et al. [23] calculated the physical properties of the LN using experimental studies. Further, Dhar et al. [23] explored experimentally the optical properties of LiNbO3. As far as theoretical studies of the properties of LN are concerned, several researchers attempted to calculate various properties of pristine LiNbO3. Md. Moazzem Hossain et. Al utilized DFT for the computation of the bandgap of lithium niobate and found it 3.54 eV [25]. Ghosez and Vei-Then et al. [26] computed the dynamic properties of LN by applying the local density approximation and generalized gradient approximation approximations of DFT. Ching et al. [27] calculated the electronic bandgap of LiNbO3 by adopting approximate self-energy correction with LDA and computed the bandgap of LN 3.56 eV. Whereas, Nahm and Park et al. [16] calculated the electronic bandgap of the crystal of the LiNbO3 using the Hubbard correction (LDA + U).
Most of the studies performed on LN in the past few years were focused on the modification of the crystal structure of LiNbO3, by applying strategies like doping, vacancy induction, strain, and substation [21, 34]. Further subsequent evidence is there in the literature claiming that the optical response of perovskites is improved by undergoing the suitable strain [10, 28–32]. From the previous work on LiNbO3, we found that the absorption of the pristine lithium niobate is restricted in the region of low wavelengths and high energies due to its large bandgap [10, 35]. We attempted to narrow down the value bandgap of the pristine LN by Fe-doping and subsequently applied the strain to get enhanced optical characteristics. On doping the LiNbO3 with Iron (Fe), the bandgap is narrowed down to the value of 1.38 eV with some part of the absorption available in the visible wavelengths ∼600 nm to ∼800 nm (red-shift). Further, on the applied strain of types compressive and tensile with intensity 10% and 20% the magnitude of the absorption coefficient is increased in the visible spectrum specifically due to the strain of tensile type with intensity 20%. These findings suggested that the doped and strained LiNbO3 can be a possible choice for optoelectronic and solar applications. Furthermore, the optical properties like dielectric function and refractive index are also computed and found improved due to doping and strain.
Computational methodology
We executed the first-principles calculations of LN using Atomistik Toolkit [33]. The calculations were based on DFT using the pseudopotential of plane-wave. The lithium niobate is build using the crystal builder option available with the Atomistik tool. Further, the pristine crystal of LiNbO3 is doped with the iron atom (see Fig. 1) and the compressive and tensile strains (10% and 20%) were applied to the Fe-doped LiNbO3. The exchange-correlation energy was estimated by utilizing the generalized gradient approximation (GGA) function [7, 34]. Geometric optimization of the doped LiNbO3 was performed to ensure convergence of energy, force, stress, and atom displacement. The calculations were performed using a 9×9×9 k-point sample of the Brillouin zone and a mesh cut-off of 150 Ry is utilized for the calculations [21]. The geometry was optimized using the LBFGS algorithm, and the relaxation was performed until the atomic forces among the atoms were minimized up to the value of 0.05 eV for the crystal structure [7]. The residual stress threshold was set at 0.004 GPa. All the calculations of the bandgap are performed using GGA. However, meta-GGA is utilized for the computation of the optical properties for accurate results [7, 34].
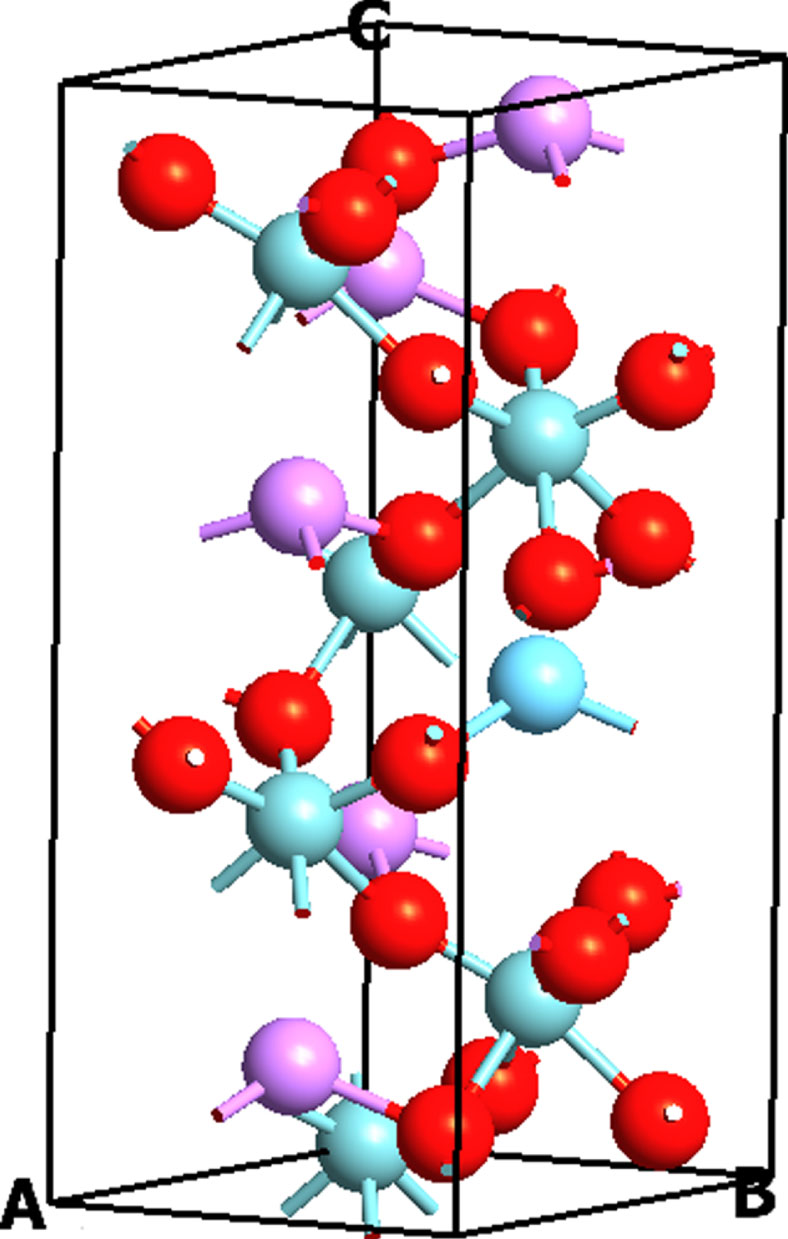
Crystal of pristine LiNbO3.
The optical response of materials is important for characterizing their behavior when interacting with light. The dielectric constant is an important aspect in determining these properties and is represented mathematically by the real and imaginary components as below [21]:
The relationship in refractive index (η), dielectric constant (ɛ
r
), and the coefficient of extinction (k) is given in the equation below:
The imaginary part ɛ2 (ω) is calculated by adding all the direct transitions from occupied to unoccupied states in the Brillouin zone. The real ɛ>1 (ω) and imaginary component ɛ2 (ω) of the dielectric function is utilized to compute other optical parameters, like the absorption (α a ), refractive index (n(ω)), and extinction coefficient (k(ω)).
The refractive index (η), and extinction coefficient (k) are formulated using the real component (ɛ1) and imaginary component (ɛ2) of dielectric function as illustrated below [21]:
Electronic properties
The ferroelectric phase of lithium niobate has a trigonal configuration with of R3c space group and hexagonal symmetry. The hexagonal crystal of lithium niobate is composed of 40 atoms, with 6 lithium atoms, 6 niobate atoms, and 18 O atoms in the Wyckoff site as shown in Fig. 1. The LiNbO3, is doped with Fe with 5% doping concentration. The lattice configuration of the Fe-doped LiNbO3 crystal was optimized to find the ground-state energy for the calculations. The calculated values of the lattice constants of Fe-doped LiNbO3 are a = b = 5.483, c = 14.333. The lattice constants for the pristine LiNbO3 are a = b = 5.204, c = 13.976, and are following experimental and theoretical studies [10, 21]. The results showed that the GGA-PBE functional provided lattice parameters closest to the values calculated in the previous experimental studies. The results were also compared with other theoretical works and found to be comparable [10, 21]. LiNbO3 is a large band gap semiconductor with potential applications in UV photodetection photocatalysis and optoelectronic. The distorted octahedral structure NbO6 is the available active site of LiNbO3 and its high mobility for photo-induced electrons contributes to its photocatalytic activity. The band gap values of Fe-doped doped, and strained Fe- doped LiNbO3 are computed using the GGA method. The value of bandgap for the pristine LiNbO3 is 3.56 eV, similar to the previously calculated experimental value of 3 7 eV. Table 1 illustrate the calculated bandgap Fe-doped LiNbO3 (strained and unstrained). Due to the doping of Fe, the electronic bandgap is decreased to 1.38 eV. Further, due to the applied tensile strain, the bandgap of Fe-doped LiNbO3 is lessened to 1.24 eV and 0.048 eV for the 10% strain and 20 % strain respectively.
Lattice constants and bandgap of the Fe-doped LiNbO3 under strain
Lattice constants and bandgap of the Fe-doped LiNbO3 under strain
For the applied compressive strain, the electronic bandgap of Fe-doped LiNbo3 is reduced to 0.42 eV for 10% and 0.66 eV for 20%. The decrease in the bandgap because of the applied strain may be favorable for visible absorption. The bandgap of a Fe-doped LiNbO3 decreases with increasing tensile strain intensity. This is the result of the downshift in the conduction band minima and the upward shift in the valence band maxima. With higher strain intensity the bandgap continues to decrease and shows the potential for more redshift. The bandgap is lowest for the 20% tensile strain, which indicates the possibility of the highest visible absorption for this value of the applied strain.
The absorption coefficient of the materials is an important parameter in the characterization of materials, especially in the fields of optics and photonics. It provides information on the material’s ability to absorb light and can be used to determine the material’s optical properties like refractive index and absorption coefficient. The absorption coefficient is often used in the design of optical devices such as filters and lenses and in the study of light-matter interactions. The absorption coefficient determines the capability of a material to absorb incident photons, which is important for evaluating its use in photovoltaic devices. The absorption spectrum edge is the point at which light of a particular frequency is absorbed, and the pattern of the absorption spectrum edge can be found from the electronic transitions within the material. The absorption as a function of wavelength and energy for the Fe-doped LiNbO3 and strained Fe-doped LiNbO3 are shown in Fig. 2. The strain applied is compressive and tensile (10% and 20%). Past studies show that for the pristine LiNbO3, the absorption starts from ∼3.5 eV, and the absorption peaks are seen in the high energies. It is observed from past studies that the absorption peaks of the pristine LN are available in the UV range from ∼100 nm to ∼350 nm range. The lower frequencies in this range are not absorbed by the material, allowing most of the light to be transmitted.
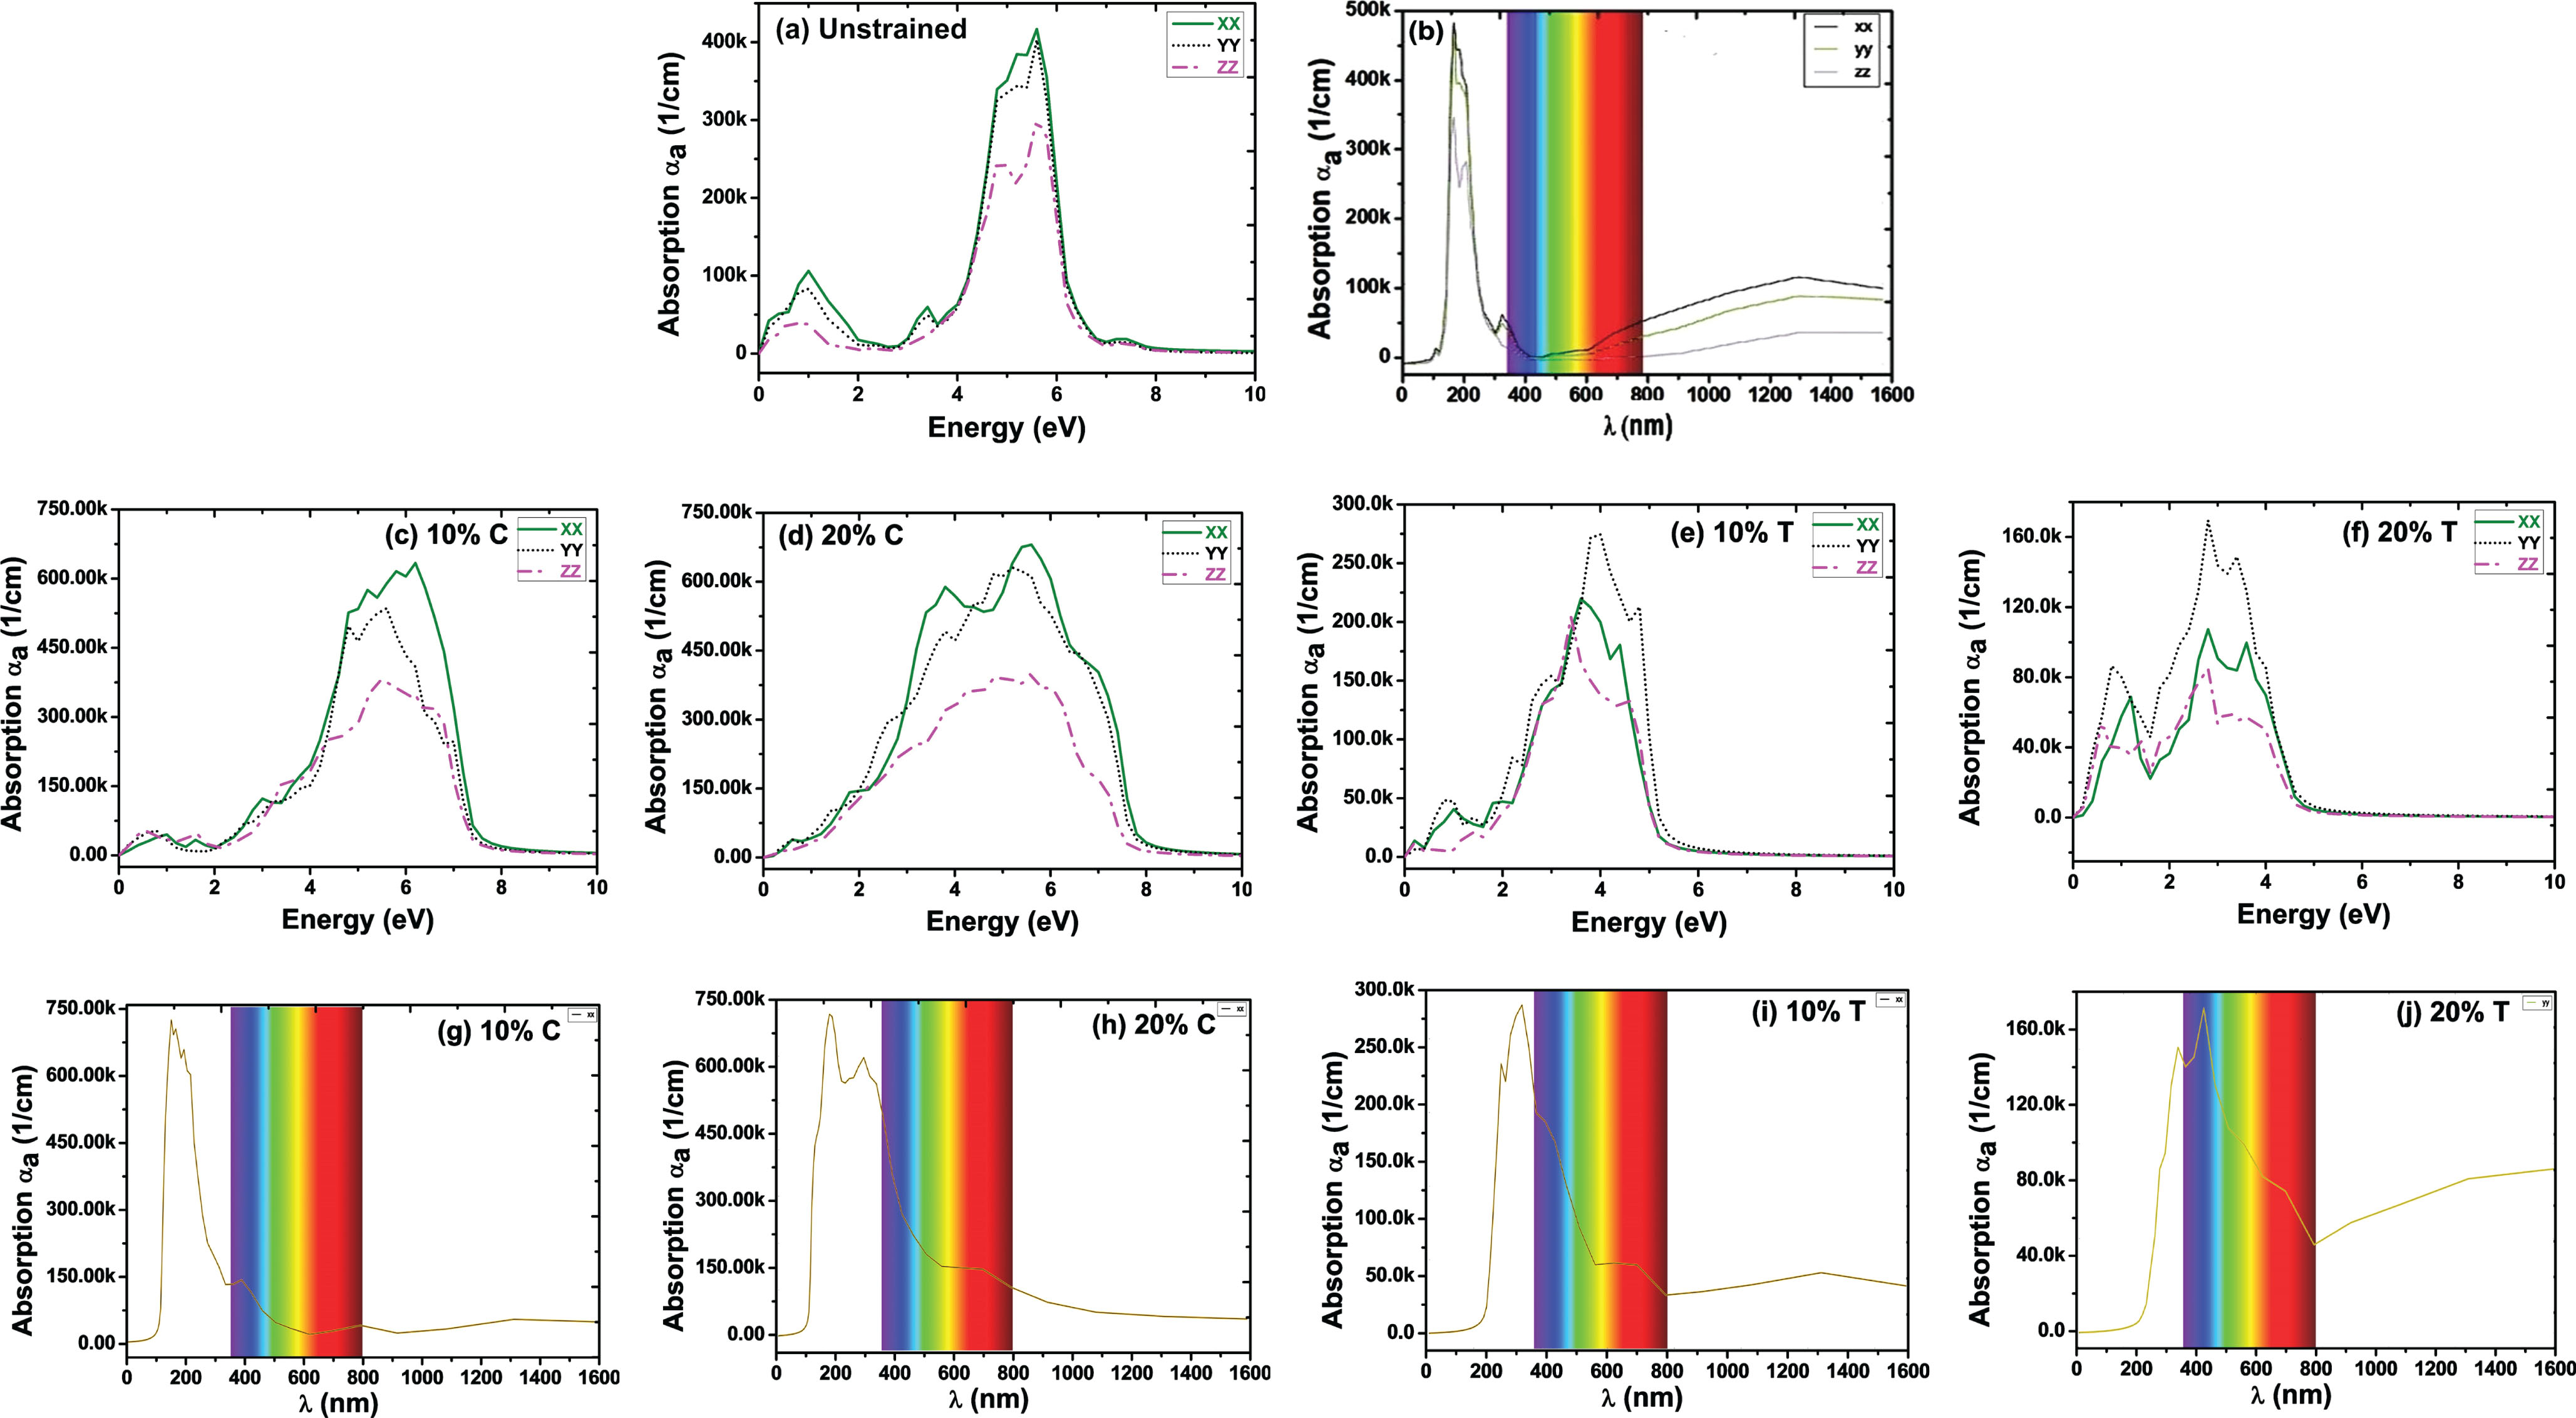
Coefficient of absorption (energy and wavelength) of unstrained and strained Fe-doped lithium niobate (T = tensile and C= compressive).
The absorption is increased when LiNbO3 is doped with Fe. The doping results in reducing its bandgap and increasing the acceleration of the charged particles. For Fe-doped LiNbO3, the nonzero absorptions are found in the visible wavelengths in the range of wavelength ∼350 to ∼400 nm and in the range ∼600 to ∼800 nm (see Fig. 2(a)). The absorption peaks of the Fe-doped LiNbO3 start from low energies with the highest absorption peak at 5.5 eV (see Fig. 2(a)). For Fe-doped LiNbO3, the absorption peaks are available in the high-energy region till the energy range 8 eV (see Fig. 2(a) and 2(b)). The absorption is shifted towards low energies for the stained Fe-doped LiNbO3. For the strain of tensile type, the absorption starts at low energies and remains only till 4 eV (see Fig. 2(e) and Fig. 2(f)). For the strain of compressive type, some part of the absorption is available in the visible area as compared to the unstrained Fe-doped LiNbO3 (see Fig. 2(g) and Fig. 2(h)). The improvement in the visible absorption is high for the strain of compressive type with an intensity of 20% as compared to 10%. For the strain of tensile type, the visible light absorption improvements are high as compared to the compressive strain. For the strain of tensile type with an intensity of 10% the absorption of the Fe-doped LiNbo3 is available in the range of wavelengths from ∼400 to ∼800 nm (see Fig. 2(i)). For the 20% tensile strain, the absorption of the Fe-doped LiNbO3 is completely tuned toward the visible wavelengths (see Fig. 2(j)). The improvement in the absorption because of the strain, specifically for the 20% tensile strain, advocates the acceptability of the strained Fe-doped LiNbO3 for optoelectronics and solar-based applications.
The dielectric constants for Fe- doped LiNbO3 and strained Fe-doped LiNbO3 are illustrated in Fig. 3. The dielectric nature is important to evaluate for identification of the electronic configuration and for knowing the potential use in the optoelectronic applications. The response of the material to incident light is defined by its dielectric function. The dielectric function defines the recombination rate and the device performance with a large value, reducing the rate of charge recombination and increasing device efficiency. The real component of the dielectric function represents polarization, while the imaginary part represents absorption. The dielectric constant of the materials describes the phenomena of the interaction between the moving electron and the energy particle. The real component and imaginary component of dielectric function are plotted for understanding the optical response of the Fe-doped LiNbO3 and the impact of the strain on the dielectric function in Fig. 3.
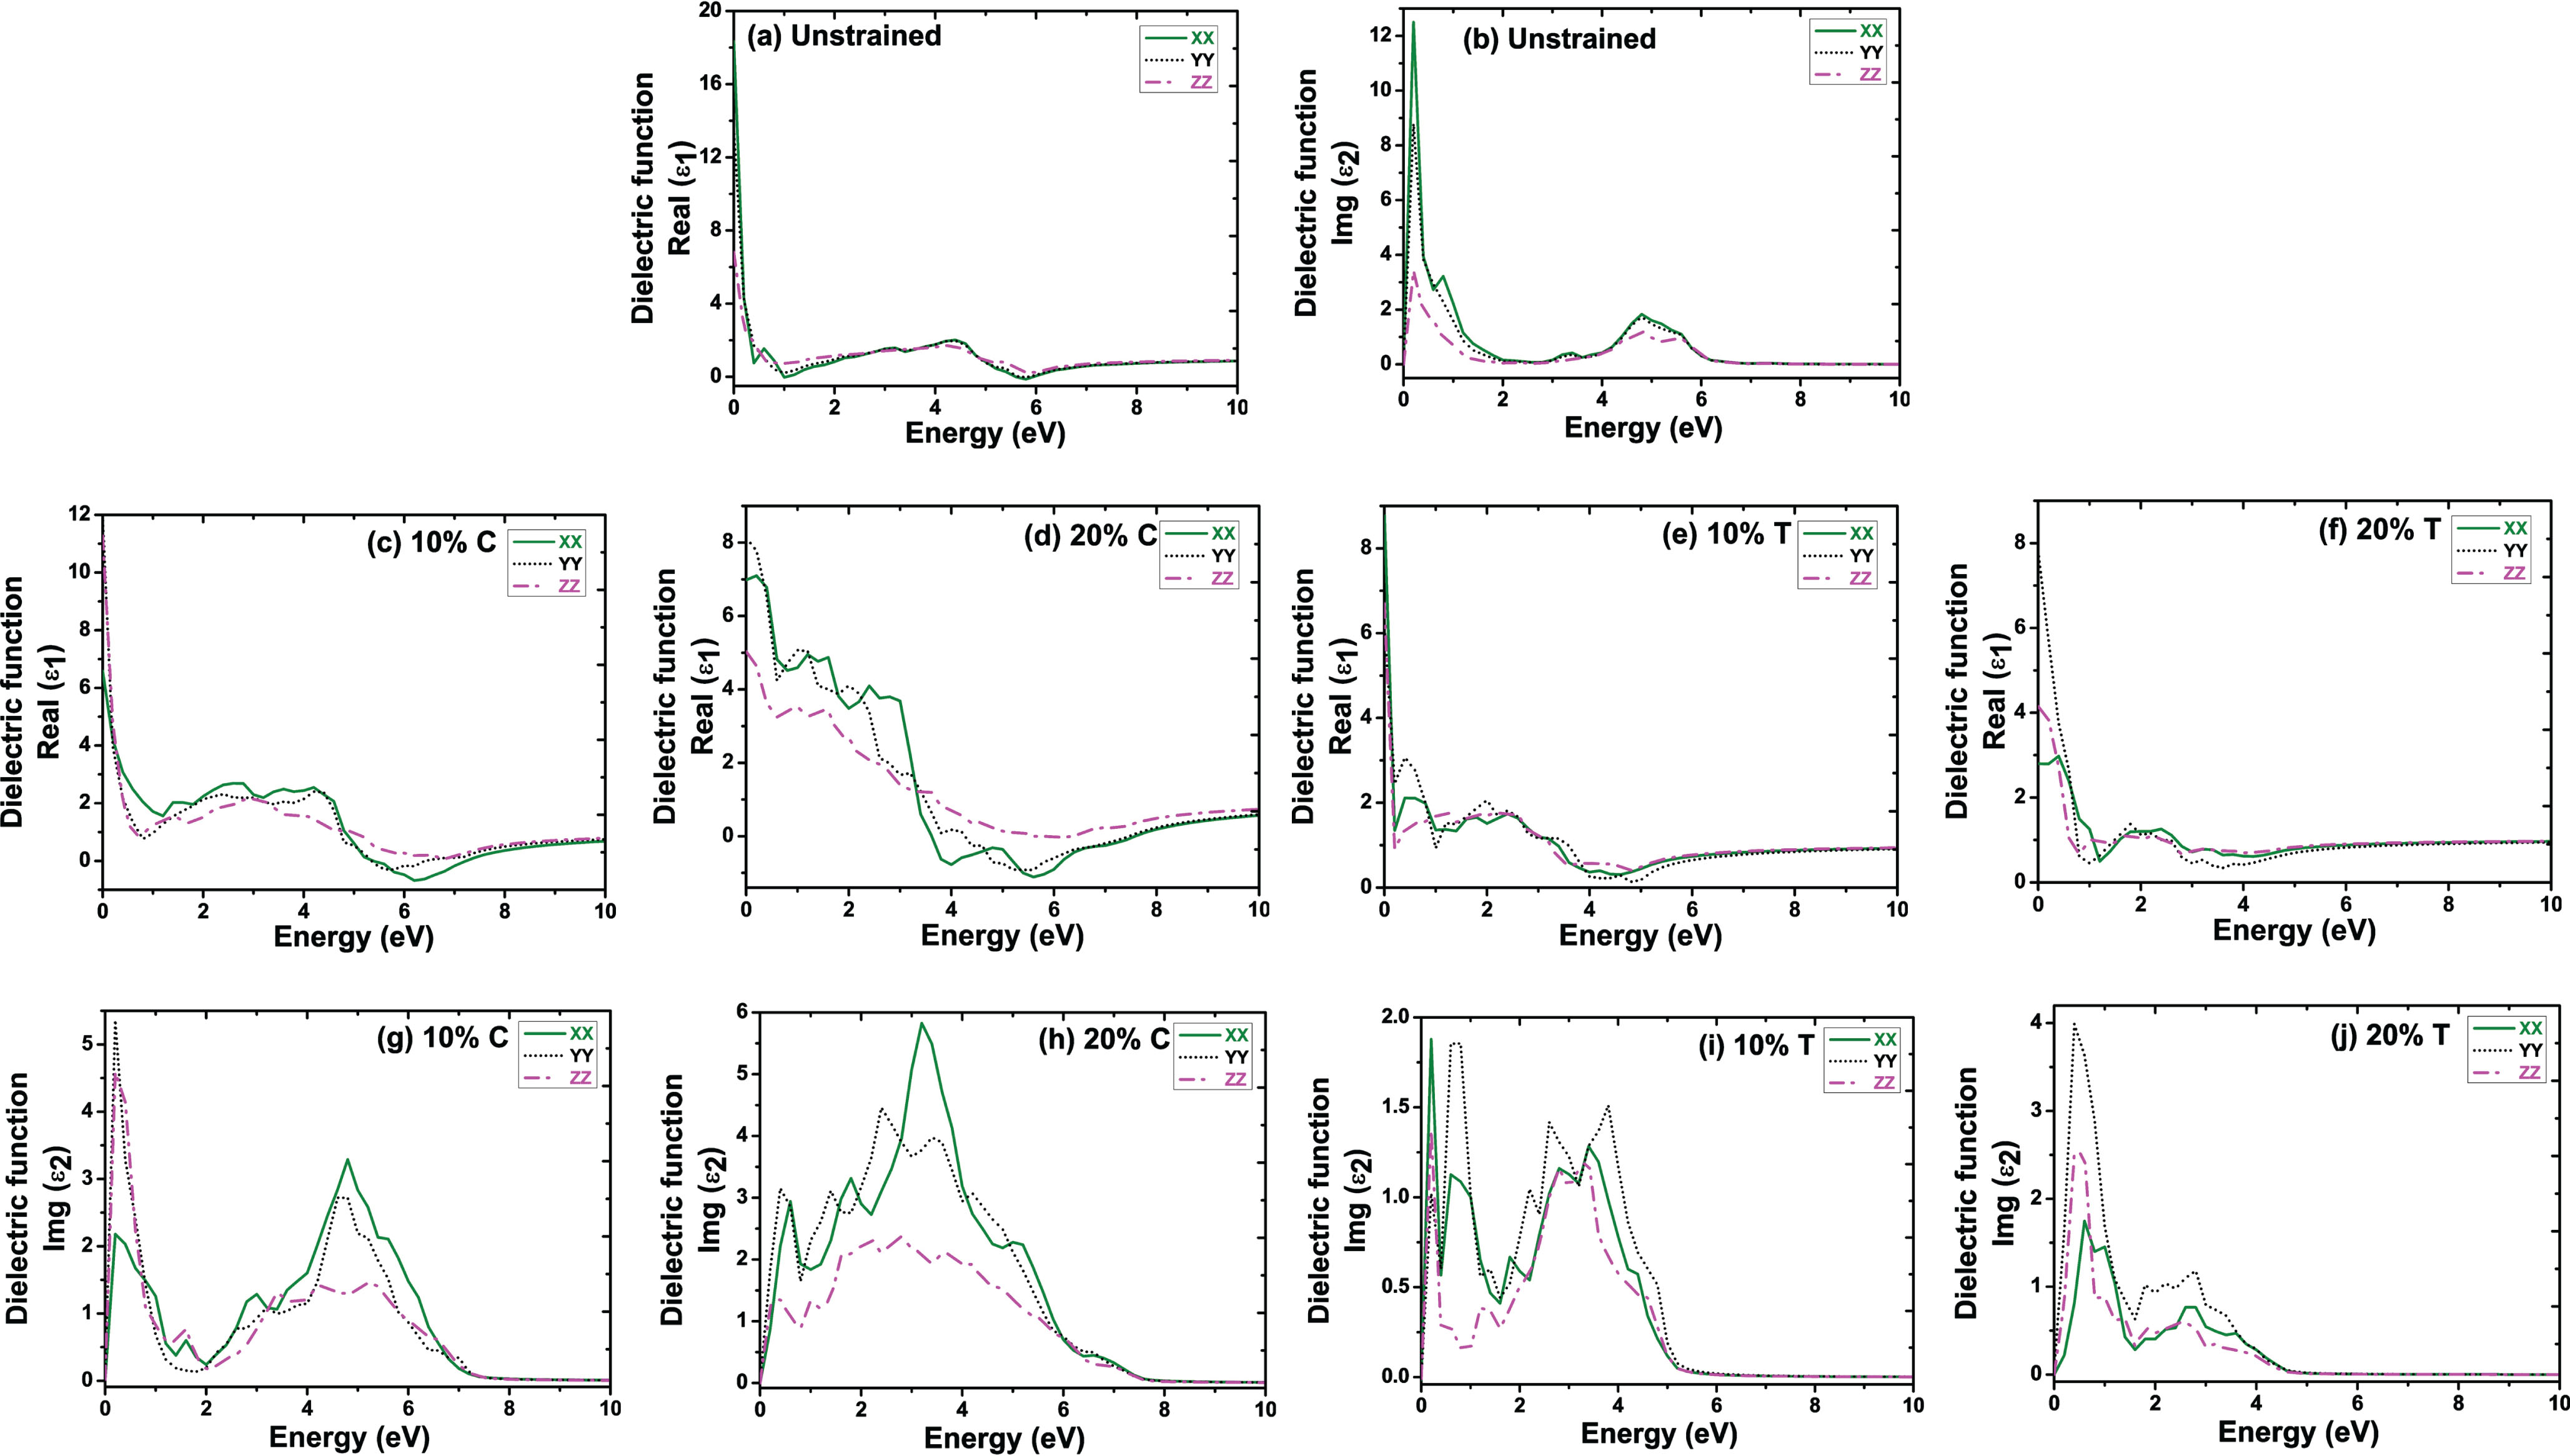
Dielectric function (energy) of unstrained and strained Fe-doped lithium niobate (T = tensile and C= compressive).
As presented in Fig. 3(b), the value of dielectric function (imaginary component) of the Fe-doped LiNbO3 has peaks around 1 eV and 4 eV. For applied strain, the highest peaks of imaginary component, are found to shift towards the lower energies. For compressive strain, the largest peak of the imaginary component of dielectric function is around 5 eV for 10% intensity and is around 3 eV for strain of 20% intensity. In the same line, for strain of the tensile type, the largest peak is around 1 eV for 10% intensity and is around 0.8 eV for strain of 20% intensity. The shift in the imaginary component of dielectric function in the lower energies is following the absorption coefficient. Further, the real component of dielectric constant is also fond shifted towards low energies because of the applied strain, which signifies the improved visible light absorption.
For Fe-doped LiNbO3 (unstrained and strained), the refractive index is illustrated in Fig. 4. The refractive index is a quantification of the velocity of EM waves as they pass through a material. The refractive index is computed from the dielectric function and its peaks depend on the absorption and dielectric function. For the strains of type tensile and compressive, the refractive index is shifted towards low energy values. This shift in the refractive index towards low energies. Which is suitable for utilization in solar cells, OLEDs, waveguides, and QLEDs. The values of refractive index (see Fig. 4) decreases at high energy and are related to the dielectric function. For strain of type tensile with an intensity of 20% the shift in the refractive index towards the lower energies is the highest, which makes sit best among all for applications in the field of solar and optoelectronic.
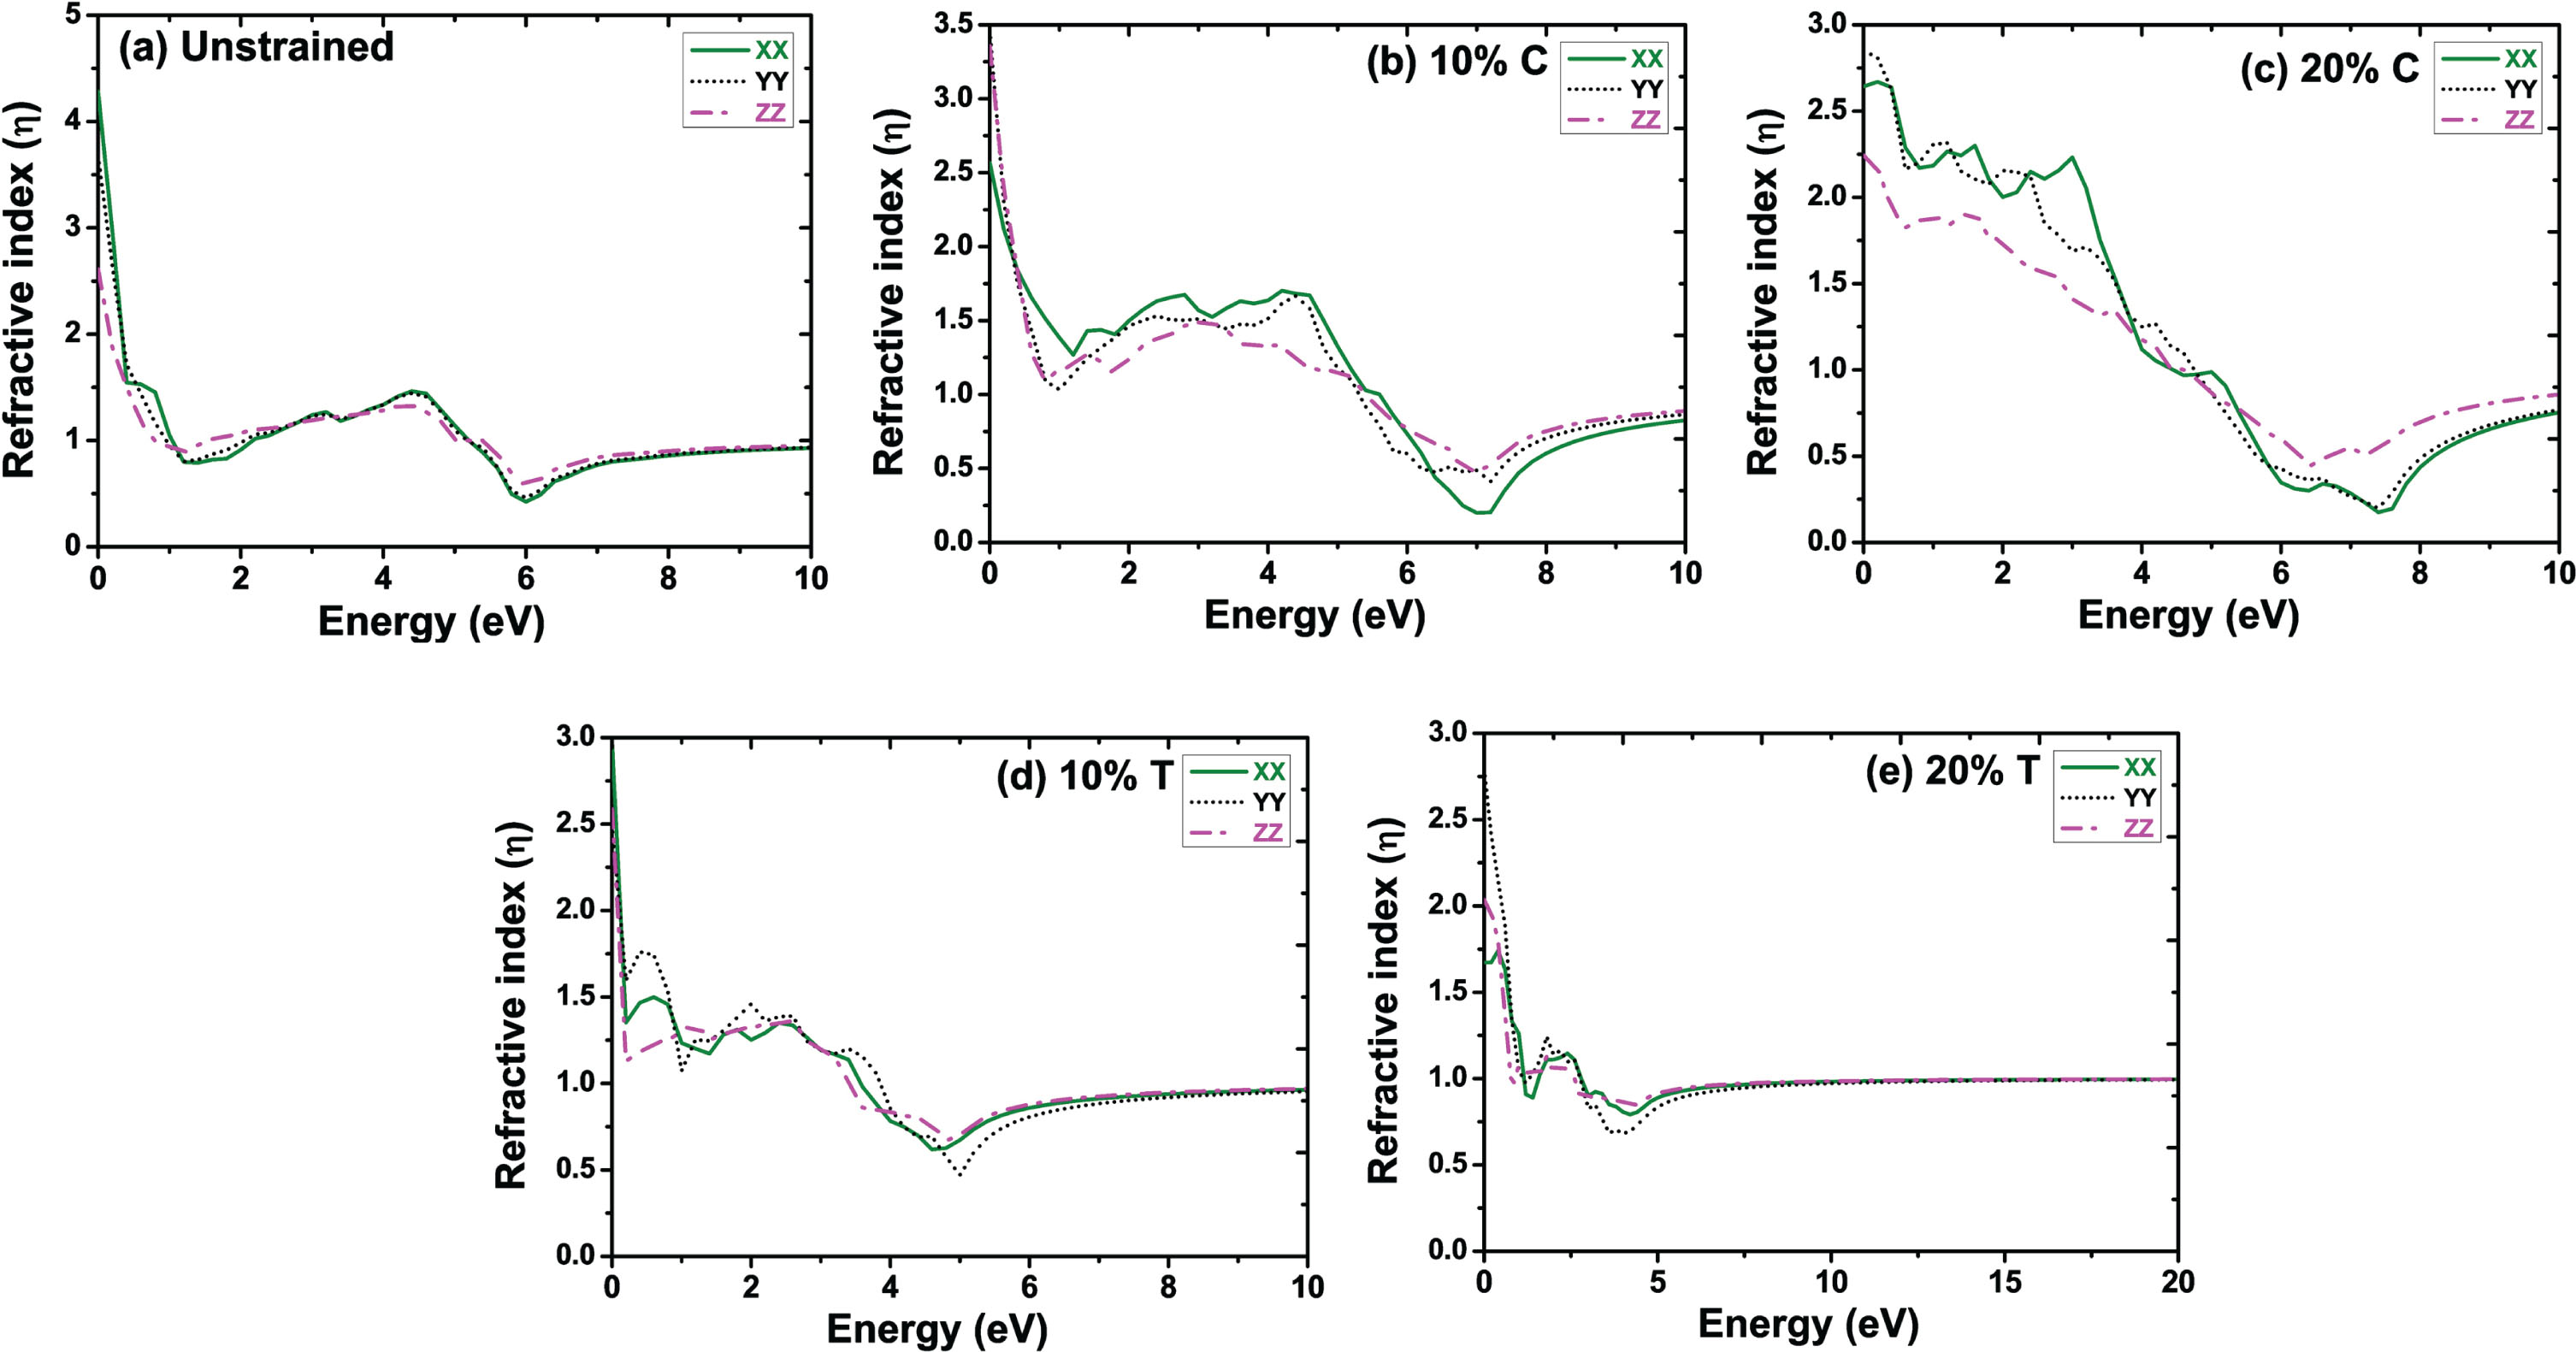
Refractive index (energy) of unstrained and strained Fe-doped lithium niobate (T = tensile and C = compressive).
The impacts of the applied strain on the various optoelectronic properties of Fe-doped lithium niobate are studied using DFT. The calculated results showed that the bandgap of Fe-doped LiNbO3 narrows down under the applied tensile and compressive strain (intensity values 10% and 20%). The absorption coefficient, dielectric function, and refractive index are computed and analyzed to examine the optical performance of strained Fe-doped LiNbO3. The computed results elucidate that the absorption of Fe-doped LiNbO3 is very low in the preferred visible region having non-zero values of absorption only from ∼600 nm to ∼800 nm. On the applied strain, the optical absorption is enhanced in the desired visible region. The shift of the absorption towards the visible range is maximum for the tensile strain of intensity 20% among all, making it suitable for solar and optoelectronics applications.