
Abstract
Art markets globally have grown, making artwork an investment of note. Precise valuation is pivotal for optimal returns. We introduce a two-step model with a two-level regressor, utilizing extreme gradient boosting (XGBoost) for accurate artwork price prediction. The model encompasses a price-class classifier and regressors for individual categories. This captures diverse factor influences, combining predictions to reduce misclassification risks. Visual features further enhance accuracy through the second-step two-level regressor. Experiments on Korean art auction data demonstrate the superiority of our two-step model with the two-level regressor over one-step and two-step alternatives, as well as the hedonic pricing model. While visual features affected one- and two-step models’ training, they boosted performance when integrated into the second-level decision tree, reducing first-level residuals. This emphasizes the two-level regressor’s efficacy in incorporating visual elements for artwork valuation. Our study highlights the potential of our approach in the field of artwork valuation.
Introduction
In recent years, the sizes of art markets have increased, and artwork has served globally as an investment option [1]. Global sales of art and antiques reached an estimated 50.1 billion USD in 2020, corresponding to a decrease of 22% compared with 2019, which may have been due to the COVID-19 pandemic [2]. However, the global art market recovered in 2021. Global sales of art and antiques reached an estimated 65.1 billion USD – up by 29% from 2020 – and surpassed the pre-pandemic level in 2019 [3]. A similar trend was observed in the Korean art auction market. The sales of art and antiques for eight Korean art auction companies reached 329.4 billion KRW1
As of March 2023, 1000 KRW was approximately 0.77 USD.
Studies on artwork appraisal or returns on art investments have been conducted for decades. In previous studies on the valuation of artwork through art price index estimation, a hedonic pricing model was generally employed to estimate the prices of artworks according to their characteristics [5, 6]. This model has been extensively applied to art markets in many countries, artworks by different artists, and art trends (e.g., Impressionism and Cubism). [7] estimated the price indices of artworks created by English, Dutch, and Italian artists using the hedonic pricing model. Another traditional approach for the valuation of artwork is the repeat sales model. This model systematically analyzes price changes over time for each work; thus, it can control the uniqueness of each artwork, in contrast to the hedonic pricing model [1]. In [8], the repeat sales model was used to obtain the price indices of artworks in the Chinese art market. In [9], a pseudo-repeat sales model was proposed to address the limitation that the repeat sales model requires transaction information about artwork sold multiple times. The pseudo-repeat sales model introduced imperfect matching to increase the sample size for model training, and it was validated using data from South African art auctions [9].
Recently, research has been conducted using machine learning techniques to estimate the prices of artworks more accurately based on the various characteristics of artworks and information related to artists and auction houses. In [10], neural networks were used to incorporate both visual and non-visual characteristics of artworks in the valuation of artworks. To extract the features from images of artworks, ResNet, which is a well-known structure for convolutional neural networks (CNNs) [11], was used, and a multilayer perceptron was employed to estimate the prices of artworks by using the extracted image features and non-visual features as inputs. In [12], a CNN was used for images of artworks, similar to [10], and the bidirectional encoder representations from transformers (BERT) model was used to extract features from the text descriptions of artworks.
Although research using machine-learning techniques to increase the predictability of art prices has been gradually increasing, few studies have been performed on machine-learning techniques for price prediction in the art market relative to the amount of research focusing on economic phenomena in the art market. In addition, neural networks have proven to be superior to other machine-learning algorithms for some applications using images and text, but their complex structures necessitate large training datasets and result in high computational costs. Moreover, according to previous studies [10], the contribution of the visual features of artworks to the estimation of art prices was limited. Therefore, a specific methodology to utilize both non-visual and visual features effectively in the price prediction of artworks should be developed for improving the predictability of art prices using machine-learning algorithms.
To address the limitations of previous studies related to predicting artwork prices in the auction market, we propose a two-step model based on extreme gradient boosting (XGBoost) that combines classification and regression models to increase the prediction accuracy for artwork prices. By building separate regression models for artwork belonging to different price classes, the proposed model can capture the different effects of various factors on the valuation of artwork depending on the price class. Moreover, the proposed two-step model combines the predicted values of all the regression models corresponding to different price classes to avoid the risk of price class misclassification, which can cause large errors in price prediction. To incorporate the image features of artwork effectively, we propose a two-level regression model that utilizes non-visual and visual features separately in each level for the second step. The performance of the proposed algorithm in predicting artwork prices in the auction market was validated based on the artworks sold in the Korean art market. In addition, we verified the effectiveness of key parts of the proposed two-step method with the two-level regressor by comparing it with other methods missing some of the key parts.
The remainder of this paper is organized as follows. Section 2 provides a comprehensive review of research on the art market. Section 3 describes the data used in this study as well as the proposed two-step model. The results of experiments that involved predicting the prices of artworks in Korean art auctions are presented in Section 4. Section 5 concludes the study and provides suggestions for future research.
Research on the art market has been conducted for many years, and it has been analyzed from different perspectives. In several studies, the returns on art investments were evaluated according to the price indices of artworks. In such research, artwork has been treated as an asset, similar to stocks and real estate. Many researchers have attempted to estimate the returns on art investments in different countries and have compared the returns with those of other assets. In [13], the price indices for pre-World War II paintings were calculated using the capital-asset pricing model, and it was found that the returns on the paintings in the United States and United Kingdom were lower than those of stocks for the same period. However, [14] reported that the annual return on art investment between 1900 and 1986 was 17.5%, which exceeded the capital appreciation of stocks, total returns on bonds, and inflation in the United Kingdom, according to the price indices computed using the repeat sales model. In [15], the returns on major paintings of various styles, e.g., Contemporary, French Impressionist, and Modern European, over the period of 1976–2001 were examined, and it was found that the returns on paintings were far lower and the risk was far higher than those of the conventional investment markets for corporate and government bonds and company stocks.
To obtain the price indices of artworks precisely for comparison with other assets in terms of returns, the repeat sales and hedonic pricing model were used as representative models [16, 17, 1], as mentioned in Section 1. The repeat sales model measures the price change of the same artwork between two periods; thus, it requires multiple transactions for the same work [18]. In addition, this model does not require the attributes of the work to obtain its price index, which is advantageous in that it makes the model easy to understand but disadvantageous in that the sample-selection bias is large and there are many unrepresentative data samples. In the hedonic pricing model, the log of the artwork price is typically explained by linear relationships with various attributes related to the artist, artwork, and market [18]. In other words, it is assumed that that the values of artworks can be determined using numerous factors, such as the size, the subject matter, the style, the reputation and nationality of the artist, whether the work contains the signature of the artist, and the auction house where the sale occurs [19, 18]. The hedonic pricing model has been applied to auction markets in several countries, such as the United States, many European countries, and China [20, 21, 22, 23].
Although research on the art market from an economic and financial perspective has been conducted for decades, the use of machine-learning techniques to estimate the price indices of artworks is relatively new. In the literature, to improve the price prediction performance while giving up some explanatory power for explaining and understanding the economic phenomena in the art market, machine-learning algorithms more complex than the traditional methods for obtaining the price indices of artworks have been utilized. One approach is to use neural networks to reflect the visual characteristics of artworks. CNNs have been widely applied to extract the image features of artwork [10, 12]. However, in [10, 12], the use of the visual characteristics of artworks failed to improve the prediction performance, and in [12], it was found that image-based prediction may not be as effective as text-based prediction. In [24], various decision tree-based ensemble algorithms, such as random forest, gradient-boosted trees, and XGBoost, were used for the price prediction of artworks in the Korean auction market. It was found that the prices predicted by the trained models were more accurate than the presale auction estimates.
Data and methodology
This section describes the data and explanatory variables and outlines the proposed methodology and experimental procedure.
Data
Korean art auction market data were collected from K-Artprice site.2
To increase the explanatory power of the prediction model for the auction sales prices of artworks, instead of introducing dummy variables for authors, we collected additional information related to different authors, such as solo or group exhibition records and award histories. Table 1 presents the explanatory non-visual variables used in this study. In addition, we extracted the visual features of individual artworks from images of artworks, and the method to extract the visual features is described in Section 3.2.2.
Description for input features
The main objective of this study was to develop an accurate prediction model for the prices of artworks in the Korean art auction market. To increase the accuracy of the predicted artwork prices, we used XGBoost, an improved ensemble algorithm based on gradient-boosted trees [25] that has exhibited good generalization performance and accuracy compared with other tree-based ensemble algorithms, such as the random forest and gradient-boosted tree algorithms [26, 27, 28]. Moreover, a study indicated that XGBoost was superior to the random forest and gradient-boosted tree techniques for the price prediction of artworks [24]. Similar to other boosting algorithms, XGBoost combines weak learners through the sequential training process of a single decision tree, and it has the advantage of avoiding overfitting owing to a regularization term in the objective function. One advantage of XGBoost, similar to other tree-based ensemble algorithms, is its ability to detect important features to estimate the target. Hence, it is possible to identify the most useful factors for predicting the price of artwork using XGBoost.
In the Korean art market, the prices of paintings are commonly evaluated according to their sizes; i.e., the price of a painting is roughly proportional to its size [29]. Therefore, in this study, we aimed to predict the prices of paintings in KRW (denoted as “unit price” herein) according to their sizes (cm2). Figure 1a presents a histogram of the unit prices of the artworks. As shown, the distribution of unit prices is highly right-skewed. To reduce the deviation in the unit prices and make the target variable normally distributed, we used the log-transformed unit prices as the targets, as follows:
where
Summary statistics for prices of artworks
The histogram of unit prices.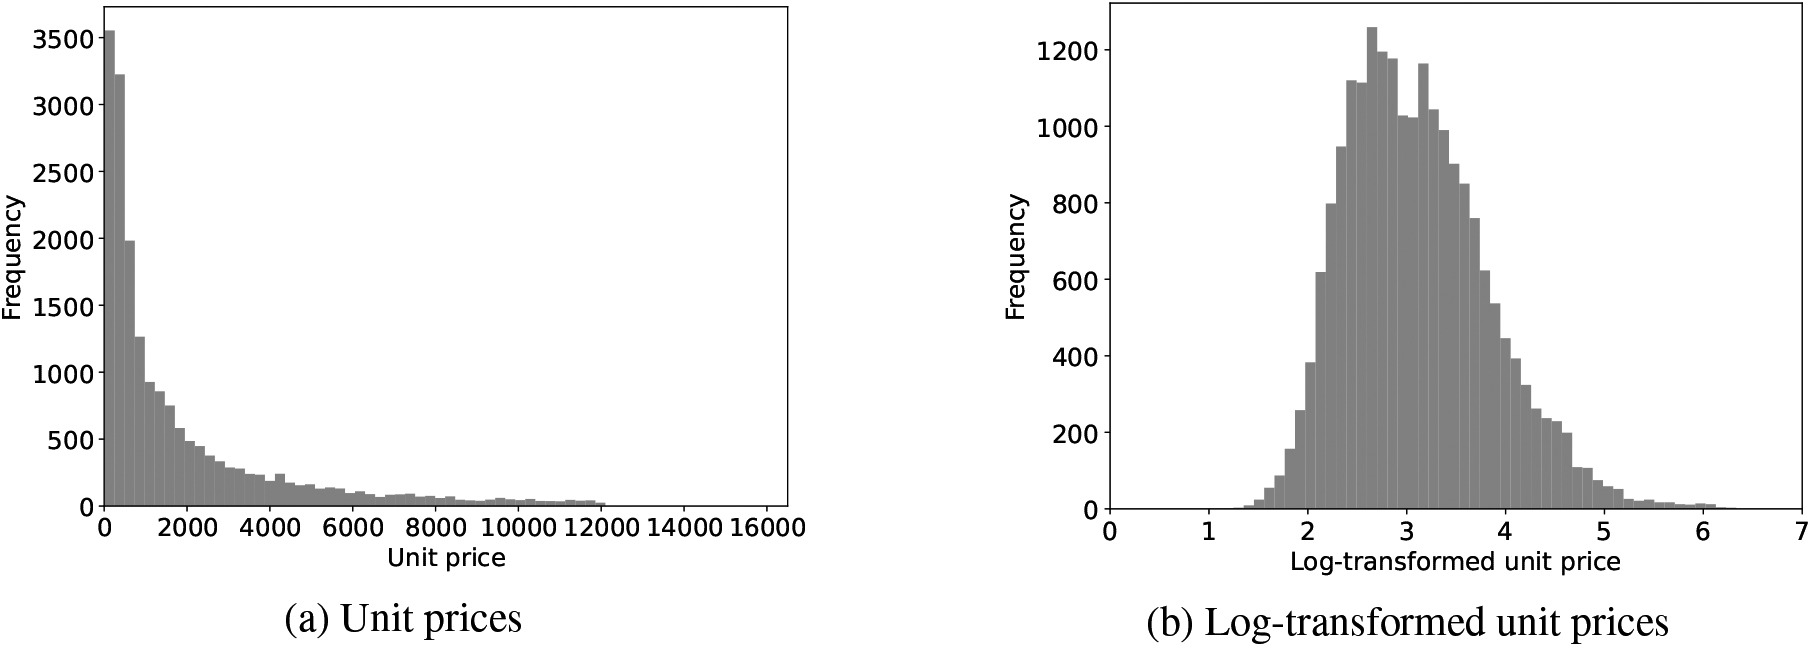
Herein, we propose a two-step prediction model for estimating the sales prices of artwork in the auction market. The model uses both classification and regression models to compute the predicted
where
Figure 2 illustrates the process of the proposed two-step model.
Proposed two-step prediction model.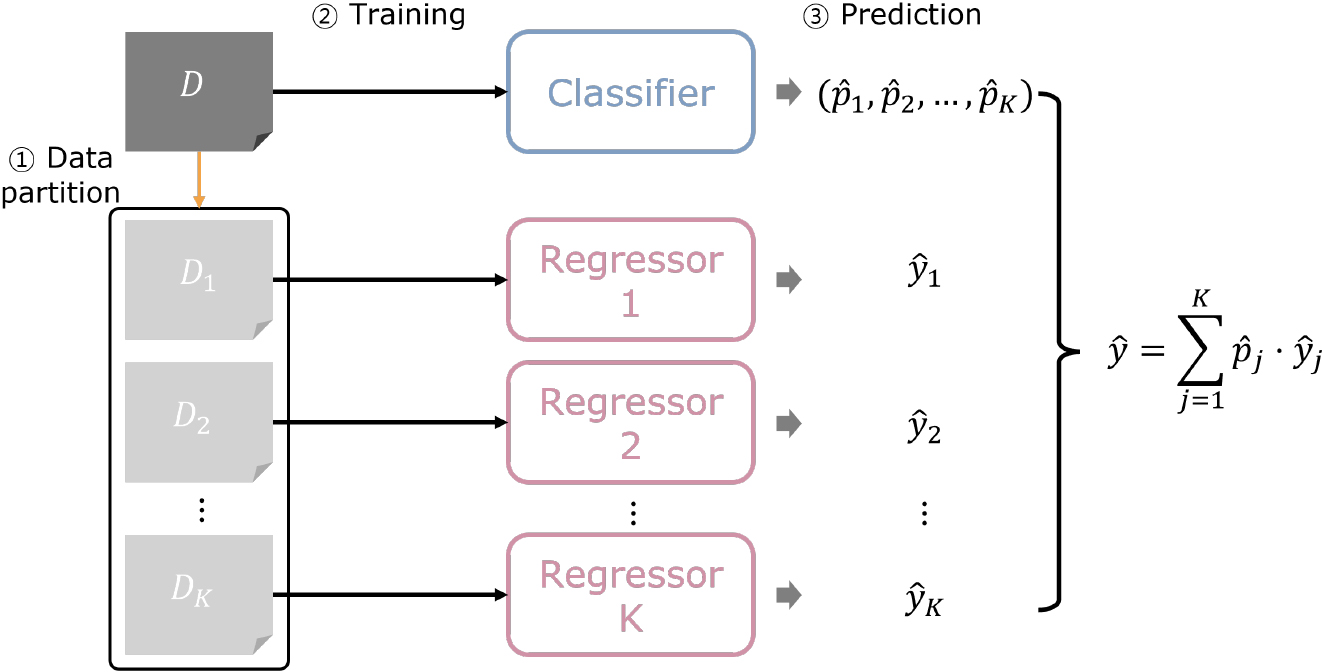
According to the results of preliminary experiments, including visual features in the classifier training degraded the classification accuracy; thus, the non-visual features were only used to build the classifier for the proposed model. A similar result was observed for the regression model as the second step of the proposed model. According to similar studies that built boosting models using image features extracted from deep learning models such as CNNs [30, 31], the accuracy of CNNs could be improved by replacing fully connected layers with tree-based boosting algorithms. Nevertheless, the reason that adding the visual features failed to improve the prediction accuracy could be that non-visual features have greater impacts on the prices of artworks than visual features, which can be supported by the results of previous studies [10, 12], which showed that the visual characteristics of artworks were not effective for estimating their prices. Additionally, if non-visual and visual features are simultaneously used in a decision tree model, only a few of the visual features may be selected, which lower the generalization performance of XGBoost.
Two-level XGBoost regressor in the proposed two-step model.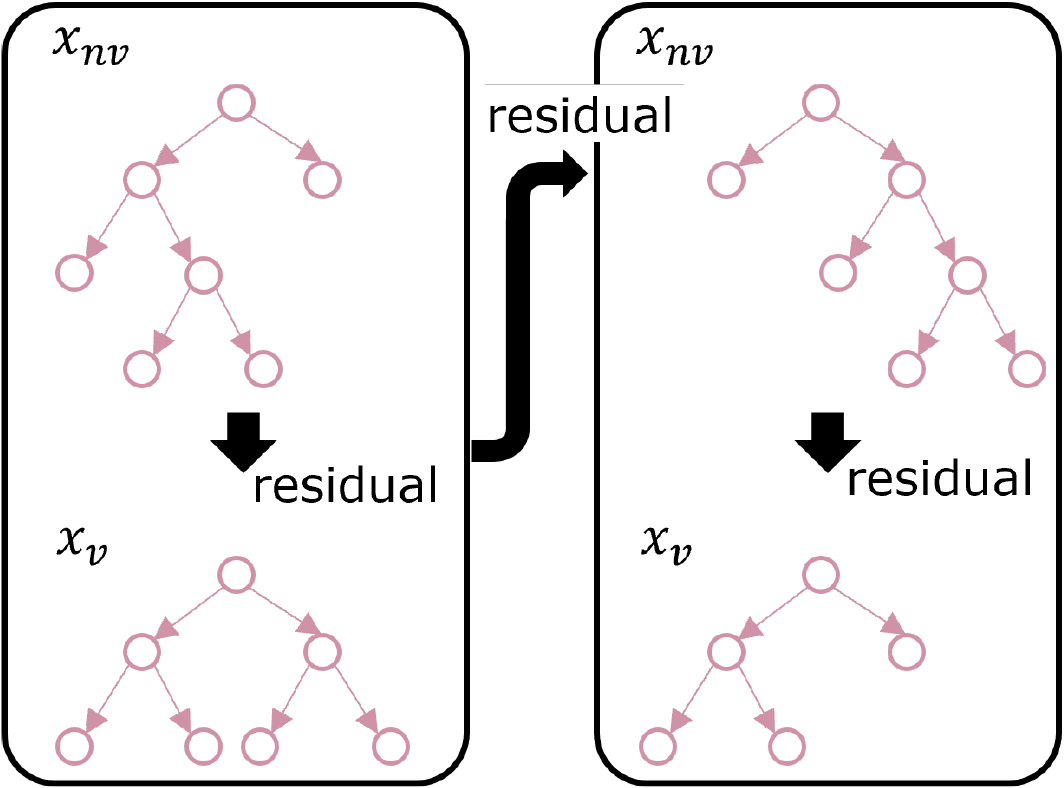
Hence, we propose a two-level XGboost regressor for the two-step model. Figure 3 illustrates the key concept of the proposed regressor. In this figure, “
where
where
In this study, we decided to leverage a pre-trained image model for feature extraction, because the number of images was approximately 20,000, which may be not sufficient to train an accurate image model for feature extraction. This study utilized Very Deep Convolutional Networks for Large-Scale Image Recognition (VGG-16), one of the most popular pre-trained models for image classification tasks [32]. VGG-16 was developed for image classification, which was not the goal of this study. Hence, we conducted fine-tuning of the pre-trained model for the price prediction task. The target variable for fine-tuning was set as the log-transformed price, which is the same as the target variable of the proposed two-step prediction model.
Fine-tuning of the VGG-16.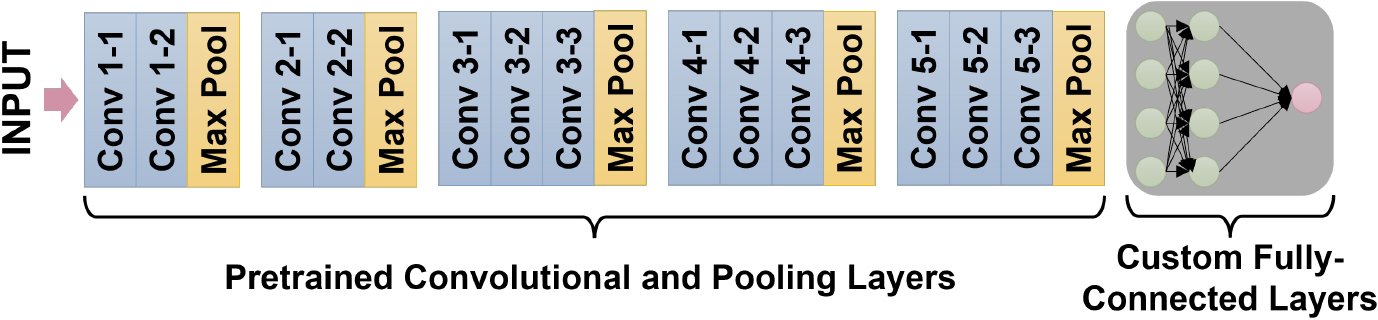
Figure 4 shows the architecture of the VGG-16 for fine-tuning. For fine-tuning, the pre-trained convolutional and pooling layers were frozen and the fully connected layers were re-trained. We added two dense fully connected layers before a output layer. The first and second dense layers had 4,096 and 1,024 nodes, respectively, which was the best condition we tested for this study. In addition, the rectified linear unit as an activation function. No activation function was applied for the output layer with 1 node.
For the proposed two-step prediction model, we defined the price range for each price class for the classifier target. Considering the distributions of the log-transformed unit prices shown in Fig. 1b, we divided the log-transformed unit price values into four different price classes: (1) PC1:
The number of samples for each price class
The number of samples for each price class
We compared the proposed two-step with the two-level regressor model by utilizing the following four machine-learning approaches:
One-step model (M1): One regression model was trained using XGBoost with all samples. Hard two-step model without the two-level regressor (MH2): The target price was estimated by the regressor of the estimated price class according to the classifier of the proposed model, instead of Eq. (2), and the regressor for each price classes was a typical XGBoost model. Soft two-step model without the two-level regressor (MS2): The target price was estimated using Eq. (2), but regression models corresponding to individual price classes were trained using the typical XGBoost approach. Hard two-step model with the two-level regressor (MH2-2LR): The classifiers and regressors were trained to build the two-step model like in the proposed method, but the target price was estimated by the regressor of the estimated price class according to the classifier of the proposed model, instead of Eq. (2).
The key difference between the hard and soft two-step models was the prediction step. To reduce the prediction errors raised by the classification of the price classes, we proposed the ensemble prediction method, the weighted average of the predicted values of all regressors using the probabilities of the price classes estimated by the classifier. The soft two-step model was the model employed to calculate the predicted target values using the ensemble prediction method, whereas the hard two-step model predicted the target values using only one regressor and determined the regressor for prediction using the classifier. For both hard and soft two-step models without the two-level regressor, the regressor model was trained using the typical XGBoost that learns a single decision tree at each iteration.
To verify the impacts of the visual features on artworks pricing in the auction market, we trained the models using different training sets with and without the visual features for the three comparison methods. Similar to the two-step models without the two-level regressor, the predicted target values were also in the hard approach for the proposed two-step model with the two-level regressor, instead of using Eq. (2). In addition to the XGBoost-based models, we compared the proposed model with the hedonic pricing model.
We used three different evaluation metrics: the root-mean-square error (RMSE), mean absolute error (MAE), and mean absolute percentage error (MAPE), which are defined as follows:
where
Regardless of the type of learning (classification or regression), we set the number of base estimators to 100 and the learning rate to 0.1 for XGBoost. The maximum depth of the base estimators was determined by a grid search through 10-fold cross-validation based on the training sets from
Prediction performance
Table 4 presents the evaluation results for different models based on 10-fold cross-validation. Here, HP and M1 denote the hedonic pricing and one-step models, respectively, and MH2 and MS2 denote the hard and soft two-step models without the two-level regressor, respectively. The proposed two-step models with the two-level regressor are denoted as either MH2-2LR or Prop, depending on whether the class probability values are used to predict the target. MH2-2LR estimated the prices of artworks using the two-level regressor of the estimated price class according to the classifier in the proposed model, whereas Prop estimated the prices of artworks by combining the predicted values of all the two-level regressors using Eq. (2). In addition, “NV” and “NV
Evaluation results
Evaluation results
Regardless of the evaluation metric and price class, the proposed two-step model with the two-level regressor using the ensemble prediction method (Prop) outperformed the one- and two-step models without the two-level regressor. However, the difference between MS2 based on the non-visual features and Prop is smaller than that between MS2 using the non-visual features only and MS2 using the non-visual and visual features together. From this result, it can be inferred that the visual features had a marginal impact on artwork pricing in the auction market. Moreover, MH2-2LR showed slightly better performance than MH2 based on the non-visual features only, which implies that the two-level regressor was effective in improving the prediction accuracy of the regressors. In other words, the image features helped slightly reduce the prediction errors computed by the predicted target values obtained using the non-visual features. The limited contribution of the visual features to the price prediction is the opposite of that of the visual features based on deep learning techniques such as CNNs, which have been successfully used to classify the styles of artworks and determine artists [33, 34, 35]. The degradation caused by adding visual features in this study may be because the artworks used in this study consisted only of modern works in South Korea, which are typically far from masterpieces with distinct artistic styles.
In general, the hedonic pricing model exhibited the worst performance for all the evaluation metrics. In particular, the MAPEs of the hedonic pricing model were almost twice those of the proposed two-step model with the two-level regressor (Prop) for all price classes. Moreover, the one-step models generally achieved smaller RMSEs, MAEs, and MAPEs than the hard two-step model without the two-level regressor when the same feature set was used. This difference may exist because the hard two-step model predicted the target values with relatively large errors for the misclassified samples in terms of price classes. In contrast, the soft two-step model without the two-level regressor utilized all the regressors in the prediction, which may have reduced the risk of misclassification. In terms of the feature set, including the visual features, the prediction performance was generally degraded regardless of the model. When the visual features were used to train the models in addition to the non-visual features, the soft two-step model without the two-level regressor showed worse performance than the hard two-step model without the two-level regressor, because the classification accuracy decreased when both non-visual and visual features were used.
Table 5 presents the classification accuracy of the classifier in the two-step model depending on the feature set. Overall, the classification accuracy for all the samples was close to 80% when only non-visual features were used. However, the classification accuracy for all the samples decreased to approximately 65% when the visual features were used in addition to the feature set with non-visual features. This result implies that the visual features are useless for discriminating the price classes of artworks. Although PC1 and PC4 had fewer samples than PC2 and PC3, the classification accuracies for PC1 and PC4 were higher than those for PC2 and PC3. This result implies that inexpensive and expensive artworks per unit area have relatively distinct characteristics compared with other artworks.
Classification accuracy
Ideal performance of the hard two-step model with and without the two-level regressor
Feature importance: Classification.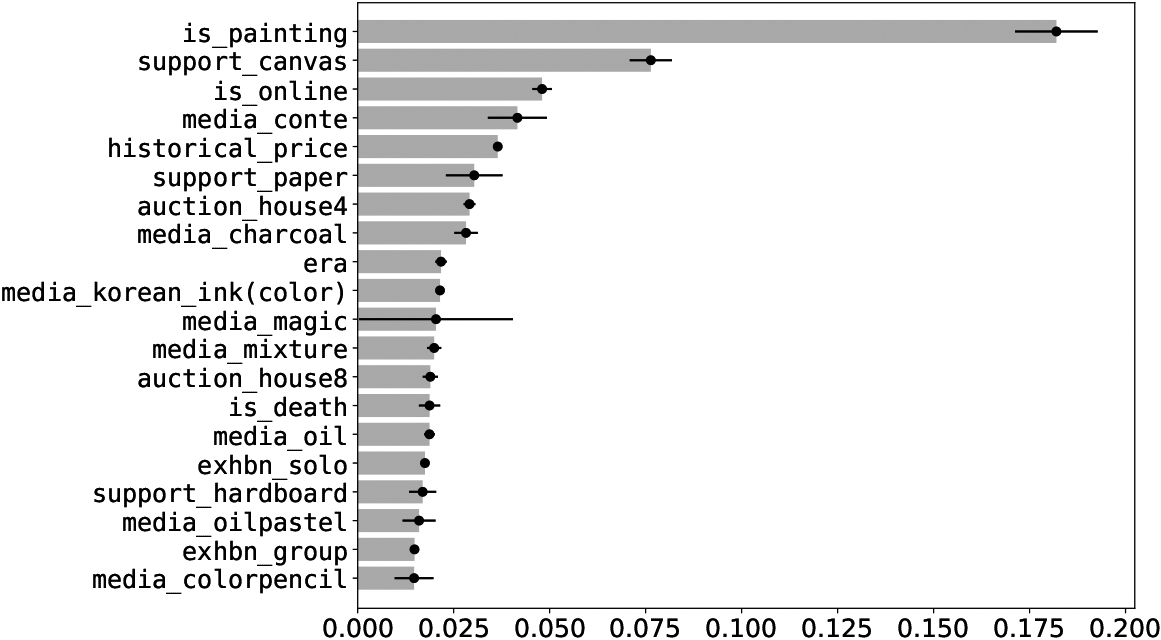
Feature importance: Regression.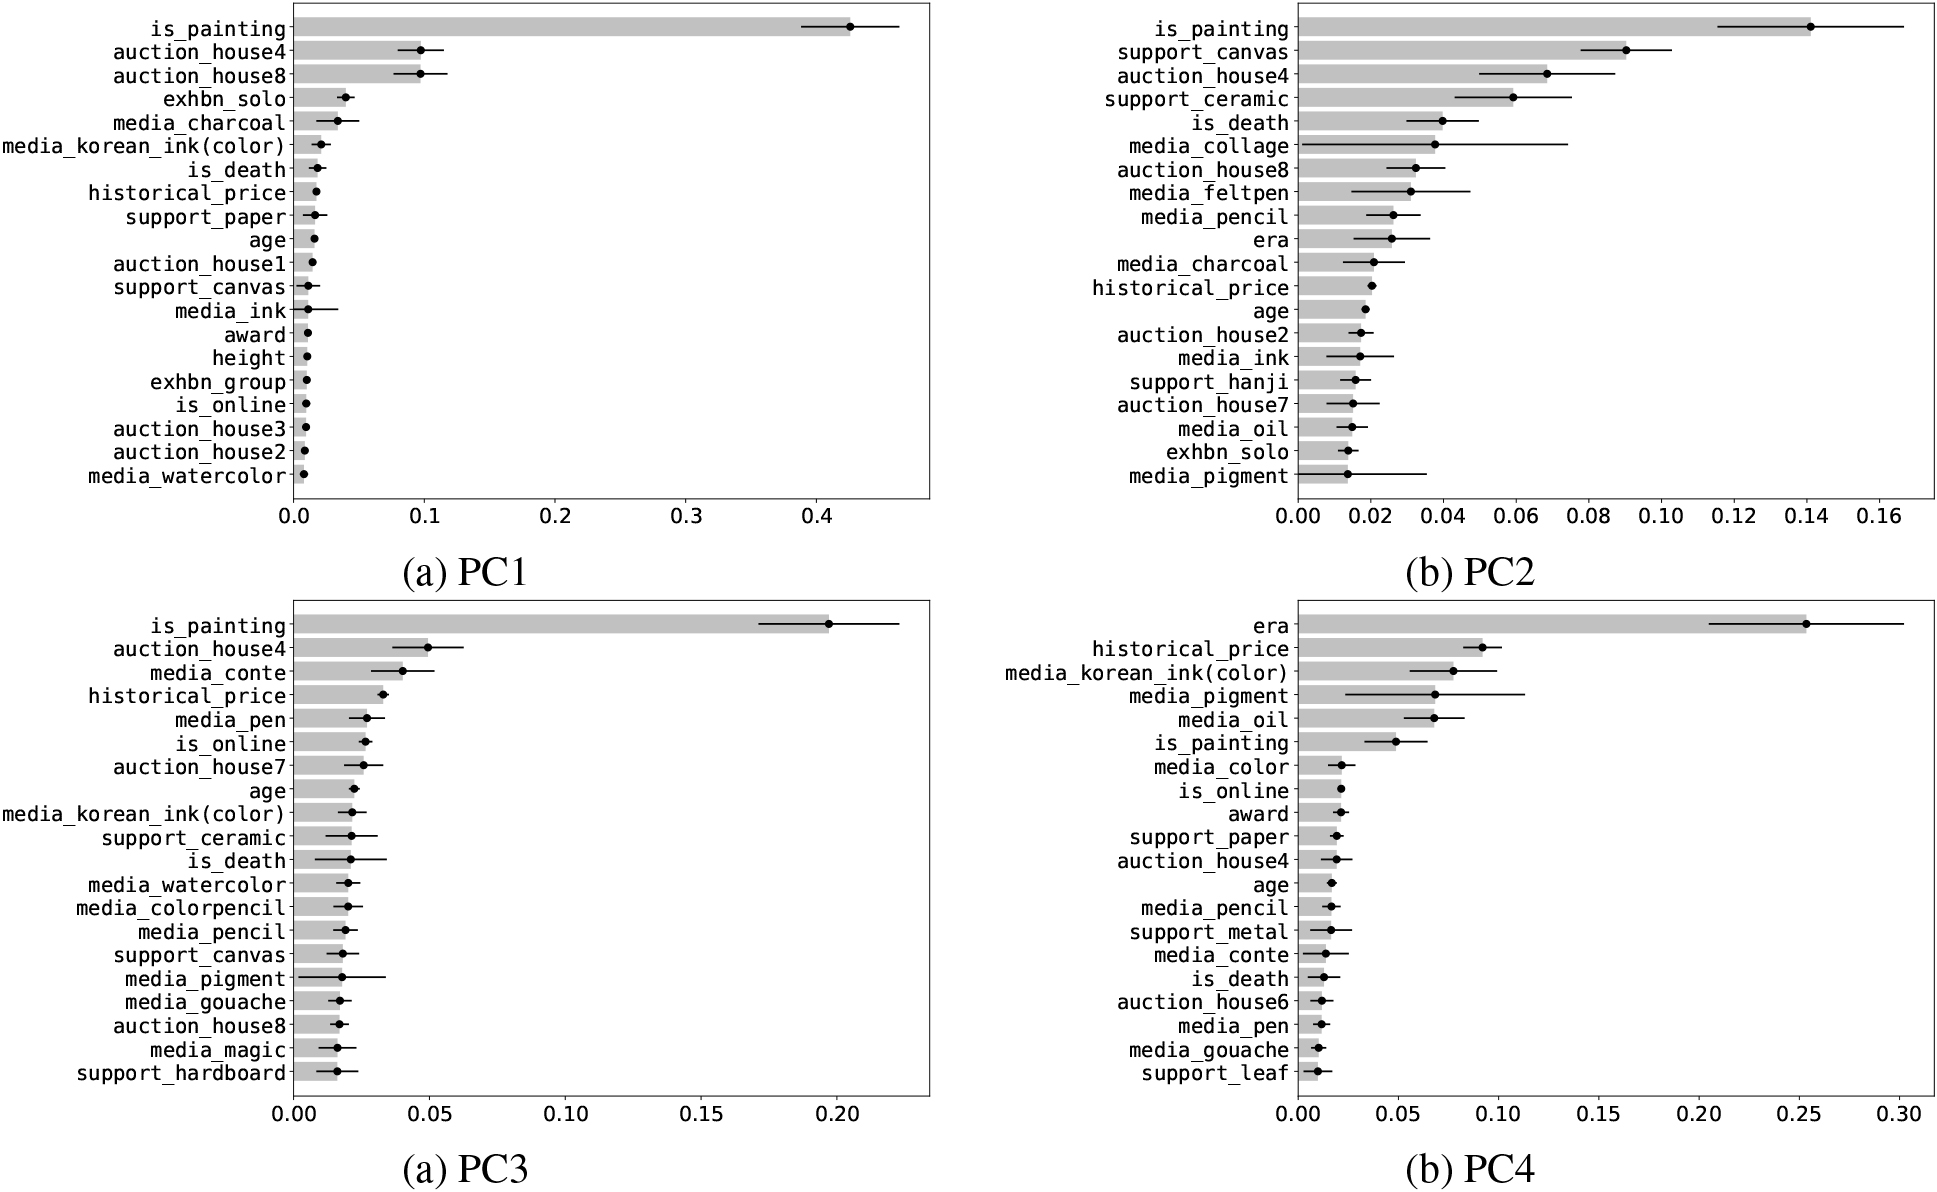
To determine whether the classification performance affected the prediction performance, we evaluated the ideal performance of the hard two-step models. In contrast to the hard two-step models, the regressor for estimating the target value of the specific artwork was determined by the real price class of the artwork to measure the ideal performance; i.e., the target was predicted by the regressor for PC1 if the artwork belonged to PC1. The ideal performance of the hard two-step model is presented in Table 6.
As shown in Table 6, the ideal performance was far better than the performance of the hard and soft two-step models. The difference in the ideal performance between MH2 using the non-visual features and MH2-2LR is slightly smaller than the difference between MS2 using the non-visual features and Prop. This result implies that if the exact price class of an artwork can be determined, the visual features become less effective for determining the prices of artworks. Similar to the results shown in Table 4, adding the visual features into a training set for MH2 degraded the prediction performance. Therefore, training regressors using the non-visual and visual features simultaneously does not help improve the prediction performance.
Furthermore, we evaluated the feature importance of the classifiers and regressors in the proposed two-step model with the two-level regressor for the non-visual features. The feature importance of the classifier indicates what factors affect the price classes of artworks, as well as what factors determine the prices of artworks in different price classes.
Figure 5 shows the feature importance of the top 20 features for the classifier, and Fig. 6 presents the feature importance of the top 20 features for individual first-level regressors corresponding to different price classes. Except for the regressor for PC4, the variable that indicates whether the artwork is a painting (is_painting) is the most important feature. The data demonstrate that the prices of prints are generally lower than those of paintings. For prints, approximately 43.7% of artworks are in PC1, whereas for paintings, only 13.5% of artworks are in PC1. This difference may exist because prints can have several copies, in contrast to paintings. Whether the auction is an online auction is also an important feature for classifying the price classes and prices of artworks. The results indicate that artworks sold in online auctions are typically less expensive than those sold in offline auctions. Another result observed in Fig. 6 is that historical_price is more important for PC3 and PC4 than for PC1 and PC2. It is the second-most important feature for PC4 and the third-most important feature for PC3. The historical prices of artworks in PC3 and PC4 – particularly PC4 – are higher than those of artworks in PC1 and P2. This result implies that artworks created by artists whose previous works are regarded as highly valuable can be sold at high prices.
Conclusion
In recent years, interest in the art market has increased. However, research on the use of machine-learning techniques for the valuation of artworks has been scarce. To address this research gap, we developed a two-step model with a two-level regressor based on XGBoost for accurately predicting the prices of artworks in the auction market. The main underlying assumption of the proposed model is that the value-determining characteristics of artworks may differ depending on the price class. To apply this assumption in price prediction, the proposed model builds a classifier to classify artworks into price classes and the regressors corresponding to the different price classes and then calculates the prices of the artworks by combining the predicted values of all the regressors. Additionally, to incorporate the visual features of artworks into the price prediction effectively, we proposed a two-level XGBoost regressor, considering previous studies showing that the contributions of the visual features of artworks to the estimation of art prices are limited.
The proposed two-step model with the two-level regressor was validated using data for artworks in the Korean auction market between January 2016 and June 2021. To validate the effectiveness of the two-step approach, we compared the proposed algorithm with the one-step model. In addition, the effect of the two-level regressor in the proposed model was verified by comparing it with the two-step model without the two-level regressor. For the comparison methods, such as the one-step model and two-step model without the two-level regressor, we tested two different feature sets depending on whether the visual features were included. The experimental results indicate that the proposed two-step model with the two-level regressor outperformed the other methods and that the XGBoost-based models were more accurate than the hedonic pricing model, which implies that the hedonic pricing model is unsuitable for the accurate valuation of artworks. The ensemble prediction method was effective in improving the prediction accuracy. The ideal performance of the hard two-step model implies that the proposed two-step model can be enhanced by increasing the accuracy of the classifier. However, it was observed that even though the artwork price classification is not perfect, the risk of misclassification may be alleviated through the ensemble prediction method. Interestingly, including the visual features for model training degraded the prediction performance for both the one- and two-step models. Nevertheless, the evaluation results based on the proposed two-step model with the two-level regressor showed that the visual features could be utilized to reduce the prediction errors further.
The proposed method offers several advantages. Firstly, by leveraging XGBoost, it can effectively capture nonlinear relationships between different factors related to artworks and their corresponding prices. This enhances the model’s ability to grasp complex interactions between these factors and artwork prices. Secondly, the method enables the identification of significant factors that strongly influence artwork prices, providing valuable insights for both researchers and market participants. Lastly, the approach of building separate regression models for distinct price classes allows for a nuanced understanding of how diverse factors impact prices across different segments of the art market. This flexibility in modeling contributes to a more accurate and adaptable valuation framework. However, this method also has its limitations. Firstly, the visual features were obtained from a model trained for image recognition, making it challenging to precisely capture the relationship between visual features and prices. Furthermore, the implementation of a single classifier and multiple regressors per price class in the proposed two-step model introduces a higher computational overhead compared to the one-step model.
This study has some limitations. Firstly, we exclusively validated the proposed two-step model using XGBoost, though the classifier and regressors within the model could potentially be implemented with various machine-learning algorithms. Consequently, evaluating the proposed model with alternative machine-learning techniques is warranted to enhance model accuracy. Moreover, such research will ascertain the reliability of the proposed two-step prediction framework in boosting prediction performance across different machine learning algorithms, compared to the one-step model. Secondly, the effectiveness of the proposed model might be influenced by how the price range is segmented into price classes. Thus, identifying the optimal division of price ranges is essential. Thirdly, our study omitted the integration of textual descriptions or critical reviews of artworks. In subsequent research, we plan to gather textual data relevant to artworks and employ deep-learning models like BERT to extract textual features, assessing whether such features enhance artwork valuation precision. Lastly, we selected VGG-16 from several pre-trained image models to extract visual features from artworks. Hence, alternative image models could potentially yield superior visual features. A comparative analysis of the proposed model’s performance based on the image model used for feature extraction will be undertaken.
Footnotes
Acknowledgments
This work was supported by the National Research Foundation of Korea (NRF) grant funded by the Korea government (MSIT) (No. RS-2023-00239374).