
Abstract
BACKGROUND:
The U.S. Vocational Rehabilitation (VR) program helps people with disabilities gain or improve employment. However, previous research into program outcomes has primarily focused on subsets of participants with specific diagnoses instead of the full population.
OBJECTIVE:
We chronicled the population’s personal characteristics, services received, and program outcomes to inform hypotheses about relationships between personal characteristics, services, and program outcomes.
METHODS:
These characteristics were analyzed for all 572,490 adult cases that closed between 2017 and 2018. Descriptive statistical distributions compare the applicants with their two subgroups: participants and non-participants.
RESULTS:
Seven of the 20 primary impairment categories encompassed 78%of applicants. Sixty-three percent of applicants completed an individualized plan for employment (IPE) and became participants. Eighty-five percent of participants and 43%of non-participants received VR services. Half of VR participants exited unemployed and 44%achieved competitive integrated employment (CIE). Two-thirds of non-participants exited before developing their IPE mostly because they either lost interest in VR or VR lost the ability to talk to them.
CONCLUSION:
The results describe variables that can potentially affect program enrollment and program outcomes. Future work assessing VR should consider these variables when evaluating services that are most impactful to exiting employment.
Introduction
Chronicling and describing the distribution of the United States Vocational Rehabilitation population of applicants, participants, and non-participants related to their demographics, personal characteristics, receipt of program services, and program outcomes is important for future research. It allows for informed, purposeful selection of variables in predictive modeling, identifies target subpopulations where deeper investigation would be fruitful, and identifies weaknesses in the public dataset.
Background on vocational rehabilitation program
People with disabilities in the United States who are unemployed, underemployed, or at risk of losing employment may access the Vocational Rehabilitation (VR) program, which is jointly-funded by the federal government and by the states and territories. The process begins when a person with a disability applies, hereby defining them as an applicant and a non-participant. An applicant is accepted if they have a verified disability impeding employment who requires VR services to prepare for, secure, retain, advance in, or regain employment that is consistent with their unique strengths, resources, priorities, concerns, abilities, capabilities, interests, and informed choice ( State Vocational Rehabilitation Program, Assessment for Determining Eligibility and Priority for Services, 2021). If the program lacks resources to serve the eligible applicant, they may be placed on an order of selection (OOS) waiting list (this applies to approximately half the programs). The criteria associated with placement on the list varies from program to program, however people with significant disability are always served with higher priority than people with non-significant disability.
Once accepted (or admitted from the OOS waiting list into the program), the applicant works with their Vocational Rehabilitation Counselor (VRC). Together, they develop an individualized plan for employment (IPE) which includes the employment goal, services needed to attain it, providers of these services (and who is fiscally responsible for them), plan for progress evaluation, and the specific responsibilities of the participant and counselor. Upon signing this first IPE, the non-participant applicant transitions into what we define as a participant. Note, this is different from the United States Department of Education’s Rehabilitation Services Administration’s definition 1 This plan is amended as necessary. The employment goal must be an employment outcome to enter, advance, or retain employment in alignment with the individual’s unique strengths, resources, priorities, concerns, abilities, capabilities, interests, and informed choice. It may be either a type of competitive integrated employment (CIE) or supported employment. CIE is any employment where compensation, job duties, and the environment are the same for the person with disability as they are for people without disability. This includes self-employment, customized employment, telecommuting, and business ownership. Supported employment is for someone who either historically has not had CIE or had CIE on an intermittent basis due to the severity of their disability. Individuals have supported employment if they have CIE that is individualized and customized for their unique strengths, abilities, interests, and informed choice including the provision of ongoing support services (or if they work in an integrated environment, without competitive compensation, for a short-term basis while working towards CIE). It is expected they will need these ongoing services after they transition out of the VR and state-supported employment programs. (State Vocational Rehabilitation Services Program, Applicable Definitions, 2021, paras. 9, 53).
Thirty-one services are available to adult VR participants. These fall into three categories—12 education and training services (e.g., college and university training, technical education, apprenticeship training), 11 career services (e.g., assessments, job placement, short-term job supports), and eight other services (e.g., transportation, rehabilitation technology, maintenance) ( Rehabilitation Services Administration, 2017). Participants are successfully rehabilitated when they maintain employment aligning with their IPE goal for 90 consecutive days concluding with exit from the program. A case could also close if the participant is unable to continue to work towards getting a job. A conceptual timeline of the VR process is presented in Figure 1.
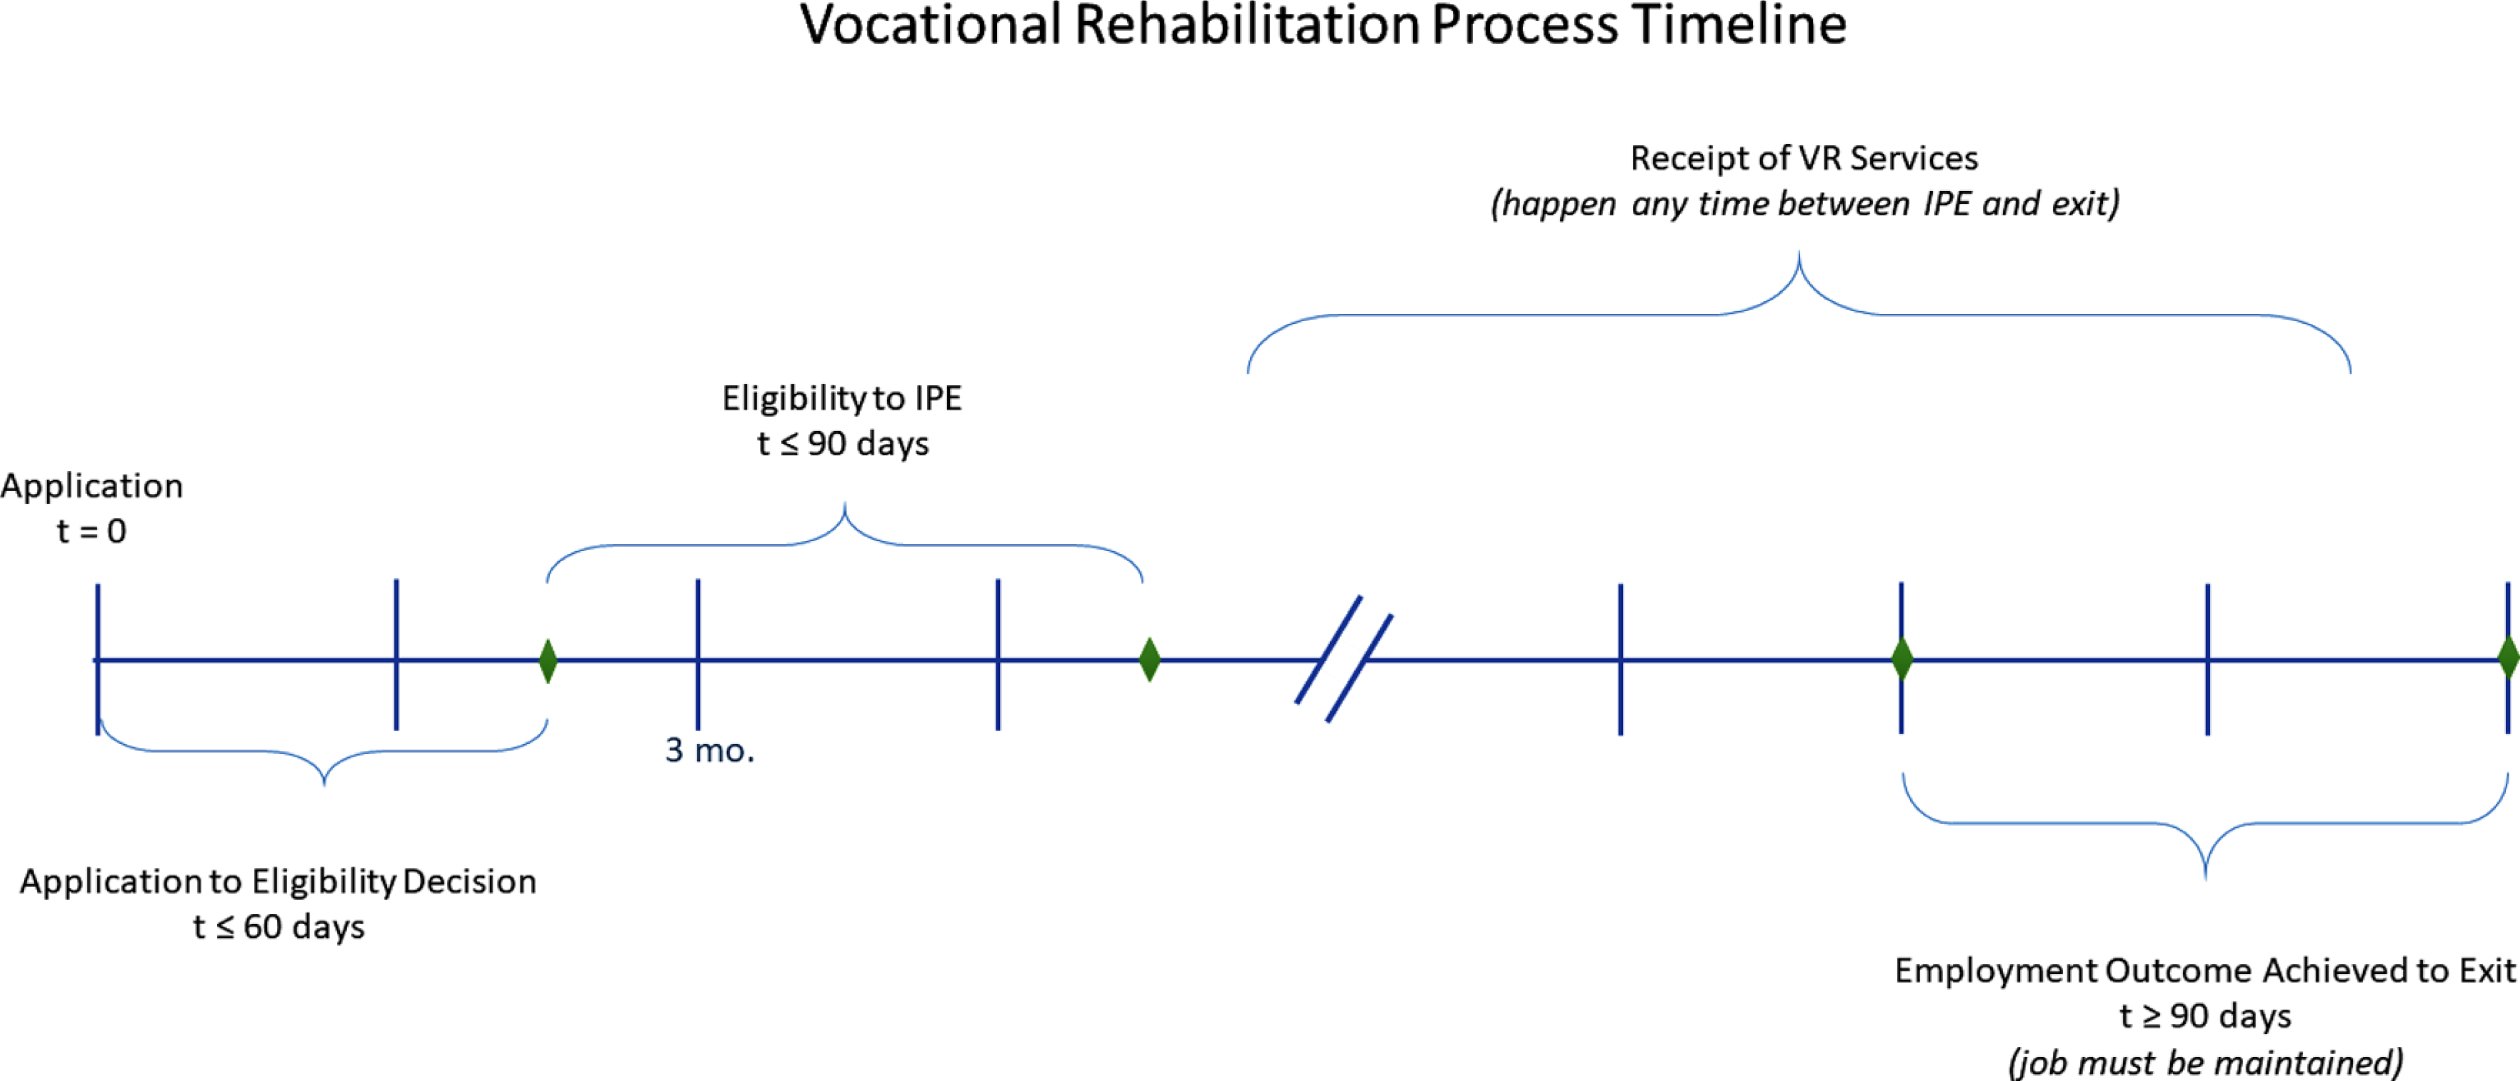
Conceptual timeline of the VR process with process milestones and achievement time benchmarks. VR has established goals for quality assurance, including a maximum time between application and eligibility (60 days) and between eligibility and development of the initial IPE (90 days). Employment must be maintained for at least 90 days prior to exit and VR services can be provided any time between the IPE and exit.
Previous research has investigated specific diagnoses or impairment groups within the VR population. Investigations have considered race, ethnicity, age, and employment status at the time of application and how they were associated with exiting VR with CIE ( Ahonle et al., 2019; Dutta et al., 2008; Glynn & Schaller, 2017; Lee et al., 2020; Sung et al., 2014; Ufere et al., 2019). However, most of these studies focused on specific diagnoses instead of functional impairments, which limits the generalizability and applicability of findings to others who also participated in the VR system.
For example, Native Americans with mental impairments were half as likely, and African Americans with sensory impairments were 80%as likely to find successful employment than European Americans (Dutta et al., 2008). In one (unspecified) state, people who were employed at application had 130%higher likelihood of exiting with CIE than those who started VR unemployed (Ufere et al., 2019). Nationally, having employment at application found people with mental impairments to be 1.5 times as likely, people with sensory impairments to be 4 times as likely, and people with physical impairments to be nearly 3 times as likely to exit with CIE compared to those who were unemployed at program start (Dutta et al., 2008). Last, higher education levels were shown to be associated with increased CIE rates for people with attention deficit hyperactive disorder (ADHD) (Glynn & Schaller, 2017), traumatic brain injury (TBI) (Ahonle et al., 2019), cerebral palsy (CP) ( Huang et al., 2013), youth with intellectual disabilities (ID) ( Kaya, 2018), and youth with autism spectrum disorder (ASD) ( Kaya et al., 2016).
In addition to investigating demographics and basic personal characteristics, the previous research has also investigated relationships between VR services and CIE at exit, again for specific diagnoses or impairment groups in the population. While there are some services with common associations for many of the diagnoses, the specific services listed for each group vary because each investigation focused on a specific diagnosis or subset of impairments. Their findings imply the efficacy of specific services for each subpopulation. These studies only compare participants receiving the service with participants not receiving the service in the specific diagnosis’ subgroup. They neither capture, nor compare, the outcomes of non-participants in order to more fully understand the VR program outcomes.
For example, job placement, short-term job supports, and job search assistance were associated with increased CIE rates for people with affective disorders (S
Program time factors also have been found to be associated with CIE. People with MS, SCI, and cancer survivors who achieved CIE had shorter periods between application and eligibility determination ( Chiu et al., 2013, 2014; Marini et al., 2008). The less time spent receiving VR services was associated with higher odds of achieving CIE for people with MS (Chiu et al., 2013) and cancer survivors (who were unemployed at the time of application) ( Chan et al., 2008). The period between eligibility and exit was shorter for those with SCI who received VR services (Marini et al., 2008). While the generalizability of these findings is limited, they suggest that time in the program may be a valuable program outcome to investigate.
There also is some evidence that public monetary or health benefits may serve as work disincentives to decrease CIE rates, which has also been investigated for specific diagnoses, including ADHD, ASD, epilepsy, learning disabilities (LD), orthopedic impairments, and psychiatric disabilities. The most common benefits investigated have been the association of Social Security Administration (SSA) benefits with CIE (Chan et al., 2006; Ditchman et al., 2018; Kaya, 2018; Kaya et al., 2016; Rumrill et al., 2017). However, some have investigated the effects of broader sets of benefits on CIE rates, such as disability-related medical or cash benefits (Chiu et al., 2013), or a combined pool of public benefits expanded beyond SSA benefits to also include Temporary Assistance for Needy Families (TANF) and State General Assistance (Glynn & Schaller, 2017). These studies indicate a desire to reduce public benefit dependency, motivating understanding how reliance on public benefits changes between application and exit to the program.
Publicly available VR data –The RSA-911 case service report
The Rehabilitation Services Administration (RSA) collects data to evaluate VR programs via the United States RSA-911 Case Service Report. The recorded variables include individual characteristics (including age, sex, race, ethnicity, and living arrangements), supports (i.e., student supports, public financial benefits, and medical insurance), disability information, employment status, Workforce Innovation Opportunity Act (WIOA) core program involvement, employment barriers, education information, program information (e.g., if an applicant was determined eligible, directly admitted to the VR program, placed on an OOS waiting list, time on the OOS waiting list before starting or exiting the program), program services (e.g., pre-employment transition services, VR training services, VR career services, VR other services), employment outcomes with specific employment data (i.e., job standard occupational classification (SOC) code, weekly hours, and weekly wages), exit outcomes with specific employment data, and post-exit employment data. Periodically, the RSA updates their data collection practices adding new variables, removing some variables, and clarifying the definitions of the variables. A new set of data collection practices went into effect on July 1, 2017.
Our gap in knowledge
While we have some understanding of how demographic characteristics and VR services relate to CIE achievement for specific diagnoses, it is not generalizable to types of impairments, nor to the VR population as a whole. We do not know how employment outcomes compare between participants and non-participants. We have limited insight to other program outcomes beyond whether or not CIE is achieved at exit. We do not yet have a broad understanding of the entire VR population, the types of services applicants receive, and their impact on program outcomes such as type of employment at exit, the reason for exit, change in source of primary income, and change in reliance on public benefits.
Since the 2017 data collection practices went into effect, to our knowledge nobody has yet characterized the VR population using the new information included in this dataset. Furthermore, reports to the U.S. Congress, such as the Rehabilitation Services Administration Report for Fiscal Year 2016 Report on Federal Activities Under the Rehabilitation Act of 1973, as amended (2019), summarize and provide basic data analysis, but they do not describe detailed personal characteristics of VR applicants (let alone participants and non-participants) related to receipt of public benefits, education level, employment status at program entry, referral sources, and types of residence, all of which might also influence reaching employment goals. These reports do not describe information about the specific receipt of services or program outcomes related to time spent in the program, and changes in primary financial support. They do not discuss any program outcomes of non-participants. These shortcomings make it difficult to fully understand the impacts of the VR program on employment and other program outcomes for the population.
Objective
The objective of this paper is to chronicle the characteristics of VR applicants, the services they received, and their program outcomes as reported in the United States RSA-911 Case Service Report. This will provide researchers and VR program administrators with fundamental information about the use and efficacy of the VR program, beyond what is typically reported to the U.S. Congress. Our intent is to inform future research and hypotheses about the distribution of variables that may influence program outcomes or may identify gaps in VR services. The specific research questions answered in this study include: What is the distribution of personal characteristics, VR service receipts, and program outcomes for VR applicants and how do these vary between participants and non-participants? How do basic demographic distributions vary between applicants, participants, non-participants, and the United States labor force?
Methods
Data sets and cleaning process
The United States RSA-911 Case Service Report data for program years 2017 and 2018 was cleaned and organized using rules developed from the data reporting guidelines, publicly available information on public benefit limits (e.g., SSI has supplemental benefits in some states, TANF rules vary widely by location), and United States Bureau of Labor Statistics national wage data for SOC Codes ( Skowronski, 2018; U.S. Department of Veterans Affairs, 2020b, 2020c; U.S. Social Security Administration, n.d., 2020b; National Academy of Social Insurance, n.d.; Rehabilitation Services Administration, 2017; Schott, 2020, 2020; U.S. Administration for Children and Families & Office of Family Assistance, 2018; U.S. Bureau of Labor Statistics, n.d.; U.S. Department of Veterans Affairs, 2020a; U.S. Social Security Administration, 2020a; U.S. Administration for Children and Families & Office of Family Assistance, 2019; U.S. Bureau of Labor Statistics, 2010; Congressional Research Service, 2012). We defined our population of interest as applicants 25 to 80 years-old who were not enrolled in a secondary education program. This allowed us to study those who were likely to be focused on obtaining employment as opposed to going to school or pursuing other non-employment activities. For example, within those excluded, some may have been seeking employment to supplement college expenses, others likely sought employment to live independently, and yet others may have been focused on developing skills that could someday lead to living without their parents. We chose 25 years as the separating age to align with the minimum age in the complementary United States labor force data used to answer our second research question. This age restriction resulted in a focus on adult VR services, therefore pre-employment transition services were excluded from the analysis because (although available to everyone) those are designed for transition-age youth. Two subsets of VR applicants were also created—participants, i.e., applicants who went through the eligibility process, developed, and signed their individualized plan for employment (IPE) and non-participants, i.e., applicants who exited prior to developing their IPE. Participants and non-participants were included in the analysis to identify similarities and differences between those eligible for VR services who exited early and those who established an IPE and gained access to a more complete set of services.
Data files received from the RSA were dated March 23, 2021. The initial dataset included 1,010,456 cases closed between July 1, 2017 and June 30, 2019. After filtering out students and applicants under 25 years old and over 80 years old, it was reduced to 572,490 applicants. Altogether, 358,231 of these cases were participants (63%) and 211,105 cases were non-participants (37%). The remaining 3,154 applicants (0.6%) were excluded from the participant and non-participant groups due to missing exit type data (i.e., these people were only analyzed in the applicant group). A descriptive statistical analysis of personal characteristics, receipt of VR services, and program outcomes was conducted. When relevant, the descriptive statistics were compared to similar populations in the United States labor force which include all the people in the U.S., in this case 25 years-old and older (i.e., no maximum age was specified), who were employed or actively seeking employment. All statistics were calculated using IBM SPSS Statistics 26.
Managing employment outcome variables
Within the data set, there was a specific variable called employment outcome. This was captured twice, once when the first employment outcome in alignment with the IPE was attained and a second time at exit. The United States Department of Education, which houses the RSA, defines employment outcome as employment “consistent with an individual’s unique strengths, resources, priorities, concerns, abilities, capabilities, interests, and informed choice” (State Vocational Rehabilitation Services Program, Applicable Definitions, 2021, para. 15). Someone who does not achieve that, is said to have no outcome. The dataset categorized anyone with no outcome as a missing data point in the employment outcome variables. Insights into those with no outcomes are valuable to objectives related to improving program retention and program outcomes. Therefore, during data cleaning, the researchers assigned an outcome to VR applicants with no outcome according to their exit type. These were: exit pre-program, exit ineligible for the program, and exit unemployed after entering the program. The actual employment status at exit was not captured for those who exited pre-program and were ineligible for the program. It is possible they gained employment on their own prior to the IPE and withdrew from the program; it is also possible they decided not to pursue employment.
Results
Distributions of personal characteristics
Age, sex, race and ethnicity and their comparison to the labor force
The age distribution of VR applicants (i.e., at application) was largely between 25 and 50 years. It decreased from 25 years (approximately 3%), with a valley around 42 to 44 years (approximately 2.2%), a second peak around 54 years (approximately 2.7%), and then quickly declined after about 55 years. Figure 2 presents the distribution of participant and non-participant ages at application and exit, which follow a similar shape to the distribution of applicants at application. For all stages in the process, the median age for VR participants was between 45 and 47 years, and for non-participants, it was between 42 and 43 years.
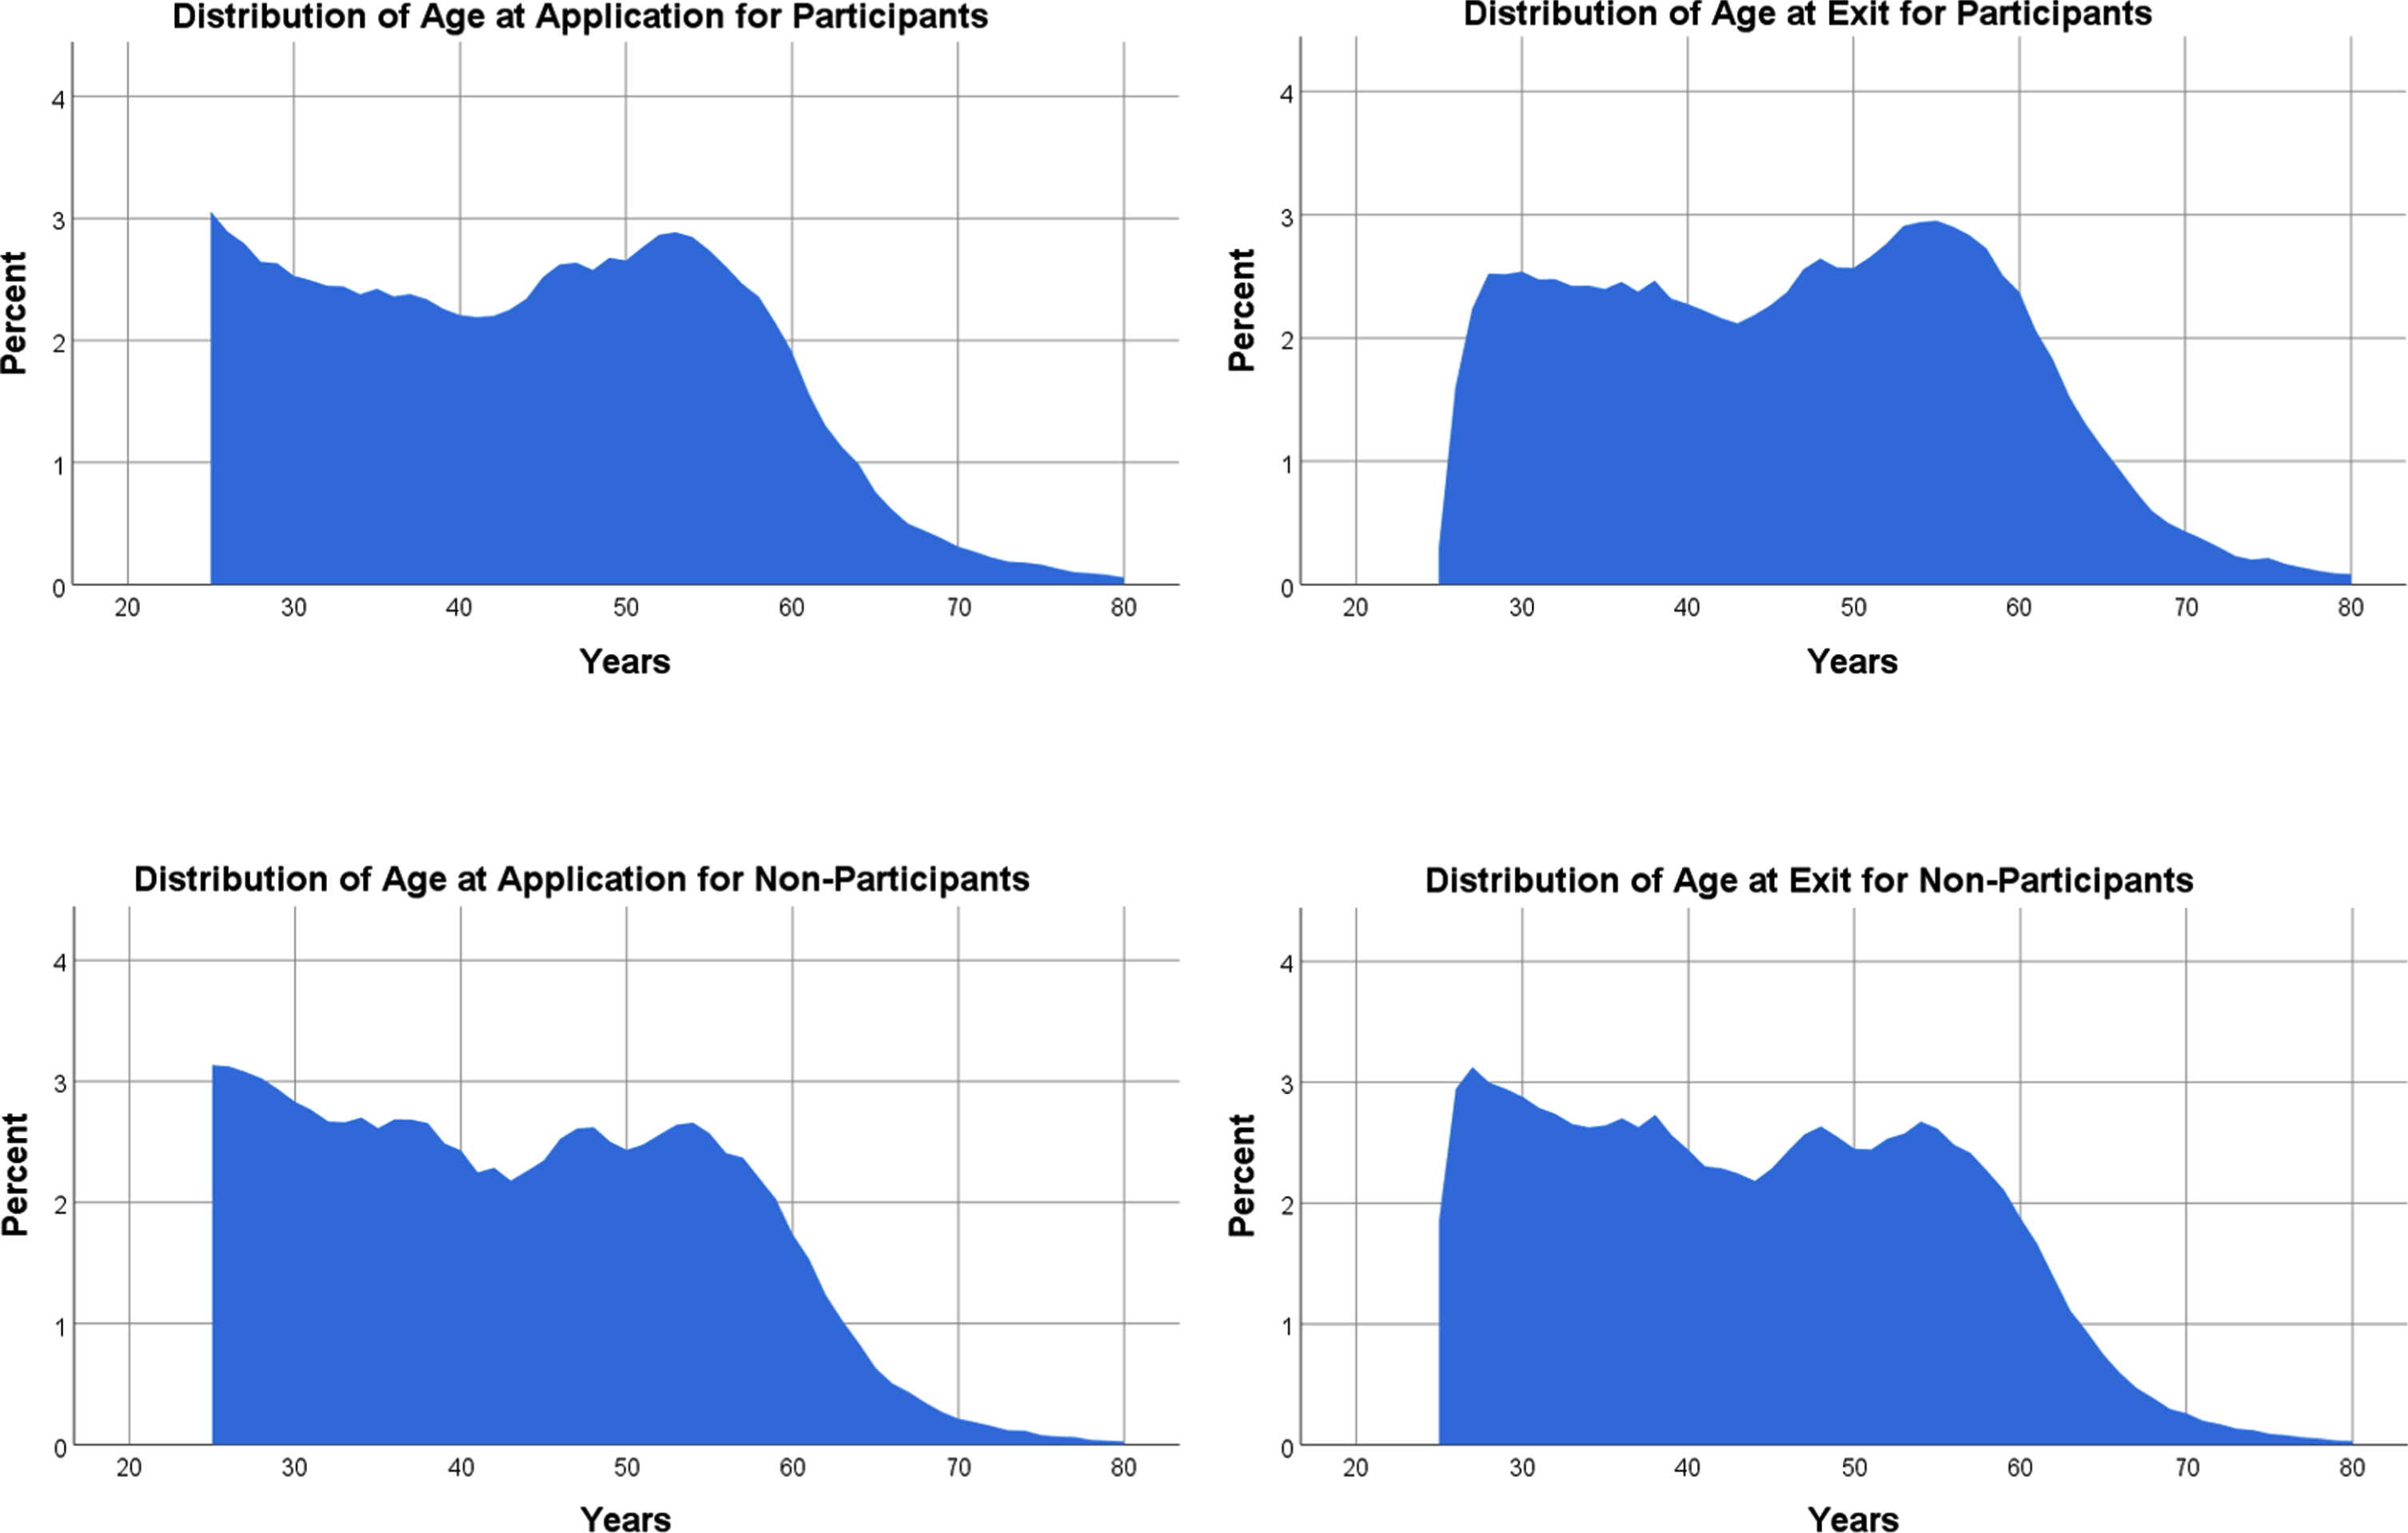
Distribution of age at application and exit for participants and non-participants.
Table 1 compares distributions for sex, race, ethnicity, and education between the VR population and the U.S. labor force. There were similar proportions of men and women 2 in VR as were in the 2019 U.S. labor force. However, there was a higher proportion of Black individuals in the VR populations (26–30%) than there were in the 2019 U.S. labor force (13%). There were also fewer Hispanic individuals in the VR population (10–11%) than the U.S. labor force (18%) ( U.S. Bureau of Labor Statistics & Current Population Survey, 2020).
Frequency proportion of personal characteristics for VR populations and the U.S. labor force
1. Due to missing exit type information necessary to classify applicants as participants or non-participants, 3,154 applicants were excluded from the participant and non-participant groups and only analyzed in the applicant group. 2. Estimates for race in the U.S. labor force are for those who identify with a single race. 3. Education level at program entry is compared to the 2020 U.S. labor force. The 2020 U.S. labor force provided statistics for high school diploma and equivalent (this is assumed to include GED, Certificate of Completion of Individualized Education Plan (IEP) and some post-secondary education without a degree).
The levels of education achieved at the time of VR application were low, as seen in Table 1. Eighteen percent of VR participants and 24%of non-participants did not achieve a high school education, compared to 6%of the 2020 U.S. labor force ( U.S. Bureau of Labor Statistics & Current Population Survey, 2021). Fifty-one percent of VR participants and 48%of non-participants had their high-school diploma or equivalent (i.e., high school diploma, Certificate of Completion of Individualized Education Plan (IEP), or GED), compared to 25%of the 2020 U.S. labor force. Post-secondary education not resulting in a degree was received by 11%of participants and 8%of non-participants, which was less than the 2020 U.S. labor force (15%). Seventeen percent of participants and 16%of non-participants earned a post-secondary degree (i.e., associate, baccalaureate, or graduate degree) compared to 54%of the 2020 U.S. labor force.
Employment at program entry and employment goals
Table 2 presents distributions of personal characteristics for VR applicants, participants, and non-participants. Seventy-two percent of participants and 94%of non-participants were unemployed at the start of the program. Twenty-two percent of participants and 5%of non-participants had CIE at the start of the program (see Table 2a). It is reasonable to assume applicants with CIE at program entry had IPE goals to either maintain or improve their employment status.
Frequency proportion of personal characteristics for all VR populations Table 2a: Employment characteristics of all applicants, non-participants, and participants
Frequency proportion of personal characteristics for all VR populations Table 2a: Employment characteristics of all applicants, non-participants, and participants
Note: All percentages are the valid percentage of non-missing cases for that data category. 1. Due to missing exit type information necessary to classify applicants as participants or non-participants, 3,154 applicants were excluded from the participant and non-participant groups and only analyzed in the applicant group.
As seen in Table 2a, 14%of applicants (15%of participants and 0%of non-participants) had a supported employment goal on their final IPE. The Rehabilitation Act includes a state supplemental supported employment program with specific funds for participants seeking to achieve supported employment ( State Supported Employment Services Program, 2022; What Is the State Supported Employment Services Program?, 2021). Seventeen percent of participants with supported employment goals achieved CIE, and 53%did not achieve employment. A further 30%of VR participants achieved supported employment. The two different goals (i.e., CIE vs supported employment) on the IPE may trigger different services and approaches included in the IPE.
Participants and some non-participants report barriers to employment at some point between application and finalizing their first IPE. The most common barriers to employment reported by participants were low income (55%), long-term (six or more months) unemployment (39%), were ex-offenders (15%), and deficiencies in basic skills or literacy (15%) (see Table 2a). Other barriers included English language deficiencies, single parent status, cultural barriers, and homelessness. Non-participants had a high proportion of missing data in this field. Forty-seven percent of participants reported multiple employment barriers, a possible indicator of increased difficulty reaching employment goals.
Impairment
Primary impairment refers to the reduced functional capability that is most interfering with the applicant’s capacity for work. There are 19 types of impairments that were divided into three main categories: mental, sensory/communicative, and physical and a twentieth category of no impairment. Impairments related to hearing (i.e., hearing loss and deafness) are further divided by the primary communication mode: visual or auditory. For example, someone who has hearing loss and communicates visually may use sign language as their primary communication mode and a person with hearing loss who communicates auditorily may use hearing aids. As discussed in the introduction, many previous investigations have focused on medical diagnoses, which are not captured in the source of impairment. Many medical diagnoses have a range of potential impairments. This study focuses on impairment instead of either diagnosis or the cause of impairment because several diagnoses can lead to the same primary impairment leading to more generalizable results.
The most common primary impairments were mental impairments (54%of applicants) categorized as psychosocial, cognitive, or other (see Table 2b). The remaining sensory and physical impairments were much less prevalent. Twenty-four percent of applicants had either hearing loss and communicated with auditory methods or had one of the following: other physical impairment, mobility-related orthopedic/neurological impairment, or general physical debilitation. The biggest differences between participants and non-participants were no impairments (0%participants vs 9%non-participants), hearing loss with auditory communication (9%participants vs 2%non-participants) and psychosocial impairments (30%participants vs 34%non-participants). Fifty-six percent of the applicants had a secondary impairment (comorbidity) as well. The most common comorbidity was psychosocial impairment (22%of applicants).
Disability characteristics of all applicants, non-participants, and participants
Disability characteristics of all applicants, non-participants, and participants
Note: All percentages are the valid percentage of non-missing cases for that data category. 1. Due to missing exit type information necessary to classify applicants as participants or non-participants, 3,154 applicants were excluded from the participant and non-participant groups and only analyzed in the applicant group.
Applicants with significant disability have impairments that seriously limit one or more functional capacities related to employment, are expected to need multiple services over an extended period, and have one or more physical or mental disabilities. Each state sets its own definition of a most significant disability. Anyone receiving SSA support should be classified with at least a significant disability (State Vocational Rehabilitation Services Program, Applicable Definitions, 2021, paras. 29, 30). In terms of reporting the significance of their disability, 52%of the participants were classified as having a most significant disability, while 42%were classified as having a significant disability (see Table 2b). Slightly lower percentages (7–12%less) of non-participants’ disabilities were classified as most significant and significant.
The majority of applicants (87%) were determined eligible for VR services and 63%of non-participant applicants were determined eligible. A small proportion of applicants, participants, and non-participants (5–8%) were placed on an OOS waiting list to wait until resources to participate in the program became available. To be placed on the OOS waiting list a person first must be determined eligible; 13%of eligible non-participants and 5%of eligible participants were placed on the waiting list. The average duration on a waiting list was 5.6 months for participants. The modal duration on the list was 0 days. The durations were about 3 times longer for non-participants. The average duration on the waiting list for non-participants was nearly 3 times higher (16 months). The modal duration on the list was 4.3 months. Table 2c presents detailed eligibility and OOS statistics.
Eligibility and order of selection (OOS) characteristics of all applicants, non-participants and participants
Eligibility and order of selection (OOS) characteristics of all applicants, non-participants and participants
Note: All percentages are the valid percentage of non-missing cases for that data category. 1. Due to missing exit type information necessary to classify applicants as participants or non-participants, 3,154 applicants were excluded from the participant and non-participant groups and only analyzed in the applicant group.
There were a variety of ways that individuals were referred to the VR program, and these were generally the same for participants and non-participants. The most common ways of entering the VR program for applicants were through self-referral (39%), other sources not included in the extensive list (12%), medical health provider (9%), and mental health provider (8%) (see Table 2d).
Referral sources of all applicants, non-participants, and participants
Referral sources of all applicants, non-participants, and participants
Note: All percentages are the valid percentage of non-missing cases for that data category. 1. Due to missing exit type information necessary to classify applicants as participants or non-participants, 3,154 applicants were excluded from the participant and non-participant groups and only analyzed in the applicant group.
The majority (87%) of VR applicants lived in a private residence. Four percent lived in community rehabilitation facilities, or group homes, and 3%were homeless or lived in a shelter (see Table 2e). The support system and resources available to someone are different with each living arrangement. For example, a community rehabilitation facility may have their own accessible transportation that is shared by the residents, which could be more accessible than public transportation, but may be more limited than a personal vehicle. Living arrangements also affect SSI benefit amounts. The distributions for participants and non-participants were similar to those of the applicants.
Living arrangements of all applicants, non-participants, and participants
Living arrangements of all applicants, non-participants, and participants
Note: All percentages are the valid percentage of non-missing cases for that data category. 1. Due to missing exit type information necessary to classify applicants as participants or non-participants, 3,154 applicants were excluded from the participant and non-participant groups and only analyzed in the applicant group.
Half of the applicants did not receive public benefits or financial assistance (which for simplicity will be combined and referred to as “benefits”), as shown in Table 2f. The other half received at least one of the eight available types of benefits at application. While about 40%of each of the populations received one benefit, about 10%received between two and five benefits 3 The most common benefits were Social Security Disability Insurance (SSDI), Supplemental Security Income (SSI), and other support, ranging between 10%and 18%of applicants for each one. Less common was General Assistance, concurrent Social Security Administration (SSA) benefits (i.e., both SSDI and SSI), and TANF, where 3–5%of applicants received each of these. About 1%of applicants received veteran’s disability payments, worker’s compensation payments, or unemployment insurance (see Table 4c).
Number of public benefits at application of all applicants, non-participants, and participants
Number of public benefits at application of all applicants, non-participants, and participants
Note: All percentages are the valid percentage of non-missing cases for that data category. 1. Due to missing exit type information necessary to classify applicants as participants or non-participants, 3,154 applicants were excluded from the participant and non-participant groups and only analyzed in the applicant group.
Frequency proportions of vocational rehabilitation service receipt for all applicants, non-participants, and participants Table 3a: Training services receipt for all applicants, non-participants, and participants
Note: All percentages are the valid percentage of non-missing cases for that data category. 1. Due to missing exit type information necessary to classify applicants as participants or non-participants, 3,154 applicants were excluded from the participant and non-participant groups and only analyzed in the applicant group.
The WIOA includes consistent tracking of participation across its core programs. Few participants engage with core programs other than VR. The most common is the Wagner-Peyser Employment Service, which provides services that connect employment seekers (regardless of disability status) to employers seeking workers and can include job search, referrals, and placement assistance. A smaller proportion of non-participants received VR services (58%non-participants vs 89%of participants) and a larger proportion of non-participants received Wagner-Peyser Employment Services (11%non-participants vs 6%participants) (see Table 2g).
Core WIOA program involvement of all applicants, non-participants, and participants
Core WIOA program involvement of all applicants, non-participants, and participants
Note: All percentages are the valid percentage of non-missing cases for that data category. 1. Due to missing exit type information necessary to classify applicants as participants or non-participants, 3,154 applicants were excluded from the participant and non-participant groups and only analyzed in the applicant group.
Training services
A small percentage of VR participants received one or more of a variety of training services intended to improve employability. Distributions of specific service receipts and numbers of services received are presented in Table 3. Fourteen percent of the participants received one training service and 2%received two. Essentially none of the non-participants received training services (see Table 3b). The most commonly provided training service was job readiness training, which was received by 6%of participants. Four percent received occupational or vocational training, 3%received miscellaneous training, and 2%received disability-related skills training. One percent or less of participants received each of the remaining eight forms of training available, including college, apprenticeships, on-the-job training, and customized training. Descriptions of the training services, as well as the career services and other services, are provided in the Appendix.
Career services receipt for all applicants, non-participants, and participants
Career services receipt for all applicants, non-participants, and participants
Note: All percentages are the valid percentage of non-missing cases for that data category. 1. Due to missing exit type information necessary to classify applicants as participants or non-participants, 3,154 applicants were excluded from the participant and non-participant groups and only analyzed in the applicant group.
Career services are intended to help the participant find and keep a job. The most common career services were VR counseling and guidance (63%of participants, 12%of non-participants), assessment (30%of participants, 31%of non-participants), job placement assistance (24%of participants), diagnosis and treatment of impairments (20%of participants, 5%of non-participants), and job search assistance (22%of participants). Lower proportions of participants received short-term job supports (12%), information and referral services (9%), supported employment services (8%), and benefits counseling (6%) (see Table 3b).
Twenty-seven percent of participants and 33%of non-participants received one career service. Participants were more likely than non-participants to receive multiple career services. The percentage of participants receiving two, three, four, and five services were 22%, 16%, 10%, and 4%respectively. The proportion of non-participants receiving two and three career services were 7%and 2%respectively, (see Table 3b).
Other services
Other services are those that support career and training services and can be provided any time in the process. The most common other services were transportation, other-unspecified maintenance, and rehabilitation technology. Nineteen percent of program participants received transportation services, followed by other-unspecified services and maintenance services, each received by 14%of participants (and 2%and 1%of non-participants respectively). Eleven percent of the program participants received rehabilitation technology (see Table 3c). Forty percent of participants and 6%of non-participants received one, two, or three other services (see Table 3c).
Other services receipt for all applicants, non-participants, and participants
Other services receipt for all applicants, non-participants, and participants
Note: All percentages are the valid percentage of non-missing cases for that data category. 1. Due to missing exit type information necessary to classify applicants as participants or non-participants, 3,154 applicants were excluded from the participant and non-participant groups and only analyzed in the applicant group.
A received service includes services given in-house, purchased by the VR agency, and comparable services given by another agency—this applies to all 31 VR services. Across all three previously discussed categories of services (Training, Career, and Other), 15%of program participants did not receive any VR services. Twenty percent received one VR service and another 17%and 16%received a combination of two and three services respectively. Thirteen percent of the participants received four services; those receiving more steadily declined as the number of services increased, accounting for the remaining 20%of the participants (see Table 3d).
Overall service receipt for all applicants, non-participants, and participants
Overall service receipt for all applicants, non-participants, and participants
Note: All percentages are the valid percentage of non-missing cases for that data category. 1. Due to missing exit type information necessary to classify applicants as participants or non-participants, 3,154 applicants were excluded from the participant and non-participant groups and only analyzed in the applicant group.
Non-participants may receive services to assist with determining eligibility or sometimes preparing to plan the IPE. Forty-three percent of non-participants received VR services: 31%received one and 13%received more than one.
Employment outcomes and exit reason
Program outcome distributions are presented in Table 4. Half of program participants exited unemployed, 44%achieved CIE, and 5%exited with supported employment (see Table 4a). The only outcomes available for non-participants were exit ineligible for the program and exit pre-program. The latter accounted for nearly two-thirds of non-participants.
The three most common reasons for exit were employment achievement (50%of participants), VR applicant lost interest in the program (21%of participants, 41%of non-participants), and program lost ability to contact the applicant (17%of participants, 29%of non-participants). There is no code specifically indicating someone exited from the OOS waiting list. There are specific codes for 14 more reasons that must be ruled out before selecting all other reasons including: health/medical, institutionalization, called to active duty from reserves, foster care placement triggers moving out of the area, ineligibility, criminal offender, no employment impediment, too significant of a disability for the applicant to benefit, lack of resources to provide long-term extended services, transfer to another agency, extended employment, and lack of availability for extended employment services. Those 14 reasons combined accounted for a smaller proportion of participants (5%) and non-participants (13%) than the all other reasons category (7%of participants, 17%of non-participants) (see Table 4b).
Frequency proportions of program outcomes of all applicants, non-participants, and participants Table 4a: Employment outcomes of all applicants, non-participants, and participants
Frequency proportions of program outcomes of all applicants, non-participants, and participants Table 4a: Employment outcomes of all applicants, non-participants, and participants
Note: All percentages are the valid percentage of non-missing cases for that data category. 1. Due to missing exit type information necessary to classify applicants as participants or non-participants, 3,154 applicants were excluded from the participant and non-participant groups and only analyzed in the applicant group. 2. The abbreviation n/a refers to not applicable, because it is not a categorical option based on how participants and non-participants were separated.
Exit reasons for all applicants, non-participants, and participants
Note: All percentages are the valid percentage of non-missing cases for that data category. 1. Due to missing exit type information necessary to classify applicants as participants or non-participants, 3,154 applicants were excluded from the participant and non-participant groups and only analyzed in the applicant group. 2. The abbreviation n/a refers to not applicable, because it is not a categorical option based on how participants and non-participants were separated.
Due to the positively skewed nature of the distribution, the median central tendency measures were evaluated. It took half the participants up to 15 months to go through the program from application to exit, with up to 1 month to determine eligibility, and up to 2.6 months to start VR services. Half the participants took 12 months from the start of services to exit. Half of the participants developed the final version of their IPE within 4.1 months of application. Half of the participants received their final career service (a sub-group of the VR services) within 2 months before exit. For half the participants, the first job in alignment with the participant’s IPE goals (for those that gain some form of employment) was started 4.8 months or less before exit, and it was the same job they had at exit (i.e., 0 days between the two job start dates). Half of the participants started their exit job within 4.6 months before they left the program. These median times are shown on the timeline in Figure 3.
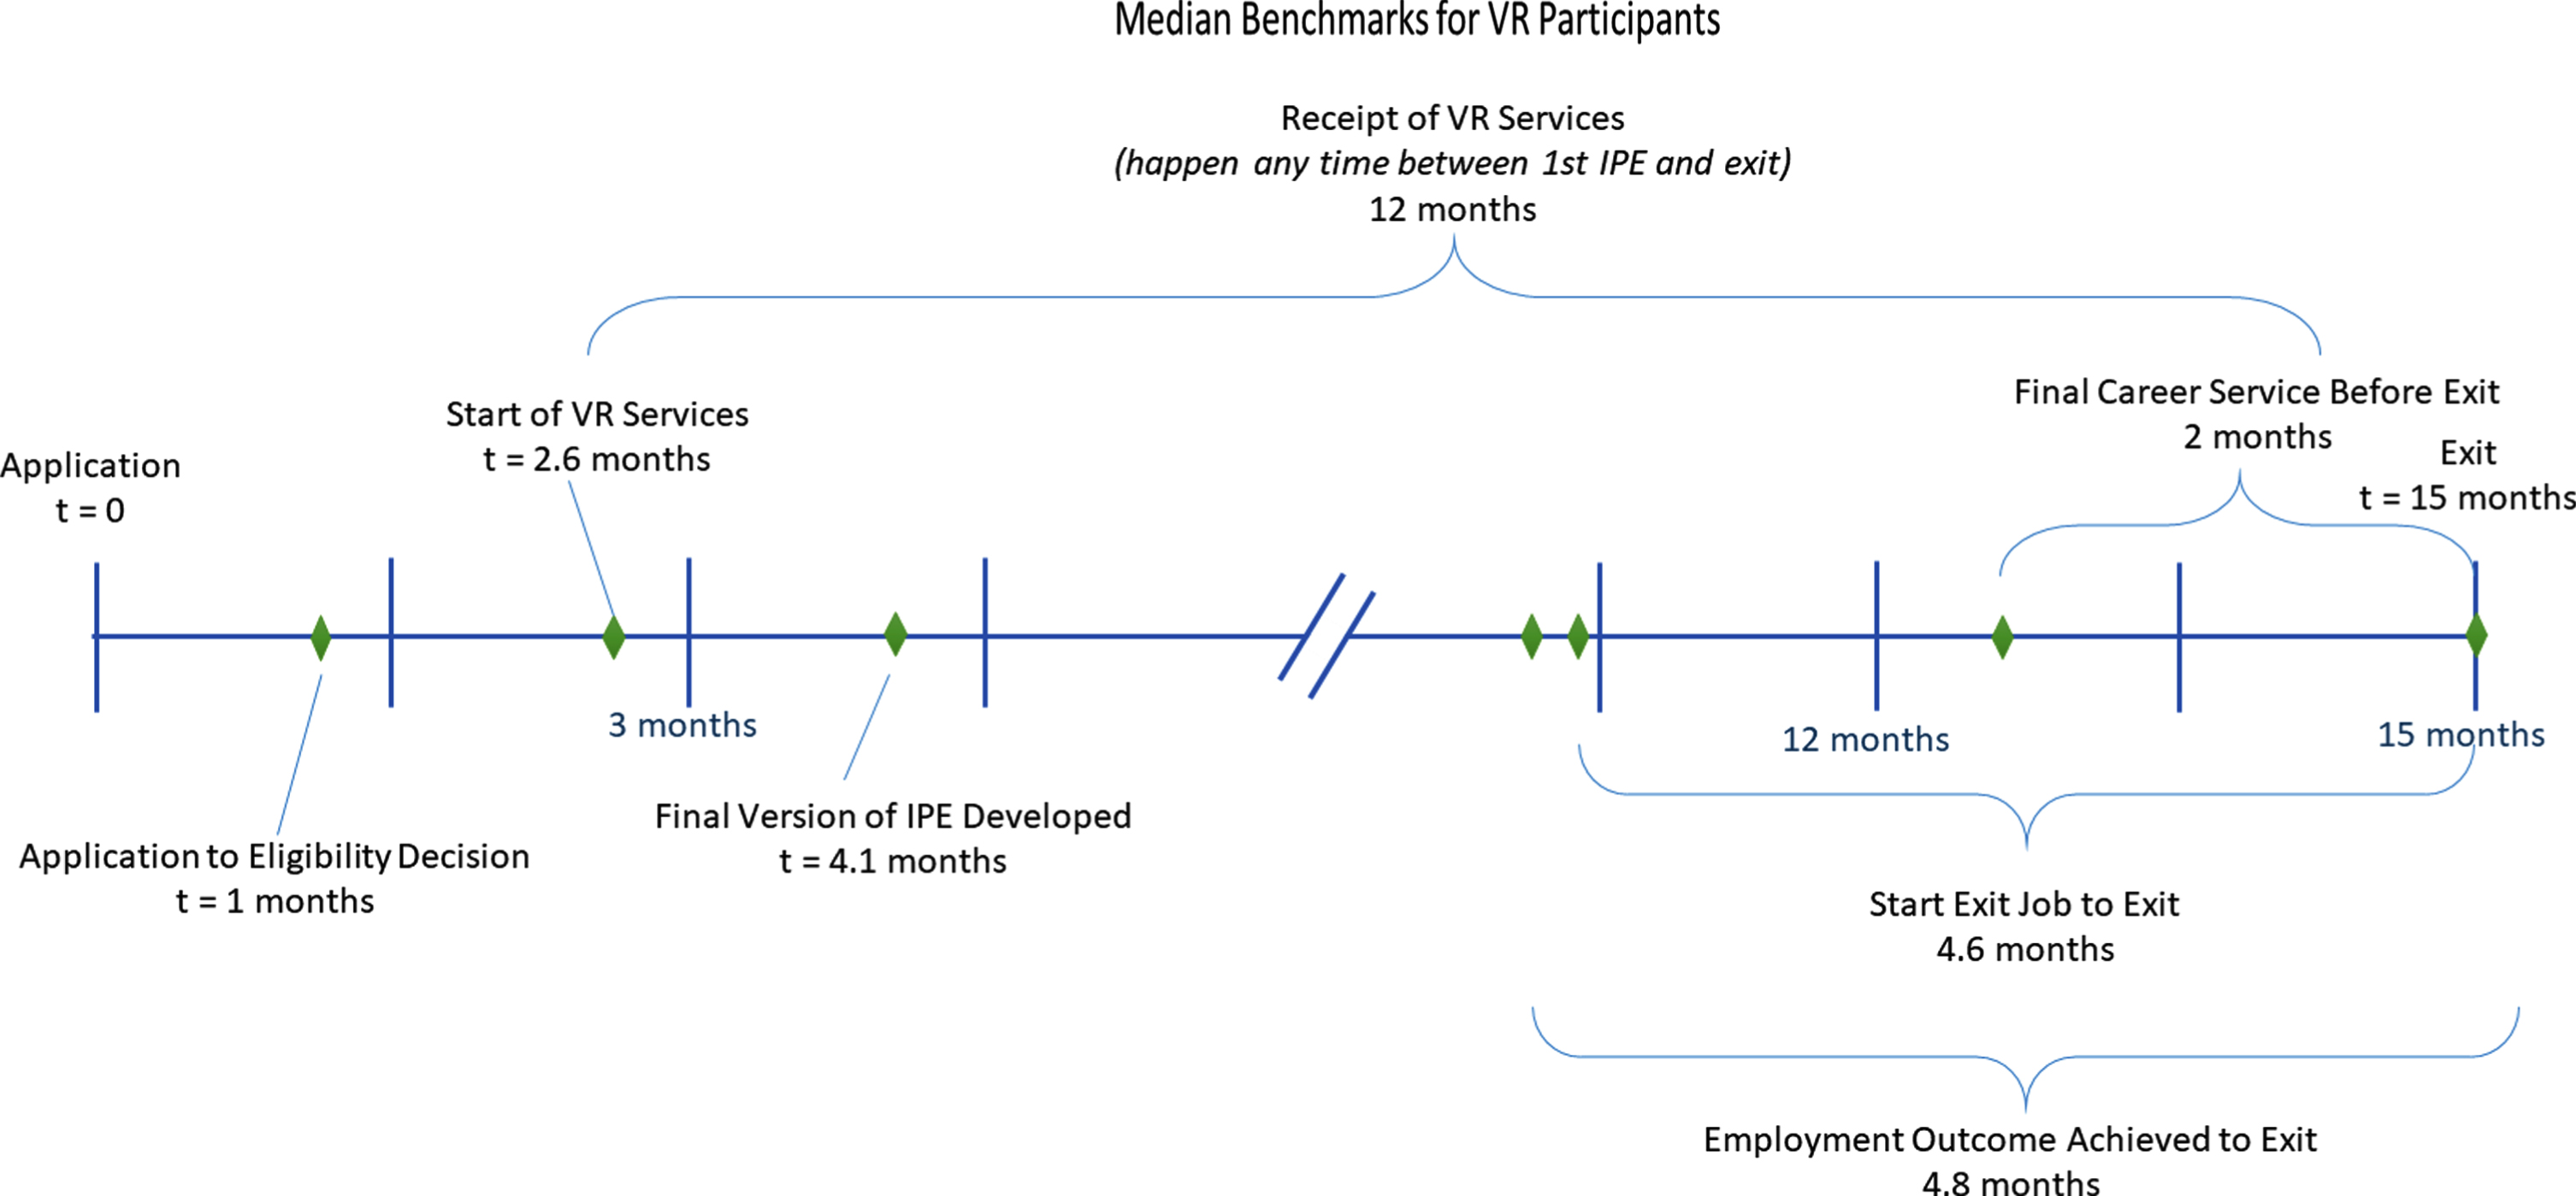
Timeline showing the VR Process with the median times for achievement of process milestones.
There were increases in the proportions of participants and non-participants whose primary source of financial support was personal income between time of application and time of exit. At exit, the difference in those relying primarily on personal income at application versus exit increased from 23%to 47%for participants and from 17%to 19%for non-participants. The proportion relying on public benefits decreased from 39%to 31%and reliance on family and friends nearly halved for participants. Their reliance on other sources remained nearly the same. For non-participants, the change in reliance on public benefits, family/friends, and other sources was stable, moving an increment of no larger than 2% (see Table 4c).
Benefits, sources of support, and how they compare from application for all applicants, non-participants and participants
Benefits, sources of support, and how they compare from application for all applicants, non-participants and participants
Note: All percentages are the valid percentage of non-missing cases for that data category. 1. Due to missing exit type information necessary to classify applicants as participants or non-participants, 3,154 applicants were excluded from the participant and non-participant groups and only analyzed in the applicant group.
Participation in the VR program was associated with small reductions in participation in several public benefits and very modest increases in SSDI benefits. The largest decrease in public benefits between application and exit is unspecified other supports decreasing from 10%to 6%for participants and from 11%to 7%for non-participants. Overall, SSDI benefit receipt increased from 20%at the time of application to 22%at exit for participants and 16%at the time of application to 17%at exit for non-participants (see Table 4c).
Changes in health insurance
At the application, about 20%of participants and 25%of non-participants had no health insurance. Sixty-five percent of participants and 63%of non-participants received their health insurance from one source. Thirteen percent to 15%received their insurance from two or more sources. Between application and exit, the percentage of individuals reporting no insurance coverage increased from 20%to 22%for participants and from 25%to 31%for non-participants. The number of participants and non-participants with two or more sources of health insurance decreased from 15%to 12%and 13%to 9%, respectively. Medicaid was the most popular insurance source at application with 42%of participants and 46%of non-participants receiving it. Participation in employer health insurance increased from 9%to 14%among participants between time of application and exit (see Table 4d).
Discussion
In order to inform future research and hypotheses about variables that may influence program outcomes or may identify program gaps, the purpose of this study was to provide researchers and VR program administrators with detailed information about the use and efficacy of the VR program from a full-population perspective. To provide a wholistic understanding of the dataset, distributions of characteristics of applicants, the services they received, and their program outcomes were compared between participants and non-participants. Further, the demographic characteristics were also compared with the U.S. labor force. The insights gathered from these comparisons will allow future researchers to make data-driven decisions regarding their research designs. With a broad understanding of the dataset, they can also expand their population of interest to include similar subjects, thus broadening the generalizability of their work.
The most positive VR program outcomes include the doubled CIE rate for participants from program start to program end and increases in reliance on personal income (104%increase for participants and 12%increase for non-participants), which mostly came from a reduced reliance on family/friends (47%decrease for participants) and public funding (20%decrease for participants and 5%decrease for non-participants). While there are many non-economic benefits of employment that are challenging to quantify, the economic benefits of having employment reduces the likelihood of needing public aid and contributes to the overall economy. Improving employment rates and increasing financial independence (i.e., increasing reliance on personal income) are in the government’s, and therefore the VR program’s best interests. While these are positive outcomes, there is room for improvement. The provision of VR services is the primary method VR uses to achieve employment goals, and the area where policy could have the greatest influence. If there was a better understanding of population-wide (or large sub-population-wide) associations between services and these outcomes, policy could guide service use to improve them.
Eighty-five percent of participants received VR services and 65%received more than one service. The most used service, vocational rehabilitation counseling and guidance, provides participants with support through any step(s) of the VR process and the second most prevalent service, assessment, provides the participant with tools to help them plan their IPE. The next three most used services (i.e., job placement assistance, job search assistance, and diagnosis and treatment of impairments) help participants gain employment or prepare for employment. Are these commonly used services likely to improve program outcomes? What is the optimal number and combination of services likely to help all participants? What additional services can further help different unique subgroups based on demographics and impairments? Future investigations answering these questions could lead to policy changes regarding service delivery to improve program outcomes.
Fifteen percent of participants failed to receive services, and we do not know why. This is important because the RSA defines a participant as someone who has begun receiving services and has signed their IPE. That is different from our participant definition and these 15%are not captured in the official reporting of VR participants; instead they are captured in data of reportable individuals. The dataset does not provide the specific services that were part of the IPE for each participant. Therefore, it is unclear if the reasons participants who do not receive services were due to poor follow-through, pre-mature departure from the program, or if services were never included in the IPE. If someone develops their goal and plans out services necessary to achieve it (i.e. their IPE) and does not follow-through on the plan, what does that indicate? Among many possibilities, it may indicate lack of motivation, requirement of additional support (e.g., childcare) to participate in the services, or an inadequate number of service providers to meet the need in a timely manner. It is unknown as to what happens to these people between establishing their IPE and beginning services. Nor do we know their employment outcome; it is not tracked. We only know the reported exit reason. Understanding this group more thoroughly will help determine if greater efforts should be placed on this group to improve program retention, and how to better define a VR program participant.
Implications for future research
Not surprisingly, the reported impairments within the VR population are quite heterogeneous. Seven of the 20 impairment categories encompass 78%of applicants. If impairment is ignored, the results of an investigation will likely be skewed towards these seven most prevalent groups. Dutta et al. (2008) is perhaps the broadest study on the VR population, where they separated the participants into three groups: sensory impairments, physical impairments, and mental impairments. With the heterogeneity of the population, it is important to consider impairments more explicitly in research designs. Many diagnoses share impairments, so researchers may not be serving VR participants to the best of their capabilities when studies are limited to a specific diagnosis. Diagnoses that are commonly labeled as disabilities often encompass a group of impairments. Additionally, it is the impairment/health condition’s interaction with the environment that creates a disability (World Report on Disability, 2011). It is challenging to make recommendations and changes to a program that will have a strong impact if the research applies to a small subset of people based on their diagnosis.
As other reports and research have not focused on non-participants, it is noteworthy that 43%of non-participants received at least one VR service, and 65%of non-participants exited between being determined eligible and developing their IPE. Like participants who do not receive services, these are reportable individuals in official reports and their employment outcomes (i.e., employment at exit) are not recorded. From an economic perspective, they consume resources with minimal outcome tracking. While we do not have detailed information regarding non-participant employment outcomes, which limits our understanding of the efficacy of the VR program, we do know the most likely exit reasons were that the applicant lost interest and VR lost the ability to contact the applicant (Table 4b). We do not know if receipt of VR services as a non-participant alter the likelihood of CIE achievement. If these non-participants did not achieve CIE, then what unseen variables are impacting their ability or willingness to stay in the program? Could these potential unseen variables be related to the OOS in some states and the time spent on the waiting list? What role does OOS have on participant and non-participant outcomes? Future investigations answering these questions could lead to improved understanding of the efficacy of VR and program retention needs stimulating innovative improvements to the program.
This study also suggests that there are large percentages of VR participants who are unable to reach their employment goals by the end of their program. It is possible that some popular practices help and others do not (and some may even hurt goal achievement). Future investigations need to determine which services fall in each category. For services that have a negative association with CIE at exit, we need to understand why that is, and if pairing them with another service can moderate the effect to create a positive outcome. The most common reasons for exit for participants, behind achieving employment, are participant lost interest and VR lost the ability to contact the participant. To improve program outcomes, research should focus on program retention and the relationships between VR services and program outcomes. With 31 types of services offered, there are opportunities to strategically overcome barriers associated with reduced likelihood of both finishing the program and exiting with CIE.
It is also notable that there are differences in representation of racial and ethnic minorities between the VR population and the U.S. labor force. Additionally, education levels are much lower in the VR population than in the U.S. labor force. An explanation of why these differences occur could not be ascertained with the data available for this study. However, it is conceivable that cultural differences associated with race, ethnicity, and education may influence the perceived usefulness of a service to a participant in a specific subgroup or it could reflect differences in the availability of services to different demographics. Future research could further explore how services provided to VR applicants differ across demographic variables to better understand who is using VR services and potentially identify areas where services are not being deployed equitably. Further, it might also identify situations where services are designed for a specific group and if the service design needs to be modified to be relevant/have increased perceived usefulness to other groups.
Whether or not an applicant is employed at program start, and whether or not they have a supported employment goal, suggests a difference in their program outcome goals and the services needed to meet them. Surprisingly, 17%of participants with supported employment goals instead exited with CIE. It would be worthwhile to understand what is different with those who had a supported employment goal and exited with CIE compared to both those who exit unemployed or with supported employment. Future investigations into the association of services and CIE might consider investigating groups separately based on the goals and/or starting employment conditions.
At the time of application, 48%of participants did not receive any public benefits, 42%received one benefit and about 10%received two to five benefits. There was a small reduction in receipt of each of the public benefits (except SSDI which had a 10%increase) as a program outcome. While some previous studies considered a negative association between receipt of benefits and exiting with CIE to be work disincentive, that would imply the receipt of the benefits deters the participant from gaining work. The evaluation of additional variables in tandem with benefit receipt could determine if the relationship is truly a work disincentive, or if there is a mediating variable associated with benefit receipt. This is important to differentiate because work disincentive may connotate a deterrent to motivation when receipt of benefits could simply imply a more complex situation. Additionally, it is important to understand the association of benefit receipt with employment achievement and other program outcomes for both the participant and non-participant. If this was investigated for the full population instead of by specific impairments or diagnoses, it could lead to insights important to participation and program outcomes.
Conclusion
Limitations
Perhaps the most important limitation of this study is that the dataset was designed for administrative purposes instead of research. The dataset was not structured to facilitate a large-scale longitudinal analysis of VR program outcomes.
For future research, it is important to note many of the variables in the dataset are correlated (reporting them was beyond the scope of this study). Correlations between variables may make it difficult to establish which variables are the most important determinants of unsuccessful or successful employment outcomes. For example, the most common employment barriers are related to poverty and skill deficits, which intuitively are connected to the receipt of public financial benefits and low education levels. We also find many variables that could indicate important latent variables. For example, both the referral source and type of residence could indicate latent variables related to social supports. Another example (a combination of potential correlated variables and indications of latent variables) is WIOA program involvement and services. It was noted that the services available through WIOA’s Wagner-Peyser Employment Program may also be provided by vendors that are not part of the VR program. So, is it employment services that are important, or is it more specifically how employment services are delivered as part of the particular WIOA program? This can also occur with program outcomes. For example, is a change in health insurance related to another outcome such as the change in receipt of SSA benefits, change in employment, or another latent variable? This study motivates untangling the relationships between the variables, selecting the most appropriate ones for deeper analysis, and identifying latent variables with multivariate statistical methodologies.
Overall, this study highlights the importance of conducting VR research on larger impairment groups rather than specific disability diagnoses, consideration of IPE goals, how service delivery varies with different demographic groups, and the need to investigate program retention for both participants and non-participants. While access to more detailed data regarding prescription of services, timelines of service delivery, and participant goals would be useful, the current dataset still provides a rich opportunity for further investigation. In particular, future research should identify services or sets of services that are most impactful to achieving CIE upon exiting the program. This knowledge would help future investigations streamline their designs related to demographics and equity, specific impairments, and employment goals to maximize impact.
Footnotes
Acknowledgments
The authors would like to acknowledge the assistance of Meredith Dressel, the Deputy Administrator of Wisconsin Department of Workforce Development’s Division of Vocational Rehabilitation, for her contextual understanding of the dataset and insight to data collection practices. She was particularly helpful with determining if anomalies found in the dataset were erroneous or providing reasonable explanations for them.
Author contributions
All authors contributed to the study conception and design. Material preparation, solicitation of the dataset, cleaning of the data and analysis were performed by Meghan Donahue. The first draft of the manuscript was written by Meghan Donahue and commented on by Victor Paquet. All authors commented on further iterations of the manuscript. All authors read and approved the final manuscript.
Conflict of interest
The authors have no relevant financial or non-financial interests to disclose associated directly nor indirectly with this work.
Data availability
The United States Department of Education Rehabilitation Services Administration provided their Case Service Report (RSA-911) Data File for program years 2017 and 2018 for research purposes only. Part of the agreement when obtaining the data files was to not duplicate or share them. However, the data files can be requested by contacting RSAData@ed.gov. The data cleaning script is specific to this dataset, but is available from the corresponding author on reasonable request.
Ethics statement
The University at Buffalo Institutional Review Board reviewed this observational study and determined it to be exempt from ethics approval.
Funding
The authors declare that no funds, grants, or other support were received during the preparation of this manuscript.
Informed consent
This study uses de-identified administrative data obtained from the United States Department of Education’s Rehabilitation Services Administration (RSA). Therefore, the consent process to use case file data for research purposes is assumed to have been obtained from the state vocational rehabilitation agencies before reporting the data to the RSA.
The Rehabilitation Act defines a participant as someone who has an active IPE and has begun using services, which is slightly different from our definition. They also define a reportable individual as someone who has demonstrated an intention to use VR services (including non-applicants who received pre-employment transition services). We have an interest in non-participation and if there are people who develop a plan to achieve their goal but did not take advantage of VR services. Therefore, we have decided to define a participant as someone who developed an IPE and a non-participant as someone who applied but did not develop an IPE. This allows us to analyze the subset of reportable individuals who applied to VR (i.e., applicant) and gauge participation at two points in the process: (1) development of the IPE (converting from applicant to participant) and (2) receipt of VR services, a separate variable that will be analyzed for both groups.
The dataset describes this variable as sex with no explanation/definition and three categories: female, male, and other. Based on these categories, it is assumed it refers to sex assigned at birth, not a misclassification of gender identity nor sexual orientation.
The data cleaning process calculated the total number of public supports prior to developing the SSI, SSDI and concurrent variables to be mutually exclusive from each other. Therefore, people with concurrent support receive three supports (i.e., SSI + SSDI + concurrent) and if they receive additional supports that would be added to this.