
Abstract
The utilisation of performance criteria to determine power rankings of various teams is useful for a vast number of audiences in many traditional sports, such as soccer, football, baseball, basketball, hockey, and the like. With market hyper-competition and viewership growth in the digital sector of eSports and related professional video gaming, the usage of performance evaluation in the scholarly literature is relatively scant. Thus, the current study provides a performance assessment and ranking structure in eSports. Applying a hybrid technique developed by previous research involving a series of Multi-Criteria Decision-Making (MCDM) tools, those being: Grey Relational Analysis (GRA), Simple Additive Weighting (SAW), and the Technique for Order Preference by Similarity to the Ideal Solution (TOPSIS), this study develops power rankings for professional teams in the popular multiplayer online battle arena (MOBA) game, Defense of the Ancients (Dota) 2. Further analyses offer a comparison of the produced ranking structure to other metrics commonly used in eSports evaluation, such as Elo and Glicko ratings. The findings of this study offer implications for players, teams, performance analysts, oddsmakers, consumers, among others. Recommendations and future directions of this research are also provided.
Keywords
Introduction
Over the course of more than 40 years, video games have advanced far beyond Pitfall!, Asteroids, and Frogger on the Atari 2600 gaming console, with some of the earliest gaming tournaments taking place in the United States during the 1970s (Bountie Gaming, 2018). Considering this, gameplay continues to be adapted by developers and organisers in order to garner the interest of millions of people around sporting events of a new kind, often termed eSports, filled with familiar features such as commentators, large screens, and stages. Since 2012, the number of fans and viewers in this domain has been steadily increasing (Statista, 2018). eSports figures are rather promising as they have also improved year-over-year. NewZoo, a market intelligence agency specializing in digital media and video gaming, estimates that eSports generated $345 million in revenue in North America in 2018, along with over $500 million abroad (Pannekeet, 2018). Furthermore, the most recent global revenue figures have experienced a year-on-year growth of over 26%, with revenue approaching over $1 billion during 2019 (Pannekeet, 2019).
Within this realm, Multiplayer Online Battle Arena (MOBA) titles are among the most played and watched digital games in the world (Gaudiosi, 2012). Some of the most popular MOBA games include League of Legends (LoL), Heroes of the Storm, Smite, Strife, and Defense of the Ancients (Dota) 2. Despite this, Ingraham (2018) points out that the North American eSports market pales in comparison to more traditional sports leagues, such as the National Football League (NFL), Major League Baseball (MLB), National Hockey League (NHL), and National Basketball Association (NBA), which each brought in over $4 billion in 2017 alone (Mathewson, 2019). In a more promising vein, viewership for the 2018 Dota 2 International Championship nearly matched that of the 2018 Kentucky Derby and exceeded figures for the Association of Tennis Professionals’ (ATP) 2018 Wimbledon tournament, National Association for Stock Car Auto Racing’s (NASCAR) Daytona 500 in 2018, the Professional Golfers’ Association (PGA) 2018 United States Open, and the Union Cycliste Internationale (UCI) 2017 Tour de France (Ingraham, 2018).
Produced by Valve Corporation, Dota 2 is an action real-time strategy (ARTS) video game, which sets two teams, named the “Radiant” and the “Dire”, of five characters (or “heroes”) against one another in a fictional fantasy world (Gaston, 2013). The objective of the game is to demolish the opposing team’s main building called the “Ancient”. Teams begin the game at their own base and move into enemy territory using three pathways called “lanes”. Several buildings called “Towers” are distributed within these lanes and will attack members of the opposing team. A river, positioned towards the centre of the map, divides the teams’ territories equally. Creatures called “Barracks” will spawn every 30 seconds within the lanes and proceed to the enemy base, attacking opposing players, Towers, and enemy Barracks along the way (Gaston, 2013). To strengthen the selected hero, players gain experience points by defeating enemies. Dota 2, considered an advanced form of ARTS, also contains an intricate item drop system that can be used to further enhance a player’s hero.
At this juncture, understanding and building statistical models can help predict players’ and teams’ performances in tournaments, particularly during high-stakes events where prize pools are expansive. Findings from the current study can better inform players, teams, oddsmakers, and consumers on how to plan respective in-game strategies and external wagers. Thus, we present a unique application of various Multi-Criteria Decision-Making (MCDM) techniques to eSports performance modelling using data obtained from the MOBA game, Dota 2. The remainder of the current paper is organised as follows: In section 2, a concise review of the literature and related scholarship is presented. A description of the data and relevant statistics are provided in section 3. The results of the current study are summarised in section 4. Finally, section 5 offers conclusions, recommendations, and directions for future work.
Literature review
MCDM and related techniques
Within operations research and the decision-making sciences, MCDM has emerged as a prevailing technique in providing solutions to a variety of issues involving multiple, even divergent, objectives (Triantaphyllou, Shu, Sanchez, & Ray, 1998). MCDM deals with a variety of decision problems in the presence of numerous criteria as a means to arrive at the ideal solution involving a series of alternatives. According to Triantaphyllou et al. (1998), there are three primary steps when numerically analysing and deciding between alternatives: 1) Collect the relevant criteria and alternatives; 2) Assign numerical weights to selected criteria; and 3) Compute numerical values to provide a ranking of each alternative. Scholars of MCDM have offered numerous methods to rank alternatives, such as analytic hierarchy process (AHP), ELimination Et Choix Traduisant la REalit
Grey relational analysis
Deng (1982) proposed that solutions to problems may not always be easily attained, given that researchers typically do not have all the information required to resolve an inquiry. Thus, GRA was developed to aid in the MCDM process by utilising the available information to reach an ideal solution. The process of GRA involves first generating a matrix containing available data. The data is then normalised by a selected reference series according to the ideal direction of each performance indicator. For instance, indicators where higher values signal better performance (e.g., kills in Dota 2) utilise the highest data point as the reference series, while those in which lower values denote stronger play (e.g., deaths) employ the lowest value among the chosen indicator. Following an absolute value transformation, grey relational coefficients and grades are generated and then ranked in order to determine the ideal solution (see Kuo, Yang, & Huang, 2008 for a full description of GRA). In a previous study, Kuo et al. (2008) have illustrated the suitability and parsimony of the GRA method in calculations and optimisation in decision-making. GRA has been employed in a variety of different fields, such as in fire safety assessment (Yang, Qian, & Huang, 2012), product life strategy (Chan & Tong, 2007), and genetic algorithms (Huang, Chiu, & Chen, 2008).
Moreover, GRA has been utilised in many contexts within sports-based research, such as in ranking teams and individual athletes in the NFL (Chen et al., 2010) and NBA (Chen, Huang, Lin, Lin, & Kuo, 2006). More specifically, research by Sakinç (2014) assessed Turkish association football clubs, using GRA to rank the financial performance of four major clubs (i.e., Beşiktaş, Fenerbahçe, Galatasaray and Trabzonspor) listed on the Borsa İstanbul (BIST) from the period of 2009 to 2013. Using a variety of both traditional and advanced statistics from the NBA, Pradhan (2018) created a structured ranking system of NBA players in the Modern Era using GRA.
Simple additive weighting
Much like GRA, SAW was developed by Hwang and Yoon (1981) as a way to solve MCDM problems. The underlying logic of SAW involves a similar sequence of calculations that produce standardised scores based on the ideal direction (i.e., higher or lower) of each performance indicator. Often, weights for these standardised scores are then selected based on the importance of each criterion. These scores are then summed to create weighted averages, which are then ranked in determining the ideal solution (Afshari, Mojahed, & Yusuff, 2010).
The usage of SAW has been widespread, having been previously exercised in circumstances assessing supply chain risk within pharmaceutical systems (Jaberidoost et al., 2015), the effects of cocoa combinations on various human sensory parameters (Dogan, Aktar, Toker, & Tatlisu, 2015), and wind energy resource sites (Georgiou, Polatidis, & Haralambopoulos, 2012). Although the scholarly application of SAW to sports has been very limited, it has been applied in dance member evaluations by Adela, Jasmi, Basiron, Huda, and Maseleno (2018). Researchers in this study examined several pre-selected criteria related to dance (e.g., physical flexibility, skill, deftness, and the like). Using SAW, Adela and colleagues provide findings that could aid in the selection of the “best” dancers for outlets such as professional organisations and schools.
Technique for order preference by similarity to an ideal solution
Originally conceived by Hwang and Yoon (1981) and advanced further by Yoon (1987) along with Hwang, Lai, and Liu (1993), the TOPSIS approach attempts to locate the ideal solution by parsing out the best and worst alternatives using vector-type normalisation methods. In doing so, TOPSIS produces scores that can be ranked to determine the ideal solution of a given MCDM problem, akin to GRA and SAW. For instance, across multiple studies in the context of sports, Chen and colleagues (2012, 2014) developed an evaluation model using both AHP and TOPSIS to aid in the managerial decision-making of the optimal selection of a pitcher within Chinese professional baseball. Chen et al. employed AHP to determine patterns in starting pitcher selection and created numerical weights for the selected performance indicators. To this end, both AHP and TOPSIS were utilised in the final determination of pitcher rankings. Further research by Dadelo, Turskis, Zavadskas, and Dadeliene (2014) has also employed TOPSIS in the development of a player ranking system integrating several measured attributes, such as objective performance indicators as well as expert judgment assessments submitted by coaches, within basketball. Likewise, TOPSIS has been applied to situations involving ranking the performance of German Bundesliga association football teams (Kiani Mavi, Kiani Mavi, & Kiani, 2012), as well as various urban engineering applications (Oz, Mete, Serin, & Gul, 2018; Yuvaraj & Pradeep Kumar, 2015).
Purpose
There are a vast number of methods implemented for sports ranking today. For example, Barrow, Drayer, Elliott, Gaut, and Osting (2013) estimate there are 101 different ranking techniques used in the field. ESPN, one of the largest global distributors of sports media, has compiled a library of different statistics to rate players and teams, such as Player Efficiency Rating (PER), Quarterback Rating (QBR), Basketball Power Index (BPI), and many others (Katz, 2015). Sports ranking techniques employ a variety of approaches for valuing teams, but one of the most prevalent methods is termed power ranking. This technique computes a team’s strength relative to other teams in the same league. Typically, these ratings are expressed as ranks, with the best teams being placed first overall. Within the literature, there are scores of studies that have evaluated different ranking methods and their predictive validity (Barrow et al., 2013; Burer, 2012; Langville & Meyer, 2012).
Performance analysis in eSports appears to be similar to modelling performance in traditional sports (e.g., soccer, basketball, baseball, and the like), as each rely on features related to the athletes involved and the game itself, wherein players’ performances impact the outcome. In this context, the purpose of our study is to gain a more comprehensive understanding of the underlying factors that determine various eSports teams’ performances within the realm of the popular MOBA game, Dota 2. eSports has a great advantage for game analytics over classic sport games due to the granularity in providing structured information about matches that are held online (Wagner, 2006). The use of MCDM techniques is also not foreign to the realm of eSports, or Dota 2 for that matter. Aryanata, Rahadi, and Sudarmojo (2017) utilised AHP in predicting performance of Dota 2 matches. The authors employed several metrics to predict match results, such as experience per minute, gold per minute, matchmaking ratio points, outcomes of the last three head-to-head matches, and the overall results of the last 10 matches. Findings from their AHP analysis provided accurate depictions of match prediction using the selected a priori parameters. Thus, our study seeks to investigate the influence of various criteria on Dota 2 teams’ performance by applying several MCDM models to offer insights into the performance analysis of eSports.
Method
Data collection and performance indicators
Data for the 2017–2018 Dota 2 Professional Circuit were collected from two primary sources, DOTABUFF (https://www.dotabuff.com) and datDota (https://www.datdota.com). We utilised a series of performance indicators in structuring our power ranking system for each team. Specifically, we employed all available, composite player statistics from the public Dota 2 community statistical database, DOTABUFF. In all, these comprised a total of 17 variables, which included: 1) number of matches played, 2) winning percentage, 3) kill-death-assist ratio, 4) kills, 5) deaths, 6) assists, 7) last hits, 8) denies, 9) gold per minute, 10) experience per minute, 11) points, 12) majors won, 13) majors qualified, 14) minors won, 15) minors qualified, 16) match wins, and 17) match losses. These statistics were compiled to create team averages for the selected metrics. All players who participated during the 2017-2018 Dota 2 ranked season were included in our analysis.
We also included additional indicators of team strength obtained from the professional Dota 2 statistical catalogue, datDota.
Specifically, we incorporated team ratings as determined by Elo (k = 32) and Elo (k = 64), as well as Glicko-1 and Glicko-2 methods. Elo ratings, developed by Arpad Elo (1961) in the context of chess, are computed using the results of a previous number of (k) matches. These ratings have been widely used in the context of sports in evaluating team strength ratings and assessing outcome predictions of NBA, NFL, MLB, and NHL franchises (FiveThirtyEight, 2019; Karminsky & Polozov, 2016). More recently, Glicko-1 ratings conceived by Glickman (1995) and described as a “special case of Elo” (p. 1) have also been implemented into the purview of sporting events. The primary differentiator of Glicko ratings is the accounting of a team’s standard deviation, termed ratings deviation (Glickman, 1995). The second iteration of these ratings, namely Glicko-2 ratings, attempts to further improve upon predictive capability by factoring in a team’s volatility (i.e., likelihood of inconsistent performance; Glickman, 2013). Teams with no earnings and where team strength data were unavailable were excluded from our dataset. A list of all 21 performance indicators used for our team ranking system is included in Table 1. A summary of statistics obtained from each player, as well as team strength markers are provided in Table 2 and illustrated in Fig. 1.
Performance indicators used in the present study
Performance indicators used in the present study
Average performance statistics of included teams
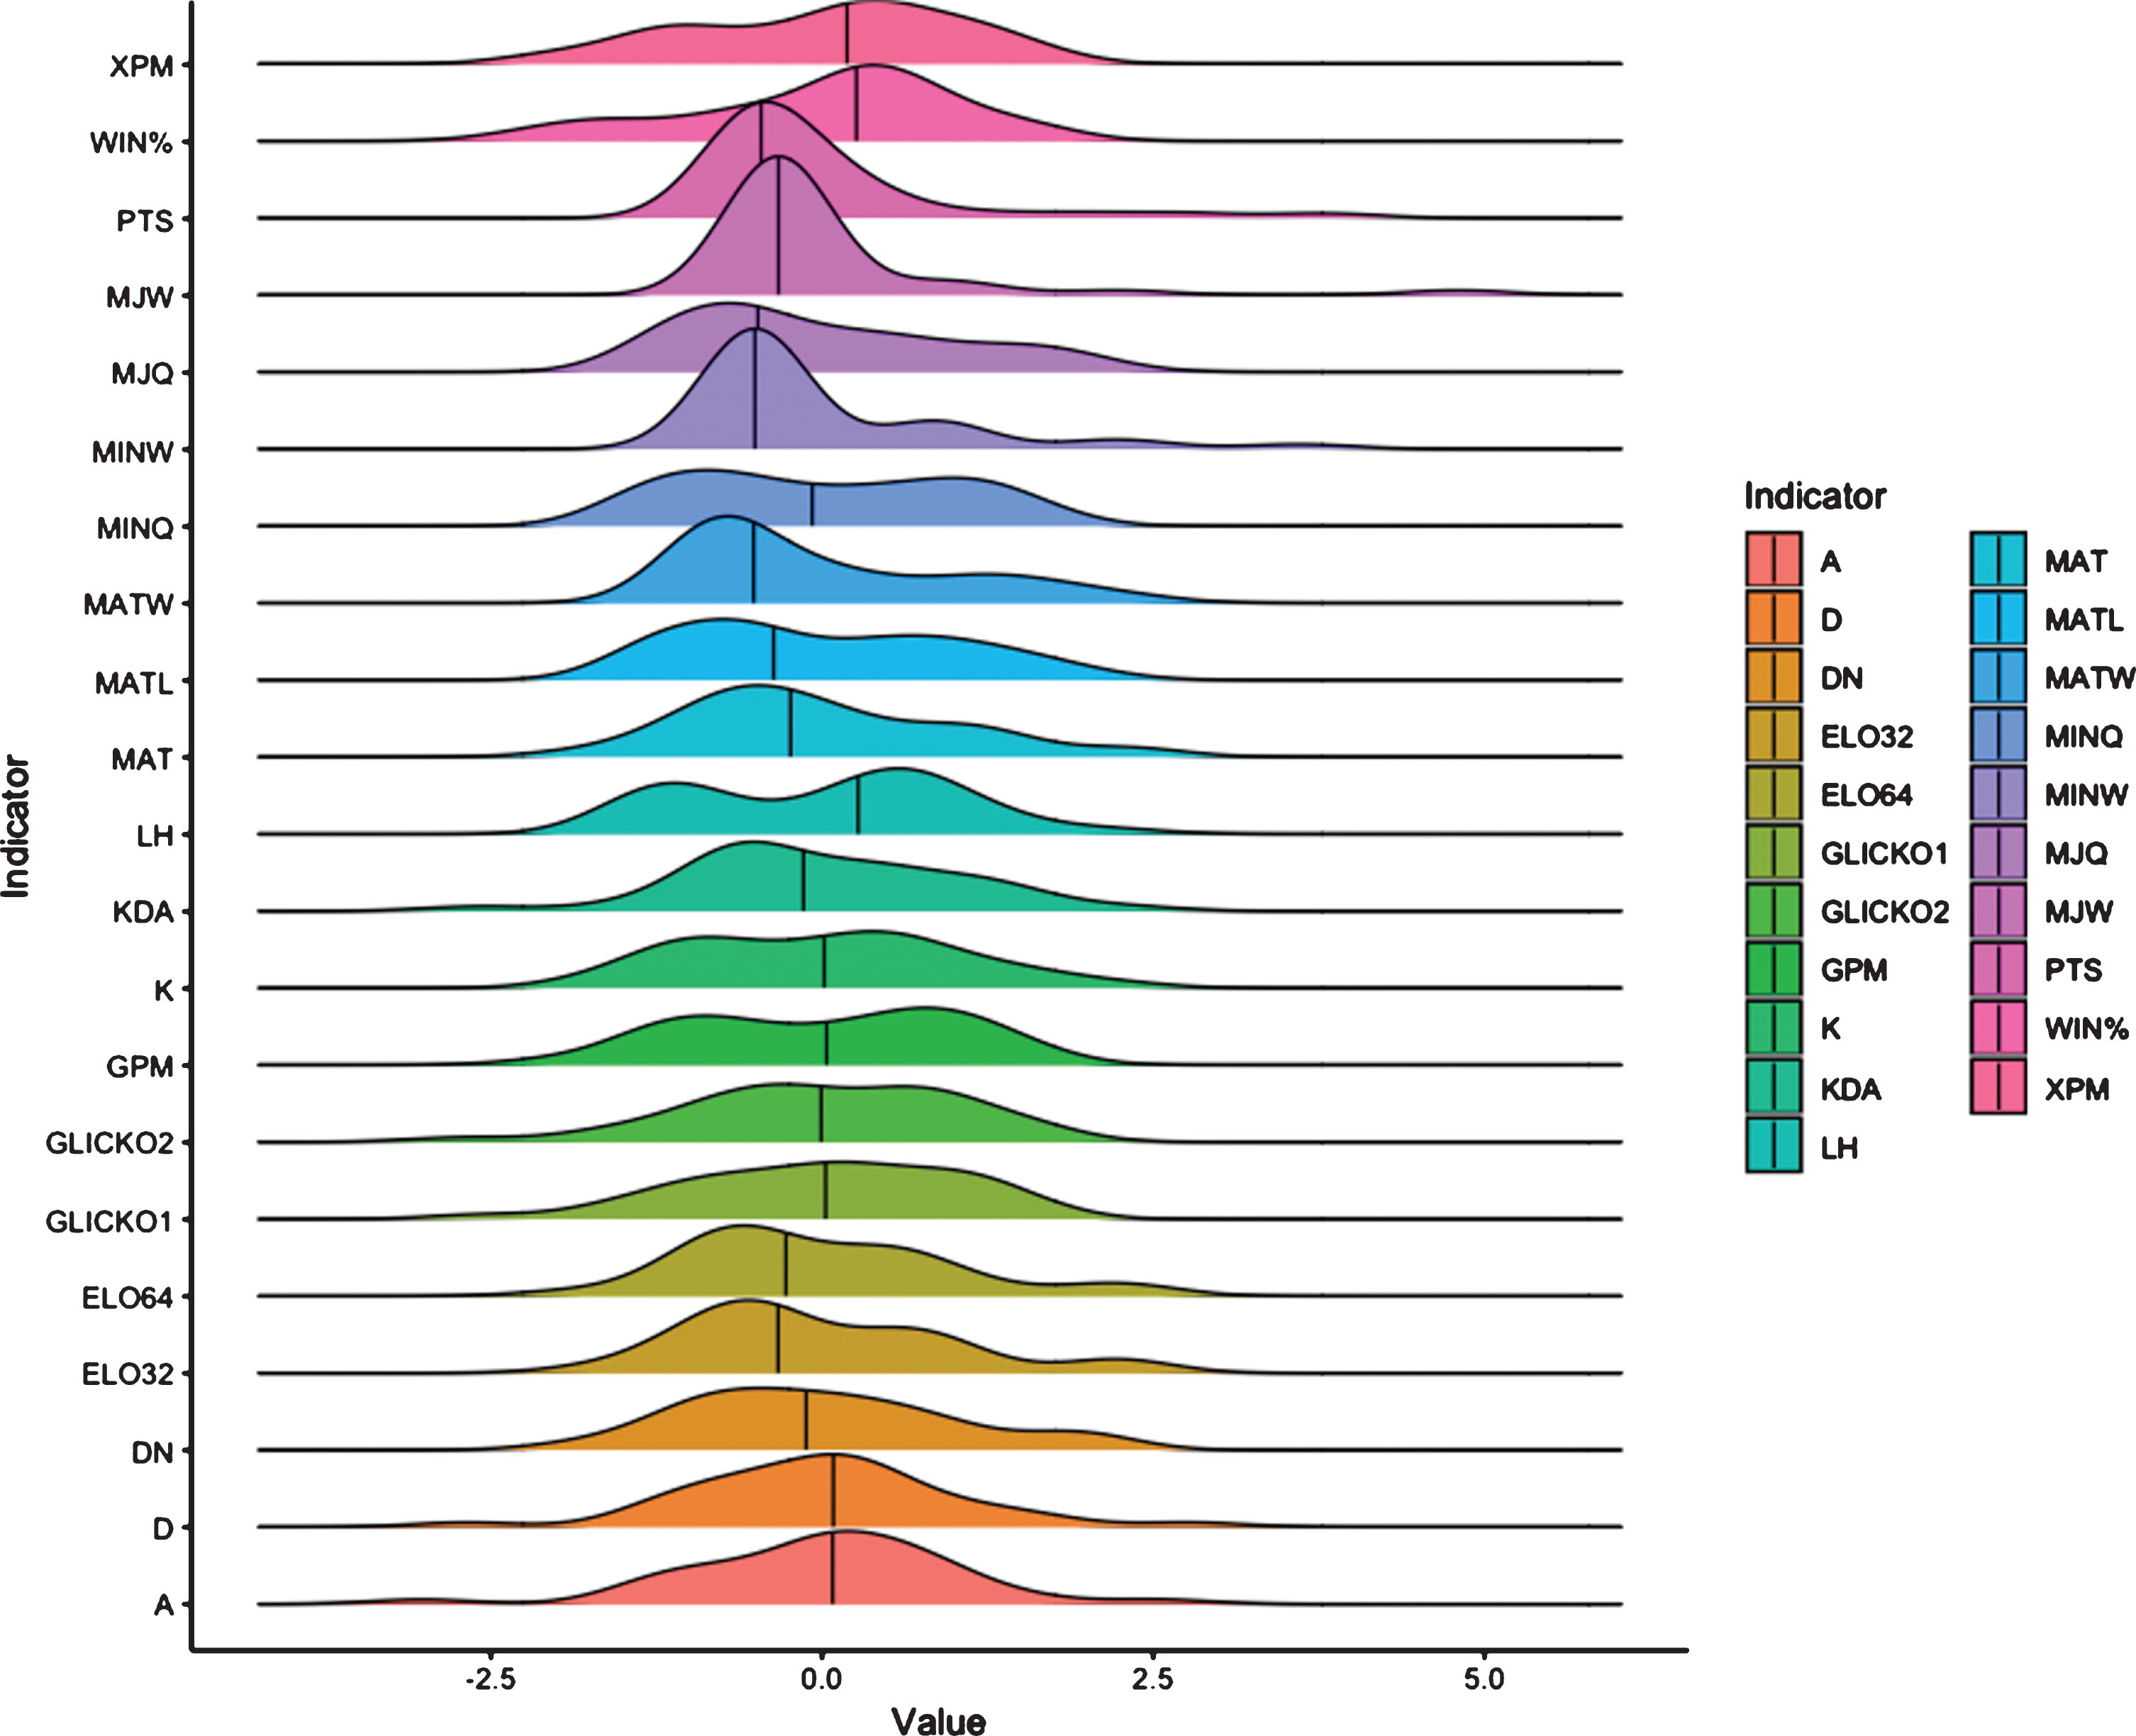
Ridgeline plots showing the distributions of standardised team statistics for the 2017–2018 Dota 2 Professional Circuit season. Black lines represent the median scores.
To create our power ranking of Dota 2 teams, we used a revised version of the hybrid MCDM model proposed by Wang, Zhu, and Wang (2016). As mentioned previously, MCDM employs a series of performance attributes to determine the ideal solution out of a number of selected alternatives (Rolland, 2006). This is accomplished by aggregating the chosen criteria to produce a single numerical value that represents the ideal solution (Vu & Li, 2014). These values for alternatives are then ranked in MCDM to select the best alternative (Martinez & Herrera, 2006). Wang et al. have argued that a method that combines several MCDM methods, namely GRA, SAW, and TOPSIS, tends to produce a more accurate depiction and subsequent ranking of the alternatives presented. Wang et al.’s model, which brings together the aforementioned techniques, has been shown to produce similar outcomes as other singular forms of MCDM, such as AHP, ELECTRE, multi-objective optimisation on the basis of ratio analysis (MOORA), along with GRA, SAW, and TOPSIS among others. In the present study, we simplified Wang et al.’s hybrid model by only using the average numerical scores obtained from the output of the GRA, SAW, and TOPSIS analyses. This method of analysis was performed since we did not assign any specific weights to the performance indicators (i.e., all performance statistics were treated equally). A summary of each of the selected MCDM procedures is provided in Table 3.
Review of MCDM Methods Used in Wang et al. (2016) Hybrid Model
Review of MCDM Methods Used in Wang et al. (2016) Hybrid Model
Note. 1Formulas and steps obtained from Pradhan (2018). 2Formulas and steps obtained from Wang et al. (2016).
Statistical analyses were performed in R Studio for macOS (Version 1.1.463) using the topsis package (Yazdi, 2013) and Microsoft Excel. Each MCDM model was generated separately and then aggregated using a modified version of Wang et al.’s (2016) procedure, as described previously, to produce the hybrid analysis. The full results of the hybrid MCDM analysis are presented in Table 4. Overall, the hybrid MCDM analysis ranked Virtus.pro as the top team during the 2017-18 Dota 2 Professional Circuit season, followed by Team Secret, Team Liquid, PSG.LGD, and OG, respectively. Digital Chaos was ranked as the last team in the hybrid analysis. Across each of the MCDM component analyses (i.e., GRA, SAW, and TOPSIS), Virtus.pro was ranked as the top team. Digital Chaos was categorised as the worst performer in all but the TOPSIS analysis, in which the team was ranked 34th (i.e., second-to-last; scoring slightly higher than the team, Vega Squadron, with a TOPSIS score of 19.31% compared to 18.74%). Among the actual placement of the teams based on seasonal performance, the hybrid model accurately identified the top four teams, albeit placing them in a different order apart from Virtus.pro.
Hybrid MCDM ranking results for Dota 2 professional circuit 2017–2018 season
Hybrid MCDM ranking results for Dota 2 professional circuit 2017–2018 season

Spearman rank-order correlations between hybrid rankings and rankings produced by other MCDM methods and selected performance indicators. R values refer to Spearman R s or rho (ρ) values. Coloured lines represent trend lines. Grey shaded regions display 95% confidence intervals.
Wilcoxon Signed-rank tests comparing hybrid MCDM model rankings and rankings produced by other methods and selected performance indicators
Note. n = 35. Wilcoxon V-statistic refers to the sum of positive ranks. 95% CI refers to confidence intervals based on Walsh averages. For further description of V values and Walsh averages, see Geyer (2003).
This study aimed at crafting a power ranking model for seasonal performance in the popular MOBA video game, Dota 2. Specifically, we employed a modified version of Wang et al.’s (2016) MCDM hybrid model, which utilised a combination of GRA, SAW, and TOPSIS, to rank teams during the 2017-18 Dota 2 Professional Circuit season. Results from the hybrid analysis are consistent with other forms of performance evaluation, such as Elo and Glicko ratings. With respect to top performing teams, our ranking system offered an accurate depiction of actual season standings. Nevertheless, our study did have several limitations.
Compared to physical sports, eSports prediction involves even more information, as the selection of characters could also be a factor that influences game results. For instance, each character in the game will have its own abilities, which could lead to different competitive advantages and disadvantages due to specific match-ups (Yang, Qin, & Lei, 2016). While the current study did not consider the impact of character selection, future research could examine how such choices influence eSports team performance. Although the present study utilised data from a MOBA-type game, there are other genres that might require different forms of power rankings based on their characteristics. For instance, games like Counter-Strike rely on other technical abilities as opposed to characters that one selects, such as the ability of players to know which weapons to use, how to control them, and where to be on the map relative to their teammates and opponents. These sets of skills involved in effective performance are what differentiates such titles from MOBA games like Dota 2.
Power ranking brings in many new opportunities to assist in detecting which players and teams have the most potential for performance, as well as marketability. In comparison to traditional sports athletes in leagues, such as the NBA, eSports athletes are quite different from a content standpoint. For example, LeBron James of the Los Angeles Lakers or Stephen Curry of the Golden State Warriors needed to first develop their performance on the court before acquiring sponsors and fans. In eSports, both performance and marketability content can be created equal. In many instances, an eSports athlete might have a better career streaming their games via Twitch and other related sites compared to competing and winning prize money with their team in league play. An eSports player does not have to wait to win titles in order to monetise their skills within games. In essence, the community defines what is relevant by promoting exciting content.
To that end, an influx of professional teams from traditional sports have joined the eSports market to further their already sizeable investments. The Sacramento Kings, Golden State Warriors, Philadelphia 76ers, Cleveland Cavaliers, and Houston Rockets have all endorsed their own LoL teams (Chikhani, 2018). As eSports continue to evolve, practitioners face managerial challenges that are similar to those in traditional sport, particularly in areas of in-game performance. Forecasting performance plays an important role in sports, with nearly every major professional sports team containing an analytics department. These analysts use player statistics to predict future games and attempt to enhance performance through draft selections or roster adjustments.
As Makarov, Savostyanov, Litvyakov, and Ignatov (2018) assert, the rapid maturity of eSports serves as a guide to gambling businesses and bookmakers that will inevitably turn their attention to such events. With thousands of bookmakers accepting wagers on sporting events around the world today, gambling in sports is more popular than ever before. For example, during the National Collegiate Athletic Association’s (NCAA) Basketball Tournament, March Madness, the American Gaming Association estimated that approximately 50 million Americans wagered $8.5 billion in 2019 (Axson, 2019). Similarly, eSports bookmakers need access to data in order to compile statistics to accurately set odds and make match predictions that facilitate gambling in real time. Several other issues identified by Grove (2016) also become apparent in the regulation of eSports gambling, such as specifically how to enforce a global industry like eSports, how skin gambling and in-game casinos will be treated, the involvement of minors in eSports, and equating eSports betting to traditional sports gambling.
In general, power rankings can apply to many sports, but may also be used for teams playing in specific tournaments, such as university championships. With the massive success of the eSports market, ESPN has begun broadcasting the Collegiate eSports Championship (CEC). Various college teams will compete in games like Overwatch, Hearthstone, among others (Wilson, 2019). There will also be a corollary pre-game show, called College eSports Championship: Countdown, that will air weekly. Consumers will be able to tune in through ESPN3, Twitch, YouTube, and Twitter. Considering the variety of other titles, the results of this study could also be adapted to other games in eSports. Future investigations could examine the relationships between the use of different parameters and actual championship results through Wang et al.’s (2016) hybrid model and other MCDM techniques.
In the light of recent development in the gambling industry, such inputs can help bookmakers and sponsors better assess the profitability of eSports athletes and increase brand visibility. For sponsorship and endorsements, in particular, such a data driven approach can further assist in assessing the potential return on interest (ROI) for different eSports teams. Moreover, these findings may even aid in team contracts and endorsement deals, in which eSports teams and sponsors can utilise a combination of MCDM techniques to compare and contrast players. eSports athletes careers often begin at a very early age and thus, accurate power rankings can potentially redefine the way such deals are negotiated in the long run. Organisations may even be able to craft well-informed prize pools based on in-game predictive performance. Such analyses are also vital for a team, its players, and management in terms of developing tactics and increasing performance. We hope our study provides future directions for research and insights for practitioners in guiding both in-game strategy and understanding Dota 2 performance.