
Abstract
Background
Compensatory mechanisms in Parkinson's disease (PD) are thought to explain the temporal delay between the beginning of the neurodegenerative process and the appearance of clinical signs. The enhanced structural integrity of the corticospinal tract was previously suggested as one of these mechanisms.
Objective
To understand the relations between corticospinal tract integrity and the anatomical, clinical, electrophysiological, and genetic PD characteristics.
Methods
We analyzed diffusion tensor imaging (DTI) fractional anisotropy (FA) data from 40 genotyped patients with PD (18 without known genetic cause, 11 with LRRK2-PD and 11 with GBA-PD) who were candidates for subthalamic deep brain stimulation (STN-DBS) and from 25 healthy, age-matched, controls.
Results
PD is associated with higher corticospinal FA values (p < 0.001) that are negatively correlated with the disease duration (p = 0.032), confirming previous results. Higher FA values are negatively correlated with cerebral grey matter volumes (p < 0.001) but not with the motor or cognitive PD characteristics, or with the subthalamic beta-oscillatory activity measured intra-operatively. Increased corticospinal FA values are strongly affected by the genetic etiology of PD, with higher values in the monogenic forms of the disease (p < 0.001). The compensatory index, calculated by dividing the corticostriatal FA value by the cerebral grey matter volume, is highest in GBA-PD (p < 0.001) at the time of evaluation for STN-DBS.
Conclusions
The genetic etiology of PD strongly shapes corticospinal tract changes along with disease-duration and cerebral grey matter atrophy. The changes may serve as compensatory mechanism.
Plain language summary
People with Parkinson's disease (PD) start to exhibit symptoms years after changes in their brain have begun, which may be explained by compensatory mechanisms. One possible compensatory mechanism is enhanced signal transduction in the corticospinal tracts (CST) linking the cortex and the spinal cord. The goal of the study was to understand the relations between CST integrity and the anatomical, clinical, electrophysiological, and genetic characteristics of PD. We employed diffusion tensor imaging (DTI) fractional anisotropy (FA) to assess the integrity of the CST. We analyzed data from 40 PD patients with motor fluctuations and preserved cognition (18 without known genetic cause, 11 with mutations in LRRK2 and 11 with mutations in GBA1) who were candidates for subthalamic deep brain stimulation (STN-DBS) and from 25 healthy, age-matched, controls. PD patients had significantly higher CST FA, indicating greater integrity of the corticospinal tracts. CST FA was higher in patients with shorter disease duration and with reduced grey matter. CST FA was not correlated with motor scores, cognitive assessment or electrical activity during the DBS surgery. The higher CST FA is prominent in patients who have PD due to a mutation in a single gene. Specifically, patients with mutations in the GBA1 gene had the highest ratio of CST FA to grey matter. PD patients who are evaluated for DBS have CST alterations that are affected by their genetics, disease duration and amount of grey matter. These findings may help to better understand the mechanisms of compensation in this stage of PD.
Introduction
The motor symptoms in Parkinson's disease (PD) may emerge decades after the beginning of neurodegenerative processes. 1 This lag is attributed to redundancy and compensatory mechanisms, within or outside the basal ganglia, in the early phase of PD. Compensatory processes within the basal ganglia possibly include changes in dopamine metabolism and axonal sprouting.2–4 In the cortex, and especially in the frontal and motor cortices, the compensatory processes include neuronal synchronicity, 5 improved functional connectivity, 6 and increased plasticity.7–9 Beyond the motor cortices, it has been suggested that enhanced structural integrity of the corticospinal tract (CST) may also serve as a compensatory process in early PD.10–16
Data on the structural integrity of the CST is mainly derived from measurements of fractional anisotropy (FA) and mean diffusivity (MD) in diffusion tensor imaging (DTI) studies. 10 In early PD, higher FA values in the CST were observed10–13 and interpreted as compensatory changes.10,12 The increased CST FA values were found to subside along the course of the disease 12 but, since in PD the pace of degeneration varies greatly between patients, it is unclear at what clinical stage of the disease increased CST integrity diminished. In addition, the clinical, anatomical, and genetic factors that modulate this possible compensatory process remain obscure.
Here, we analyzed DTI data from brain MRI of healthy controls and genotyped PD patients to study the structural integrity of the CST and its relation to clinical, genetic, volumetric, and electrophysiological characteristics of PD. Since the true onset of neurodegeneration in PD is unknown, 17 we chose to focus on PD cohort of patients at the same clinical stage of the disease, i.e., patients who are suitable candidates for subthalamic deep brain stimulation (STN-DBS). All these patients suffer from motor fluctuations, have good levodopa response and maintain largely preserved cognition. This unique cohort enables deciphering the predictors for CST increased integrity in a clinically homogenous population. Revealing possible compensatory mechanisms in this population of patients may assist, in the future, predicting the procedure outcome more accurately.
Methods
Participants
Patients with PD who underwent DBS surgery at Hadassah Medical Center (Jerusalem, Israel) between January 2014 and January 2023 were recruited to this study. Inclusion criteria included clinically established PD, 18 known genetic status (see below) and available DTI data. Preoperative data sets included gender, age, age at onset of symptoms, Unified Parkinson's Disease Rating Scale (UPDRS) Part III off medications and on medications, and Addenbrooke's cognitive examination (ACE) that were documented by the neurologist and neuropsychologist on the day of clinical evaluation for DBS surgery. Control subjects with similar age and sex (p = 0.89 and p = 0.78 respectively) were also recruited and performed MR imaging. The study was approved by the local institutional review board committee, and participants signed an informed consent (0339-21-HMO for PD, 0668-12-HMO for controls).
Genetic status
Results of genetic tests were available from the ROPAD study (ClinicalTrials.gov Identifier: NCT03866603) as previously described. 19 Included in the study were patients with either a negative genetic panel (idiopathic PD, iPD), pathogenic variant in LRRK2 (LRRK2-PD) or pathogenic variants in GBA1 (GBA-PD).
Imaging data acquisition
MRI data was acquired before the DBS surgery on 3-T scanners (Trio; Siemens, Erlangen, Germany. Skyta; Siemens, Erlangen, Germany. Philips; Healthcare, Best, the Netherlands) using a 32-channel standard head-coil. Anatomical MRI sequences included high-resolution T1-weighted images (Trio, Skyra: minimum echo time [TE], flip angle 9°, repetition time [TR] = 1360 ms, voxel size of 1 × 1 × 2 mm; Philips: echo time [TE] = 28 ms, flip angle 90°, repetition time [TR] = 600 ms, voxel size of 0.4 × 0.4 × 1.65 mm). Additional anatomical sequences were included for patients for clinical purposes but are not included in this study.
DTI data was acquired using a diffusion-weighted imaging sequence (Skyra: single-shot, spin-echo, TE = 102 ms, TR = 9500 ms, FOV = 260 × 260 mm, matrix = 128 × 128, 52–60 axial slices, 2 mm thick slices, b = 0 and b = 1000 s/mm2, 30 different diffusion directions; Trio: single-shot, spin-echo, TE = 102 ms, TR = 8700 ms, FOV = 260 × 260 mm, matrix = 128 × 128, 52–60 axial slices, 2 mm thick slices, b = 0 and b = 1000 s/mm2, 30 different diffusion directions; Philips: single-shot, spin-echo, TE = 88 ms, TR = 3890 ms, FOV = 224 × 224 mm, matrix = 128 × 128, 52–60 axial slices, 2 mm thick slices, b = 0 and b = 1000 s/mm2, 64 different diffusion directions).
To prevent motion artifacts due to tremor or dyskinesia, most PD patients (33/40) underwent MRI under general anesthesia. Mean motion for all participants was 0.898 ± 0.518 mm in xyz direction and there was no significant motion difference between the control and the PD groups (p = 0.249). In both groups, no significant correlation was found between motion and FA values (CTL: p = 0.999; PD: p = 0.807).
DTI data analysis
DTI image processing and analysis was performed using the mrVista package http://vistalab.stanford.edu/software on Matlab R2012b. Preprocessing included removing Eddy current distortions and subject motion. Data was registered and aligned to the T1 image using mutual information algorithm. Fiber tracking of the CST was performed using Automated Fiber Quantification (AFQ) for 20 automatic generated tracts. 20 The tensors were fitted using a least-squares algorithm. The eigenvalue decomposition of the diffusion tensor was computed. Measures of the mean diffusivity (MD), fractional anisotropy (FA), and diffusion parallel to (λ‖, AD) and perpendicular to (λ⊥, RD) the principal fiber direction were derived. Mean FA, MD, RD and AD of 100 segments along the CST was calculated for each participant.
Volumetric analysis
T1 sequences from participants were segmented using VolBrain automated tool. 21 Relative cerebrum grey and white matter volumes in addition to the relative volume of the precentral gyrus were calculated in comparison to the entire intracranial cavity (Supplementary Figure 1).
Electrophysiological data
Extracellular electrophysiological data from the subthalamic nucleus that was recorded during the DBS surgery was obtained, and the power of beta-oscillatory activity was calculated as previously described. 22
Statistical analysis
Chi-square test and two-tailed Student's t-test were used for comparison between baseline clinical characteristics. Two-tailed Student's t-test, analysis of variance (ANOVA) and analysis of covariance (ANCOVA) were used to analyze the relation between FA and other factors. Correlation was evaluated using the square of the Pearson product moment correlation coefficient and the derived P-value. Alpha level for all tests was 0.05.
Results
PD patients have higher CST FA than controls
The analyzed database included 40 patients with PD and 25 healthy controls (CTL). The mean age of participant at the time of the study (mean ± SD in years, PD: 62.0 ± 8.1, CTL: 61.7 ± 10.3, p = 0.89) and the sex distribution within each group (M/F, PD: 29/11, CTL: 17/8, p = 0.70) was similar. In 18 PD patients no pathogenic variants were demonstrated in the tested genes (iPD). LRRK2 pathogenic heterozygous were demonstrated in 11 participants with PD (all heterozygous to the G2019S mutation). Pathogenic variants in GBA1 were demonstrated in 11 participants with PD (8 heterozygous to N370S, one heterozygous to R496H, one compound heterozygous to N370S/L444P and one compound heterozygous to N370S/R496H). Patients with monogenic PD had shorter disease duration (Table 1, iPD vs. LRRK2-PD: p = 0.009 and iPD vs. GBA-PD: p = 0.004). Patients with LRRK2-PD had lower UPDRS III scores during the OFF state (iPD vs. LRRK2-PD: p = 0.012) and cognitively were better preserved (ACE score iPD vs. LRRK2-PD: p = 0.024). Importantly, at the time of evaluation GBA-PD were not more impaired cognitively than patients with iPD (ACE score iPD vs. GBA-PD: p = 0.41).
Clinical characteristics of participants.
In case of missing data, the number of participants with available data is marked in parentheses. Significant p values are (<0.05) are marked with a cross. iPD, idiopathic Parkinson's disease; M, male; F, female; SD, standard deviation; ACE, Addenbrooke's cognitive examination; UPDRS III, motor Unified Parkinson's Disease Rating Scale; LEDD, levodopa equivalent daily dose.
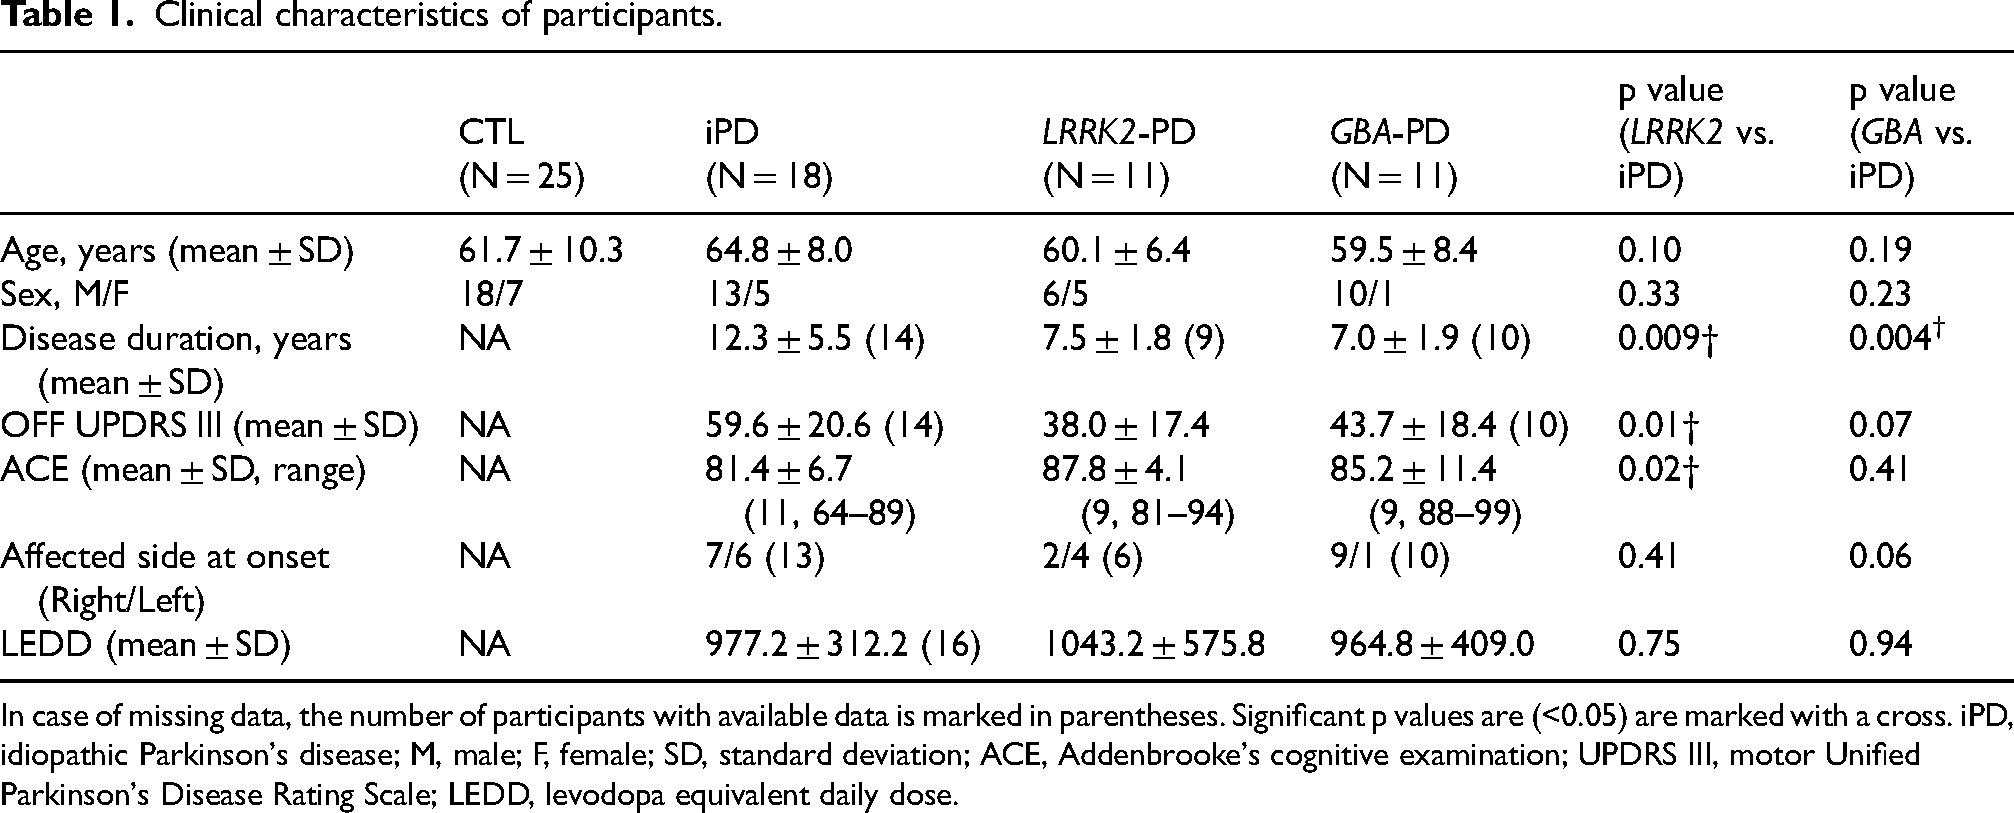
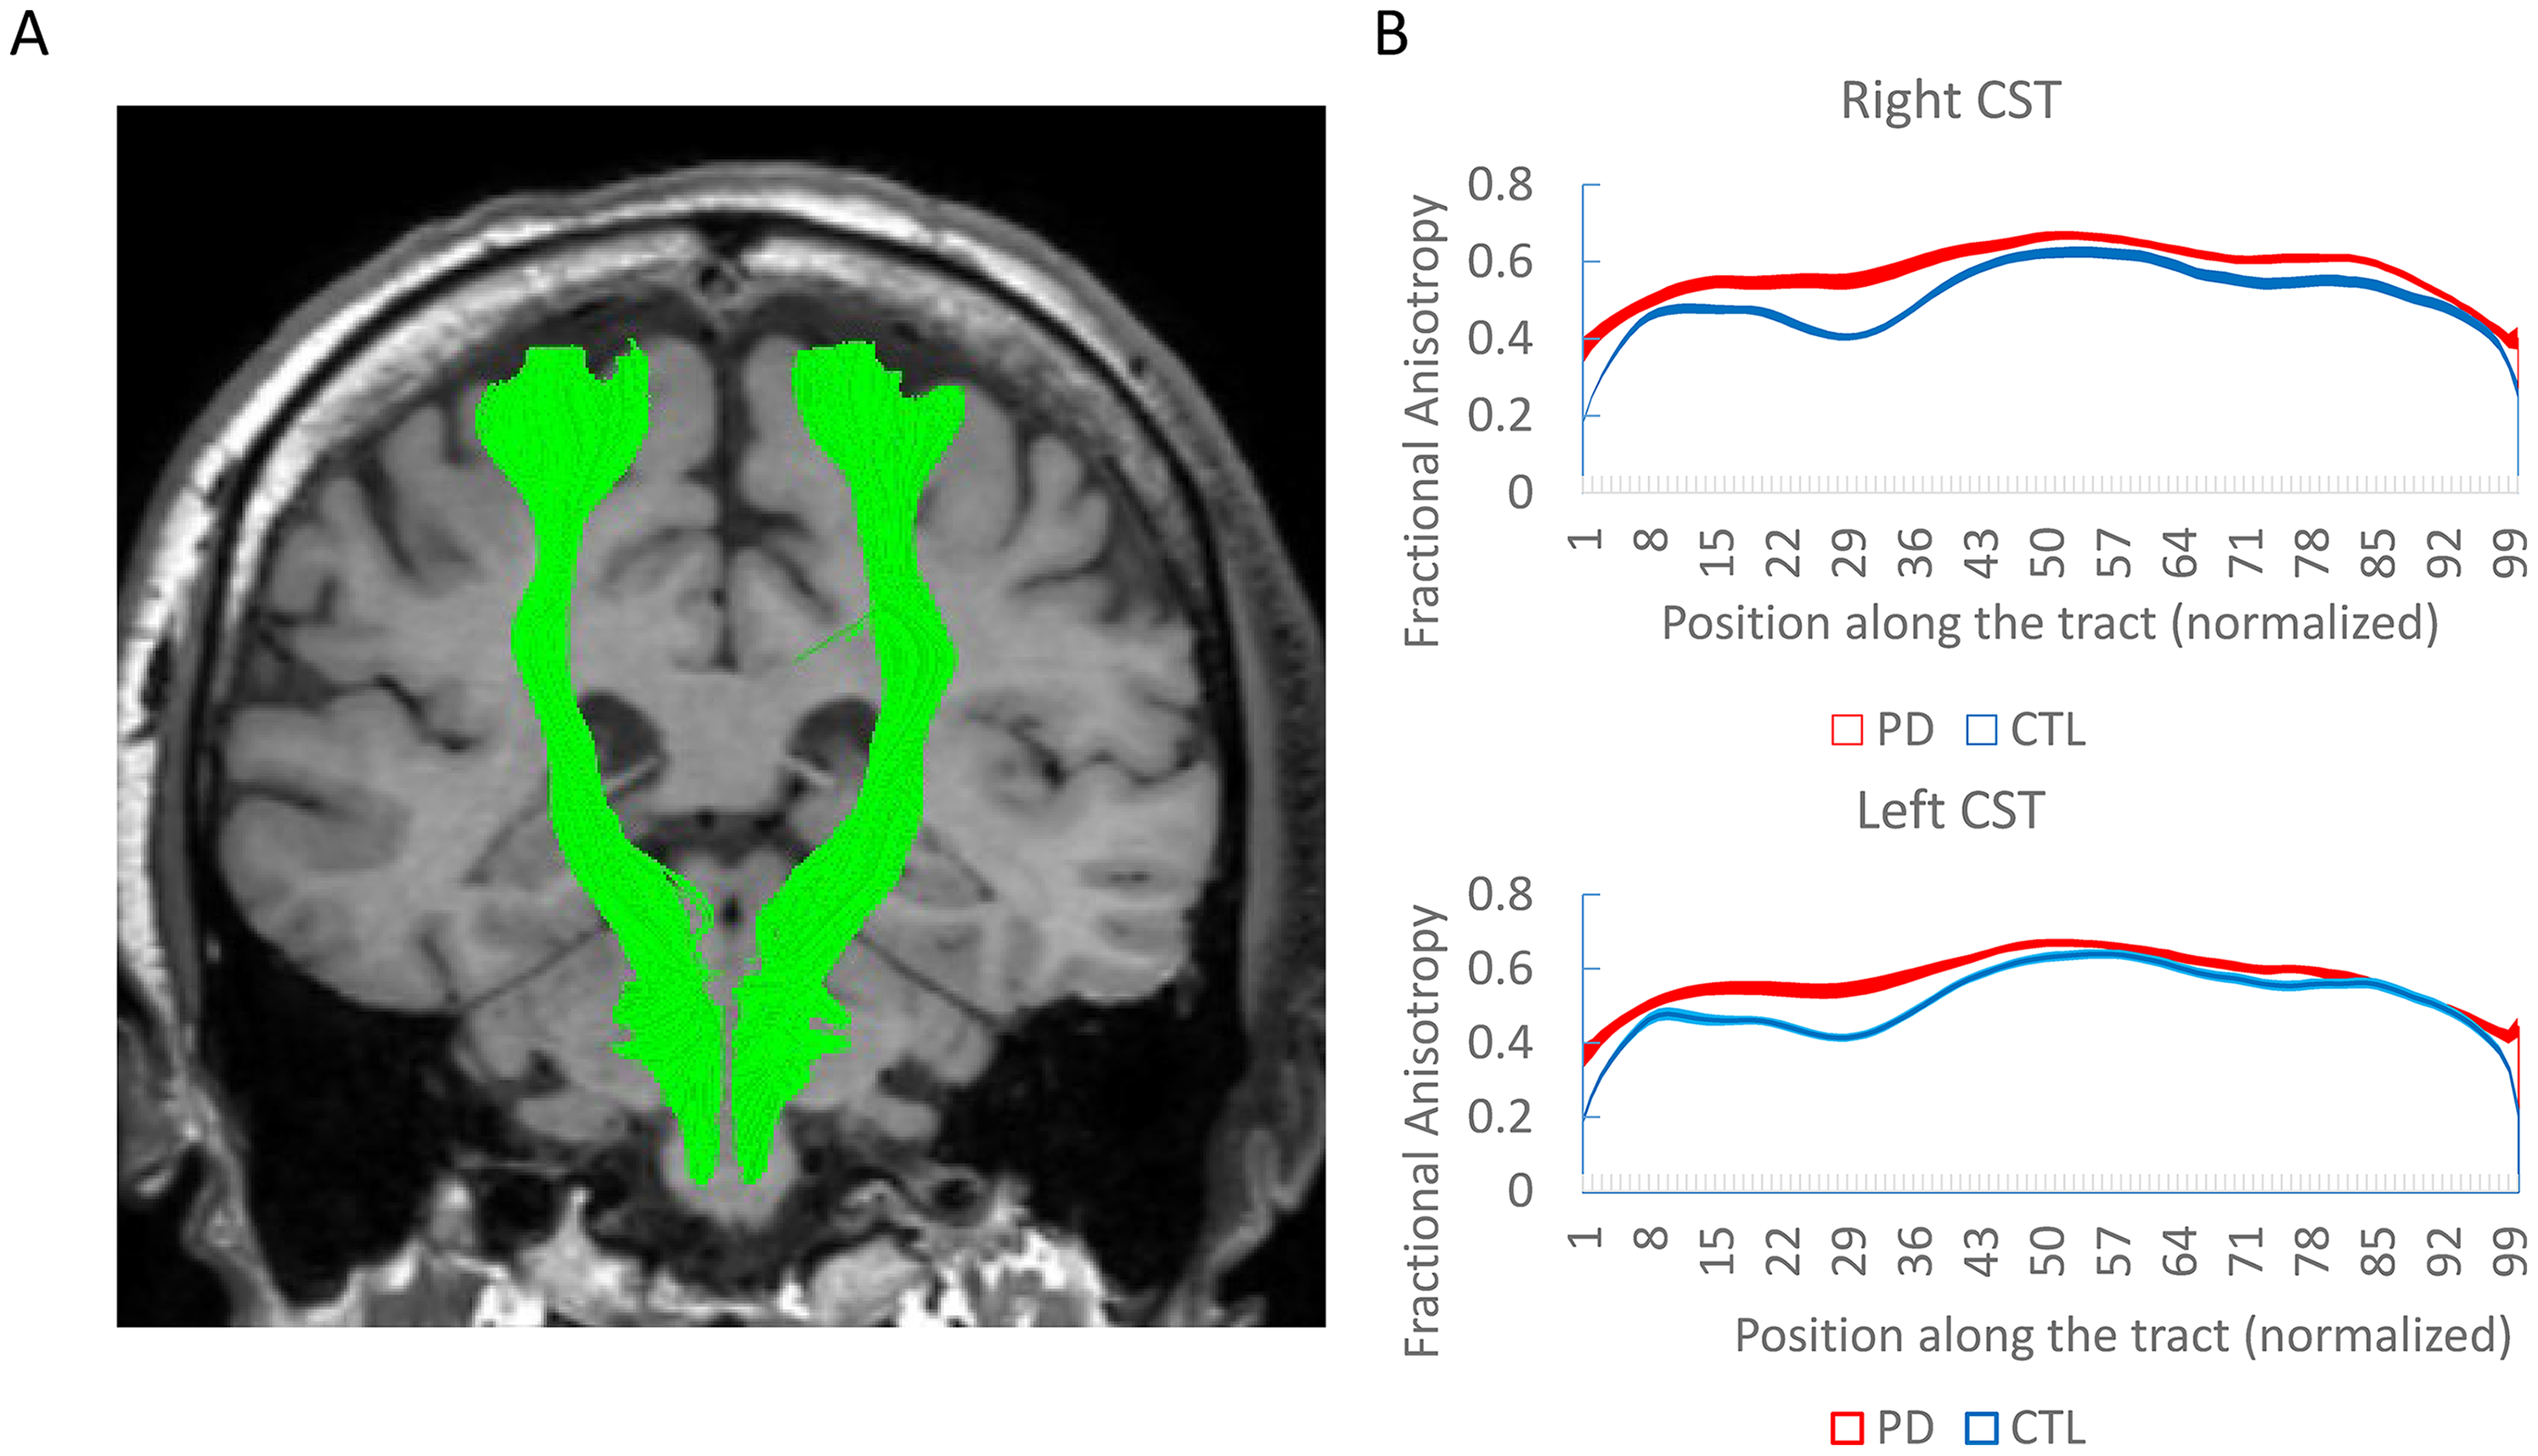
CST fibers were successfully generated and analyzed in both CTL and PD groups (Figure 1). We first validated previous observations regarding increased CST FA in PD patients relatively to controls. In our database patients in the PD group had higher FA values (Figure 2A, PD: 0.57 ± 0.07, CTL: 0.51 ± 0.05, p < 0.001). PD patients also had lower values of MD (Supplementary Figure 2, PD: 0.73 ± 0.05, CTL: 0.82 ± 0.15, p < 0.001), RD (PD: 0.46 ± 0.07, CTL: 0.57 ± 0.14, p < 0.001) and AD (PD: 1.25 ± 0.07, CTL: 1.33 ± 0.19, p < 0.01). When analyzing the different CST segments separately, mean FA value in PD was numerically higher than controls in 100/100 segments in the right CST and in 93/100 segments in the left CST, with the rest 7/100 segments having minimal, non-significant difference (all p values > 0.40). Statistically, FA was significantly higher in PD patients than CTL in 94/100 segments in the right CST and in 69/100 segments in the left CST. All these results suggest true higher corticospinal fiber integrity in PD. To evaluate whether this difference is specific for the CST, we analyzed 18 additional tracts, finding a significant difference between CTL and PD only in the right thalamic radiations (Supplementary Table 1).
Diffusion tensor imaging along the corticospinal tract (CST). (A) Demonstration of both CST in a patient from the study. (B) Mean fractional anisotropy along the CST in PD patients and controls (CTL) showing significant difference. Shadows represent standard error.
Corticospinal tract (CST) integrity and grey matter volumetric analysis of PD patients and controls (CTL). A) PD patients have higher CST fractional anisotropy (FA) values (A) and lower cerebrum grey matter volume (B) relatively to healthy controls. C) CST FA values in PD patients are negatively correlated with the cerebrum grey matter volume.
CST FA in PD patients is negatively correlated with grey matter volume and disease duration
To reveal possible relationships between increased FA in PD patients and other anatomical brain parameters of the disease we studied brain volumes. While the total cerebral volume was overall similar in PD and controls (Supplementary Figure 3, PD: 36.8 ± 1.53, CTL: 36.7 ± 1.37, p = 0.778), patients with PD had lower relative cerebral grey matter volume (Figure 2B, PD: 18.4 ± 1.66, CTL: 19.5 ± 1.18, p < 0.001). In PD patients, CST FA values were negatively correlated with the cerebral grey matter volume (Figure 2C, p < 0.001) so that patients with increased grey matter atrophy demonstrated higher CST integrity. CST FA was also negatively correlated with motor cortex volume (R2 = 0.146, p = 0.016) but not with white matter volume (Supplementary Figure 3). In the control group there was no correlation between CST FA and grey matter volume (p = 0.431).
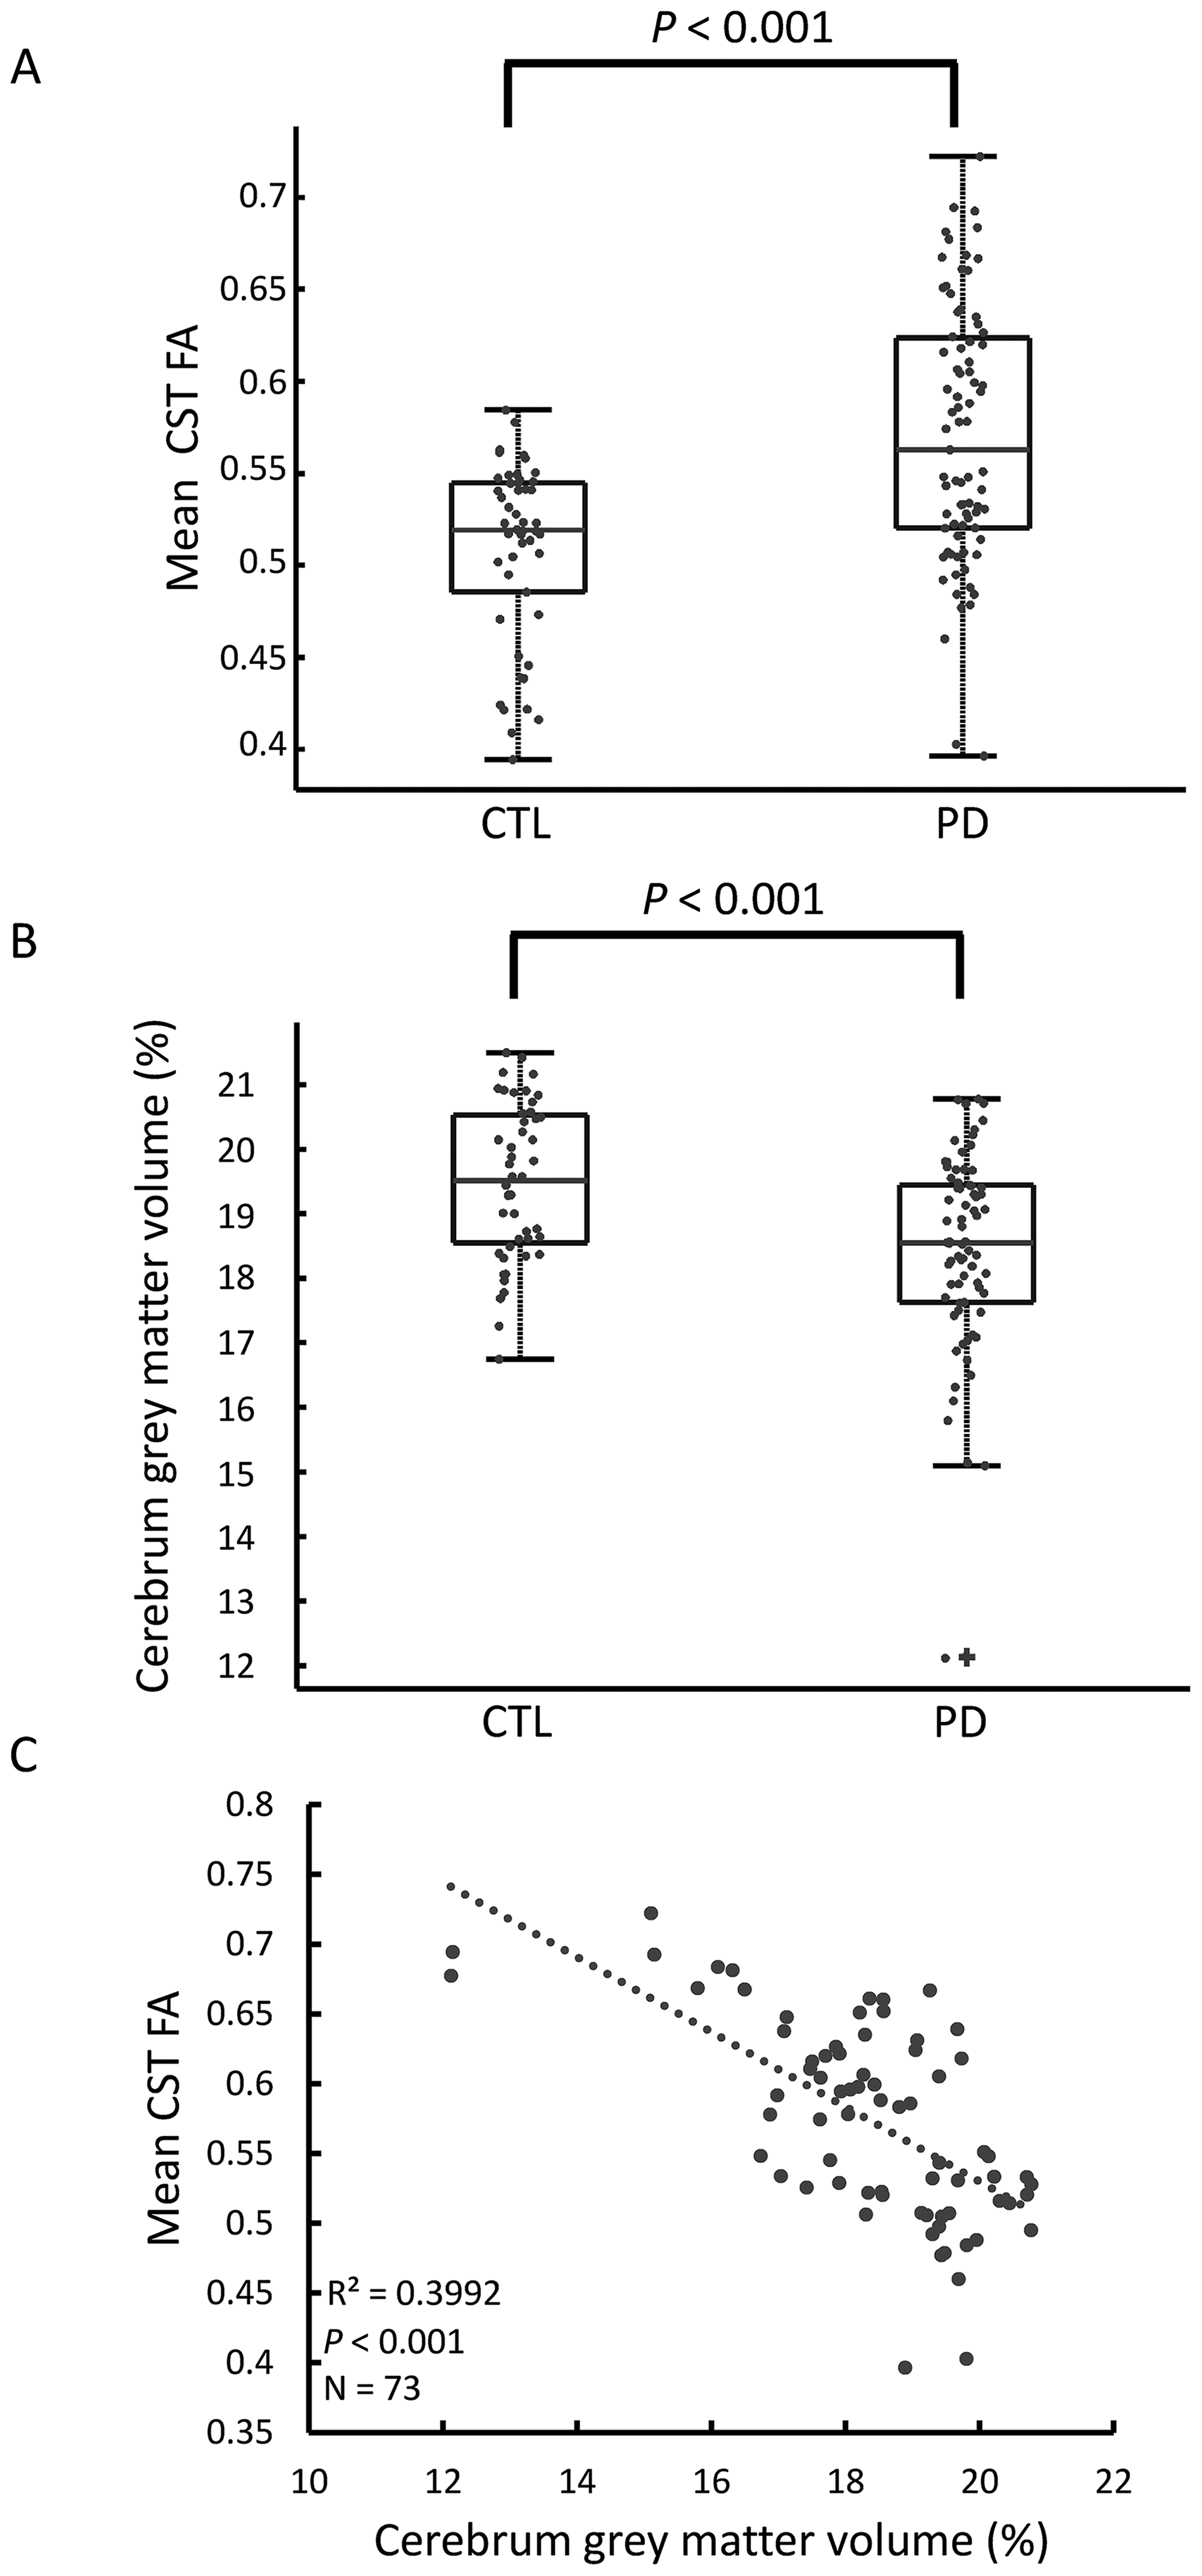
We then tested the correlations between clinical and electrophysiological parameters and the FA values in PD. FA values were negatively correlated with disease duration (Figure 3A, p = 0.032). After the 11th year of the disease, FA values of PD patients and controls were similar. Other clinical features, namely the levodopa daily dose equivalent (LEDD), UPDRS III score during the OFF state and ACE were not correlated with the CST FA values (Figure 3B, C) and neither was the beta oscillatory activity in the STN (Figure 3D).
Relations between corticospinal tract (CST) integrity and clinical and electrophysiological characteristics in PD patients. (A) CST fractional anisotropy (FA) values are negatively correlated with disease duration. No correlations were demonstrated between CST FA values and with the motor Unified Parkinson's Disease Rating Scale (UPDRS-III) during the ‘OFF’ state (B) with the Addenbrooke's cognitive examination (ACE) score (C) or with the subthalamic beta oscillatory activity relative power (D).
Increased CST FA is associated with the genetic etiology of PD
Studying the differences between the different genetic groups revealed that, relative to controls, increased FA was demonstrated only for the monogenic PD groups (Figure 4A, LRRK2-PD: 0.58 ± 0.06 p < 0.001, GBA-PD: 0.63 ± 0.05 p < 0.001) and not for the iPD group (0.52 ± 0.05 p = 0.17). Relative to controls, patients from all groups had a lower grey matter volume, although the values of LRRK2-PD did not reach significance (Figure 4B, iPD: 18.7 ± 0.99 p = 0.003, LRRK2-PD: 18.7 ± 1.74 p = 0.07, GBA-PD: 17.6 ± 2.04 p = 0.001). To exclude confounder effect due to shorter disease duration in GBA-PD and LRRK2-PD, we performed ANCOVA after correcting for disease duration. This analysis revealed that the genotype effect on the FA values was highly significant (p < 0.001).
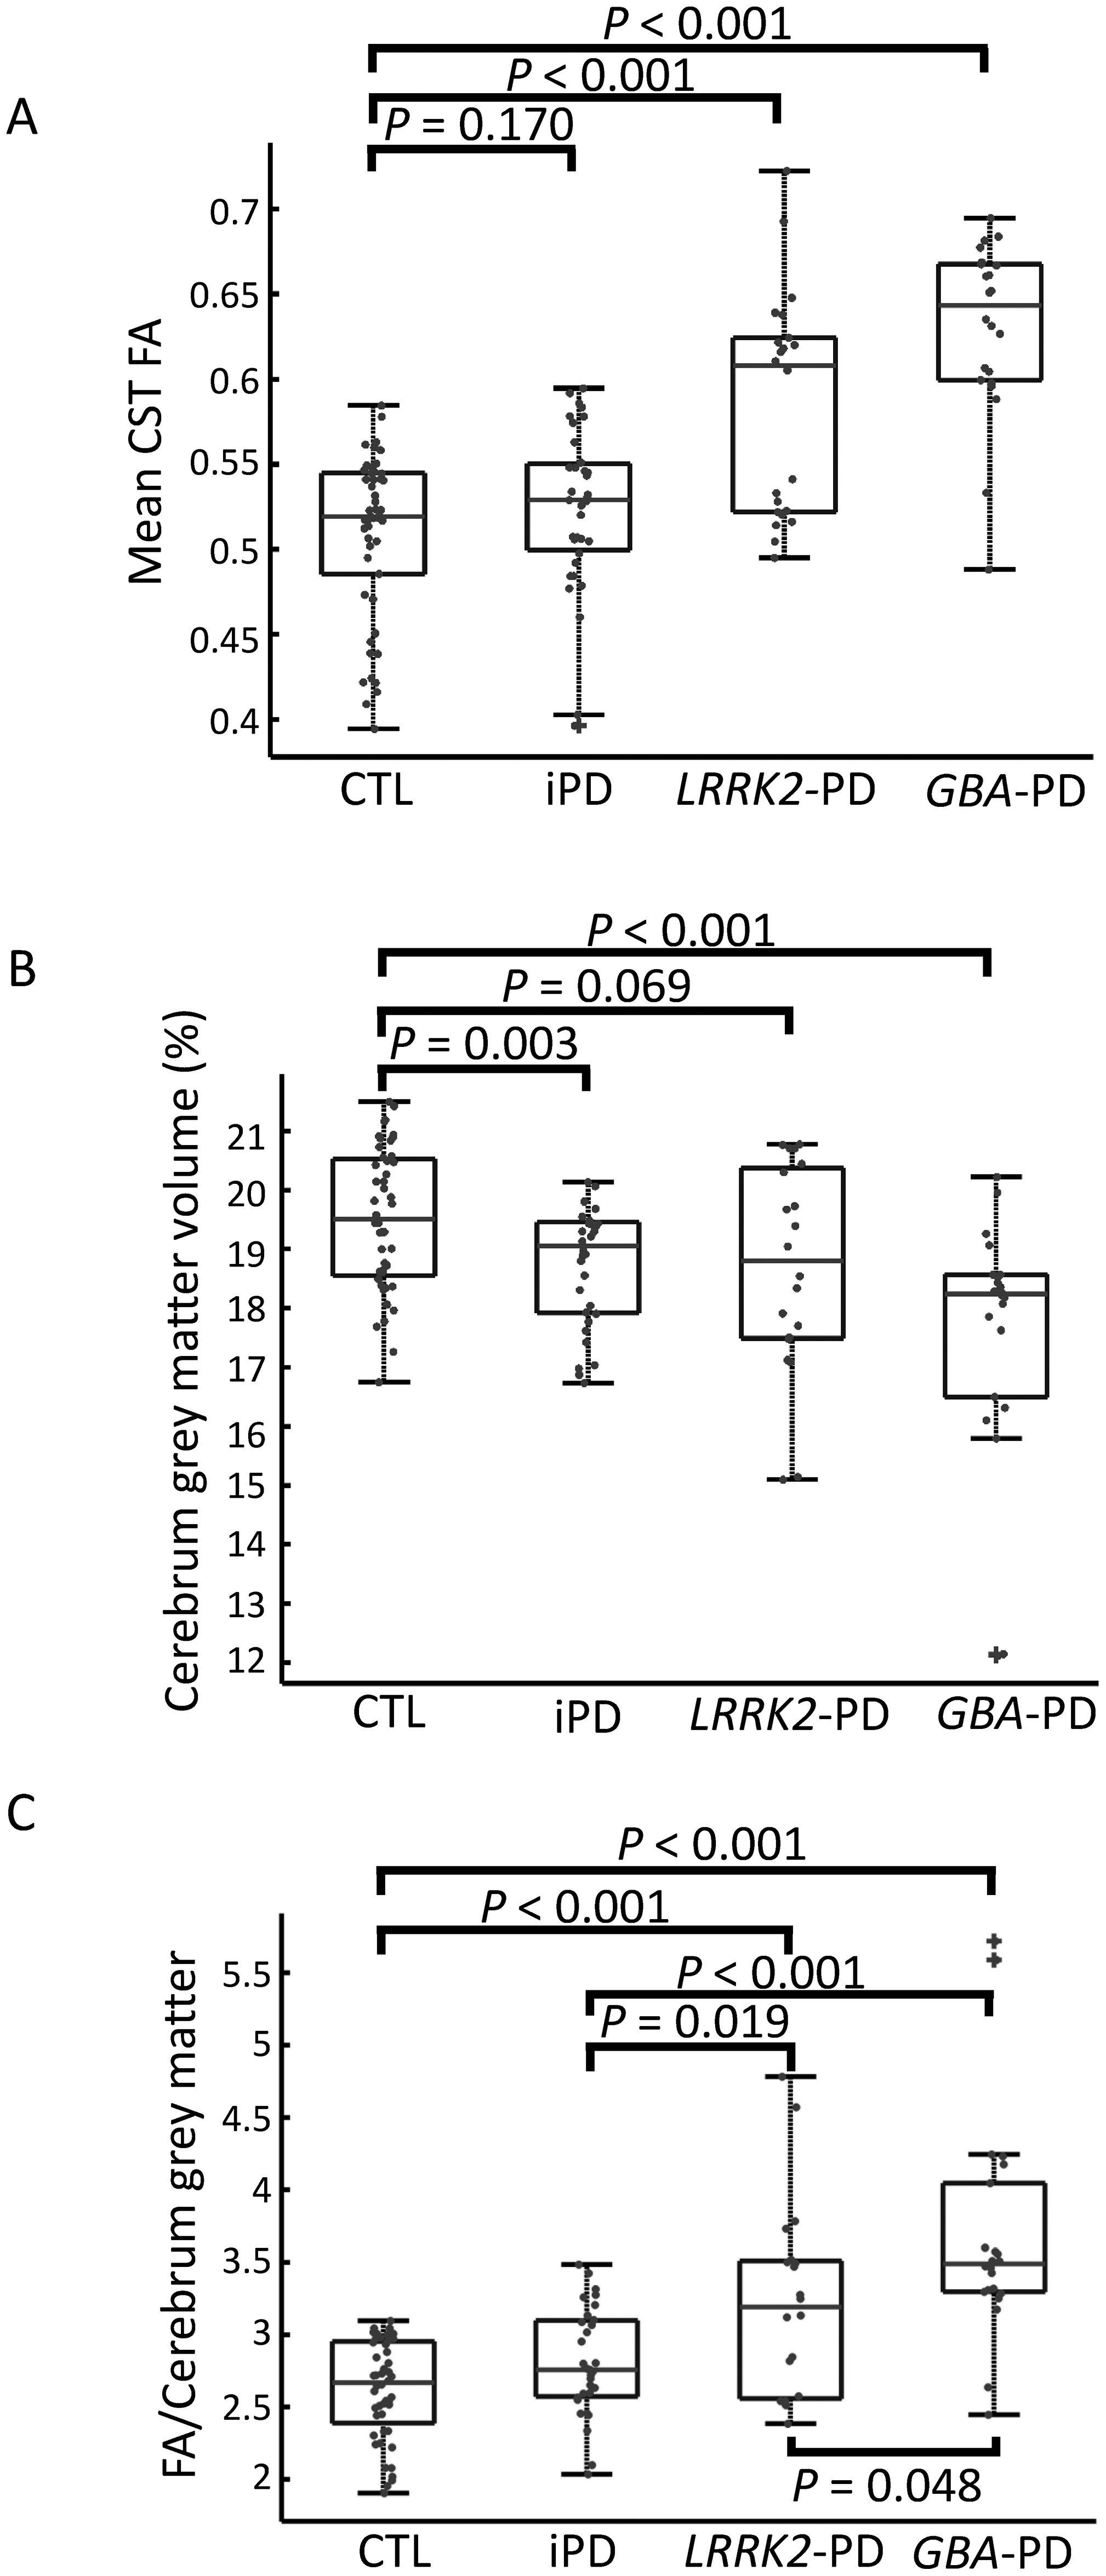
Corticospinal tract (CST) integrity and grey matter volumetric analysis of healthy controls and patients with PD according to the different genotypes. A) While LRRK2-PD and GBA-PD had significantly higher CST Fractional Anisotropy (FA) values, such high values were not demonstrated for patients with iPD. B) Lower grey matter volume were demonstrated only in patients with iPD or GBA-PD. Patients with LRRK2-PD had marginally lower grey matter volume (p = 0.069). C) The ratio between CST FA and cerebral grey matter volume is different between all groups. Highest values were demonstrated in GBA-PD followed by LRRK2-PD and iPD.
Since increased FA values possibly reflect compensatory mechanism for cortical atrophy we calculated, for the different groups, a compensatory index: the ratio between the CST FA and the cerebral grey matter (F/G index, Figure 4C). GBA-PD had highest F/G index when compared to all other studied groups (GBA-PD vs. CTL p = 0.048, GBA-PD vs. LRRK2-PD p < 0.001, GBA-PD vs. iPD p < 0.001), while LRRK2-PD had significantly higher F/G index relatively to iPD (p = 0.019) and controls (p < 0.001). F/G index, corrected for disease duration, demonstrated significance genotype effect (p < 0.001).
Discussion
We have shown here that PD is associated with higher FA values in the CST, confirming previous reports.10–13 While these higher CST FA values ‘pseudo-normalized’ with disease progression, in patients with monogenic PD, namely LRRK2-PD and GBA-PD, higher FA values are still observed in the advanced stages of the disease. We demonstrate here, for the first time, that higher CST FA values are correlated with grey matter atrophy of PD patients. CST FA values are not correlated with the motor, cognitive or electrophysiological characteristics of the disease.
Previous DTI studies in PD mostly demonstrated, on the one hand, reduced FA in dopaminergic circuits11,12,23 and, similar to our results, increased FA values in the CST.10–14 We verified here the latter observation and further verified it by demonstrating lower MD and RD in the CST. These findings suggest higher water molecule directionality. While higher FA is commonly interpreted as improved fiber integrity, it may also be a result of specific degeneration of the fibers crossing the corticospinal tract.12,24 Nevertheless, the validity of our results is supported by two fixel-based analysis studies and by a neurite orientation dispersion and density imaging (NODDI), that are less affected by crossing fibers. These studies have also shown increased CST integrity in PD.14,15,25 In any case, these two possibilities are not necessarily mutually exclusive: the notion that the integrity of the corticospinal tract remains relatively preserved amidst a diffuse neurodegenerative process of the adjacent fibers may still signify a compensatory mechanism in the early stages of the disease, compatible with other findings of corticospinal compensation in early PD.7,9
Similarly to previous studies in PD, with or without dementia, we also show here a decreased grey matter volume.26,27 CST FA values were negatively correlated with this grey matter atrophy. This correlation may indicate that the CST improved integrity compensates for cortical neuronal loss. A similar compensatory mechanism was recently suggested for PD as higher FA values in the nigrostriatal tract are correlated with reduced neuronal population in the substantia nigra. 28
Our finding of a negative correlation between CST FA and disease duration is compatible with a previous study that showed a peak of FA values 2–3 years after PD diagnosis. This peak is followed by a gradual decrease reaching control values at the 6th year for diagnosis. 12 Our data indicate possible slower rate of decrement. Either this difference may be attributed to the fact that we measured disease duration from first reported symptom and not from the time of PD diagnosis, or since we focused on a more distinct population of DBS candidates excluding patients who developed early dementia and other DBS exclusion criteria. In contrast to the CST, the nigrostriatal FA values progressively decrease already at early disease 12 and possibly already in the prodromal stages. 29
Interestingly, the high CST FA values, that probably represent early compensatory changes, are dependent on the genetic cause of PD. At the time of DBS, patients from all PD groups are clinically at a similar phase of their disease (motor fluctuations, preserved gait during the ON state and relatively preserved cognition). When considering their compensatory changes, however, patients from different groups are at a different phase of their disease. Patients with iPD, although showing cerebral atrophy, do not have significantly higher CST FA values than controls. This may reflect a loss of compensatory changes earlier in the disease, as was previously described. 12
While the clinical course of LRRK2-PD is profoundly different from that of GBA-PD, the higher FA values observed in these groups may suggest that in both genetic groups a life-long similar compensatory mechanism exists. At the time of DBS surgery, patients with LRRK-PD do not have significant atrophy but demonstrate increased CST FA values. A previous study demonstrating possible increased CST FA in LRRK2 mutation carriers without clinical PD suggests that these increased values reflect compensatory process. 30 Compensatory CST involvement in LRRK2-PD is also supported by Transcranial Magnetic Stimulation (TMS) studies of the primary motor cortex demonstrating reduced short intra-cortical inhibition and increased long term potentiation-like plasticity.31,32
While it was previously shown that at an earlier stages of PD compensatory changes in the CST are not different between GBA-PD and iPD, 25 our results show that, at the time of STN-DBS, the compensatory changes are more dramatic in GBA-PD patients. At this clinical milestone, patients with GBA-PD have more grey matter atrophy 33 and, as shown here, the highest CST FA values. These observations could indicate that at the time of DBS intergroup ‘seemingly-identical’ clinical state is misleading as the clinical state of patients with GBA-PD is actually the most dependent on these compensatory processes. This assumption is supported by the observation of early cognitive deterioration that follow STN-DBS in some apparently suitable GBA-PD candidates.34,35
This retrospective study was not designed to address the possibility that the long-term motor and cognitive outcomes of DBS could be predicted by the pre-surgical CST FA values. A recent study applying neurite orientation dispersion and density imaging (NODDI) analysis in PD showed that higher integrity of the CST was associated with higher degree of non-motor symptoms improvement following the STN-DBS. 36 PD patients in this study, however, were not genotyped and corticospinal integrity was assessed differently.
To conclude, we have found that the high CST FA in PD patients is correlated with cortical atrophy and shorter disease duration, and that this correlation can be explained by genetic differences. Further follow up is needed to understand the long-term consequences of these changes, as certain populations, such as GBA-PD, might be on the brink of exhausting their compensatory mechanisms while being assessed for DBS.
Supplemental Material
sj-docx-1-pkn-10.3233_JPD-240267 - Supplemental material for Atrophy-related corticospinal changes in advanced Parkinson's disease are associated with the genetic etiology of the disease
Supplemental material, sj-docx-1-pkn-10.3233_JPD-240267 for Atrophy-related corticospinal changes in advanced Parkinson's disease are associated with the genetic etiology of the disease by Roy Dayan, Atira S Bick, Caroline Weill, Max Bauer, Halen Baker Erdman, Zvi Israel, Hagai Bergman, Netta Levin and David Arkadir in Journal of Parkinson's Disease
Footnotes
Funding
The authors received no financial support for the research, authorship, and/or publication of this article: This study was funded by the Richard & Shauna Elias Charitable Fund (to DA), by a grant of the Silverstein foundation (to HB) and by a grant to RD and HB from the KAMLA Research Fund of the Hebrew University of Jerusalem and Hadassah University Medical Center.
Declaration of conflicting interests
The authors declared no potential conflicts of interest with respect to the research, authorship, and/or publication of this article.
Data availability
The data that support the findings of this study are available on request from the corresponding author.
Supplemental material
Supplemental material for this article is available online.