
Abstract
Background:
Freezing of gait (FOG) is a debilitating, variably expressed motor symptom in people with Parkinson’s disease (PwPD) with limited treatments.
Objective:
To determine if the rate of progression in spatiotemporal gait parameters in people converting from a noFOG to a FOG phenotype (FOGConv) was faster than non-convertors, and determine if gait parameters can help predict this conversion.
Methods:
PwPD were objectively monitored longitudinally, approximately every 6 months. Non-motor assessments were performed at the initial visit. Steady-state gait in the levodopa ON-state was collected using a gait mat (Protokinetics) at each visit. The rate of progression in 8 spatiotemporal gait parameters was calculated. FOG convertors (FOGConv) were classified if they did not have FOG at initial visit and developed FOG at a subsequent visit.
Results:
Thirty freezers (FOG) and 30 non-freezers were monitored an average of 3.5 years, with 10 non-freezers developing FOG (FOGConv). FOGConv and FOG had faster decline in mean stride-length, swing-phase-percent, and increase in mean total-double-support percent, coefficient of variability (CV) foot-strike-length and CV swing-phase-percent than the remaining non-freezers (noFOG). On univariate modeling, progression rates of mean stride-length, stride-velocity, swing-phase-percent, total-double-support-percent and of CV swing-phase-percent had high discriminative power (AUC > 0.83) for classification of the FOGConv and noFOG groups.
Conclusion:
FOGConv had a faster temporal decline in objectively quantified gait than noFOG, and progression rates of spatiotemporal gait parameters were more predictive of FOG phenotype conversion than initial (static) parameters Objectively monitoring gait in disease prediction models may help define FOG prone groups for testing putative treatments.
INTRODUCTION
Freezing of gait (FOG) [1] is one of the variably expressed and more debilitating motor features of Parkinson’s disease (PD) that leads to falls [2, 3] and decreased quality of life [4, 5]. FOG occurs in around 7% of people with early PD [6], 50% mid-way through disease [5], and in up to 92% by the time of death [7]. Currently, most of our knowledge regarding FOG phenotypic features comes from cross-sectional studies that cannot provide information on an individual’s symptom onset or progression, but implicate both motor [8–32] and non-motor [33–46] dysfunction.
Several studies have now been published longitudinally monitoring conversion from a noFOG to a FOG phenotype [6, 47–62] and are summarized in Supplementary Table 1. In the majority of these studies the focus was on motor and non-motor features at an initial enrollment visit that were not monitored longitudinally. Additionally, due to heterogeneity in assessments performed in these studies, differing study designs and monitoring durations, and varying statistical analysis techniques, no clear common feature for FOG conversion has emerged. Univariate analysis from these studies identified 36 potential predictors (Supplementary Table 2), with greater age [59–61], higher levodopa equivalent dose [49, 61], greater non-tremor dominant (TD) phenotype [49, 60], higher non-motor scale or subscale scores [57, 59–61], higher depression rating scale scores [49, 61], higher anxiety rating scale scores [49, 61] and lower cognition scores [55, 60] each noted as predictors in at least 3 studies. Multivariable analysis (Supplementary Table 3) similarly identified 40 different potential predictors, with disease duration [49, 62] depression rating scale scores [48, 62], greater postural instability gait disorder (PIGD) scores [49, 60], age [49, 60], levodopa equivalent daily dose (LEDD) [47, 62], gait speed [48, 52], and lower CSF Aβ42 levels [55, 59] each noted as predictors of FOG conversion in at least two studies.
Since FOG is ultimately a gait phenotype, one might expect early gait changes to help predict conversion to a FOG phenotype. However, only one study that longitudinally monitored gait reported no differences in gait decline between those who did and not develop FOG [58]. Only one study has looked at progression, using antisaccade latency (ASL) as a correlate of the severity of FOG at follow-up [51]. The need for multimodal objective assessments has also been suggested [48].
Given the differences in progression in spatiotemporal gait parameters that we previously reported between people with and without FOG [63], we hypothesized that people without FOG who will progress to a FOG phenotype would show a more rapid decline in objectively measured gait parameters. Additionally, given our prior results that gait progression better classified freezers from non-freezers [63], we also hypothesized that the rate of progression in objectively measured gait parameters could help predict conversion to a FOG phenotype. This is of significant importance because without the ability to accurately predict a cohort with the potential to develop FOG, clinical trials to test putative treatments to prevent or slow phenotypic conversion cannot be successfully accomplished. To test these hypotheses, we enrolled a cohort of people with PD and objectively monitored their gait every 6 months to quantify the rate of progression in spatiotemporal gait parameters and compare those that converted to a FOG phenotype to those that did not.
MATERIALS AND METHODS
Standard protocol approvals, registrations, and patient consents
Participants between the ages of 50–90 years old meeting the UK brain bank criteria [64] for the diagnosis of PD who presented to the Movement Disorders Clinic (MDC) at the University of Arkansas for Medical Sciences (UAMS) between September 2014 and December 2019 for clinical care (by T.V.) were asked to participate. Exclusion criteria included > 1 fall/day (due to greater risk of falls during gait assessments), Montreal Cognitive Assessment (MoCA) [65] score < 10 (set low as FOG participants have been reported to have lower cognitive performance on testing and we did not want to exclude a large portion of this population), and use of dopamine antagonist medications in the prior year (to exclude patients with possible drug-induced parkinsonism; however the three antipsychotics safe in PD psychosis, i.e., low dose quetiapine < 100 mg/day, clozapine or pimavanserin were allowed). The study protocol was approved by the UAMS Institutional Review Board (UAMS IRB# 203234), and written informed consent was obtained from each participant before study procedures were performed. The study was conducted in accordance with the guidelines of the Declaration of Helsinki.
Assessments were performed at approximate 6-month intervals, after scheduled clinic visits to facilitate patient participation and retention. All participants were in the levodopa medicated or ON-state during all study assessments. Participants who completed at least 18-months of follow-up with at least 3 visits were included in the analysis. Of 111 PD participants enrolled by December 2019, 60 met criteria (range 3–10 visits over 18–60 months).
Group definitions
Participants were administered the Freezing of gait questionnaire (FOG-Q) [66] at each visit. Akin to the videos included in the New-FOG-Q [67], a movement disorders fellowship trained neurologist (T.V.) demonstrated the FOG phenomena to participants before completing the questionnaire with them. Participants with a FOG-Q item 3 score≥1 at their initial visit (equivalent to a N-FOG-Q item 1 score of 1) are included in the FOG group. Participants with a FOG-Q item 3 score of 0 at the initial visit were classified as non-freezers. At initial visit 30 participants were non-freezers and 30 participants were freezers (FOG group). The FOG-Q was repeated at each follow-up visit, and 10 non-freezers whose FOG-Q item 3 score changed from a 0 to≥1, were classified as FOG convertors and are included in the FOGConv group. The remaining 20 non-freezers who did not develop FOG during the period of follow-up are included in the noFOG group. To summarize, the final groups were non-freezers at final visit (noFOG), freezers at initial visit (FOG), non-freezers at initial visit who were classified as freezers at a subsequent visit (FOGConv).
In order to improve the confidence in our classification of these groups, we utilized all examinations and objective gait assessments to evaluate for the presence or absence of FOG episodes, including clinical visits to the UAMS MDC (with T.V.). None of the non-freezers (noFOG group) had reported or witnessed FOG episodes over the period of their participation and 17 had at least one levodopa OFF-state evaluation during this period. For the FOGConv group, 7/10 had OFF exams prior to enrolling in the study without witnessed FOG episodes. By the final visit 8 FOG Conv had OFF-state examinations with 7 classified as definite freezers and 3 as probable freezers [68]. For the FOG group, at initial visit 16 were classified as definite freezers, while by their last included study visit 28 were definite freezers with 2 probable freezers. Participants classified as probable freezers were included in the analysis as they all reported OFF-state FOG on repeated visits and their spouses or caregivers also reported witnessing FOG behavior as demonstrated to them (by T.V.).
Gait assessment
Steady-state gait was collected and analyzed at each visit, as previously published [10, 69]. Briefly, participants were instructed to walk at a “comfortable” pace 8 lengths of a 20’x4’ pressure sensor impregnated mat (Zeno Walkway, Protokinetics, Havertown, PA). Data were collected and analyzed using PKMAS software (Protokinetics). FOG episodes were uncommon, but when they occurred (shorter steps leading to a pause in forward momentum), those footprints were excluded from analysis.
The mean and stride-to-stride percent coefficient of variability (CV) for steady state gait for each participant at each visit was calculated for 8 spatiotemporal gait parameters; stride-length, stride-width, stride-velocity, stride-time, swing-phase-percent, total-double-support-phase-percent, integrated-pressure applied and foot-strike-length with the ground, using the combined left and right footprints. These variables have been previously defined [10, 63] and are provided in Supplementary Table 4.
Rate of progression calculations
For each participant, the observed value of each gait parameter was expressed as a ratio to the gait parameter’s initial value. Because these ratios tended to be left-skewed, we transformed them with a base-2 logarithm; thus, the initial value was 0, values of 1 and 2 are interpreted as 2-fold and 4-fold increases, and values of – 1 and – 2 are interpreted as ½ and ¼ decreases. To determine the rate of progression, we used a simple linear regression to estimate the slope of each log2-transformed gait parameter over the years the participant was observed; the initial time point was recorded as 0. We refer to this slope as the “rate.” The rate is relatively easy to calculate in the clinic (e.g., with the SLOPE function in Excel function). For the FOGConv participants, we also computed a pre-conversion rate, which used only the observations measured prior to FOG conversion. These pre-conversion rates are used in estimating classifiers of noFOG and FOGConv patients.
Other assessments
The complete UPDRS [70] was administered at each visit, and the annual rate of progression was calculated as noted above. The Levodopa Equivalent daily dose (LEDD) at each visit was calculated based on prior reported estimations of levodopa bioavailability [71], and equivalency of dopamine agonist and MAO-Inhibitor dosages [72]. At the initial visit the following assessments were administered and analyzed: the Montreal Cognitive Assessment (MoCA) [65], the Frontal Assessment Battery (FAB) [73], the Scales for Outcome in Parkinson’s disease – Cognition (SCOPA-Cog) [74], the Hamilton depression (HAM-D) [75] and anxiety (HAM-A) [76] rating scales, the Apathy Evaluation Scale (AES) [77], the Parkinson’s disease questionnaire for quality of life (PDQ-39) [78], the Epworth Sleepiness scale [79], the REM Sleep Behavior Disorder Screening Questionnaire (RBD-Q) [80] and the Hoehn and Yahr staging score (H&Y) [81].
Statistical analysis
The three groups, noFOG, FOGConv, and FOG, were compared on baseline measures using pairwise t-tests within a one-factor Analysis of Variance (ANOVA) context for normal measures, pairwise Wilcoxon rank-sum tests for non-normal measures, and chi-square tests for categorical measures. We also used pairwise t-tests within a one-factor ANOVA context to compare the rates of progression of the noFOG group to each of the FOGConv and FOG groups. In this one-factor ANOVA model, we purposefully did not account for usual adjusting factors like sex, age, LEDD, and motor UPDRS because, in the clinic, it would be difficult to take all these factors into (a mathematical) account when evaluating a patient. However, in an effort to know whether clinical decisions based simply on the rate of progression would be different if accounting for these factors, we performed an additional analysis that did take these factors into account. Specifically, we fit the longitudinal measures of the continuous gait parameters (transformed with a base-2 logarithm) with a random coefficients regression (RCR). This RCR assumed a participant’s intercept and slope (on time) were normally distributed about the group’s intercept and slope and that the groups’ intercepts and slopes differed. From past experience, we have noticed that variances tend to be larger in the FOG than noFOG groups [69, 82]; hence, we used the Bayesian Information Criterion to decide whether to allow the groups to have their own residual variance or to use a common residual variance for all three groups [83]. Additionally, we entered the participant’s sex, age, LEDD, and motor UPDRS scores into the model: other than sex, the values of these changed at each observation of the participant. We assumed the effects of these additional factors did not depend on group. Note that a RCR accounts for the longitudinal nature of the data from the individuals. Within this RCR, we were primarily interested in the groups’ slopes and comparisons of the noFOG’s slope to those of the FOGConv and FOG groups.
To determine whether a measure was potentially useful for discriminating FOGConv from noFOG patients, we used logistic regression, modeling the probability of converting to FOG (i.e., FOGConv), as a function of the measure. Because of the small sample size (10 FOGConv and 20 noFOG participants), we did not adjust for other factors in the logistic regressions to avoid overfitting. When evaluating the progression rate measures, we used the pre-conversion rates from the FOGConv participants instead of the rates based on all of their observations. From these logistic regressions, we present the area under the receiver operator characteristic curve (AUC). To learn if the inferences from the above logistic regressions depended on whether we used the pre-conversion rates from the FOGConv participants or the rates based on all of their observations, we performed the same analyses using the FOGConv rates based on all of their observations. We also used the kernel smoothing method [84] to estimate cutoff points in the progression rates of the 16 spatiotemporal gait parameters that could distinguish the noFOG and FOGConv groups. We estimated the cutoff points using both the pre-conversion progression rates and the rates based on all observations from the FOGConv group. Finally, we note that one of the 10 FOGConv participants converted to the FOG phenotype by the second visit; thus for the pre-conversion rates, there were only 9 FOGConv participants.
Regarding multiple comparisons within a single analysis: we made only two tests and did not adjust the p-values. Since we report those p-values below 0.05, the reader may consider the result significant if the p-value is less than 0.025 – a Bonferroni correction. Regarding multiple testing for the ANOVAs and logistic regressions performed on each of several parameters, we report positive False Discovery Rates (pFDR) which estimate the number of false discoveries (Type I errors) among the number of significant results [85]. The pFDRs were estimated with custom code written in R version 4.2.2.
Analyses were performed in SPSS 28 (IBM), SAS/STAT® software, version 9.4 (SAS Institute, Cary, NC), and R.
RESULTS
Demographics of the 60 participants (30 FOG, 20 noFOG, and 10 FOGConv) analyzed are shown in Table 1. The age of participants at enrollment and duration of follow-up, was similar between the groups (Table 1). General motor function and non-motor disease features were not significantly different in the FOGConv group compared to either the noFOG or FOG groups (Table 1) although the FOG group showed worse function compared to the noFOG group in multiple assessments (Table 1). Spatiotemporal gait measures at initial visit were also not significantly different between the FOGConv group and noFOG and FOG groups. The FOGConv group was however trending towards slower mean stride-time and stride-velocity and shorter mean stride-length, and increased variability in foot-strike-length, stride-time and stride-velocity compared to the noFOG group (Table 1).
Demographics, motor, non-motor and gait assessments of participants at enrollment visit
Values reported are mean±standard deviation. AnoFOG-FOGConv Post-hoc testing was significantly different at the 0.05/3 = 0.017 level (post-hoc Bonferroni correction applied for 3 group comparisons). BnoFOG-FOG Post-hoc testing was significantly different at the 0.05/3 = 0.017 level (post-hoc Bonferroni correction). CFOGConv-FOG Post-hoc testing was significantly different at the 0.05/3 = 0.017 level (post-hoc Bonferroni correction). NPdenotes significance using a non-parametric test; otherwise t-tests were used.
Progression in spatiotemporal gait parameters
The log2-transformed rate of progression (rate) in the mean and CV of the spatiotemporal gait parameters in the three groups is shown in Fig. 1. Compared to the noFOG group, both FOGConv and FOG participants had a significantly faster decline in mean stride-length (Fig. 1C, left), and mean swing-phase-percent (Fig. 1G, left) and an increase in mean total-double-support-phase-percent (Fig. 1H, left). Variability increased faster in the FOGConv and FOG groups compared to the noFOG group in foot-strike-length (Fig. 1B, right), stride-time (Fig. 1E, right), stride velocity (Fig. 1F, right), and swing-phase-percent (Fig. 1G, right). In Fig. 1, 19 of the 32 statistical tests were significant. Of these 19, the positive False Discovery Rate was 0.005, which means that about 1 of these 19 significant results may be false discoveries (Type I errors).
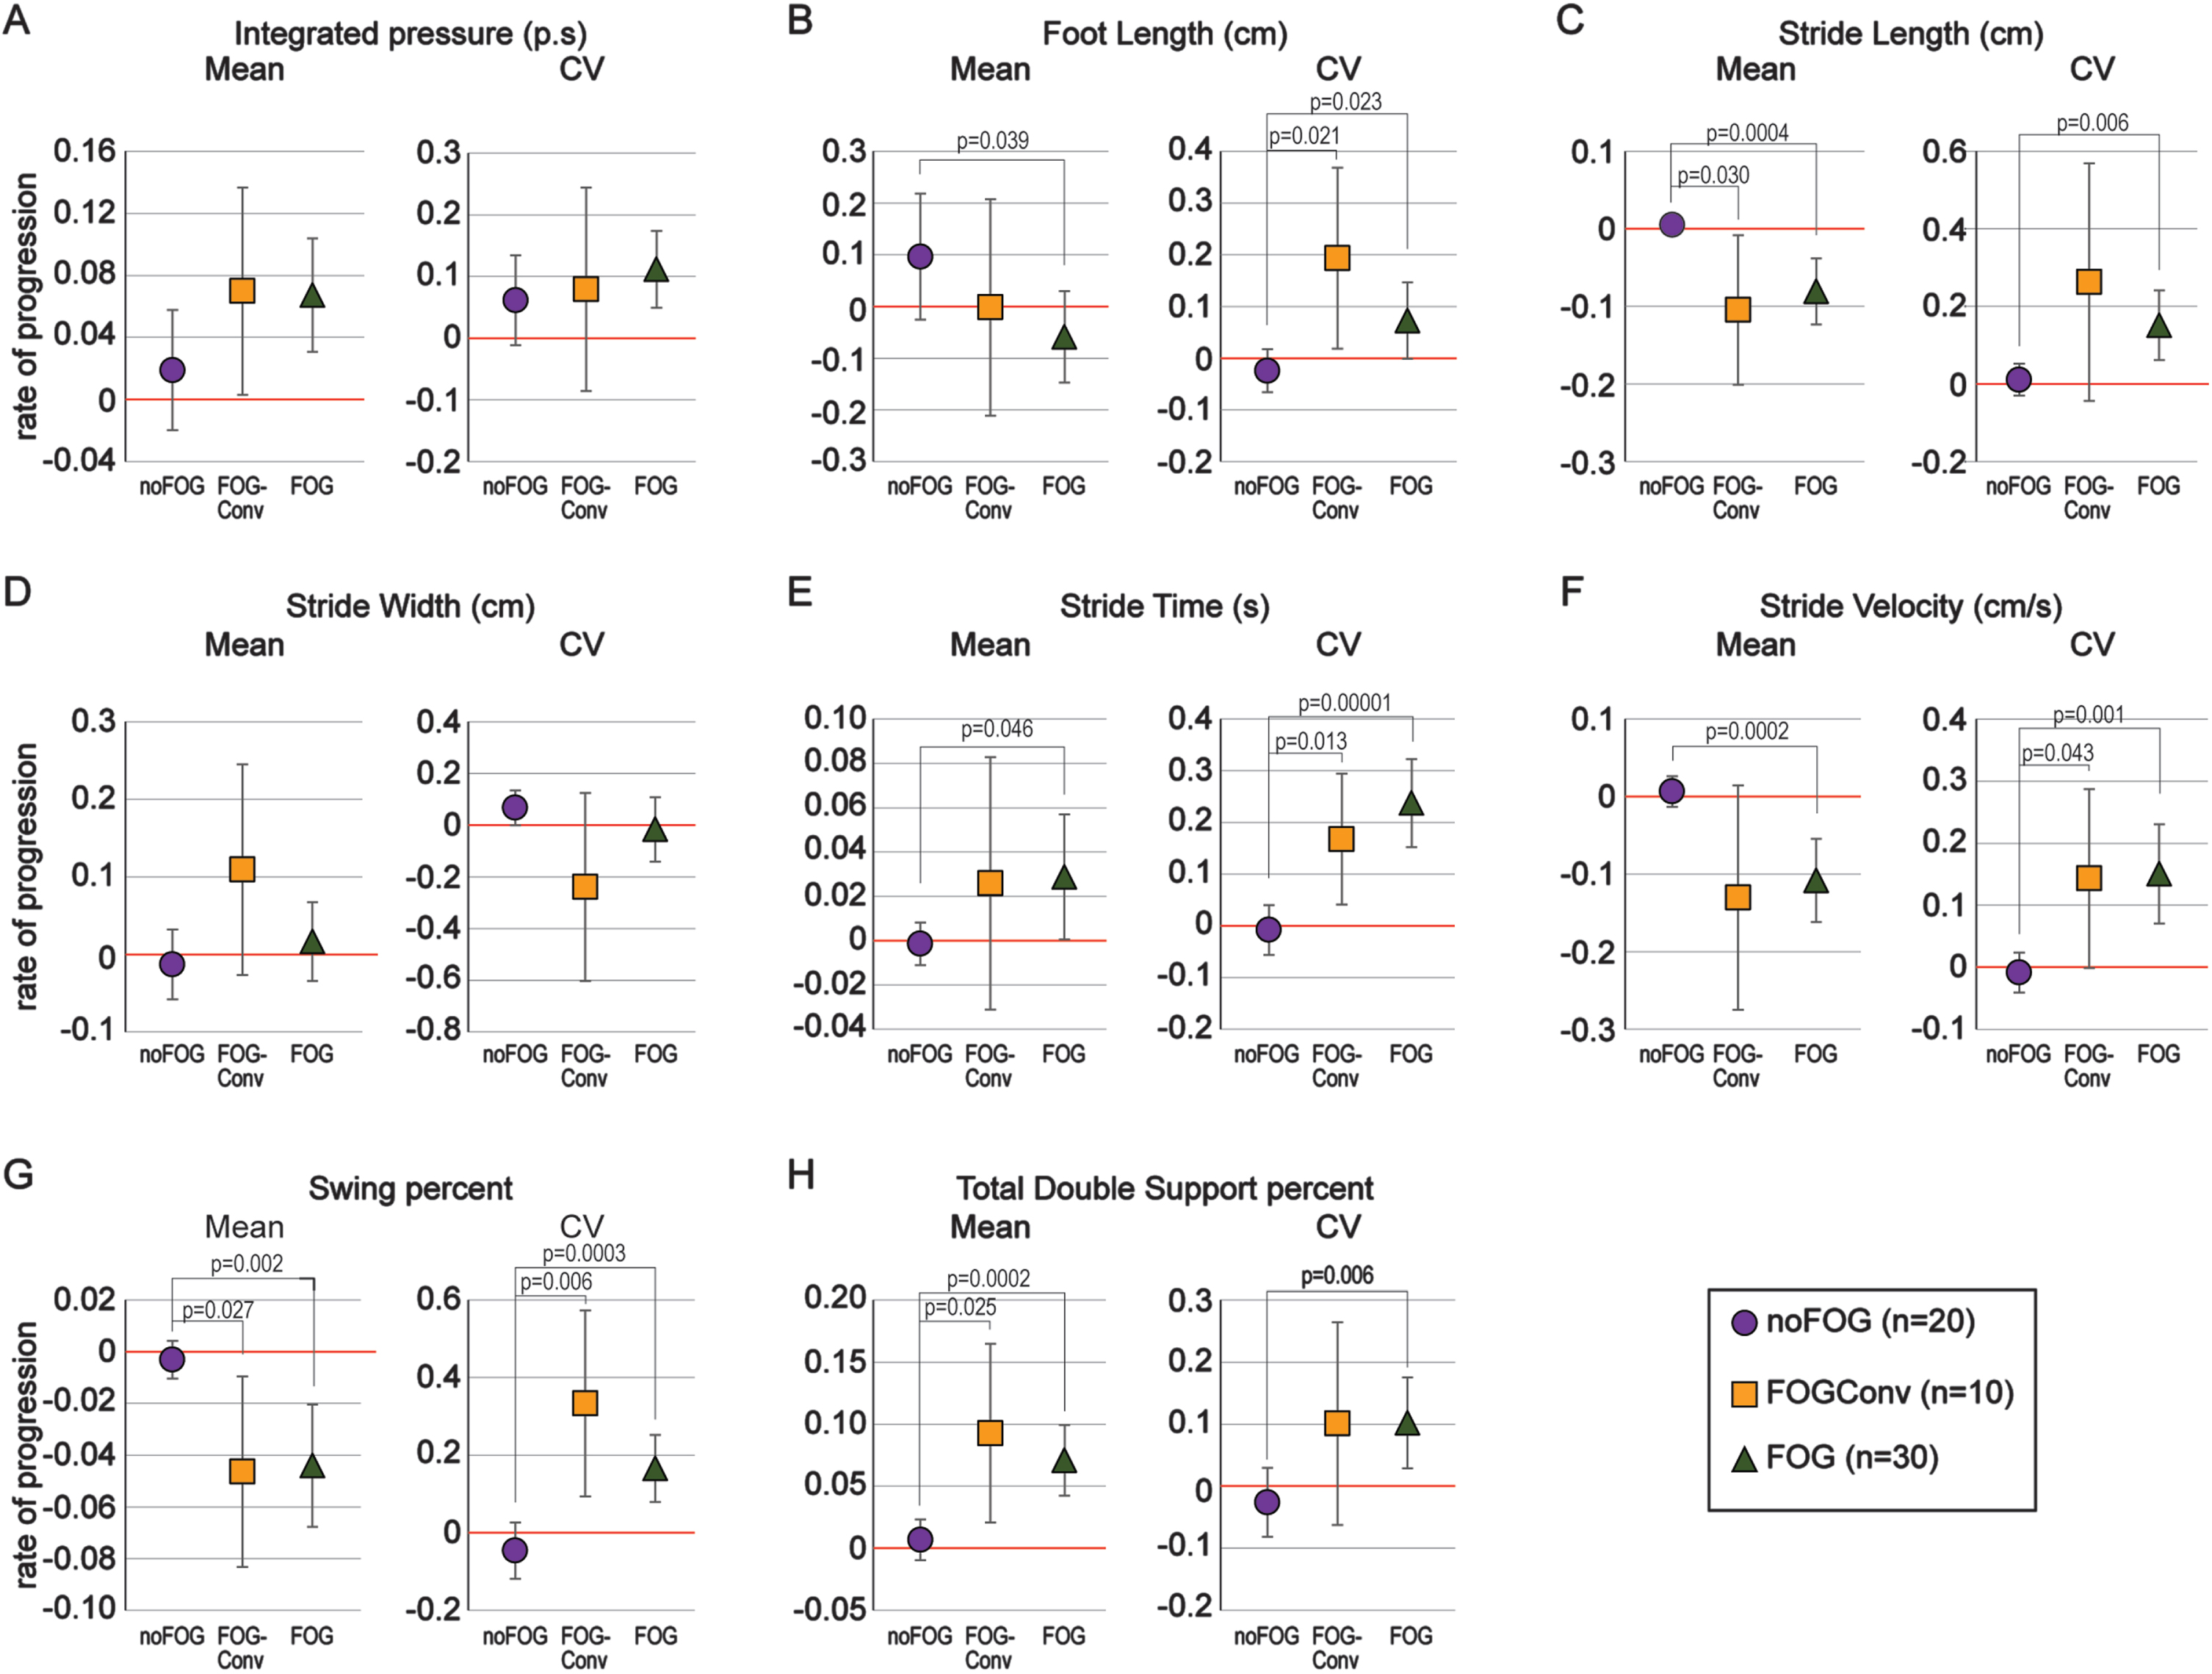
Rate of progression in spatiotemporal gait parameters. A-H) The rate of change (slope) in the log2-transformed mean (left panels) and coefficient of variability (CV, right panels) are shown for 8 spatiotemporal gait parameters. Values are plotted as means with 95% confidence intervals. Groups with confidence intervals not crossing 0 are significantly declining over time. The overall pattern of decline in the group converting to a freezing phenotype (FOGConv, orange) is similar to the group with freezing already at initial visit (FOG, green) as opposed to those that did not develop freezing over the study period (noFOG, purple).
With respect to statistical significance, these results were mostly confirmed using the RCR model (Supplementary Figure 1). When comparing FOGConv to noFOG, the ANOVA found differences in progression rates for the CVs of stride-time and stride-velocity, whereas these same differences in the RCR model were attenuated. Still comparing FOGConv to noFOG, the ANOVA did not detect a difference in progression rates of mean stride-velocity, whereas the RCR model did. When comparing FOG to noFOG, the ANOVA found differences in progression rates for mean foot-length and for the CV of stride-length; these same differences in the RCR model were slightly attenuated. This suggests the simple progression rates computed without accounting for other factors may be adequate estimates for clinical purposes.
Factor discrimination for conversion to a freezing of gait phenotype
We determined AUC values for each of the progression rates in the spatiotemporal gait parameters, to determine the potential for each of them to classify the noFOG and FOGConv groups (Table 2). For the FOGConv group, we used the progression rates that were calculated two ways: with only the pre-conversion observations, and with all observations. Progression rates for mean stride-length, mean stride-velocity, mean and CV swing-phase-percent and mean total-double-support-phase-percent all had AUC values over 0.800 for classification of the noFOG and FOGConv phenotypes using either of the FOGConv rates (Table 2, bold values). Of the 16 AUCs based on pre-conversion rates from the FOGConv participants, 6 were significant (Table 2). Of these 6, the positive False Discovery Rate was 0.05, which means that about 1 of these 6 significant results may be false discoveries (Type I errors). We also show the AUC values comparing initial motor, non-motor and gait assessments in Supplementary Table 5. Only initial LEDD had an AUC value greater than 0.800. We also estimated the cutoff values of slope for the 16 spatiotemporal gait parameters that would best differentiate the noFOG and FOGConv groups using both the slopes calculated for the FOGConv group using only the pre-conversion observations (n = 9), and with all observations (n = 10). These results are reported in Supplementary Table 6, and it should be recognized that due to the small number of participants, even removal of one participant notably changed the cutoff points.
Area under the curve (AUC) values for classification of noFOG (n = 20) and FOGConv (n = 9, 10) groups with rates of progression in spatiotemporal gait parameters. AUC values were calculated using pre-conversion observations and all observations for the FOGConv group
1Items in
Given the small number of FOG convertors, to avoid overfitting the data and providing unreliable results, multivariable modeling was not performed.
DISCUSSION
In this study, using longitudinally measured objective spatiotemporal parameters of gait, we had three major findings. Firstly, we demonstrated that a subset of longitudinally measured spatiotemporal gait parameters declined faster in both the FOGConv and FOG groups compared to a group that did not convert to FOG over an average of 3 years (noFOG). Secondly, differences between noFOG and both FOG and, importantly, FOGConv patients can be found using only simple rates of progression. These differences among FOG groups were corroborated with a more sophisticated regression that accounted for the patient’s sex, and ever-progressing age, disease severity, and changing daily levodopa dose. Thirdly, these simple rates of progression in select gait parameters were better able to classify (or predict) FOGConv group status than initial demographics, motor or non-motor disease features, levodopa equivalent dosing, or initial spatiotemporal gait parameters. Together, these findings suggest that incorporation of objective gait monitoring of people with PD into routine clinical care could help guide clinicians when counseling individuals on their disease progression. Knowledge of more rapidly progressive disease may also allow clinicians to target more aggressive management plans to those individuals.
The features of gait that significantly predicted the FOGConv group on univariate analysis in our study also make clinical sense. Decreasing stride-length incrementally leading up to a FOG episode, defined as the sequence effect, has been suggested to lead to FOG episodes [9, 86]. We have previously shown that prior to entering a turn, people with FOG had a greater reduction in step-length than people without FOG and age-matched non-PD controls [11]. This was especially so in participants that had FOG episodes witnessed during their turns. As swing-phase-percent measures the percent of the gait cycle that the advancing leg is off the ground, increasing swing-phase variability would suggest increasing inconsistency in maintaining this patterned movement. Swing time variability was also a significant feature in univariate modeling in one of the few previous studies that measured spatiotemporal gait parameters [48].
In order to design successful clinical trials two major criteria need to be met: 1) a well-defined therapeutic target to modulate that is hypothesized to prevent development or progression of pathology, and 2) an accurately defined patient population to test the therapeutic agent. The inability to predict development of FOG in a particular individual limits the ability to identify the correct cohort to test any putative disease modifying strategy. To compound this issue, mild early FOG may not be evident on short clinical examinations and may go undetected by patients and caregivers. As a result, therapeutic intervention trials to treat early-FOG and/or prevent progression in FOG severity also require establishment of a core set of features that identify mild-freezers outside of the episodic FOG event. While one can argue that no particular therapeutic target currently exists, identification of such a target may also be benefited by the ability to correctly define a FOG phenotype and accurately predict its onset in patient populations. Additionally, once a therapeutic agent was developed and available, having pre-defined the patient population to test that agent in, and the selected disease features that need to be monitored to determine clinical therapeutic target engagement, will be invaluable.
Sixteen manuscripts have reported use of a prospective, longitudinally monitored noFOG participant pool until a portion developed FOG [6, 55–62], including 4 studies that used the Parkinson’s Progressive Markers Initiative (PPMI) database [42, 59] and 1 study that used the PPMI database as a validation cohort [47] (Supplementary Table 1). Two studies retrospectively analyzed a previously collected cohort [52, 54]. The definition of the FOG and FOGConv pool was primarily based on the UPDRS, N-FOG-Q or FOG-Q but also self-report and examination (Supplementary Table 1). The interval and frequency of monitoring for FOG development, and the number and breadth of assessments performed at each visit was different in each study (Supplementary Table 1).
Only 3 studies, 2 from the same research group, longitudinally monitored spatiotemporal gait parameters [47, 58]. One group [51] monitored gait using the Clinical Gait and Balance Scale (GABS) [87]. One of these reported that gait decline was not different between noFOG and FOGConv groups [58]. Our results, that gait declines faster in FOGConv and that differential gait decline provides significant predictive power, suggests that inclusion of longitudinal gait measures in future studies would be important.
On univariate analyses 36 features have been reported as predictors of FOG Conversion (Supplementary Table 2). Greater age [59–61], higher levodopa equivalent dose [49, 61], greater non-TD phenotype [49, 60], higher non-motor scale or subscale scores [57, 59–61], higher depression scale scores [49, 61], higher anxiety scale scores [49, 61], and lower cognition scores [55, 60] were noted in more than 3 of these studies. In our study, while not significantly different between groups, greater age and LEDD at initial visit showed significant AUC values of 0.735 and 0.815 respectively to classify noFOG and FOGConv groups. AUC values for depression, anxiety and cognitive scores were not significant (Supplementary Table 2). Unique to our study however was the fact that the progression rates of spatiotemporal gait measures of mean stride-length, mean stride-velocity, mean and CV swing-phase-percent and mean total-double-support-phase-percent showed significant classification (or predictive) power for differentiating the noFOG and FOGConv groups. The AUC values for the significant progression rates of gait parameters (Table 2) were higher than all initial measured parameters (Supplementary Table 5) and previously reported AUC values of initial gait parameters by D’Cruz et al. [48], which ranged from 0.71 for CV swing-time and 0.79 for gait asymmetry. This suggests that quantitatively monitoring progression over time may be necessary to increase predictive accuracy for FOG conversion. For clinical utility, it remains to be determined what the shortest interval of gait progression measurement should be to provide this improved predictive power compared to baseline measures alone.
Prior reports of multivariable modeling also reflect a significantly diverse set of 40 features predicting FOGConv (Supplementary Table 3). Of these, 4 studies reported disease duration [49, 62] and depression scores [48, 62]; 3 datasets in 5 studies reported some variation of greater postural instability gait disorder (PIGD) scores [49, 60]; and 2 studies reported age [49, 60], LEDD [47, 62] and gait speed [48, 52] as predictors of FOG conversion. Two studies, both using the PPMI dataset, also reported lower CSF Aβ42 levels [55, 59] while one group reported decreased dopamine transporter tracer binding in two publications [55, 56] as significant predictors of FOG conversion.
Reflecting the difficulty in performing and interpreting predictive analyses to date, even the four studies utilizing the same PPMI dataset, likely due to different methods of participant selection, different methods of feature selection, and different methods of univariate and multivariable analysis, had differences in their final predictors on multivariable analysis [42, 59].
Other than the PPMI study, the most comprehensive prospective attempt at FOG prediction modeling was by D’Cruz and colleagues [48]. They monitored 60 noFOG participants over two years, with annual testing of 12 disease domains including gait, finger and foot tapping, and scales of non-motor performance. During the study period they had 12 FOG convertors. As noted above (and in Supplementary Tables 2 and 3), several features were predictive on univariate and multivariable modeling, but they report that the dataset was not complete for the majority of participants, as is also the case for gait measures in the PPMI dataset. On multivariable analysis, only a subset of UPDRS Part 1 and 2 scores (which are subjective assessments of motor and non-motor function) and objective finger tapping, best predicted conversion to FOG. Taken together these findings of gait, upper limb and subjective predictors support the need for multimodal assessments. The same group also subsequently showed that local inflations in the thalamus might help predict conversion to FOG [47].
The UPDRS is the gold standard clinical measure of PD severity, and a number of studies noted both univariate and multivariable analysis resulted in different components of this scale as predictive of FOG development (Supplementary Tables 2 and 3) [6, 60]. The advantage of using the UPDRS scale for prediction is that it is already routinely performed in the clinical setting by the majority of movement disorders specialists around the world. The disadvantage lies in the fact that UPDRS item scores range from 0–4, thereby reducing the spectrum of disease to 5 distinct groups. This filters out the intrinsic individual variability that may provide an important signal predictive of disease progression. In our cohort, UPDRS motor or total scores did not predict the FOGConv group, while objectively measured gait progression provided high predictive power for the FOGConv group. With the ever-growing number of systems to measure spatiotemporal gait parameters including traditional gait mats, videography and wearable sensors, a quick evaluation of gait, as is done in our movement disorders clinic on each clinical PD patient, may become more viable in the future.
One question of significant debate remains the role of levodopa in FOG development. Some groups suggest that FOG is a side effect of long-term levodopa usage [88, 89]. However, FOG has been reported in a percentage of patients even prior to initiation of levodopa therapy [56]. Phenotypic conversion to FOG has been associated with earlier levodopa use [61] and higher daily levodopa dose on univariate [49, 61] and multivariable [47, 62] analyses. In our study, duration of levodopa use and LEDD also both had AUC values of 0.775 and 0.815 respectively for classifying the noFOG and FOGConv groups (Supplementary Table 5), however these AUC values were lower than those for progression rates of gait parameters. Since levodopa is standard of care for the treatment of the motor features of Parkinson’s disease, much larger longitudinally monitored cohorts will be needed to determine cause and effect for levodopa and FOG development.
In our comparison of the slopes from the ANOVA and RCR models, RCR slopes tended to be slightly attenuated from the mean slopes from ANOVA and were estimated with more precision than from ANOVA. Clinically, it would be easier to incorporate a simple rate of gait progression into clinical practice (ANOVA model) without having to account for multiple other disease features (RCR model), which would take more time and effort. However, the increased variances do imply that for research purposes, and trying to determine the best progression parameter to monitor in the future, an adjusted model should be utilized. Along the same lines, using either the pre-conversion observations, or all observations to calculate slopes of progression did not change the univariate gait parameters that significantly distinguished the noFOG and FOGConv groups, suggesting that the trajectory of progression did not change pre- vs. post-conversion. However, the decrease in a single participant, n = 9 pre-conversion versus n = 10 for all observations, substantially changed the progression slope cutoff points that distinguished the noFOG and FOGConv groups. While the methodology to calculate such cut offs in progression rate may provide clinical utility in the future, larger sample sizes are needed.
One of the limitations of this work is that to limit patient attrition in a longitudinal study, participants were assessed in the levodopa ON-state, similar to a few prior studies [90, 91]. While this does not provide un-medicated disease progression, patient clinical visits are mostly performed in the medicated state, and therefore changes we see could more easily be implemented into routine clinical care. Despite the medicated state, which could mask disease progression and lead to an underestimation of the rate of decline, we still see differential objective changes in gait between participants who did and did not convert to a FOG phenotype and the pattern was like those that had FOG throughout.
In summary we find that objectively measured gait parameters decline faster in PD patients converting to FOG and those already exhibiting FOG compared to those without FOG. The rate of progression in spatiotemporal gait parameters provided significant predictive power for conversion to FOG. Simply-computed progression rates, that could be easily incorporated into clinical practice, were nearly as effective in characterizing rate of progression as more complicated models that included differences in participant demographics. In the future, addition of other longitudinally assessed gait features that provoke FOG such as turning dynamics and tight spaces, as well as freezing in other body parts such repeated upper limb and lower limb movements and speech may further enhance predictive algorithms since early-FOG is hard to identify in the clinical and research setting. As shown from the variety of predictive features in different studies, larger datasets are needed for more accurate multivariable modeling, and multicenter collaborative efforts, or databases allowing researchers to pool datasets will be necessary to develop an accurate predictive model for FOG. Without such a model, development of protective therapeutics will not be possible.
Footnotes
ACKNOWLEDGMENTS
We appreciate the mentorship of Dr. Garcia-Rill. We also greatly appreciate the commitment and dedication of our participants to this longitudinal data collection project.
FUNDING
This study was funded in part by the UAMS Clinician Scientist Program, NIH NIGMS (GM110702) and the Parkinson’s Foundation (PF-JFA-1935).
CONFLICT OF INTEREST
Dr. Virmani, Ms. Glover and Ms. Pillai, received salary support from the University of Arkansas Clinician Scientist Program and Parkinson’s Foundation grant (PF-JFA-1935). Ms. Glover also received salary support from the NIGMS pilot award to Tuhin Virmani (NIGMS GM110702). Dr. Virmani received salary support from the University of Arkansas for Medical Sciences. Dr. Landes received salary support from the Parkinson’s Foundation grant (PF-JFA-1935). Dr. Factor received honoraria from Lundbeck, Biogen, Takeda, grants from Medtronics, Boston Scientific, Sun Pharmaceuticals Advanced Research Company, Aspen, Biohaven, Impax Therapeutics, Neurocrine, Voyager, Addex Pharma S.A., Prilenia Therapeutics, CHDI Foundation, Michael J. Fox Foundation, NIH 1 P50 NS123103-01, NIH 1R01NS125294-01, Parkinson Foundation and Royalties from Demos, Blackwell Futura, Springer for textbooks, Uptodate, Other Signant Health (Bracket Global LLC). None of the other authors have any financial disclosures or conflicts of interest related to the research covered in this manuscript.
DATA AVAILABILITY
As this is an ongoing longitudinal study anonymized data sets can be shared at the request of a qualified investigator.