
Abstract
Background:
Based on data regarding the prevalence of Parkinson’s disease (PD), the prevalence of impulsive control disorders (ICD) in PD, and the percentage of PD patients driving a car, it has to be assumed that at least 50,000 PD patients with ICD in Germany actively drive a car. However, these patients might be at risk for unsafe driving due to ICD-related dysfunctions such as failure to resist an impulse or temptation, to control an act or other altered neurobehavioral processes.
Objective:
This study determines the influence of ICD on driving ability in PD.
Methods:
We prospectively compared driving simulator performance of 23 PD patients with and 23 matched patients without ICD. ICD had to be socially compensated and presence was defined clinically for primary and questionnaire-based (QUIP-RS) for post-hoc analyses. Furthermore, between-group comparisons of driving-relevant neuropsychological tests were executed.
Results:
Except from a lower blinking frequency when changing lanes, overall driving safety of patients with ICD did not differ significantly from those without—regardless of the clinical or QUIP-RS-based ICD definition. ICD severity did not correlate with driving performance, but the latter correlated significantly with mean reaction times and certain neuropsychiatric tests (MoCA, TMT-A, TAP-M “flexibility” and DBQ “error”).
Conclusion:
Clinically compensated ICD does not seem to impair driving safety in PD patients. Rather, cognitive and attentional deficits appear to be clinical markers for driving uncertainty.
INTRODUCTION
For many patients with Parkinson’s disease (PD), driving a car is essential to maintain at least residual mobility and independency. Higher age, impaired cognition or vision, and, to a lesser extent, severe motor impairment and disease duration have been described as relevant subject-related risk factors for impaired driving in PD [1–5]. Medication-related risk factors for driving in PD are fatigue, daytime sleepiness, and sudden onset of sleep [3, 6–8].
Impulse control disorders (ICD) might also impair driving ability in PD patients [9]. A common key symptom of ICD is the failure to resist an impulse or temptation, to control an act or specific behavior, which is ultimately harmful to oneself or others and interferes in major areas of life functioning [10]. ICDs occur frequently as adverse effects of dopaminergic replacement therapy (DRT) and are more likely related to dopamine agonists (DA) than to levodopa (LD) therapy [11]. Especially tonically elevated dopamine levels and stimulation of D2 receptors have been found to prevent learning from negative decision outcomes, resulting in impulsive behavior and impairment to “hold the horses” [12]. In line, preclinical studies demonstrated that dopamine receptor D2/D3 agonists impair behavioral processes such as risk-taking behavior or preference for uncertainty which likely play a role in ICD. Additionally, altered neurobehavioral processes in PD patients with ICD, such as modified processing of reward or impaired decisional bias are associated with altered activity in cortical and subcortical areas [11]. These likely are reasons for described risky behavior in PD patients [13, 14] and might result in impairment not only “to hold the horses” but also “to hold the horsepower” when driving a car. A few clinical studies showed no or a rather weak negative association of levodopa equivalent dosage (LED) and driving ability [4, 15]. Self-administered high dosage of LD was described anecdotally as reason for unsafe and compulsive, risk-seeking, “reckless” driving in two male PD patients [16].
ICD have been found with a point prevalence of 13.6 to 19.7% [17, 18] and with an even increased frequency up to 32.9% within a five year follow-up [18]. Given an estimated number of PD patients in Germany of up to 420,000 [19] and considering data showing that 60% of PD patients actively drive a car [20], at least 50,000 PD patients with ICD likely drive a car. This might implicate a relevant driving safety issue. However, a systematically approach assessing the influence of ICD on driving is lacking so far.
With this study we aimed to assess driving performance and safety in PD patients with compared to those without ICD and hypothesized that ICD might impair driving safety.
MATERIALS AND METHODS
Subjects
Two groups of PD patients were recruited from our movement disorders outpatient clinic from February to August 2019: one group with clinical ICD (“PD-ICD”) and one without a present or past history of ICD (“PD-control”). Patients were included into the PD-ICD group in case of self-reported or third-party medical history of ongoing individually abnormal impulse control.
Our clinical definition of ICD based on the American Psychiatric Association’s Diagnostic and Statistical Manual (DSM-5) that included ICDs in the chapter of “Disruptive, Impulse-Control, and Conduct Disorders” as a dysregulation of self-emotional and behavioral control [11]. Accordantly, in our study, patients had to present with at least one typical “behavioral addiction” [11] such as pathological gambling (PG), hypersexuality (HS), compulsive buying/shopping (CB), or binge eating (BE) [10, 18]. Patients might additionally suffer from other ICD-related impulsive–compulsive behaviors (ICB) as consequences of DRT such as dopamine dysregulation syndrome (DDS), punding, hobbyism, walk-abouts, or hoarding [11]. We did not include patients with isolated ICB because they may have different neural substrates and risk factors from typical ICDs [21]. We aimed to investigate subjects with an assumed generally altered underlying pathophysiologic process with higher vulnerability or inclination for impulsive behavior. Therefore, inclusion into the PD-ICD group was based on the presence and not on the severity of the ICD, that was additionally estimated by the screening physician according to a self-developed 3-items Clinical Rating Scale (CRS) as mild (=no or slight impact on social life and with complete compensation), moderate (=interfering impact on social life but with sufficient compensation), or severe (=marked impact on social life but with still acceptable compensation). Expression of ICD in the PD-ICD group had to be socially and relationally compensated, i.e., acceptable for the individual and the social environment. Subjects presenting with socially uncontrolled ICD and urgent need for substantial change of medication were excluded due to ethical reasons. Objective ICD according to the Questionnaire for Impulsive-Compulsive Disorders in Parkinson’s Disease-Rating Scale (QUIP-RS) was additionally assessed [22]. Both groups were matched for age, gender, and motor-symptom severity according to the MDS Unified Parkinson’s Disease Rating Scale, part III (MDS-UPDRS-III). Table 1 shows the detailed inclusion and exclusion criteria.
Inclusion and exclusion criteria of the study
The studies’ inclusion (upper part) and exclusion criteria (lower part) are presented here.
General procedure
In all subjects, a comprehensive test battery was applied, including tests for cognition, frontal executive function, handedness, non-motor symptoms and quality of life. Furthermore, questionnaires assessing driving-specific aspects were applied (for details see below).
We compared driving ability in a driving simulator between the clinically defined groups PD-ICD and PD-control. Additionally, we performed a similar post-hoc analysis in which the presence of ICD was defined according to the QUIP-RS [22].
Detailed procedure
Oral and written study explanations were given to all participants and written informed consent were obtained. Subjects were told to wear their regular vision aids best for driving. Demographic data and information on medication of both patient groups, such as LED [23] and intake of DA were gathered. Examination was performed in the medication “on” state (1-2 hours after intake of the patients’ individual medication). First, clinical scores and questionnaires were obtained for patient characterization. After technical instruction and a 5-min training session in the driving simulator, all patients performed the default main driving route with certain predefined challenges. Depending on individual speed the driving assessment took approximately 10–15 min. Afterwards, comprehensive neuropsychological tests were applied. Overall, study participation lasted about 2.5 hours with voluntary breaks if necessary.
Clinical scores and questionnaires
The following validated German versions of recommended clinical scores and questionnaires [24] were applied for patients’ characterization before driving challenge: Edinburgh Handedness inventory MDS Unified Parkinson’s Disease Rating Scale, part III (MDS-UPDRS-III) Hoehn & Yahr Score (H&Y) Questionnaire for Impulsive-Compulsive Disorders in Parkinson’s Disease-Rating Scale (QUIP-RS [22]) Montreal Cognitive Assessment (MoCA [25]) Frontal Assessment Battery (FAB [26]) 2nd Revision of the Beck Depression Inventory (BDI-II) Non-Motor Symptoms Questionnaire and Scale for Parkinson’s disease (PDNMS) Parkinson’s Disease Questionnaire (PDQ-39) Driver Skill Inventory (DSI [27]) Driver Behavior Questionnaire (DBQ [28]) Driving Behavior Survey (DBS [29]) Questions #9 and #25 of the Driving Habits Questionnaire (DHQ [30]).
Driving simulator setting
We used the driving simulator Foerst Model F10-P (Dr.-Ing. Reiner Foerst GmbH, Wiehl; https://www.fahrsimulatoren.eu/de/) providing a realistic driver’s cabin of a recreated Ford Fiesta (see Fig. 1). For further information, please see the Supplementary Material.
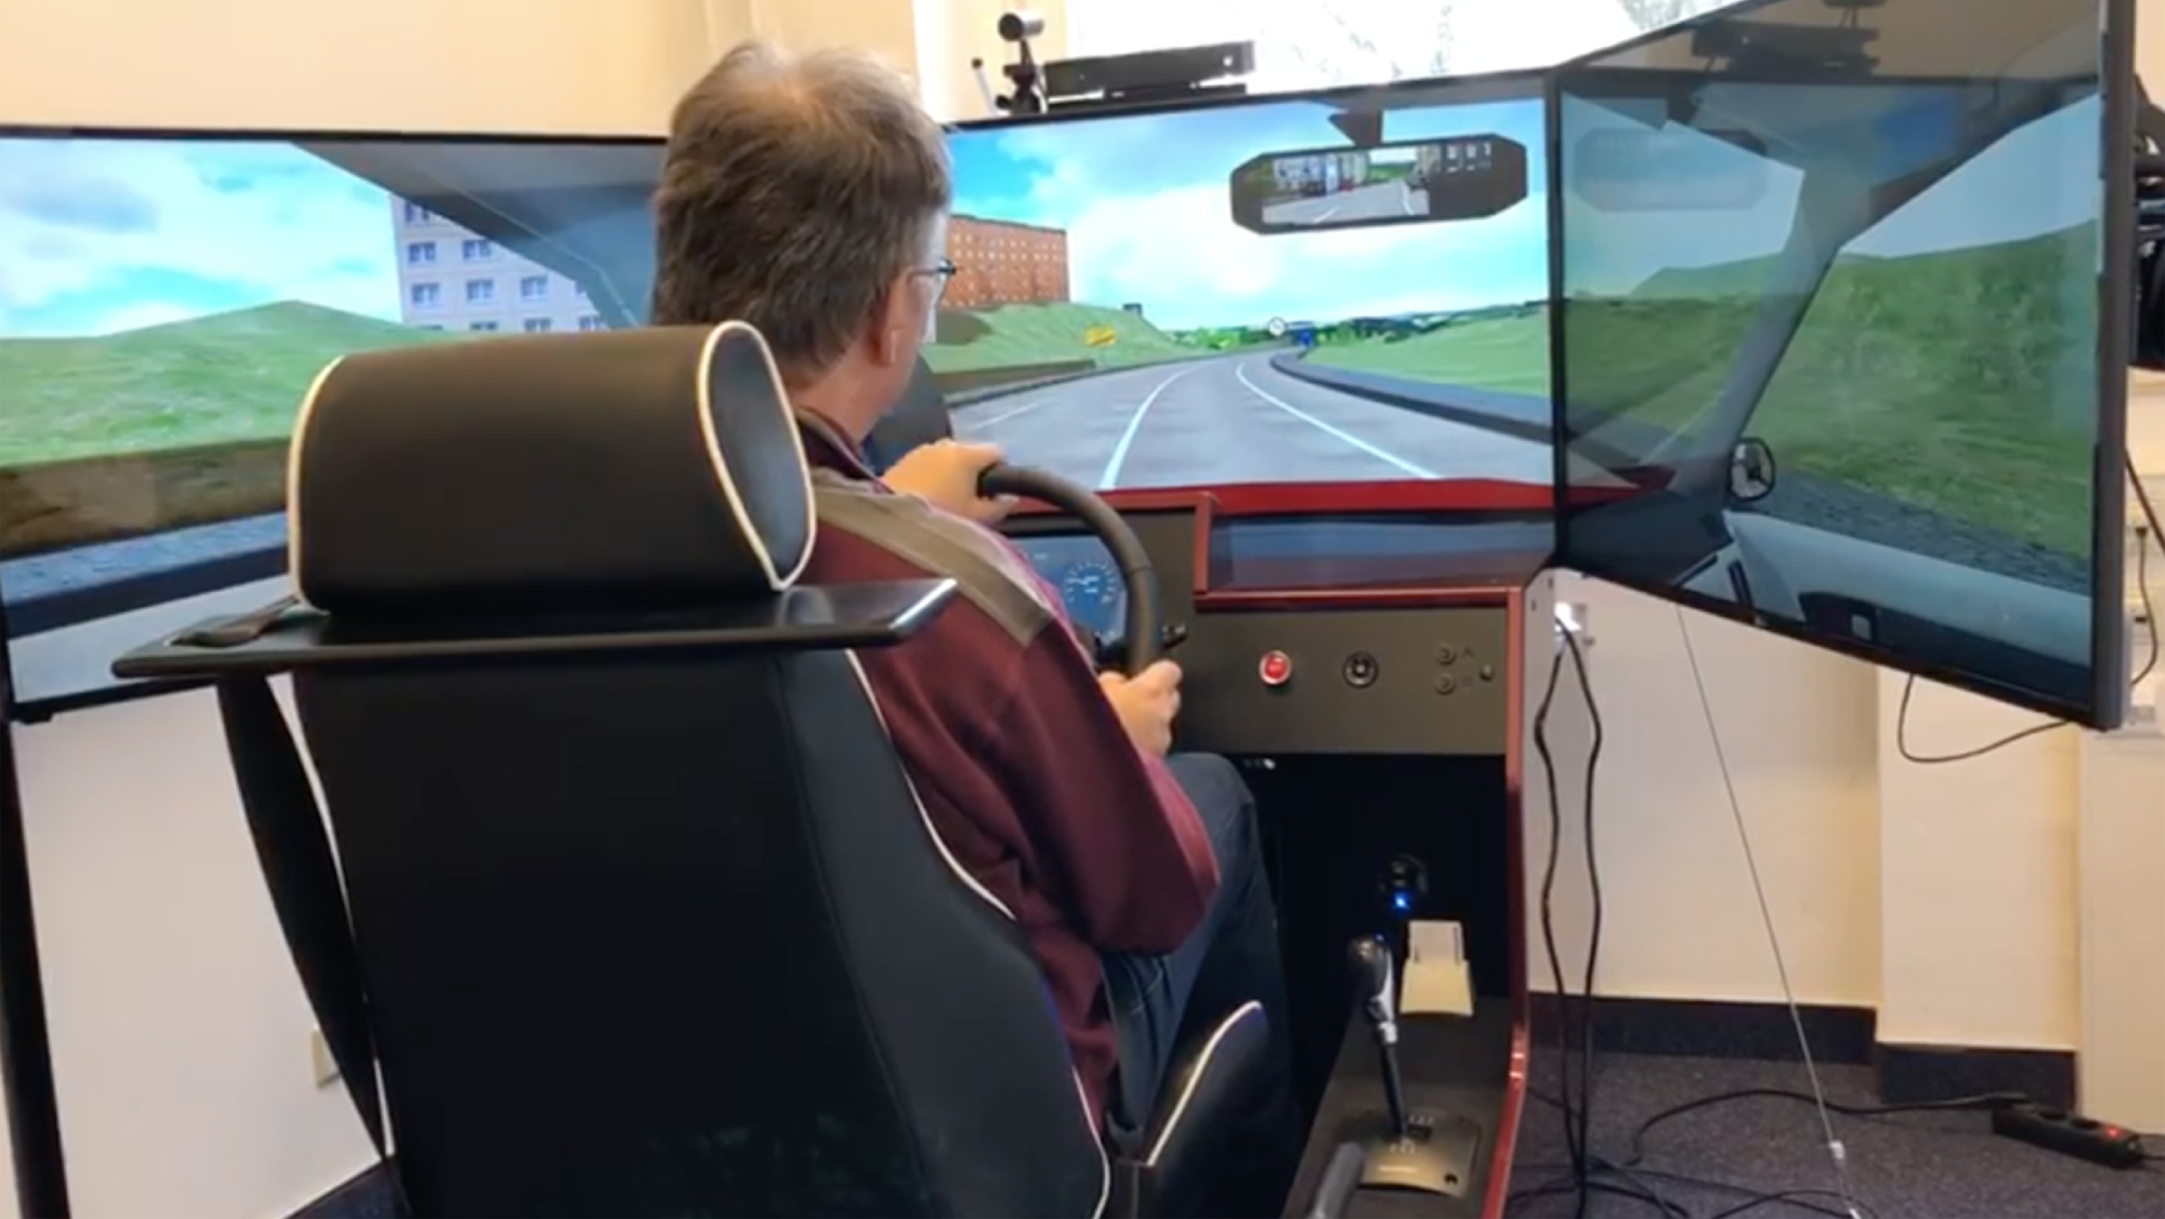
Driving simulator. The driving simulator Foerst Model F10-P that was used in our study is shown here during a real-life situation with one of our participants (subject consented to publication) performing the testing session.
We evaluated the following six parameters (per person and drive) provided by the driving simulation system to assess the participants’ individual driving performance:
Driving errors, definition, and severity factor
Table 2 shows different driving errors with their definition and severity factor according to safety-clinical relevance. These seriousness-weighted driving errors are used to calculate the Driving Safety Score (DSS). *These two driving error categories were later combined for statistical analysis.
These parameters were detected and recorded automatically (log file) and in the case of errors the driver was warned applying a certain sound.
Neuropsychological tests
Next to the driving session, participants had to absolve a battery of neuropsychiatric examinations including the following tests: The German “Test battery for attentiveness testing” (TAP; [32]) with its version TAP-M (Mobility, vers. 2.1./2007) to computationally assess neurocognitive and attentional capabilities. We evaluated critical parameters of six driving-relevant subdomains: 1) flexibility (number of false reaction and RT), 2) alertness (median of RTs), 3) visual scanning (number of missed critical stimuli and median of RTs to non-critical stimuli), 4) Go-NoGo (number of false reaction and median of RTs), and 5) divided attention (number of missed signals). In these 5 subdomains, T-values <40 were defined to indicate an impaired and T-values >40 an unimpaired TAP performance. When one of the parameters per subdomain was suspicious, subjects were designated as having an impaired performance in this subdomain. For 6) distractibility (number of omissions in the conditions with and without distractors), impairment was assumed when frequency of omissions was higher in distracted compared to non-distracted conditions. The Symbol Digit Modalities Test (SDMT [33]) to detect cognitive impairment with focus on attentional deficits by mainly measuring individuals’ information processing speed. Normative data base on age, gender, and educational level. The Trail Making Test (TMT [34]) to screen for cognitive functions. Part A evaluates visuo-motor function and visual processing speed whereas part B assesses working memory, cognitive flexibility, executive functioning, and visual-spatial capabilities. Normative data depend on age and education. The Wechsler Block-Tapping test (“Blockspanne” = WMS-R block span [35]) forward (fw) and backward (bw) is based on the Corsi block-tapping test and was used to measure the spatial short-term (fw) and working memory (bw). Normative data base on age.
Statistical analysis
Driving simulator data were recorded in a simulator-provided log file and transformed into a SPSS file, into which the results of clinical data, questionnaires/scores and neuropsychiatric tests were included afterwards. IBM SPSS version 18 was used for statistical analysis.
Categorial outcomes were compared using Pearson chi-squared test or in case of ordinal outcomes using linear-by-linear chi-squared tests.
For continuous outcomes, group comparisons were performed using parametric tests (t-test, univariate ANOVA). Error frequencies per error category were analyzed using a Poisson generalized linear mixed model with individuals as random intercepts corrected for driving experience (in km/week). In cases with unequal variances, the non-parametric Welch’s t-Test was used.
Correlations were performed using Pearson’s (linear variables) or Spearman’s (ordered variables) correlation coefficient to investigate associations between test results and driving performance. We abstained from correction for multiple testing as we did an explorative analysis with hypothesis-generating p-values.
Ethics
The study was approved by the local ethics committee of the medical council of Hamburg (reference number: PV3557) and is in accordance with the Declaration of Helsinki.
RESULTS
A total of 50 patients with PD were recruited and screened for eligibility. Four participants had to be excluded from the study: two because of a severe motor impairment with an MDS-UPDRS score >50 and two because of severe simulation sickness (nausea close to vomiting). Finally, 46 PD patients (23 with and 23 without clinically defined ICD) were included in the study. Patients were pair-matched by age and group-matched by gender and MDS-UPDRS III scores. All besides two patients (one left-handed and one ambidextrous) were right-handed. No study participant reported severe visual disorders.
Group differences in clinical scores and questionnaires
Clinical and demographic data as well as questionnaire results are given in Table 3. Both groups differed significantly regarding their driving experience (with more km per week in the PD-control compared to the PD-ICD group, T(44) = 2.459, p = 0.018) and their QUIP-RS ratings with—expectedly—higher scores in the PD-ICD group (T(44) = –4.047, p < 0.001). Concerning the QUIP-RS subscales, all subscales except “hobbyism” and “DDS” differed significantly with higher scores in the PD-ICD group (see Table 3 for statistics). All the other parameters did not show any significant between-group differences.
Clinical scores and questionnaire results
Clinical scores, demographic data and questionnaire results including the driving questionnaires of PD patients with (PD-ICD) and without (PD-control) impulse control disorder (ICD) are given as mean±standard deviation and minimum and maximum, number of patients (n) and percentage (%). Statistical significance is marked with *: *p < 0.005, **p < 0.01, ***p < 0.001. Most comparisons were performed using t-Tests. aResult of Welch-Test. bResult of chi-squared Test (linear by linear association). cResult of Pearson Chi-squared Test.
Also regarding results of the driving questionnaires (DSI total scores, DBQ subscales, DBS subscales and DHQ questions #9 and #25) no significant group differences could be found between the PD-ICD group and the PD-control group.
Group differences in driving simulator performance
Results of the main driving parameters are given in Table 4 and did not differ significantly between the PD-ICD and the PD-control group (all p > 0.05).
Driving performance results
Driving simulator results (univariate ANOVA, corrected for driving experience) of PD patients with (PD-ICD) and without (PD-control) impulse control disorders (ICD) are given as mean±standard deviation and minimum and maximum. There were no statistically significant group differences.
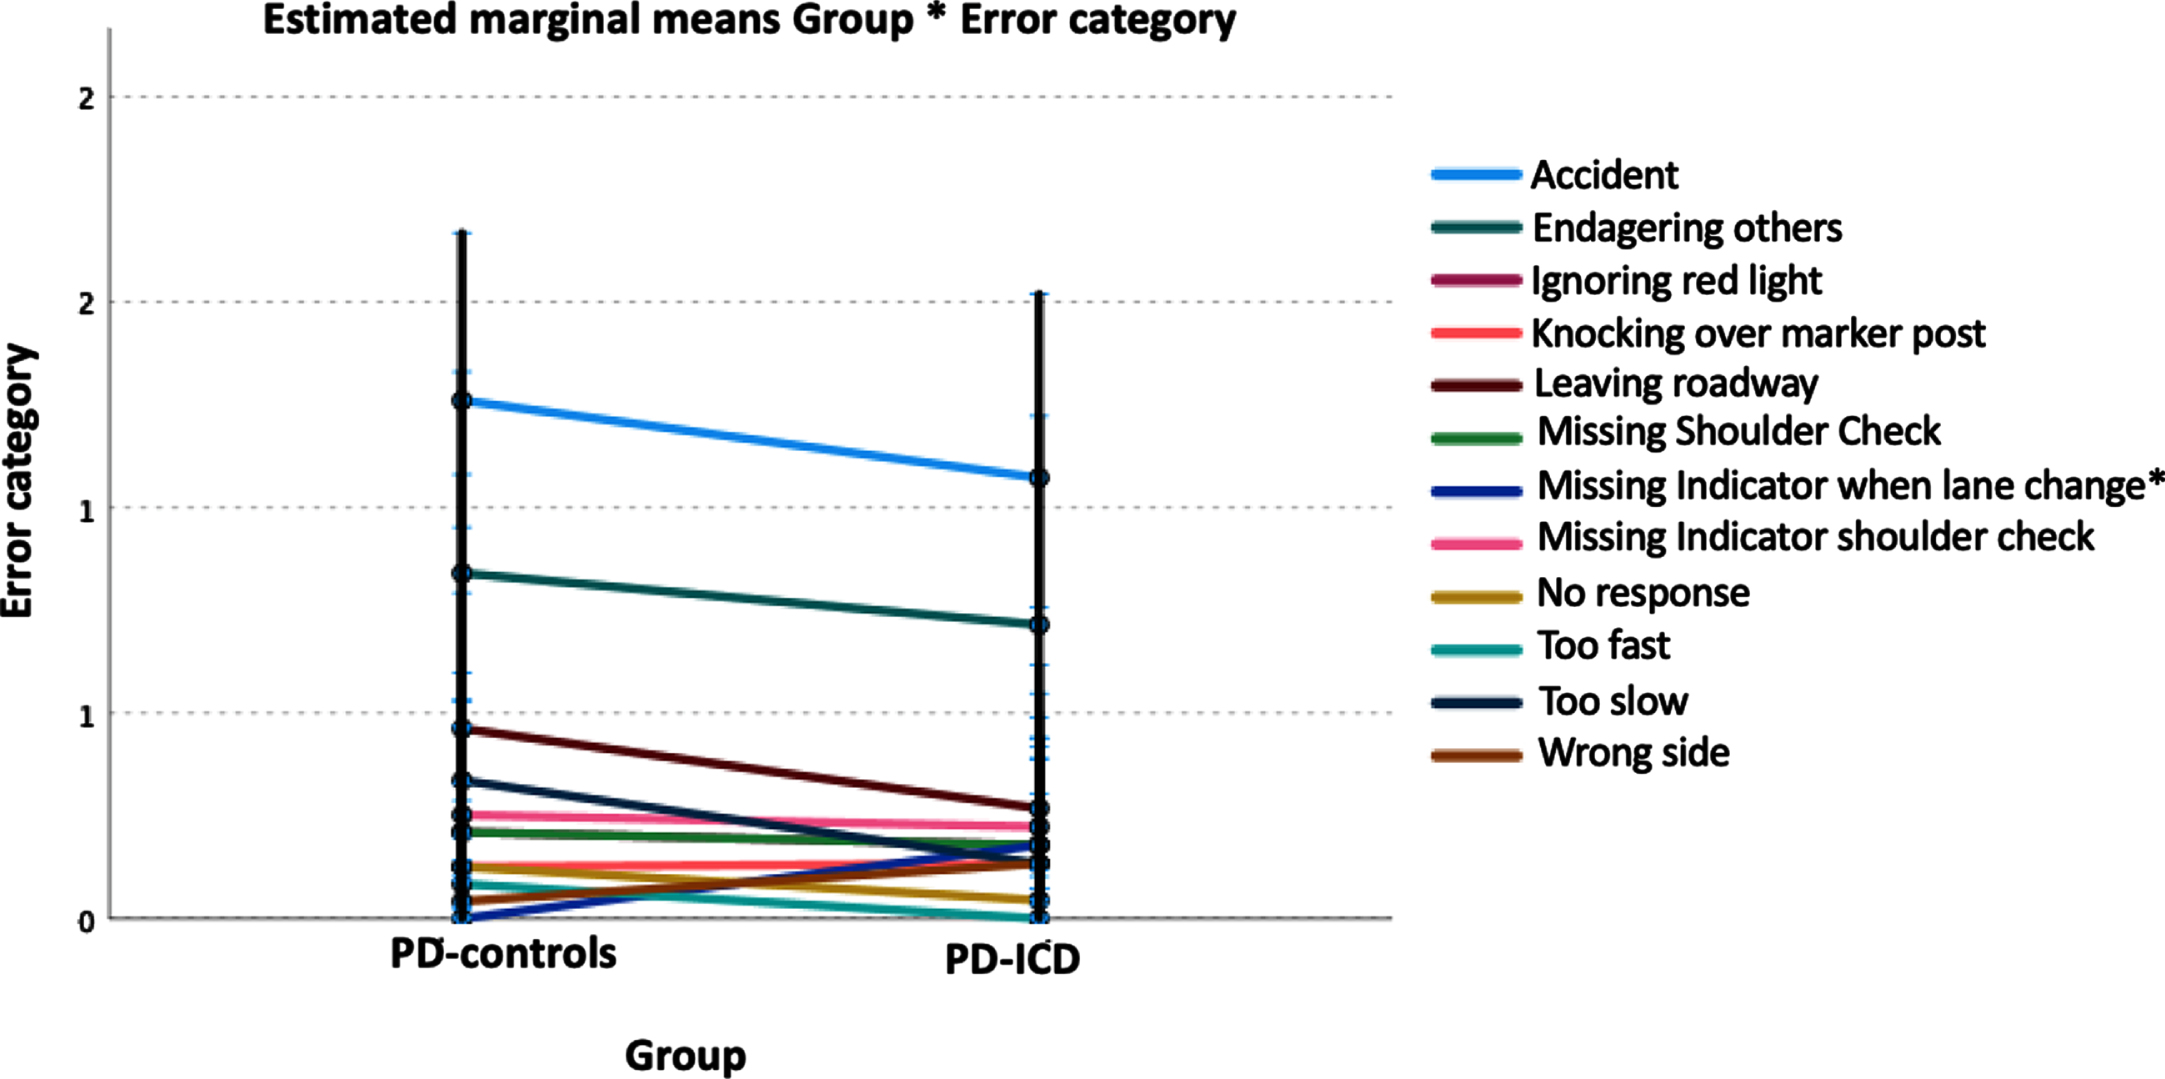
General linear mixed model analysis revealed that in both patient groups, most errors belonged to the driving error categories “Accident” followed by “Endangering other road users” (see Fig. 2). There was an interaction group*error category (p < 0.001), but no mean effect of group per se (p = 0.746). The only group difference was found for the error category “Missing indicator when lane change” (p = 0.029) with no such error type in PD-controls, but in the PD-ICD group (estimated mean = 0.179, CI 0.073–0.437).
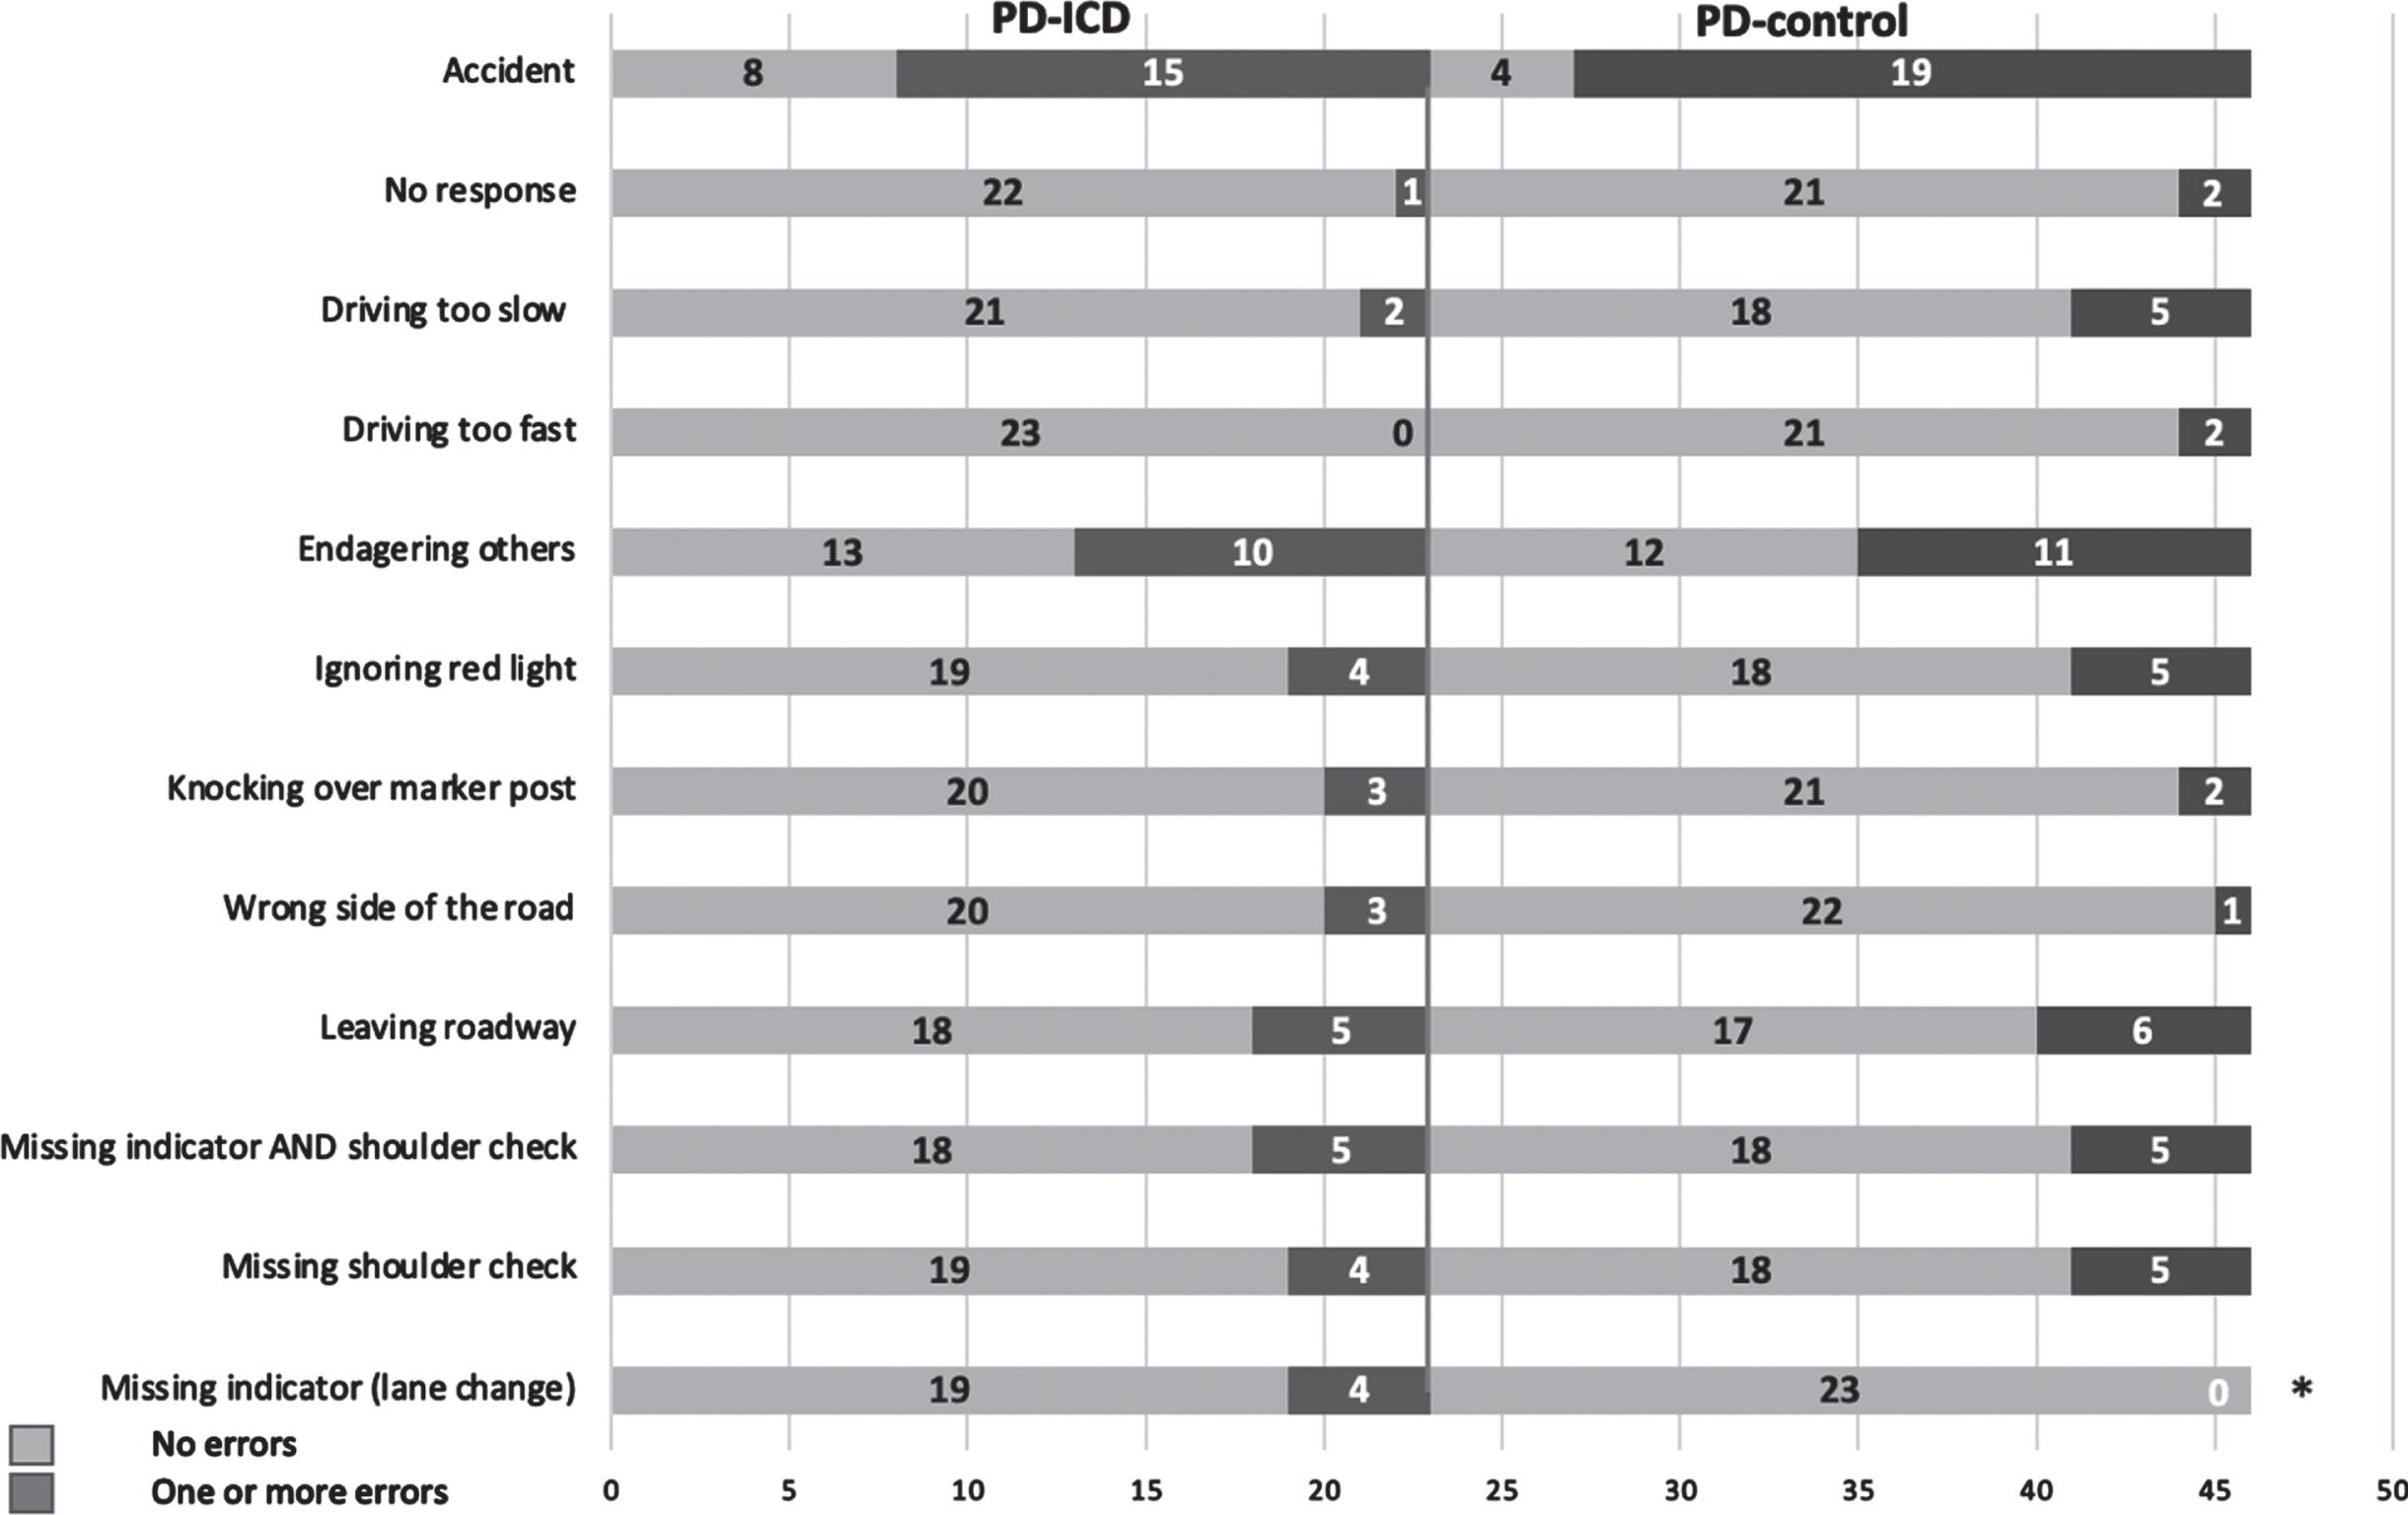
Regarding the number of patients with or without errors per category, both groups only differed in the “Missing indicator when lane change” condition (chi-squared p = 0.036; Fig. 3).
Group differences in neuropsychological tests
We did not find a significant between-group difference in any of the performed neuropsychological tests (all p > 0.05; see Supplementary Table 1).
Correlations between clinical and neuropsychological measures and Driving Safety Score
Table 5 gives an overview of all correlations between the DSS and clinical and neuropsychological data of all participants (n = 46). Significant positive correlations with DSS were found for the driving related tests DBQ subtest “Errors” (p = 0.042), the TMT part A (p = 0.045) and for the mean reaction time in the driving simulator (p = 0.004) meaning that participants with higher DSS composite scores also showed higher errors in the DBQ, needed more time to perform the TMT-A (visual processing) and had longer reaction times in the driving simulator. Negative correlations were found for the MoCA (p = 0.033) and the TAP-M subtest “flexibility” (p < 0.001 1 ), indicating that lower MoCA scores (poorer cognitive function) and more impairment in the flexibility subtest were associated with a higher DSS meaning poorer driving performance.
Correlations with Driving Safety Score (DSS)
Correlations (Pearson or Spearman(a)) of the Driving Safety Score (DSS) with clinical and neuropsychiatric data of all participants (n = 46) are shown with r-values, 95% confidence intervals and p-values. Significant correlations are marked bold. LED, Levodopa equivalent dose; MDS-UPDRS III, MDS Unified Parkinson’s Disease Rating Scale, part III; QUIP-RS_ICD, Questionnaire for Impulsive-Compulsive Disorders in Parkinson’s Disease-Rating Scale, ICD subscore.
Furthermore, no significant correlations were found for the LED of Dopamine agonists and the QUIP-RS ICD or IPQ scores or the Clinical Rating Scale (CRS; all p > 0.20).
Correlations between neuropsychological measures and mean driving speed (mDS)
As—especially an increased—mean driving speed (mDS) might be an indirect indicator of an impulse control disorder and because this variable is not included in the DSS, also correlations for mDS were calculated (both groups combined, n = 46). Significant positive correlations were found for the mDS with the MOCA (r = 0.329, CI: 0.047–0.545, p = 0.025) and the SDMT (r = 0.391, CI: 0.097–0.611, p = 0.008) indicating that patients with better cognition and faster information processing speed drive faster.
Significant negative correlations with the mDS were found with age (r = –0.437, CI: –0.635–0.187, p = 0.002), and with the DBQ subtests Error (r = –0.392, CI: –0.618–(–0.045), p = 0.007) and, by trend, with the TMT parts A (r = –0.252, p = 0.095) and B (r = –0.290, p = 0.053) indicating that older PD patients and those who needed more time to perform the TMT A and B, drive slower.
Post-hoc evaluation of driving performance when defining ICD groups with QUIP-RS
For the explorative post-hoc analysis of driving performance, the presence of ICD was defined according to results of the QUIP-RS and grouped participants as follows: 1) Patients with ICD: QUIP-RS scores ≥10 (PD-ICDscore, n = 27) and 2) Patients without ICD: QUIP-RS scores <10 points (PD-controlscore, n = 19; see Supplementary Table 3). Comparable to the clinical ICD categorization, this approach did not show significant group differences for any of the evaluated driving parameters (mean driving time with p = 0.376; mean reaction time with p = 0.460; DESS with p = 0.804; DSS with p = 0.933). Even when only comparing participants with very high QUIP-RS scores ≥20 (n = 11) and subjects with values below the cut-off score <10 (n = 19), we did not find any significant group differences regarding the driving parameters (all p > 0.05).
Comparison of clinical and QUIP-RS-based categorization of ICD
In the clinically defined PD-ICD group (n = 23), 18 patients had a QUIP-RS score >10 points, indicating ICD. On the other hand, in the clinically defined PD-control group (n = 23), 8 patients scored >10 points and one patient without clinical signs or history of ICD even scored >20 points in the QUIP-RS score. As we took the comprehensive clinical DSM-5 based diagnosis (clinical examination and history) as gold standard to detect ICD, we found the QUIP-RS to have a sensitivity of 78.3% (18/23) and specificity of 60.9% (14/23) for indicating ICD. When relying on the screening tool QUIP-RS as diagnostic instrument, our clinical diagnosis would have a sensitivity of 85.2% (n = 23/27) and a specificity of 73.7% (n = 14/19) to detect ICD. Thus, the QUIP-RS might be rather over-sensitive with more false-positive results (27 compared to 23 according to clinical assessment).
DISCUSSION
Our study indicates that PD patients with clinically and socially compensated ICD drive comparably safe compared to matched PD patients without ICD, at least within a simulator setting. This result applies to both, defining ICD clinically or questionnaire-based using the QUIP-RS score. Patients with ICD missed more often to blink when changing lanes. This might indicate a more careless driving. However, performance of combined execution of blinking and shoulder check as well as overall driving safety was not touched so that the relevance of this result seems to be not crucial.
To our knowledge, this is the first time that a controlled study is available examining the driving behavior of PD patients with ICD. Results suggest that PD patients with socially controlled ICD should not be judged differently from PD patients without ICD in daily life regarding driving ability—an aspect with a high impact on daily routine care considering the high prevalence of both, ICDs [11] and active drivers in PD patients [20]. Furthermore, a test battery applying MoCA, TAP-M “flexibility” subscore, TMT A and the DBQ subscore “errors” might be a suitable screening tool to detect PD patients at risk for driving.
We initially hypothesized a higher risk for unsafe driving in PD patients with ICD as shown anecdotally [16], because ICD might lead to impaired learning from negative decision outcomes, resulting in impulsive as well as risk-taking behavior [12–14]. For the treating physician it is important to know if these ICD patients need special advice with respect to driving ability. To assess the latter, we used a certified driving simulator [31]. Simulator performance has been proven to reflect real life driving ability [1] and is suitable to monitor on-road driving impairments in PD patients [2]. We assessed speed, driving duration and driving errors in key safety traffic situations which have been approved as to reflect safety-related parameters in traffic simulation models [3]. The application of a safety-score weights for the severity of driving errors and accounts for high frequency/low severity and low frequency/high-severity errors. This is meaningful for determining crash risk in PD, because especially low frequency/high-severity errors lead to car crashes [20]. Furthermore, applying rural and urban driving scenarios reflect everyday driving.
Group comparisons (PD-ICD vs. PD-control)
Both PD patient groups, with and without clinically defined ICD did not differ regarding clinical parameters or comprehensive neuropsychiatric testing applied. Only the mileage per week differed with less driven kilometers in the ICD compared to the control group. However, as we controlled for it, we found that it does not bias study results. Additionally, patients with ICD still drove regularly with a mean of 140 km per week. Second, assuming that lower mileage might be associated with lower driving experience, patients with ICD in our study would even be at higher risk for accidents compared to controls. In fact, accident rate was not higher in the ICD group. Third, mileage was previously described to not reflect driving experience properly. While people driving low mileages tend to accumulate much of their mileage on congested city streets with more complex traffic situations, high-mileage drivers typically spend most of those miles on freeways or other divided multilane highways with less demands on driving ability [36]. Noteworthy, both groups in our study caused a relative high number of accidents in comparison to the other possible error categories that may also be a result of the “artificial compilation” of menacing situations in the driving simulator which has to be further examined (and compared with healthy subjects) in the future. To date, it is reported controversial as to whether PD patients have a higher accident rate than healthy controls [3, 38].
The LED of dopamine agonists was comparable between both groups with only numerically more PD patients applying rotigotine in the PD-ICD group. This is remarkable as previous studies found a higher risk for ICD in PD patients with compared to those without DA [39] and higher daily doses of DA in PD patients with ICD compared to those without [40]. However, it is imaginable that patients at risk for ICD already got lower doses of DA than those who are not.
Interestingly, neither driving performance nor neuropsychiatric tests did show any significant group differences between PD-ICD and PD-control subjects, although it has previously been found, that ICD may interfere with various neuropsychiatric functions (that are also relevant for the complex activity of car driving), such as derangements of visuo-spatial long-term memory and frontal lobe functions (visuo-spatial reasoning, set-shifting, cognitive flexibility, spatial working memory and spatial planning [41]). Intriguingly, the severity of cognitive impairment seems to decrease in the order multiple ICDs and hypersexuality > compulsive eating > pathological gambling [42]. Furthermore, hypersexuality might be associated with prefrontal and memory dysfunctions, whereas pathological gambling rather seems to be related to frontal dysfunction [42]. We excluded patients with manifest dementia (MoCA <21), which might explain the overall comparably small number (n = 6) of patients with multiple ICD and the higher rate of pathologic gamblers (n = 8) compared to subjects with hypersexuality (n = 3). This could be a reason for lack of significant neuropsychiatric group differences in our study. Nevertheless, literature regarding neuropsychiatric function impairments in ICD are controversial ranging from worse [43] to comparable [44, 45] to even better functions [46] compared to non-ICD PD patients. This has to be further examined in future studies.
Correlations
Slower reaction times are associated with reduced driving performance in the normal population and evident especially in elderly compared to younger drivers [47]. In PD patients, reaction times (RTs) are usually slower compared to healthy subjects due to impaired motor (timing of movement) as well as premotor processes (onset of movement) [48, 49]. In line, across both PD groups, slower RTs were correlated with higher DSS—indicating slower RTs being a risk for weaker driving performance. Driving speed did not differ between both patient groups. Noteworthy, PD patients with ICD did not drive faster than patients without ICD as might be expected. Overall mean driving speed was slightly above 40 km/h which seems to be adequate as a relevant part of driving was within town with stops at crossings or traffic lights and with challenges demanding to slow down or stop while driving in rural areas. Earlier studies are inconsistent regarding speed in PD patients compared to controls and suggested either overspeeding (=driving faster than posted speed limit, [50]), underspeeding (=driving slower than posted speed limit, [51]) or no differences [52].
To date, there is no defined standardized test battery for PD patients sufficiently predicting driving safety [6]. Therefore, we performed a comprehensive neuropsychological testing to identify potential predictive markers to predict driving ability. Independently of the presence of ICD, we found driving performance being worse in PD patients with lower cognition. This was expected, as cognitive impairment is a main negative predictor for driving safety not only in PD [1] but also for the normal population [53]. While in our study, the total MoCA score was associated with driving outcomes, others found only the MoCA subdomains “attention” and “visuospatial/executive” to be best predictive [54].
The TAP-M “flexibility” subscore might be another useful indicator for driving safety in daily routine as it is a fast and simple set-shifting task in which the participant has to press a button to react to certain target stimuli with two different levels of difficulty. Results were rated either as normal (1, T > 40) or impaired (0, T < 40). The test demands attentional and executive functions that are often impaired in PD patients [55–58]. We found a low performance being correlated with a high DSS, indicating impaired overall driving safety. We did not find other TAP parameters such as the subscores “alertness” [59] or “divided attention” [60, 61] being correlated with driving safety. This is noteworthy, because these subscores have been described in the TAP-M manuscript to be helpful parameters for driving performance in healthy subjects vs. subjects with neurologic diseases or in different age groups.
Additionally, the TMT part A, a short and easy test evaluating visuo-motor function and visual processing speed, could be indicative for poorer driving performance and should also be considered as a screening tool to predict unsafe driving [62, 63], but may have a lack of precision distinguishing competent from incompetent drivers as has been shown before [64] and might rather be sensitive for age [65].
Of our driving specific questionnaires, only the DBQ subscore “errors” showed a positive correlation with the DSS, indicating that this item might be the most sensitive screening test to detect PD patients at risk for driving. However, earlier data in non-PD subjects regarding the predictive value of the DBQ for driving safety are inconsistent [66–69].
Limitations
Number of participants in this study was relatively low (n = 46) and patient samples were rather young (mean age of about 58 years). However, clinically (especially neuropsychiatrically) well-characterized PD patients were included and basic characteristics (age, gender, motor symptom severity, and cognition) were comparable between both groups. As higher age is a major risk factor for reduced driving ability, mean lower age of our participants might reduce age-based risk of biasing driving results. A clinical ICD definition was used primarily to reflect daily routine, where questionnaire or score-based testing of potential ICD is not common. To assess the risk for possible “false group classification”, we performed a post-hoc analysis with assessing ICD applying the QUIP-RS score. Both approaches showed high sensitivity and specificity in detecting ICD and identical results regarding the influence of ICD on driving. However, mainly due to ethical reasons (e.g., urgent need for medication adaptation), we excluded instable patients with clinically or socially decompensated ICD and focused on PD patients with a socially controlled ICD. Thus, results have to be interpreted carefully—especially on an individual level as the severity of a patients’ ICD can change at any time—and further evaluation of driving safety in socially decompensated ICD is necessary in the future.
We did not explicitly examine visual functioning but asked for it and (besides problems with short or distance vision corrected by vision aids) no patient reported severe vision problems.
Finally, the test battery load was high which might have promoted tiredness. However, we prioritized the sequence of our tests and ensured prompt performance of driving session in the medication “on” state to ascertain best possible driving conditions.
Conclusion
PD patients with socially compensated ICD show similar driving simulator performance compared to those without ICD and should therefore not be advised differently regarding car driving safety issues. In daily routine, a test battery applying MoCA, TAP-M “flexibility” subscore, TMT part A and the DBQ subscore “errors” might be a suitable screening to detect PD patients at risk for driving. Abnormalities in these scores should persuade the doctor to suggest further driving ability assessment, including a standardized simulator or on-road driving test.
Footnotes
ACKNOWLEDGMENTS
We thank Gerhard Schön, Center for Experimental Medicine & Institute of Medical Biometry and Epidemiology, University Medical Center Hamburg-Eppendorf, for additional statistical advice and Beate Schönwald, Department of Neurology, University Medical Center Hamburg-Eppendorf, for her support with patient recruitment.
CONFLICT OF INTEREST
The authors have no conflict of interest to report regarding this manuscript.