
Abstract
Background:
The MDS-Unified Parkinson’s disease (PD) Rating Scale (MDS-UPDRS) is the most used scale in clinical trials. Little is known about the predictive potential of its single items.
Objective:
To systematically dissect MDS-UPDRS to predict PD progression.
Methods:
574 de novo PD patients and 305 healthy controls were investigated at baseline (BL) in the single-center DeNoPa (6-year follow-up) and multi-center PPMI (8-year follow-up) cohorts. We calculated cumulative link mixed models of single MDS-UPDRS items for odds ratios (OR) for class change within the scale. Models were adjusted for age, sex, time, and levodopa equivalent daily dose. Annual change and progression of the square roots of the MDS-UDPRS subscores and Total Score were estimated by linear mixed modeling.
Results:
Baseline demographics revealed more common tremor dominant subtype in DeNoPa and postural instability and gait disorders-subtype and multiethnicity in PPMI. Subscore progression estimates were higher in PPMI but showed similar slopes and progression in both cohorts. Increased ORs for faster progression were found from BL subscores I and II (activities of daily living; ADL) most marked for subscore III (rigidity of neck/lower extremities, agility of the legs, gait, hands, and global spontaneity of movements). Tremor items showed low ORs/negative values.
Conclusion:
Higher scores at baseline for ADL, freezing, and rigidity were predictors of faster deterioration in both cohorts. Precision and predictability of the MDS-UPDRS were higher in the single-center setting, indicating the need for rigorous training and/or video documentation to improve its use in multi-center cohorts, for example, clinical trials.
INTRODUCTION
Treatments are still needed to slow the progression of Parkinson’s disease (PD). Reliable predictors of individual progression are also required. Currently, clinical trials mainly focus on treating PD motor symptoms.
The gold standard for assessing clinical impairment in PD is the motor part III of the Unified Parkinson’s Disease Rating Scale (UPDRS, or the revised version by the Movement Disorder Society (MDS-UPDRS) [1]). This scale (comprising a total of four parts) is the gold standard primary outcome measure in clinical trials of persons with PD. Despite the frequent use of MDS-UPDRS subscores, little is known about the single items of the MDS-UPDRS, how they correlate and change with PD progression, and which factors may impact the single-item scores [1–3]. Standardized documentation of PD progression and/or medication effects is increasingly important given the increased remote use of the MDS-UPDRS for video consultations in clinics and clinical trials [4, 5]. Rigidity and postural stability as single items cannot be reliably investigated during video consultations, which recently increased due to the COVID-19 pandemic. It remains to be investigated how these items, in the absence of documentation from increasingly important remote visits, influence the MDS-UPDRS score when assessing disease progression.
The majority of studies assessing the annual rate of change of motor and non-motor symptoms in early PD have reported large inter-individual variation and heterogeneity, even during the first year of observation [6, 7]. This suggests different progression dynamics and a need for predictive (and even personalized) indicators [8, 9] such as validated surrogate markers for various progression phenotypes [10].
Previous reports with up to 800 patients analyzing single MDS-UPDRS parameters reported that age and motor disability by MDS-UPDRS subscore III at baseline predict progression within the first five years after diagnosis [11–15]. Age is known as one of the most relevant factors of disease progression independent of sex-specific differences [12, 16].
The objective of this study was to systematically compare the longitudinal course of PD by using the MDS-Unified PD Rating Scale and to detect possible predictive parameters of different clinical progression. Therefore, we analyzed MDS-UPDRS data in the independent, observational single-center De Novo Parkinson (DeNoPa) and multicenter Parkinson’s Progression Markers Initiative (PPMI) cohorts of early-stage PD versus healthy controls (HC) for up to 6 years in DeNoPa and up to 8 years in PPMI.
This study seeks to increase the knowledge of the progression of PD in the first years after diagnosis and to determine which factors influence the speed of progression based on the widely used MDS-UPDRS scale.
METHODS
The two cohorts
Between 2009 and 2012 participants with recently diagnosed PD who were drug-naïve and age-, sex- and education-matched HC were enrolled in the DeNoPa cohort at the Paracelsus-Elena-Klinik, Kassel, Germany [17]. Participants had to be between 40 and 85 years old, newly diagnosed with PD, and have at least two of the following criteria: resting tremor, bradykinesia, or rigidity according to the UK Brain Bank Criteria (UKBBC) [18]. In addition, they had to fulfill de novo criteria with L-dopa exposure no longer than 2 weeks and not within 4 weeks before study entry. Exclusion criteria were severe vascular encephalopathy or normal-pressure hydrocephalus as shown on magnetic resonance imaging (when available at screening or when detected during imaging studies at baseline), symptoms indicative of multiple system atrophy, or progressive supranuclear palsy, as well as medication-induced PD. HC had to be between 40 and 85 years old, without any active known or treated condition of the central nervous system, and with a negative family history of idiopathic PD at enrolment. The use of antipsychotic drugs was an exclusion criterion for both PD and HC. Controls were matched using frequency matching by age, sex, and education.
The diagnosis was established according to UKBBC with the investigators blinded to the outcome of non-motor assessments. Biannual longitudinal data were collected at baseline (BL), 24-, 48- and 72-months follow-up (FU) in 104 PD and 94 HC (see Supplementary Fig. 5). Detailed inclusion criteria and procedures have been described previously [17].
The ethics committee of the Physician’s Board Hessen, Germany (approval no. FF89/2008) approved the study, which is registered at the German Register for Clinical Trials (DRKS00000540) according to the World Health Organization Trial Registration Data Set.
The PPMI cohort is a prospective, longitudinal, observational, international multicenter study [19]. The initial recruitment occurred at 21 international centers in Europe (five) and the US (16) between 2010 and 2018. Newly diagnosed (within two years prior to inclusion), drug-naïve PD patients (n = 423) and age- and sex-matched HCs (n = 196) were included (http://ppmi-info.org/study-design). PD inclusion criteria were age > 30 years, and a diagnosis of PD according to UKBBC (those with monosymptomatic rest tremor were also enrolled), no intake of dopaminergic medication during the previous 24 months, and dopamine transporter (DaT) deficit in the putamen on 123-I Ioflupane DaT imaging by central reading. Longitudinal FU visits were conducted every three months in the first year and every six months thereafter. Details of the study and the entire protocol can be viewed here: http://www.ppmi-info.org/study-design. Detailed criteria and procedures have been published previously [20]. The data from the PPMI cohort was downloaded on 23.02.2020.
Patients showing characteristics of other neurological disorders during FU that could lead to a faster progression dynamic and reduce comparability were omitted from the analysis (24 subjects in DeNoPa [21] and eight patients in PPMI [22]). Data from DeNoPa was collected biannually and was rated by two movement disorders specialists (BM and JE; Number of subjects PD/HC BL: 135/109; 24 FU: 121/106; 48 FU: 117/100; 72 FU: 104/94) and every 3 months in PPMI (Number of subjects PD/HC 413-415/196) by various (at least two) raters of the 25 sites.
To describe the nonspecific progression of the MDS-UPDRS subscores during the aging process and to evaluate the influence of less impaired PD subjects on the progression, due to different inclusion criteria in both cohorts, we decided to include all the available data (i.e., all PD participants and healthy controls) into the analysis.
MDS-UPDRS
The Unified Parkinson’s Disease Rating Scale (UPDRS) is the most commonly used scale to rate PD symptoms and assess the progression of the disease in clinical practice [23]. In 2007, due to ambiguities in the written text, inadequate instructions for raters, the absence of screening questions on important non-motor symptoms of PD, and new scientific findings, the Movement Disorders Society (MDS) validated a revised version (MDS-UPDRS) [1, 25]. The total 65 items are subdivided into four parts: Subscore I (13 items): non-motor aspects of experiences of daily living, six rater-completed questions, and seven self-completed questions by patients; Subscore II (13 items): motor aspects of experiences of daily living, self-completed by patients; Subscore III (33 items): motor examination; Subscore IV (6 items): motor complications.
A significant correlation between the increase of MDS-UPDRS subscores I-IV and the increment of Hoehn and Yahr stages has been described for up to 15 years of disease duration [26]. The ease of administration and the slightly more sensitive motor assessment (mainly for rigidity and tremor) are considered the advantages of the MDS-UPDRS compared to the previous UPDRS version [24]. Each item is rated on a 5-point Likert scale (range 0–4, with the higher number indicating more severe symptoms). The scale has been widely used as an outcome measurement in clinical trials and is currently without alternatives [27–29].
It is known that the MDS-UPDRS parts I-IV, when analyzed separately, show clinimetrically sound and clinically pertinent results. When first established, the authors of the scale recommended that the subscores be rated separately and that too much weight should not be given to the MDS-UPDRS Total Score. The Total Score is still commonly used in the academic field and is a frequent outcome measure in clinical trials [1]. Based on this, our focus is on the MDS-UPDRS parts I-IV, especially on I-III in de novo cohorts.
Levodopa equivalent daily dose (LEDD)
Baseline assessments in both cohorts were performed in drug-naïve patients and in the “on” state when response fluctuations were apparent at FU.
To compare the applied dosages of the different dopaminergic drugs during the FU visits, the LEDD was calculated using established standards [30, 31]. For PPMI, 15 patients with an LEDD > 2000 (n = 15) were omitted as the data review indicated the possibility of an incorrect entry.
Modeling
Baseline continuous variables were compared between PD and HC using the non-parametric Wilcoxon-Mann-Whitney-Test as some did not show a normal distribution. For the binary variables, Fisher’s exact or the Chi-square test was used. For the continuous sum scores, longitudinal modeling was performed via a random slope and random intercept linear mixed model using the R- package lme4 for the square root of MDS-UPDRS sum scores II, III and Total Score in DeNoPa and the square root of MDS-UPDRS sum scores I, II, III and Total Score in PPMI. For the square root of MDS-UPDRS part IV in PPMI as well as the square root of MDS-UPDRS part I and IV in DeNoPa, the distribution of the sum scores on the original scale was right-skewed (Supplementary Figs. 1 and 2). We, therefore, transformed the dependent variables (the sumscores) to the square root scale to achieve the best possible distribution of the residual errors in the models (shown in the Q-Q-plots in Supplementary Figs. 3 and 4). The square root transformation enhances model accuracy even at the expanse of interpretability.
For the MDS-UPDRS part I and IV in DeNoPa and MDS-UPDRS part IV in PPMI only random intercept models could be fitted for the data. It should be mentioned that exponential regression models fitted with the R function clmm may be more suitable for this data. Nevertheless, we did not follow this line to keep the interpretation of the models simple and practicable for clinical users without the need to go on via a link function. All models were adjusted for age, sex, and LEDD. The FU period considered was six years for DeNoPa and eight for PPMI. Furthermore, age was centered around the mean to allow simple interpretations of the intercepts in the models.
The reported annual rates of change for PD patients are the sum of the variables PD, PD:Time, PD:age, and PD:sex (male).
Ordinal data were fitted using ordinal regression methods. The ordered logistic or ordered logit regression as an extension of binary logistic/logit regression is frequently used if more than two categories (Likert scale compromises of five categories) are present. To model the longitudinal change of the single items (change over time, e.g., from category 3 to 4 or 1 to 2 on the Likert scale) a cumulative link mixed model was fitted with the function clmm from the cran R package ordinal of R. Because the data did not allow the calculations of complex models, those with equidistant thresholds in the clmm function were used, considering a similar probability for a change from 0 to 1 as from 3 to 4. Furthermore, only random intercepts were assumed and only LEDD was taken as a covariate. To test model assumptions of the clmm models we performed a likelihood ratio test of the proportional odds assumption for the covariates in the model by comparing the likelihoods of the models with and without those variables. This revealed only small and non-significant differences in the log-likelihoods of the two models for all subitems. Thus, there is no evidence that the proportional odds assumption is violated in the applied models.
For MDS-UPDRS sum scores, a random intercept model based on the lmer function from the lme4 package with an adjustment for age, sex, and LEDD interaction terms was used. All single items showing a high OR (higher than 1.25 or less than 0.75, i.e., a 25% change to reach the next level on the Likert scale or remaining at the same levels as time evolves) were extracted. Results are shown for the models that were supported by the data (model convergence obtained) in Supplementary Table 1.
Analyzing progression subgroups
For MDS-UPDRS sum scores II, III, and Total Score (based on the random intercept and slopes that could be fitted here) we divided the PD participants of both cohorts into two categories. The fast progressors were defined by a slope higher than the calculated mean slope of the PD group and the slow progressors with a slope less than the mean slope. Baseline characteristics of these subgroups were compared within and between the cohorts (Table 4).
Comparison of the demographics between the fast and the slow PD progression groups in DeNoPa and PPMI
PD, Parkinson’s disease; MDS-UPDRS, Movement Disorder Society-Unified Parkinson’s Disease Rating Scale; DeNoPa, De Novo Parkinson cohort; PPMI, Parkinson’s Progression Markers Initiative.
RESULTS
Demographics
The DeNoPa BL cohort consists of 159 PD patients (66.0% men) and 110 HC (60.9% men). The mean age in both groups was 65 years (PD±9.7, HC±6.8). Demographics have been published previously [17] and are comparable to the PPMI cohort, consisting of 415 PD patients (65.3% men) and 195 HC (64.1% men) with a mean age of 62 in PD±9.8 and 61 HC±11 at BL [32]. All baseline characteristics are shown in Table 1. Regarding baseline demographic data, both cohorts showed significant differences for the more common tremor dominant subtype in DeNoPa and for the more common postural instability and gait disorders subtypes and multiethnicity in mainly US-based PPMI participants. Furthermore, the Hoehn and Yahr stages were higher in the DeNoPa group, with 30.2% of patients in stage 3 vs. 0.5% in PPMI. Positive family history was slightly higher in PPMI (24.8% vs. 15.9% in DeNoPa).
Baseline characteristics of DeNoPa (left) and PPMP (right) cohorts. Multiethnicity was reported in PPMI, further percentage of a positive family history was higher. Hoehn & Yahr Stage 3 was more common in DeNoPa while in PPMI more patients were categorized to lower stages, but MDS-UPDRS showed no relevant differences. Tremor was more frequent in DeNoPa, PIGD more in PPMI. Dopaminergic medication was assessed at the 2-year follow-up. For continuous variables the Wilcoxon-Mann-Whitney test has been used. For categorial variables the Chi-square or the Fischer exact test was used according to more than two or just two categories
PD, Parkinson’s disease; HC, healthy controls; NHY, Hoehn & Yahr stage; MDS-UPDRS, Movement Disorder Society-Unified Parkinson’s Disease Rating Scale; PIGD, postural instability and gait disorders-subtype; TD, tremor dominant subtype; FU, follow-up; NA, not available; SD, standard deviation; DeNoPa, De Novo Parkinson cohort; PPMI, Parkinson’s Progression Markers Initiative.
MDS-UPDRS
At baseline, the mean MDS-UPDRS subscore I was 6.3 in DeNoPa and 5.5 in PPMI, subscore II was 8.7 in DeNoPa and 5.8 in PPMI, subscore III was 23 in DeNoPa and 21 in PPMI, leading to a Total Score of 38 in DeNoPa and 32 in PPMI. Details are listed in Table 1.
The annual rates of progression in points per year of the square root of MDS-UPDRS sum scores for men and women in DeNoPa (Men: I: 0.15; II: 0.18; UPDRS III 0.2; IV 0.15; Total Score 0.3; women: I: 0.16; II: 0.17; UPDRS III 0.15; IV 0.15; Total Score 0.27) and in PPMI (Men: I: 0.17; II: 0.22; UPDRS III 0.32; IV 0.21; Total Score 0.42; women: I: 0.14; II: 0.16; UPDRS III 0.28; IV 0.24; Total Score 0.35) were comparable and not significantly different between the cohorts, but MDS-UPDRS III and Total Score in men (two samples two-sided t-test p-values III and Total Score < 0.01) and MDS-UPDRS III in women (two samples two-sided t-test p-value < 0.01) showed a faster progression in PPMI.
Based on the above-mentioned progression cut-off values, the percentage of fast progressors was higher in PPMI (53.3%, MDS-UPDRS part II, 54% MDS-UPDRS part III, 51.8% MDS-UPDRS Total Score) than in DeNoPa (49.1% MDS-UPDRS part II, 48.4% MDS-UPDRS part III, 46.54% MDS-UPDRS Total Score), for all tested scores. In DeNoPa, faster progression in MDS-UPDRS II, III, and the Total Score was associated with male sex, in PPMI this was associated with the female sex. In DeNoPa, a faster progression in MDS-UPDRS III was linked to lower values in the cognitive screening with the Mini-Mental-State-Examination score (Table 4).
Linear mixed models of MDS-UPDRS sum score progressions in PD
Age showed a small but constantly significant contribution to all MDS-UPDRS subscores on the square root scale (except subscore IV). Male sex only contributed to progression in MDS-UPDRS subscore I. Sex contributed marginally to progression in this analysis. Therefore, we adjusted for sex, age, time (i.e., progression since baseline), and interactions between them and LEDD as well as for interactions between time and the covariates sex, age, and PD.
The results illustrated in Fig. 1 show, that, for example, the square root of MDS-UPDRS part I shows a progression in HC as well over 6 years in DeNoPa. Indeed, all the sum scores include aging as a relevant factor of disease progression. The estimates for the HC can also be found in Table 2. They are similar to the estimates marked as “time”.
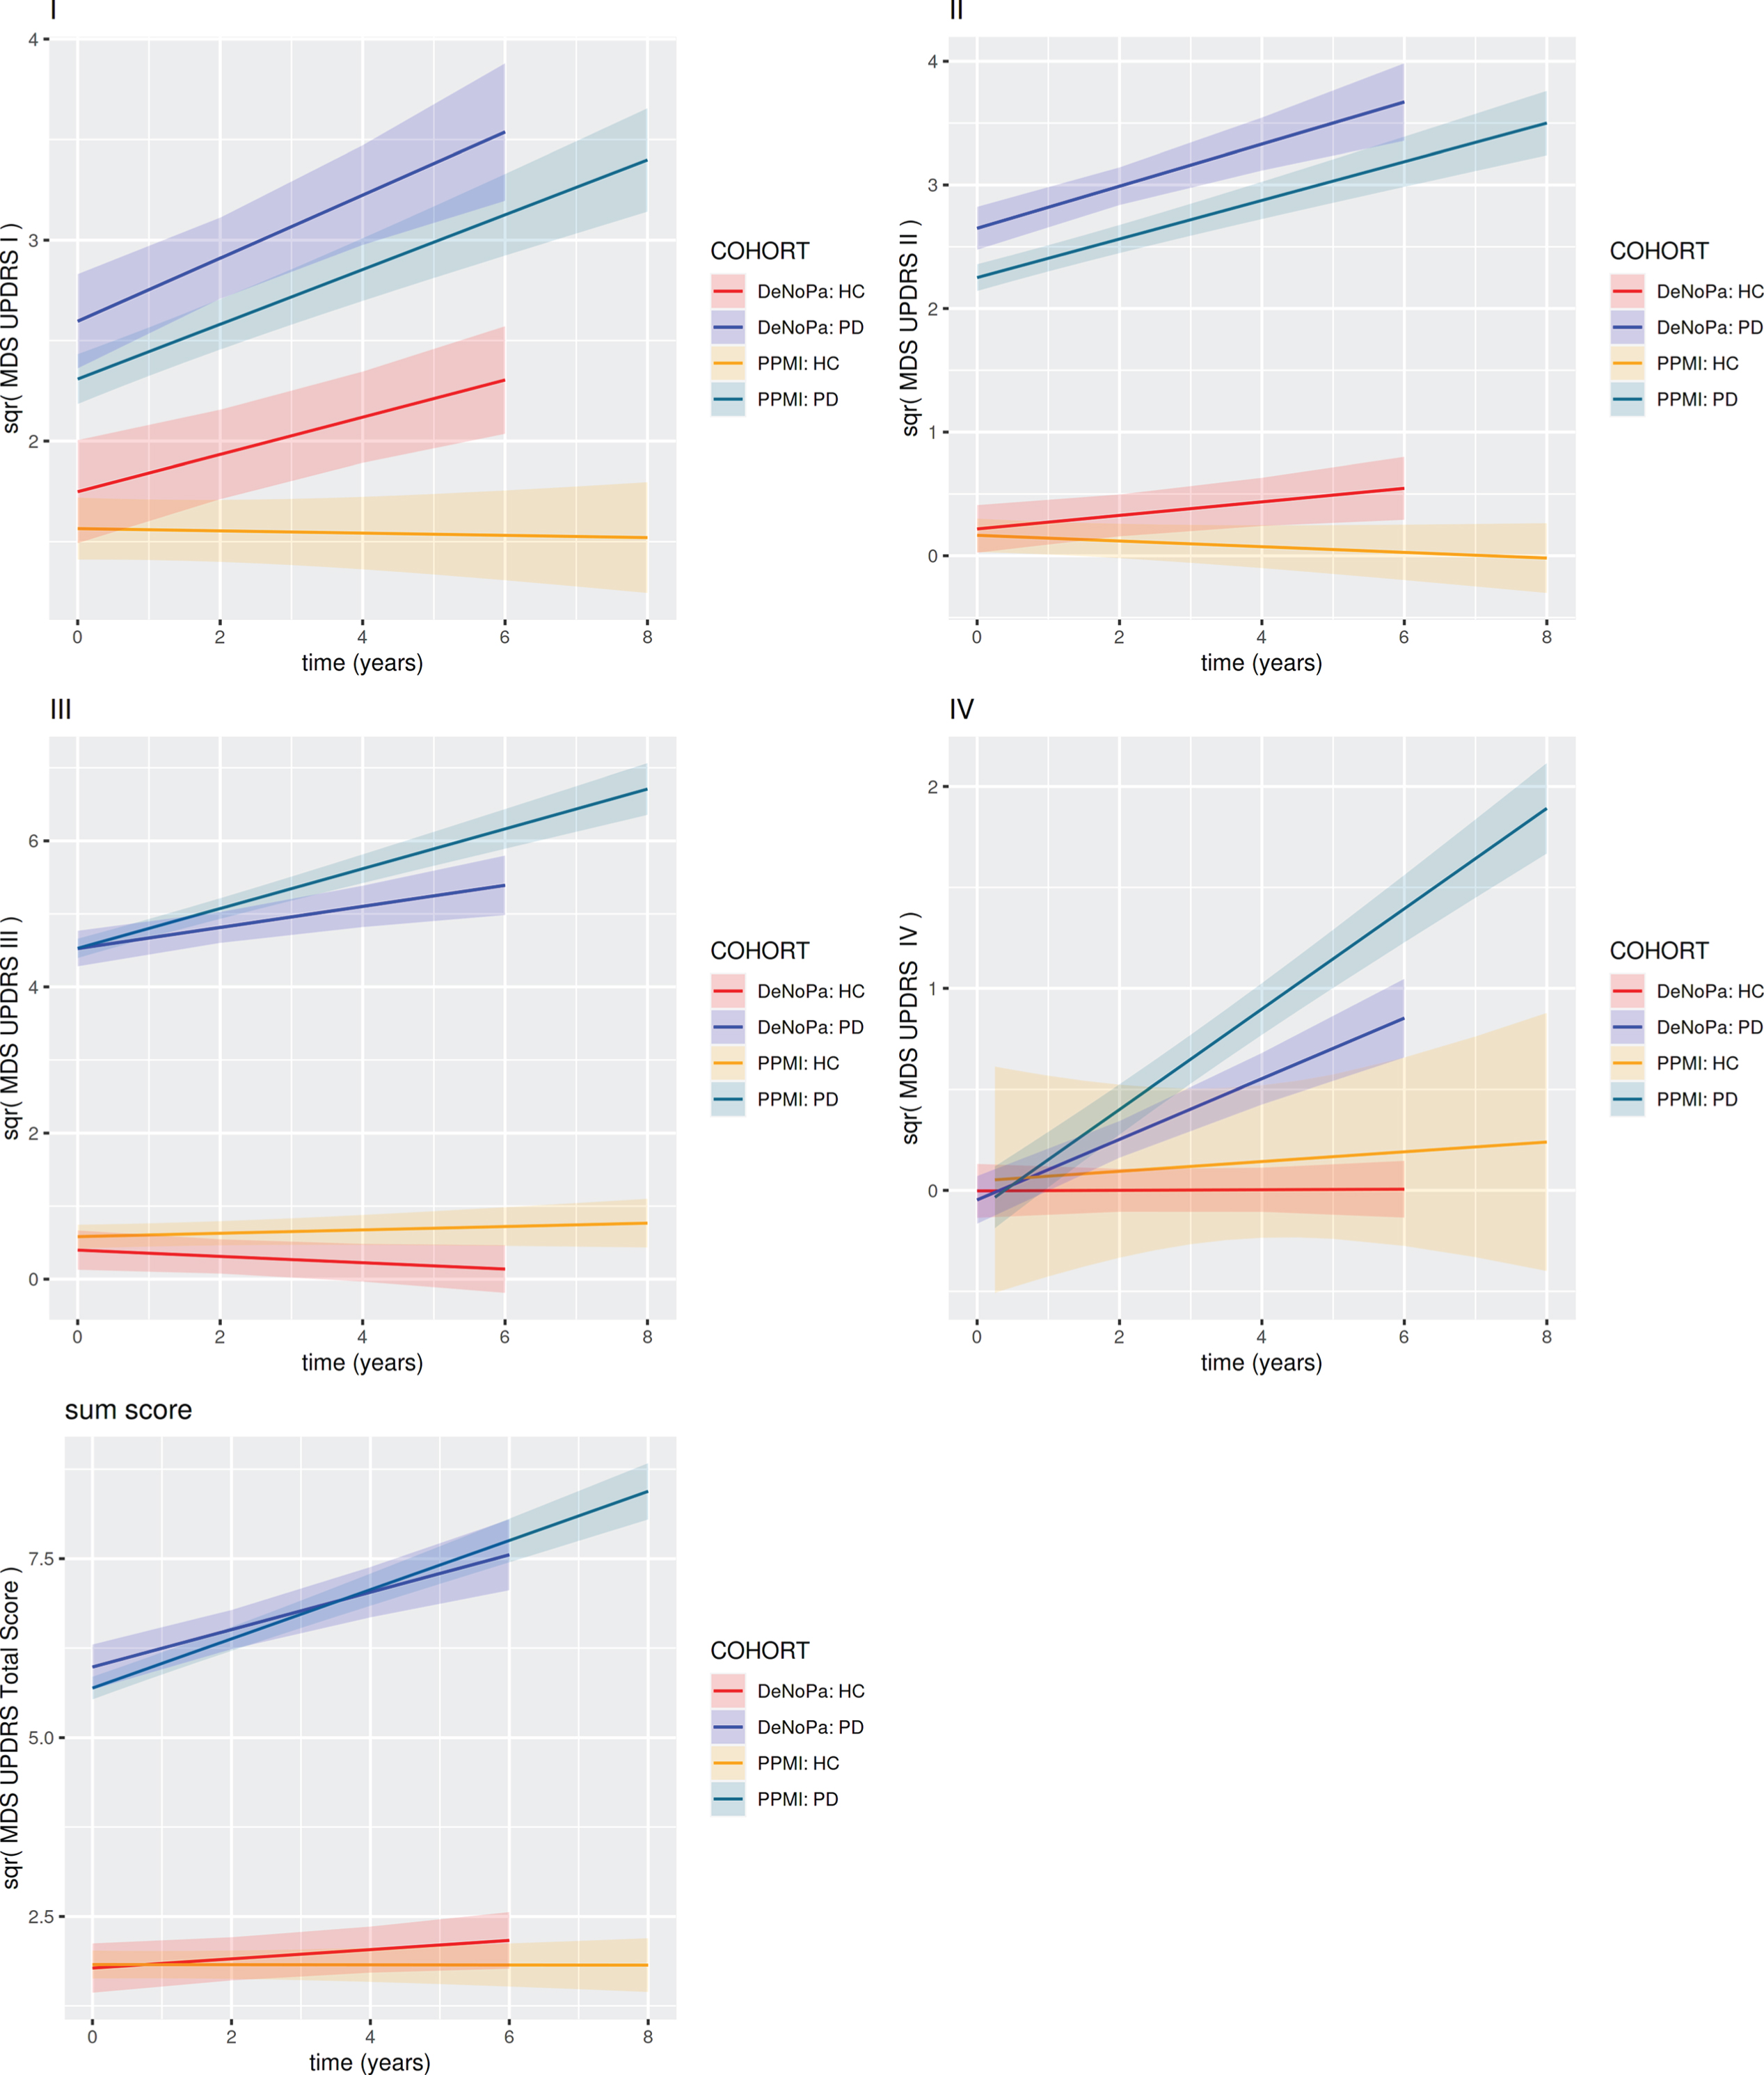
MDS-UPDRS sum scores linear mixed models on the square root scale: The figures show the progression of the square roots of the MDS-UPDRS sum scores over time. Both cohorts show quite similar all over progression and slopes. Red: DeNoPa Healthy Controls, Blue: DeNoPa Parkinson Patients, Orange: PPMI Healthy Controls, Green: PPMI Parkinson Patients. PD, Parkinson’s disease; HC, healthy controls; MDS-UPDRS, Movement Disorder Society-Unified Parkinson’s Disease Rating Scale; DeNoPa, De Novo Parkinson cohort; PPMI, Parkinson's Progression Markers Initiative
Linear mixed models for the square root of the MDS-UPDRS sum scores, adjusted for time, levodopa equivalent dosage (LEDD), age and sex. In the models the square root of the scores has been considered as the dependent variable to evaluate the skewness of the scores distribution
PD, Parkinson’s disease; HC, healthy controls; MDS-UPDRS, Movement Disorder Society-Unified Parkinson’s Disease Rating Scale; LEDD, levodopa equivalent daily dose; DeNoPa, De Novo Parkinson cohort; PPMI, Parkinson’s Progression Markers Initiative.
It is known that dopaminergic medication influences MDS-UPDRS scores [33]. LEDD was relevant for the square root of MDS-UPDRS subscore I (faster progression in DeNoPa), for the square root of MDS-UPDRS subscore II (faster progression in PPMI), showed a negative correlation to the square root of subscore III in both cohorts, and to the square root of the Total Score in PPMI. This means that a higher score, indicating higher motor disability, correlated with lower dosages of the dopaminergic medication and the need for higher dosages for motor symptom control. Of note, we analyzed the MDS-UPDRS scores of both cohorts in the “on” state. The baseline assessment was before the introduction of any medication and the FU assessment in an “off” state could not be achieved because 67% of patients in DeNoPa, and 51% in PPMI were, at the two-year FU visit, receiving dopamine agonists, often as an extended-release formulation,
The linear mixed models of the longitudinal square roots of the sum score of MDS-UPDRS I showed an estimated increase of 0.064 square root points per year in DeNoPa and 0.142 in PPMI. The estimate for the square root of MDS-UPDRS II was 0.115 in DeNoPa and 0.179 in PPMI, while the square root of MDS-UPDRS III was 0.188 in DeNoPa and 0.250 in PPMI. The calculated estimates for the square root of MDS-UPDRS IV showed an increase of 0.149 in DeNoPa and 0.205 in PPMI. Overall, the square root of MDS-UPDRS Total Score estimation per year was 0.197 in DeNoPa and 0.345 in PPMI. Therefore, these results show a higher increase for the square root of the MDS-UPDRS in PPMI over time, compared to DeNoPa (Fig. 1) but slopes and overall progression were quite similar. The inter-subject variability based on the random effects estimations was higher in multi-center PPMI compared to the single-center DeNoPa (Table 3).
Estimates of the random effects in the Linear mixed models for the square root of the MDS-UPDRS sum scores in PD. Inter-subject variability based on the random effects estimations was higher in multi-center PPMI compared to single center DeNoPa
PD, Parkinson’s disease; MDS-UPDRS, Movement Disorder Society-Unified Parkinson’s Disease Rating Scale; DeNoPa, De Novo Parkinson cohort; PPMI, Parkinson's Progression Markers Initiative; NA, not available.
To evaluate the influence of the control data from healthy participants on the overall estimates, we rebuilt the model by excluding the HC. This did not alter the PD model estimates significantly (intercept, time progression, see Supplementary Table 2).
Cumulative link mixed model of single-item analysis of MDS-UPDRS in PD
We next analyzed whether the 65 single items of the MDS-UPDRS reflected disease progression over time and how this differed between the single- and the multi-center cohorts (Fig. 2A for DeNoPa and 2B for PPMI, Supplementary Table 1). We identified a total of 44 single items showing increased ORs for more severe disease progression over time (25 in DeNoPa and 19 in PPMI): from the MDS-UPDRS subscore I, the non-motor symptoms apathy (1.5), sleeping problems (1.7), daytime sleepiness (1.8), urinary problems (1.10), lightheadedness on standing (1.12), and fatigue (1.13) had ORs above 1.26. In the MDS-UPDRS subscore II, documenting activities of daily living (ADLs), freezing (1.13) had the highest OR for disease progression in both cohorts (OR 1.68 in DeNoPa and 1.54 in PPMI). Furthermore, dressing, impairment in performing hobbies and other activities (2.8), as well as turning and getting out of bed showed increased ORs. The MDS-UPDRS subscore III showed the highest number of single items (24) with increased ORs of all subscores, which included rigidity of the neck and lower extremities, the agility of the legs, gait, hand movements (Pronation/Supination, Finger tapping), and global spontaneity of movements. The tremor items (kinetic and resting tremor) showed only low ORs or even negative values. With 25 single items with increased ORs (between 1.24 and 1.87) in DeNoPa against 19 in PPMI, the number was higher in the single-center setting.
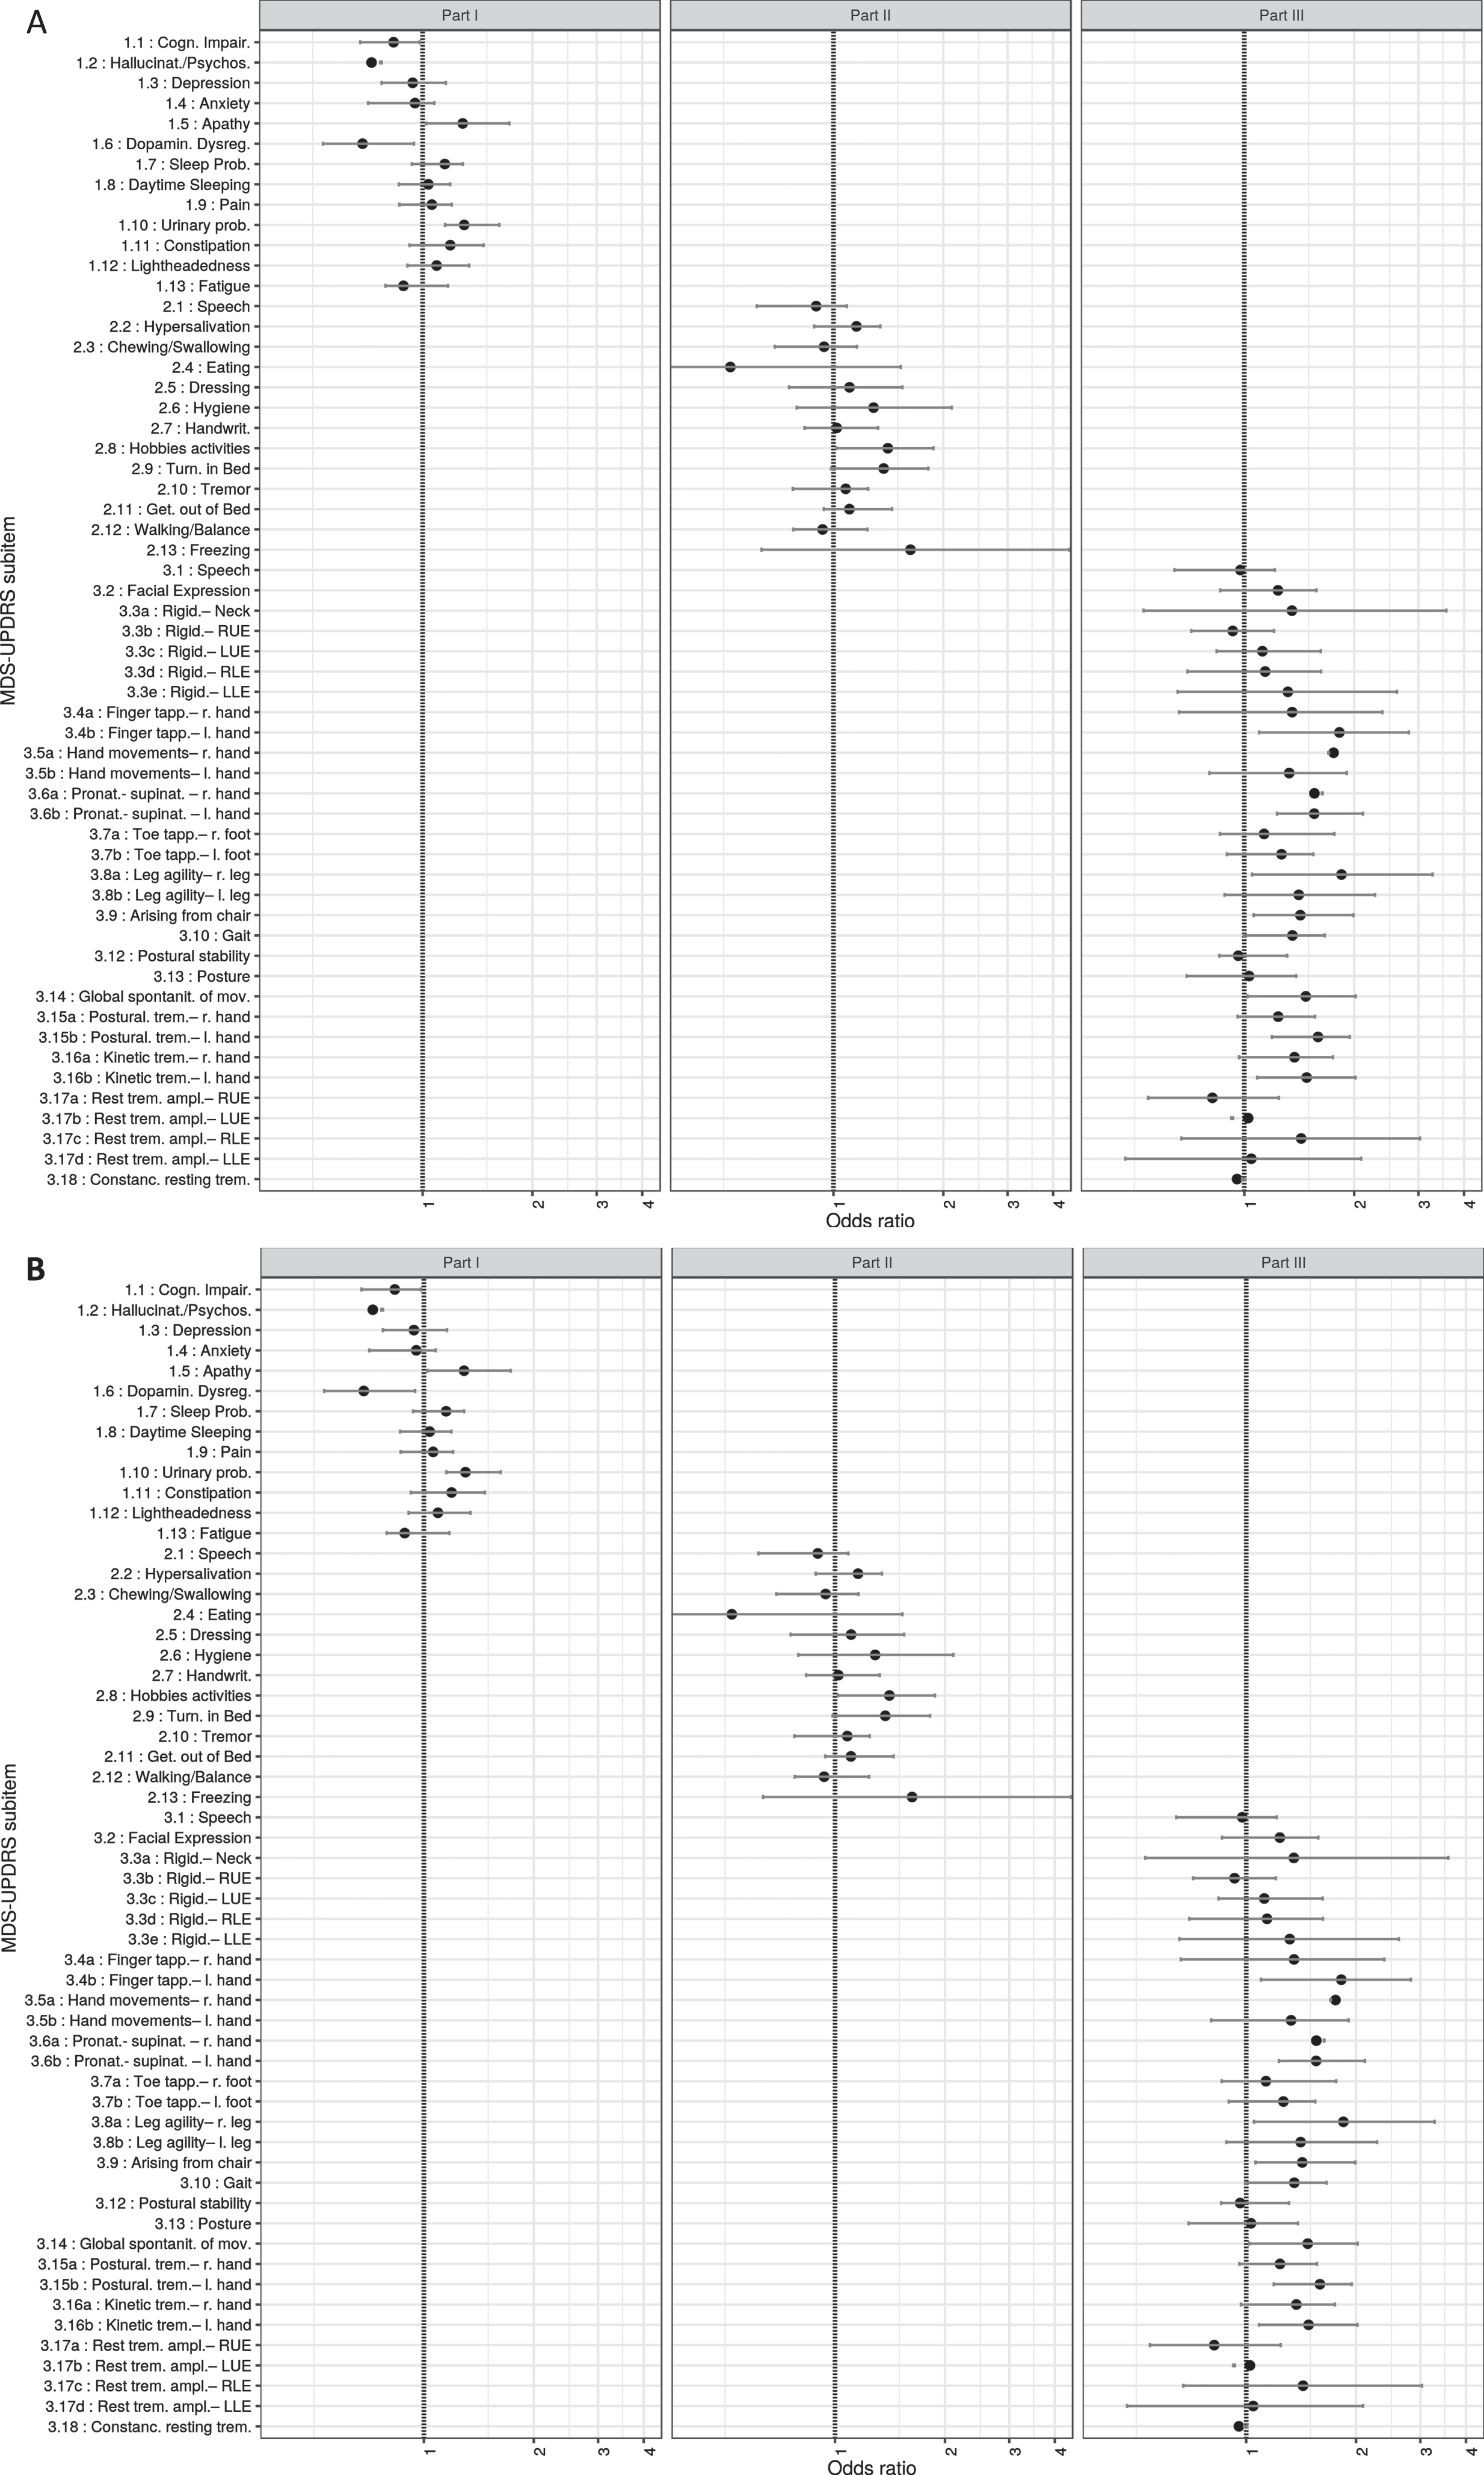
A, B) Results from the “Mixed models for single items” analysis in a DeNoPa and b PPMI. Single items from MDS-UPDRS subscore I, II, and III are shown on the y-axis, the corresponding odds ratios (OR) with the estimates of the standard error on the x-axis. A higher OR implicates a higher chance for progression due to every single UPDRS item from 1.1. to 4.4. Results are shown for the models that were supported by the data (model convergence obtained). With this knowledge, the items gain a prognostic potential for the clinical cause. MDS-UPDRS, Movement Disorder Society-Unified Parkinson’s Disease Rating Scale; DeNoPa, De Novo Parkinson cohort; PPMI, Parkinson’s Progression Markers Initiative; RUE, right upper extremity; LUE, left upper extremity; RLE, right lower extremity; LLE, Left lower extremity.
The adjustment for LEDD showed a significant influence for the single items from MDS-UPDRS subscore I. In particular, non-motor symptoms such as cognitive impairment, psychosis and anxiety, dopamine dysregulation, urinary problems, fatigue, and daytime sleepiness showed higher ORs for LEDD in a positive correlation. The number of single items influenced by the LEDD was much higher in DeNoPa (31 items) than in PPMI (4 items), maybe due to a higher percentage of dopamine agonists in patients’ medications (Fig. 2A, B).
DISCUSSION
The MDS-UPDRS is the only widely used rating scale for assessing PD progression that is not only used for observational cohorts (like DeNoPa and PPMI), but also as a primary outcome measure for clinical trials, a goal, that in the past it has widely failed to meet [15]. Therefore, we performed a detailed dissection of the MDS-UPDRS in two large longitudinal cohorts to identify predictors of progression phenotypes.
DeNoPa and PPMI are both cohorts of early PD individuals with similar demographics.
Based on these similarities we showed independently that both cohorts had a quite similar slope of the square root of the MDS-UPDSRS sub-items as well as the Total Scores over time. This time-dependent increase was higher for MDS-UPDRS parts III and IV in PPMI, but showed the same characteristics, the square roots of MDS-UPDRS parts I, II, and the Total Score did not show relevant differences.
The square root of sumscore linear mixed models estimated annual progress for both cohorts of approximately 0.3 (0.26 DeNoPa, 0.39 PPMI) per year. Matching the slightly higher mean annual rates of changes in MDS-UPDRS parts II and III in PPMI, the multi-center cohort reported faster progressors compared to the DeNoPa cohort. This caused a higher standard deviation in PPMI compared to DeNoPa.
The sumscores also showed a progression within the control group of HC. As mentioned above, increasing age has been reported to have a relevant influence on disease progression, this was confirmed here [14]. Advanced analysis of sex-specific differences revealed that the risk of developing PD is twice as high in men and that disease progression is quicker in women [34]. Our findings were contradictory here because faster progression was associated with male sex in DeNoPa and female sex in PPMI.
Analysis of the group of fast and slow progressors indicated no demographic differences, but there were different treatment regimens in DeNoPa and PPMI. In DeNoPa, more patients were treated with dopamine agonists and a higher dosage of dopaminergic treatment, reflected in higher LEDDs compared to those in the PPMI cohort. In addition, we must emphasize that PPMI was a multicenter trial that in the end included patients from 33 centers whereas DeNoPa consists of only one single center and may reflect specific German treatment guidelines in PD.
Other studies reported that besides motor symptoms, non-motor symptoms show a high frequency and progression with a significant impact on quality of life [35–37]. These studies captured non-motor symptoms mainly through MDS-UPDRS sum scores, but in this study, when analyzing single items of the MDS-UPDRS I focusing on non-motor symptoms, we found strong (> 1.25) positive ORs as indicators of faster progression for the symptom complex of apathy/sleeping problems/daytime sleepiness and fatigue (MDS-UPDRS subscore I). All these items were related to the LEDD and thus influenced by dopaminergic medication, which was as expected: Daytime sleepiness and increased wakefulness during the night are well-known side-effects of dopamine agonists, which were being used by 67% of DeNoPa participants at 2-year FU. Significant influence of LEDD was also documented for anxiety and impulsive-control disorder, which can also be explained by the specific dopaminergic drug effects [38].
When focusing on motor symptoms, higher items of the self-reported experiences of daily living or activities of daily living by MDS-UPDRS II were strong indicators for faster motor progression in our analysis. Recently, studies showed a direct correlation of the reported experiences of daily living and quality of life on motor symptoms in PD patients [39]. Therefore, the self-reported motor items correlate with the motor examination by a rating physician. This is of particular importance because subscore II is generated by a patient-completed questionnaire and thus reflects daily activities during the past week as opposed to the physician’s impression during the clinical visit, which is often short and variable depending on the time since last medication etc. The Food and Drug Administration now requests self-reported, patient-related outcome measures as a target for drug development [40].
Another factor underlying the importance of the MDS-UPDRS II as an outcome measure is that it has been evaluated as a medication-independent scale to describe PD progression over time [15, 33]. However, our analysis revealed that (in PPMI) the items of MDS-UPDRS part II showed a slower progression in participants with higher LEDDs (significantly negative correlation with the estimates), which is logical but could worsen the outcome at a later stage with more fluctuations.
In addition to the negative impact that daily activity restrictions have on the quality of life [41], there is a strong relationship between the progression of motor disability in PD and ADLs [15]. There are several items such as hygiene (2.6), doing hobbies and other activities (2.8), dressing (2.5), and freezing (2.13) that showed markedly increased ORs in both investigated study groups, thus playing an important role in predicting motor progression.
Faster motor progression was also shown by several items from MDS-UPDRS part III (motor part), which correlated as expected with the LEDD. The items rigidity (3.3), gait (3.10), hand movements (3.5), pronation/supination (3.6), and finger tapping (3.4) showed high ORs as progression predictors. This is in line with previous findings of a faster progression of bradykinesia, rigidity, and global spontaneity of movements and the reported relevant role of these symptoms in the early years of the disease [14, 15].
Annual rates of change between female and male PD subjects in DeNoPa and PPMI
MDS-UPDRS, Movement Disorder Society-Unified Parkinson’s Disease Rating Scale; DeNoPa, De Novo Parkinson cohort; PPMI, Parkinson’s Progression Markers Initiative.
Deterioration of motor symptoms as assessed by subscore III during the first years of PD have been reported and rigidity and bradykinesia, which are seen as promising motor progression markers have consequently been investigated in longitudinal cohorts [7, 42].
Markedly low ORs were found for resting tremor as a relatively “benign” symptom at the earlier stages of PD [43–45]. Non-tremor items showed poor discrimination and thresholds between different motor severity levels, leading to the suggestion that tremor and non-tremor items of the MDS-UPDRS should be evaluated separately.
The MDS-UPDRS part III is evaluated by the rating physician and is always an assessment of the actual motor function at a certain timepoint. One key limitation of the MDS-UPDRS is the scale itself is based on a Likert scale ranging from 0 to 4. Widening the Likert scale and allowing smaller steps such as 1.0, 1.5, and 2.0 could be an effective way of rating motor function more precisely and would render the subscore more sensitive to smaller changes. This can be especially valuable to test possible small effects in early PD, where symptoms are mild and fluctuations with off-times or dyskinesias (covered by MDS-UPDRS IV) are not present.
Some limitations of our analysis need to be considered, in particular, the sumscore modeling approach used. Treating ordinal responses as continuous measures is limited (because the scale is not a ratio) but can be appropriate as part of a practical approach that applies a linear regression model to it, as long as it is reasonable to assume that the scale can be treated as interval data (i.e., the distances between individual response categories are meaningful/comparable). A further limitation concerns the selected cohorts, not including more cohorts with higher numbers of participants, and the different and relatively short FU intervals that could influence the assumed linearity of long-term progression.
We found overall higher ORs in the single-center study (DeNoPa) compared to the multicenter cohort (PPMI), which can blur the precision in clinical trials that are usually multicentric. It should be mandatory for further clinical trials to include extensive rater training of MDS-UPDRS evaluation. This is also now integrated into the ongoing extended PPMI study.
CONFLICT OF INTEREST
BM has received honoraria for consultancy from Roche, Biogen, AbbVie, UCB, and Sun Pharma Advanced Research Company. BM is a member of the executive steering committee of the Parkinson Progression Marker Initiative and PI of the Systemic Synuclein Sampling Study of the Michael J. Fox Foundation for Parkinson’s Research and has received research funding from the Deutsche Forschungsgemeinschaft (DFG), EU (Horizon2020), Parkinson Fonds Deutschland, Deutsche Parkinson Vereinigung, Parkinson’s Foundation and the Michael J. Fox Foundation for Parkinson’s Research.
CT has received honoraria for consultancy from Roche, and honoraria for educational lectures from UCB. CT has received research funding for the PPMI study from Michael J. Fox Foundation and funding from the EU (Horizon2020) and stipends from the International Parkinson and Movement Disorder Society.
SS has received salaries from the Deutsche Forschungsgemeinschaft (DFG) under grant agreement No. MO 2088/5-1 and from the EU Horizon 2020 research and innovation program under grant agreement No. 634821.
MB, MD, TW, EL, and JE have nothing to disclose concerning the present study.