
Abstract
Background:
Parkinson’s disease (PD) is associated with various non-motor symptoms, including cognitive deterioration.
Objective:
Here, we used data from the DEMPARK/LANDSCAPE cohort to describe the association between progression of cognitive profiles and the PD motor phenotypes: postural instability and gait disorder (PIGD), tremor-dominant (TR-D), and not-determined (ND).
Methods:
Demographic, clinical, and neuropsychological six-year longitudinal data of 711 PD-patients were included (age: M = 67.57; 67.4% males). We computed z-transformed composite scores for a priori defined cognitive domains. Analyses were controlled for age, gender, education, and disease duration. To minimize missing data and drop-outs, three-year follow-up data of 442 PD-patients was assessed with regard to the specific role of motor phenotype on cognitive decline using linear mixed modelling (age: M = 66.10; 68.6% males).
Results:
Our study showed that in the course of the disease motor symptoms increased while MMSE and PANDA remained stable in all subgroups. After three-year follow-up, significant decline of overall cognitive performance for PIGD-patients were present and we found differences for motor phenotypes in attention (β= –0.08, SE = 0.003, p < 0.006) and memory functions showing that PIGD-patients deteriorate per months by –0.006 compared to the ND-group (SE = 0.003, p = 0.046). Furthermore, PIGD-patients experienced more often difficulties in daily living.
Conclusion:
Over a period of three years, we identified distinct neuropsychological progression patterns with respect to different PD motor phenotypes, with early executive deficits yielding to a more amnestic profile in the later course. Here, in particular PIGD-patients worsened over time compared to TR-D and ND-patients, highlighting the greater risk of dementia for this motor phenotype.
Keywords
INTRODUCTION
An increasing effort has been made to identify potential risk factors for cognitive decline and incident dementia in Parkinson’s disease (PD) [1, 2]. Cognitive impairment is present in approximately 30–40% of PD patients [3], with prevalence increasing over the disease course up to 50% after ten years [4], reaching 80% at 20 years after diagnosis [3, 5].
The cognitive profile associated with PD is heterogeneous [6, 7]. Due to the known fronto-striatal dysfunction, deficits in executive functions, as well as in attention and in working memory, are frequently present in earlier stages of PD [1, 7]. With a high prevalence of dementia in later stages of PD of about 50% [8], its cognitive profile is generally associated with additional deficits in memory and visuospatial abilities, which are assumed to mirror a late temporo-parietal dysfunction [9].
Patients can be divided into either tremor-dominant (TR-D), postural instability gait disorder (PIGD) or not determined (ND) motor phenotypes [10]. Others divide patients into tremor-dominant, akinetic-rigid, and mixed phenotypes [11]. Several modifiable factors have been associated with cognitive impairment in PD [12] and we have previously shown that distinct cognitive profiles are associated with distinct motor phenotypes. Our cross-sectional report on the LANDSCAPE cohort [6], a multicenter longitudinal observational study investigating cognitive functions in PD-patients, delineated that cognitive deficits seem to be less severe in TR-D-patients, and that PIGD-patients performed worse in executive functions, which was in turn negatively correlated with non-tremor motor scores.
Similarly, the motor phenotype may also impact progression of cognitive deficits, as there is evidence that PIGD-patients not only show faster cognitive decline, but also have greater risk of dementia [13] and higher depression rates [14]. This may be particularly relevant for the role of motor phenotype and the progression of cognitive impairment, as patients initially presenting as TR-D-patients tend to convert to the PIGD-type over the disease course [10].
The aim of the current study was to assess cognitive impairment progression and the predictive value of motor phenotype in cognitive decline in PD, using long-term data from the DEMPARK/LANDSCAPE study [15]. Specifically, we assessed if there is a distinct profile of cognitive decline in relation to motor phenotype, where we hypothesized that PIGD-patients show more cognitive deficits in comparison to TR-D motor phenotypes. Furthermore, we analyzed if TR-D-patients tend to convert to the PIGD-type and how this conversion is related to cognitive function.
METHODS
Study design and participants
Patients were assessed annually (n = 711 at baseline) in a multicenter longitudinal cohort study (DEMPARK/LANDSCAPE) at nine movement disorder clinics within university hospitals across Germany (Aachen [n = 104], Bonn [n = 44], Dresden [n = 82], Frankfurt/Main [n = 83], Kassel [n = 60], Kiel [n = 77], Marburg [n = 82], Ulm [n = 86], and Tübingen [n = 93]).
Inclusion criteria for the study cohort included an age between 45 and 80 years and a diagnosis of idiopathic PD. In the study cohort, n = 286 patients had a normal cognitive profile (PD-N), n = 314 were classified as having mild cognitive impairment (PD-MCI), and n = 103 having dementia (PD-D). All investigators were experienced in the use of the applied scales. The first baseline visit of this cohort was 06/10/2009, and the last patient after six-year follow-up was assessed on 22/03/2017.
The DEMPARK/LANDSCAPE study was approved by the Ethics Committee of Philipps University Marburg (DEMPARK: approval no. 178/07 26 March 2009; LANDSCAPE: approval no. 25/11 18 October 2011) as well as the local ethics committees of all participating centers. All patients gave written informed consent before enrolment.
Procedures
A full description of procedures, data collection, and data storage was provided in our report of the baseline data [6, 15]. Data about disease manifestation and duration, Hoehn & Yahr state and medication were collected at baseline visit. Of particular interest for our current study, the Unified Parkinson’s Disease Rating Scale, assessing motor symptoms (UPDRS parts I, III, IV), as well as patient-related outcomes (PROMs), including the Neuropsychiatric Inventory [16], the Geriatric Depression Scale (GDS) [17], the Parkinson’s Disease Questionnaire 39-item version (PDQ-39) [18] and the EuroQol-5 Dimension questionnaire (EQ-5D) were administered annually. Annual visits also included screening tests such as the Mini-Mental State Examination (MMSE) and Parkinson Neuropsychometric Dementia Assessment (PANDA) [19], as well as neuropsychological tests measuring the following cognitive domains: memory (Consortium to Establish a Registry for Alzheimer’s Disease (CERAD)+word list direct recall, delayed recall, recognition, delayed recall – intrusions and figure delayed recall [20], Wechsler Memory Scale – Revised (WMS-R) Digit span forward [21]), executive functions (CERAD+semantic word fluency and formal-lexical word fluency, Modified Cart Sorting Test categories, non-perseverative errors and perseverative errors [22], WMS-R Digit span backward, Trail Making Test (TMT)-B and TMT- B/A [23]), attention (Stroop Word Reading, Color Naming, Interference [24], Brief Test of Attention [25], TMT-A), visuospatial (LPS 50 + subtests 7 and 9 [26], CERAD + figure copying), and language (CERAD + Boston Naming Test).
Operationalization of motor phenotype: TR-D, PIGD, and ND
The UPDRS-III scores were used to define the motor phenotype at each visit, following the operationalization previously performed for the baseline data [6]. In summary, the tremor and non-tremor score were calculated as follows: (item 20 + item 21)/7 and (item 18 + item 19 + item 22 + item 27 + item 28 + item 29 + item 30 + item 31)/12, respectively. TR-D-patients were determined by having either a ratio (tremor score/non-tremor score) of ≥1.5, or a positive tremor-score and 0 as non-tremor score. PIGD-patients were defined by either a ratio ≤1.0 or a positive non-tremor score and 0 as tremor-score. For ND-patients the ratio ranged from > 1 to < 1.5 or both scores were 0.
To minimize missing data, as some patients skipped study visits or could not be clearly classified (see Fig. 1), we set the range for calculating the motor scores for baseline and longitudinal three-year follow-up analysis on at least five available UPDRS-scores for the tremor-score (5/7 scores) and least ten available scores for the non-tremor score (10/12 scores). The baseline classification of motor phenotype was then used for the longitudinal analysis.
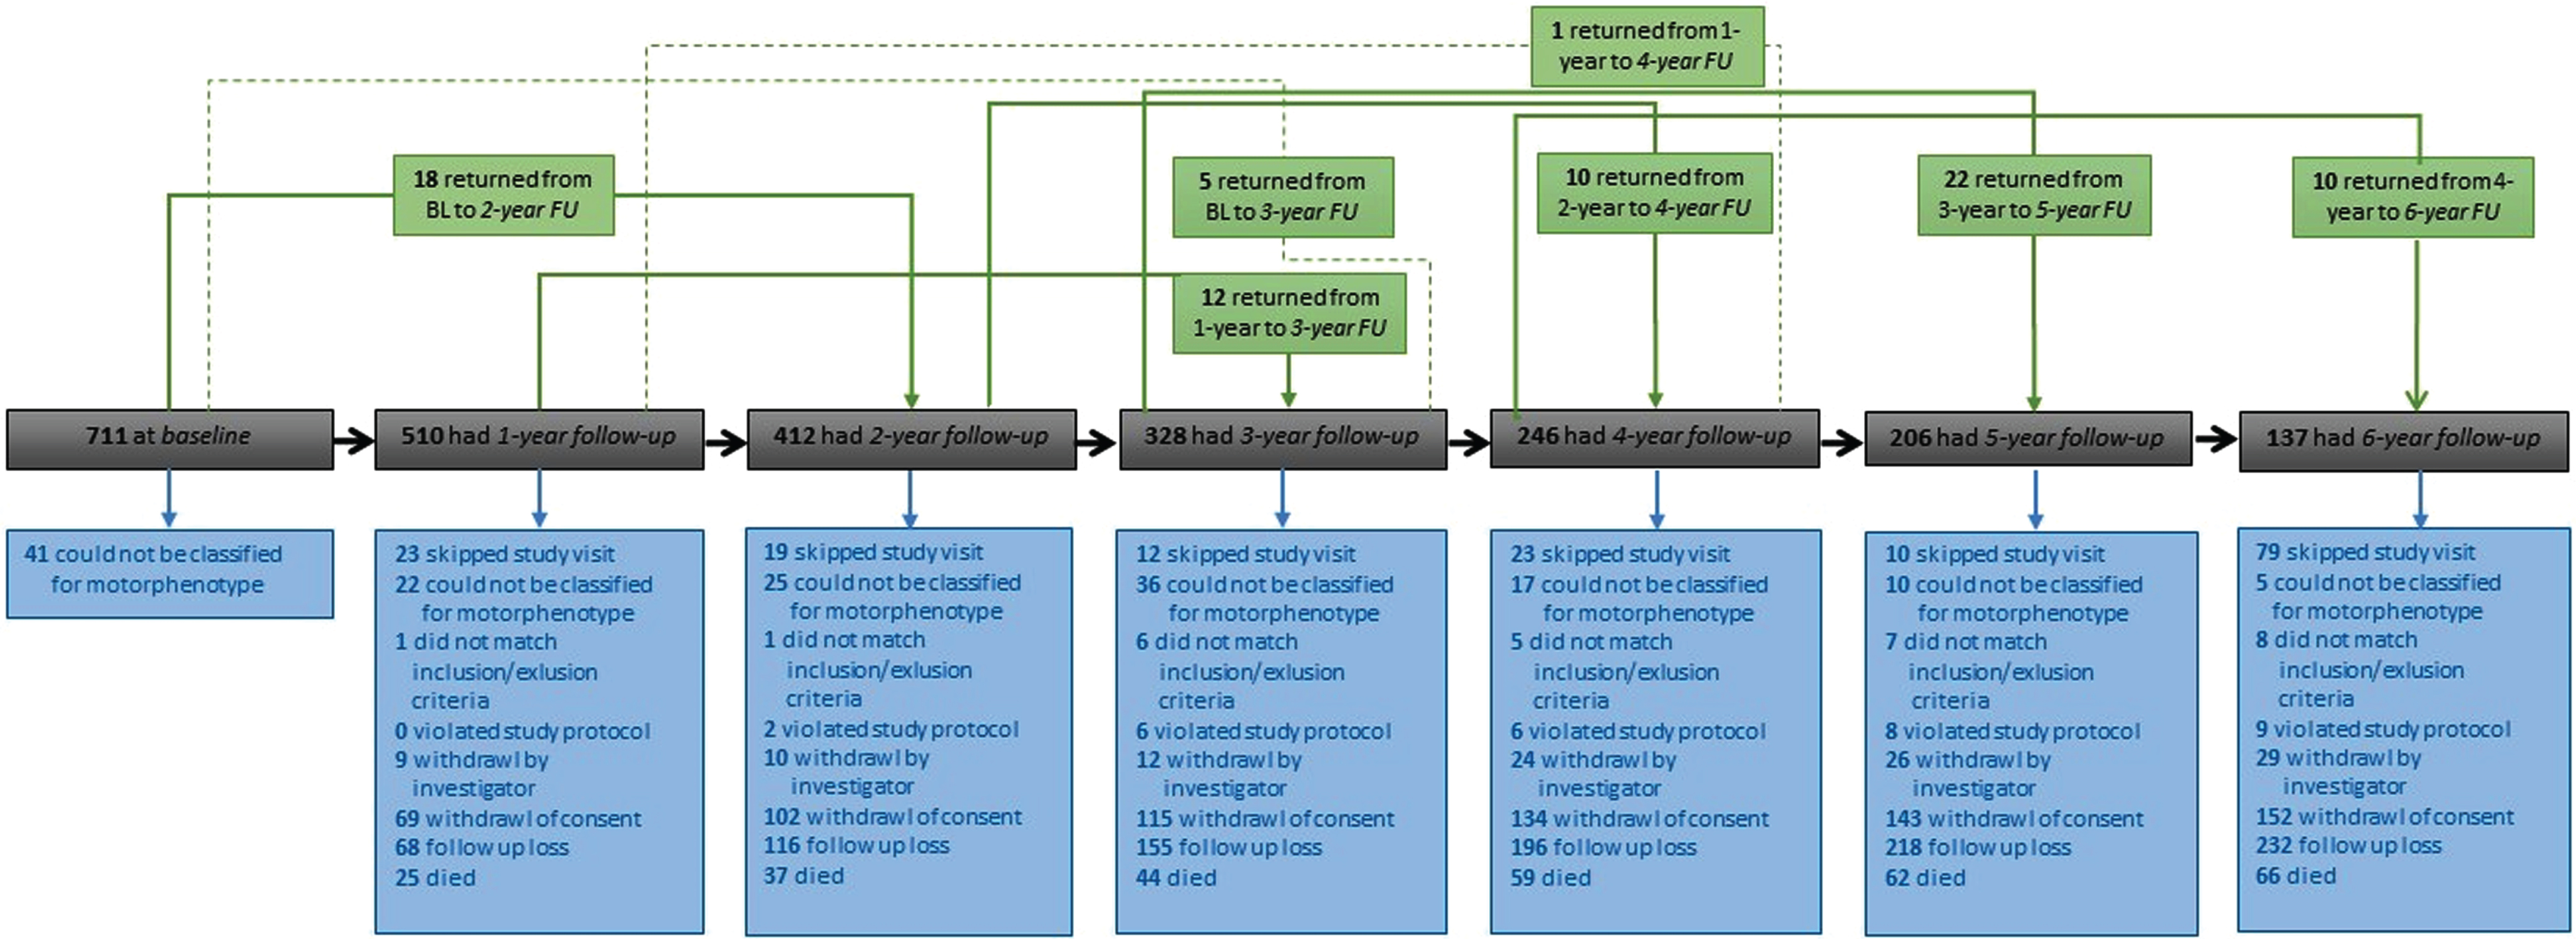
Flow chart of distribution of study cohort during six-year-follow-up visits.
Statistical analyses
Data are reported as mean+/- standard deviation (SD), or as frequency (and percentage %), as appropriate. Statistical data analyses were carried out using SAS 9.4 (SAS Institute Inc., Cary, NC, USA) and R 3.6 (R Core Team, 2019). We computed z-transformed composites scores for a priori defined cognitive domains (see overview described above).
Differences in demographic, clinical, and neuropsychological characteristics were tested for the whole PD cohort across time points, controlling for age at baseline, sex, years of education, and disease duration. Using the age, education, and gender-corrected normative scores (Z-scores) of the CERAD + battery, explicit adjustment for this test battery was only necessary for disease duration. To investigate group differences between neuropsychological tests and motor symptoms, univariate variance analyses (ANOVAs) were calculated between neuropsychological composite scores and motor phenotype for each time point, with age at baseline, sex, years of education and disease duration as covariate. The Tukey-Kramer test was used for multiple post hoc comparisons. Partial correlation analyses were two-sided and general p-value of 0.05 was set as the threshold for significance.
To overcome the attrition rate, baseline visit until three-year follow-up were of main interest for this analysis, as robust data size was available. To estimate the slope of progression over time for each cognitive composite score using linear mixed-effect modeling with subject as random effects on intercept, including age, sex, education, disease duration, motor phenotype, time since baseline (in months) and an interdependency between time since baseline (in months), and motor phenotype at baseline as fixed effects. As some patients skipped visits and to minimize missing data, we set a minimum of three study visits. After these adjustments, n = 442 patients from baseline visit were used for analyses, having either four (n = 106) or at least three study visits (n = 336).
Then modelling was done without imputation for missing data, meaning that patients with missing values were not substituted and therefore individual model data sizes vary (sample sizes for models: memory n = 432, executive n = 387, attention n = 381, visuospatial n = 391, and language n = 433).
RESULTS
Of the 711 patients enrolled at baseline, 532 completed the one-year follow-up assessment and 437 returned for the two-year follow-up assessment, whereas 364 patients completed the three-year follow-up visit, 263 patients had four-year follow-up assessment and 216 patients returned for five-year follow-up visit. In total, 142 finished the six-year follow-up (Fig. 1).
At baseline, patients had a mean age of 67.6 years (SD = 7.89), 497 (67.4%) were male and the mean education was 13.3 years (SD = 3.31). Patients had a mean disease duration of 6.8 years (SD = 5.48) and a mean levodopa-equivalent daily dose of 769.9 mg (SD = 531.35). Patients had a mean MMSE of 27.9 (SD = 2.26), a mean PANDA of 21.5 (SD = 6.05) and a mean total CERAD+-score of 77.7 (SD = 12.26).
The drop-out rate at one-year follow-up in the PD-N group was 16%, 26% in the PD-MCI and 44% in the PD-D group. At two-year follow-up, 12% of PD-N, 20% of PD-MCI and 46% of PD-D dropped out. After three-year follow-up, 15% of PD-N, 21% of PD-MCI and 40% of PD-D dropped out.
Differences in cognition in motor phenotypes over six-years
Neuropsychological long-term results are summarized in Table 1. In general, it could be found that during six-year follow-up period, motor symptoms increased while global cognition measured with the screening measures MMSE and PANDA overall remained stable and CERAD + total score slightly increased, as patients with cognitive impairments dropped out (Supplementary Figure 1). This is also confirmed by significant differences between PD-N, PD-MCI, and PD-D for MMSE F(1,698) = 299.7, p≤0.001, PANDA F(1,699) = 377.6, p≤0.001, and CERAD-total score F(1,686) = 591.3, p≤0.001. Additionally, motor phenotypes differ significantly in terms of PANDA (p = 0.005) CERAD + total score (p = 0.005), and MMSE (p = 0.005) at baseline (Supplementary Figure 2).
Clinical and Neuropsychological characteristics for six-year follow-up
Data are given as mean±SD if not indicated otherwise. Percentages refer to the number of patients in each column if not indicated otherwise. Neuropsychological data show z scores if not indicated otherwise. AES, Apathy Evaluation Scale; EQ, EuroQol-5D; GDS-15, Geriatric Depression Scale; MMSE, Mini Mental State Examination; n, number of patients; PANDA, Parkinson Neuropsychometric Dementia Assessment; PD, Parkinson’s disease; PDQ-39, Parkinson’s Disease Questionnaire 39-item version; UPDRS, Unified Parkinson’s Disease Rating Scale. Cognitive composites: memory (CERAD+, Consortium to Establish a Registry for Alzheimer’s Disease-Plus, word list direct recall, delayed recall, recognition, delayed recall – intrusions and figure delayed recall; WMS-R, Wechsler Memory Scale-Revised, Digit span forward), executive functions (CERAD+ semantic word fluency and formal-lexical word fluency, MCST, Modified Cart Sorting Test categories, non-perseverative errors and perseverative errors; WMS-R Digit span backward, TMT-B, Trail Making Test version B; TMT-B/A,, Trail Making Test-Index: scores of version B divided by scores of version A), attention (Stroop Word Reading, Color Naming, Interference; BTA, Brief Test of Attention; Trail Making test Version A), visuospatial (LPS 50+, Leistungsprüfungssystem for 50 + aged, subtest 7: spatial rotation, subtest 9: spatial imagination; CERAD+ figure copying), and language (CERAD+ BNT, Boston Naming Test). Partial correlation coefficient r with motor phenotype: *p≤0.05; **p≤0.01; ***p≤0.001.
When comparing the neuropsychological composites between the different motor phenotypes, at baseline, univariate analysis of variance showed that there was an effect of motor phenotype in the domain memory, F(2,668) = 3.703, p = 0.047. Tukey post-hoc analysis revealed a difference in the domain memory between PIGD- and TR-D-patients (–0.274, p = 0.022, 95% -CI[–0.51,0.40]), indicating that PIGD-patients were worse in memory tasks compared to TR-D, but not compared to ND. We also found differences in executive functions, F(2,629) = 5.040, p = 0.007, showing that PIGD were worse in executive functions than TR-D-patients (–0.314, p = 0.002, 95% -CI[–0.51, –0.12]). Furthermore, differences for PANDA were present, indicating that PIGD-patients had lower scores compared to ND (–2.333, p = 0.003, 95% -CI[–3.86, –0.80]). Concerning PROMs, subgroups differed concerning depression symptoms, F(2,571) = 6.411, p = 0.002, pointing out that TR-D had lower scores in GDS than ND (–1.357, p = 0.034, 95% -CI[–2.61, –0.10]) and PIGD (–1.768, p < 0.001, 95% -CI[–2.74, –0.78]). For the PDQ-39 summary score significant differences were also observed F(2,570) = 7.559, p = 0.001, showing that TR-D again had lower scores compared to ND (–6.140, p = 0.028, 95% -CI[–11.61, –0.62]) and PIGD (–8.084, p < 0.001, 95% -CI[–12.21, –3.96]). Finally, scores in the EQ-5D index significantly differed between groups F(2,650) = 9.590, p = 0.001, showing lower scores for TR-D compared to ND (–0.106, p = 0.011, 95% -CI[0.02,0.19]) and PIGD (0.138, p < 0.001, 95% -CI[0.08,0.20]).
At the final six-year follow-up we identified an effect for language, F(2,132) = 3.702, p = 0.027, showing that TR-D were superior to ND-D (1.052, p = 0.012, 95% -CI[0.23,1.87]) and PIGD (0.781, p = 0.015, 95% -CI[0.15,1.41]), and an effect for the PDQ-39 summary score F(2,118) = 3.898, p = 0.023, showing that PIGD rated QoL lower as ND (9.858, p = 0.046, 95% -CI[0.19,19.53]) and TR-D (13.024, p = 0.040, 95% -CI[0.56,25.46]).
Changes in motor phenotype
Because of the attrition rate, we focused on the three-year data for the analyses on the predictive outcome of motor phenotype in cognition.
Over the course of the study, several motor phenotype fluctuations could be observed (Fig. 2). 13 (23.6%) of the 55 patients classified as TR-D and 8 (14.6%) of the 55 patients classified as ND at baseline showed no changes at one-year follow-up, whereas 23 (41.8%) of the TR-D and 28 (50.9%) of the ND changed to PIGD. At two-year follow-up, 9 (31.0%) of the 29 patients classified as TR-D and 2 (5.7%) of the 35 patients classified as ND at one-year follow-up remained unchanged at two-year follow-up, whereas 13 (44.8%) of the TR-D and 23 (65.7%) of the ND changed to PIGD. At three-year follow-up, 6 (25%) of the 24 TR-D-patients and 1 (6.7%) ND-patients at two-year follow-up remained unchanged at three-year follow-up, whereas 12 (50%) TR-D and 10 (66.7%) ND changed to PIGD. Only 6 patients (10.9%) classified at baseline as TR-D showed no changes in motor phenotype.
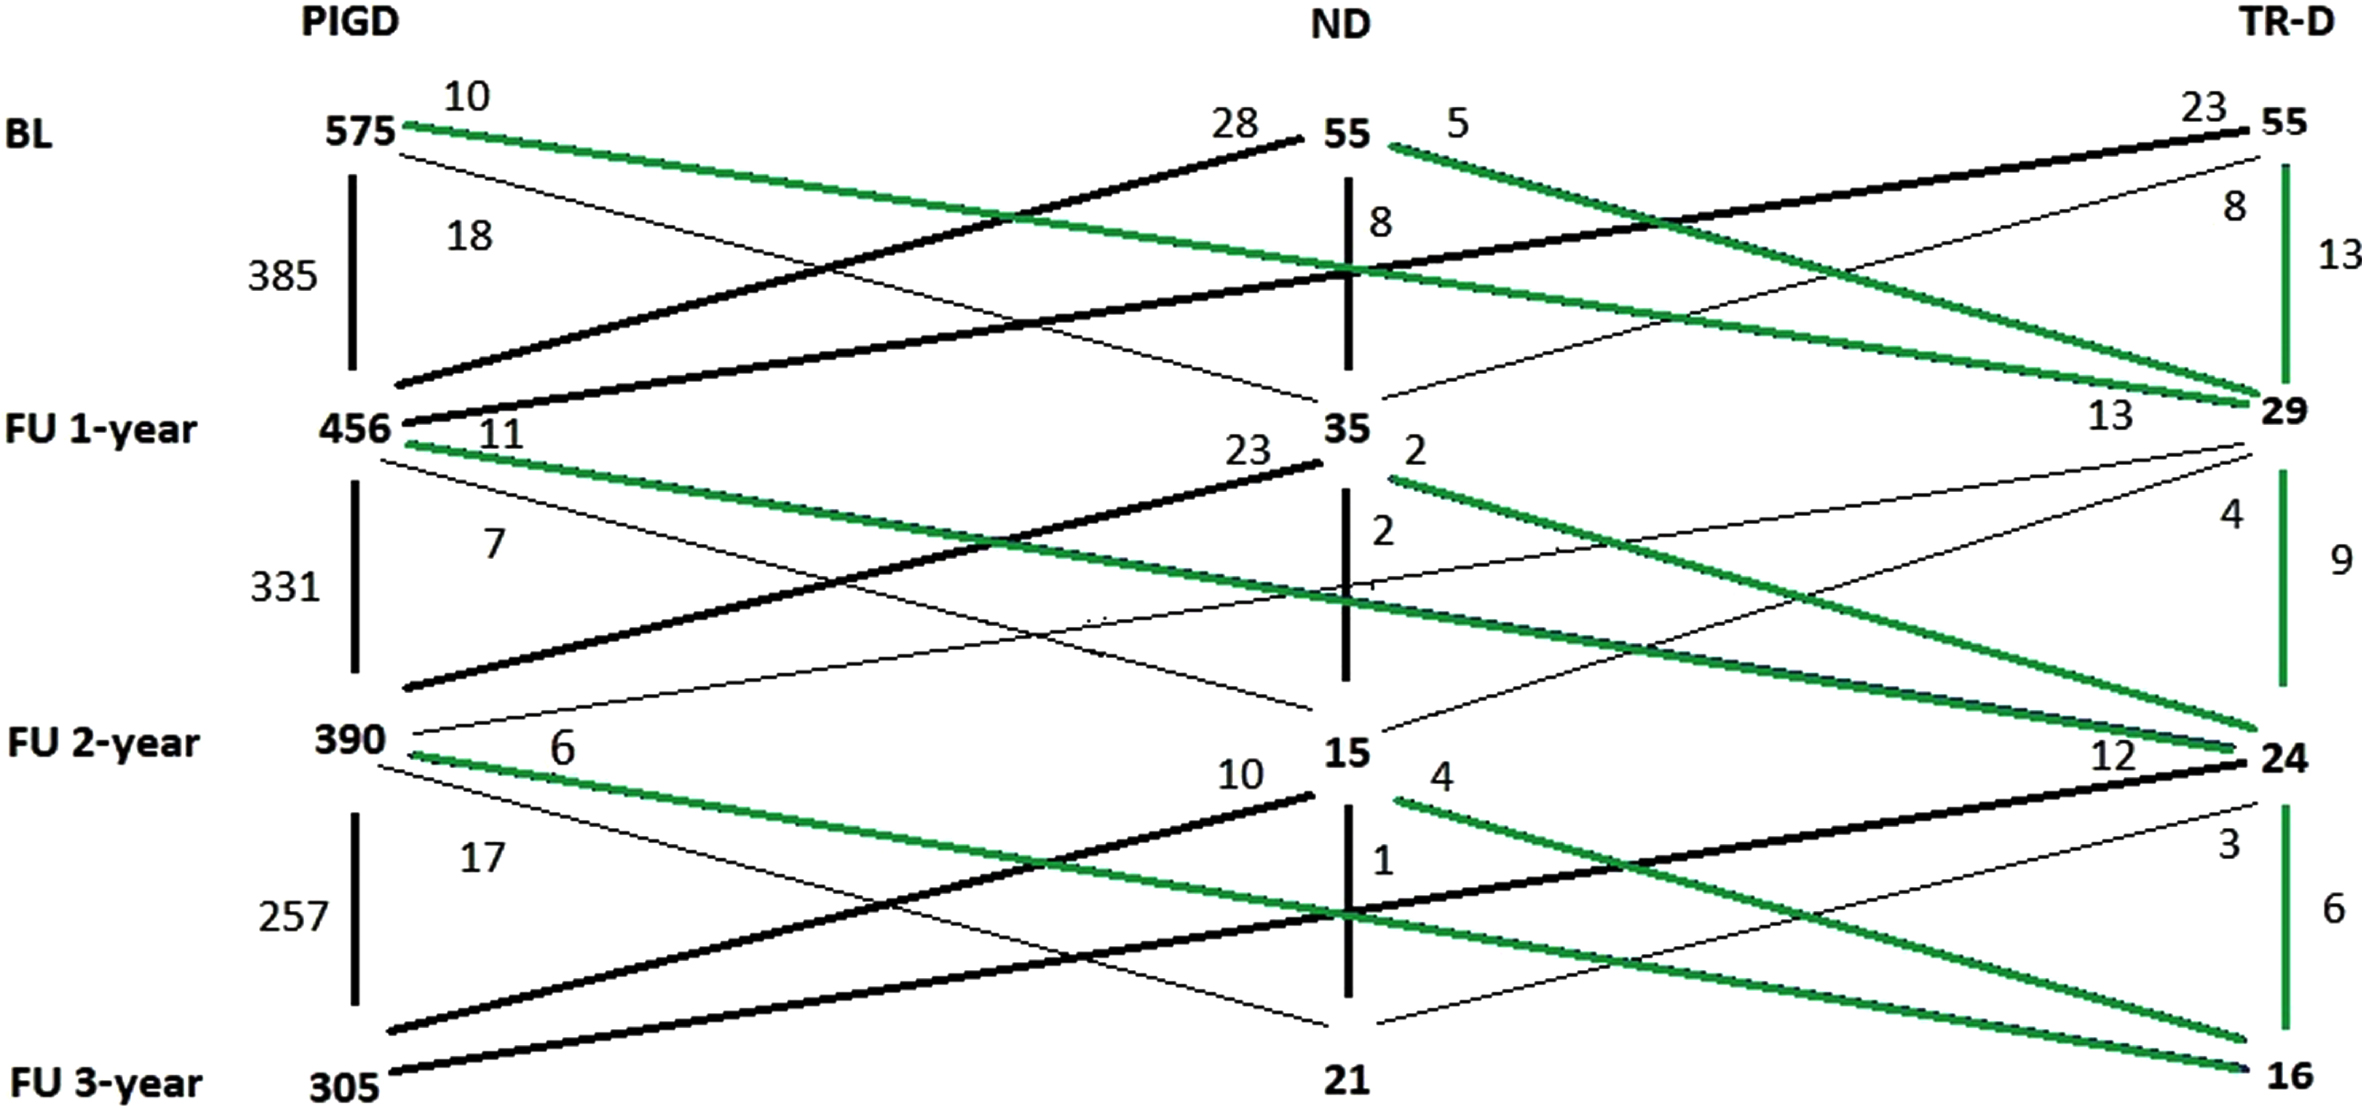
Fluctuation of motor phenotype during study follow-up. Green lines represent changes to TR-D. ND, not-determined; PIGD, postural instability and gait difficulty; TR-D, tremor-dominant.
Slope of progression and motor phenotype on cognition at three-years
As considerable changes in motor phenotype were present, the baseline motor phenotype was used for analysis. Using linear mixed-effect modeling, we found an overall positive influence of education on memory (β= 0.033, SE = 0.011, p < 0.001), attention (β= 0.034, SE = 0.012, p = 0.002), visuospatial functions (β= 0.039, SE = 0.012, p < 0.001), as well as on MMSE (β= 0.138, SE = 0.028, p < 0.001) and PANDA (β= 0.513, SE = 0.077, p < 0.001). Additionally, longer disease duration was associated with worse performance on all cognitive domains over time (range of p < 0.01- p < 0.001).
Age had an expected negative impact on the domains of executive function (β= –0.011, SE = 0.004, p = 0.003) and attention (β= –0.007, SE = 0.004, p = 0.014) as well as on the two screening tests - MMSE (β= 0.050, SE = 0.011, p < 0.001) and PANDA (β= –0.016, SE = 0.029, p < 0.001). Significant sex differences were found for attention (β= 0.298, SE = 0.078, p < 0.001), language abilities (β= 0.187, SE = 0.090, p = 0.035) and PANDA screening tool (β= 2.17, SE = 0.517, p < 0.001), indicating better performance of female participants over time.
When analyzing the progression over time for all motor phenotypes, positive changes were found for the domain memory (β= 0.008, SE = 0.003, p = 0.006) and the screening test PANDA (β= 0.044, SE = 0.021, p = 0.033).
When comparing the different motor phenotypes though, memory performance of PIGD-patients deteriorated (–0.005962 per month) compared to the ND group (SE = 0.003, p = 0.049). Similarly, the TR-D group also shows a decline of memory function by –0.003 points per month, however, this effect is not statistically significant when compared to ND and TR-D patients.
Furthermore, a decline over time was found for attention (β= –0.01, SE = 0.003, p < 0.001, Fig. 3b), but there was no effect of motor phenotype.
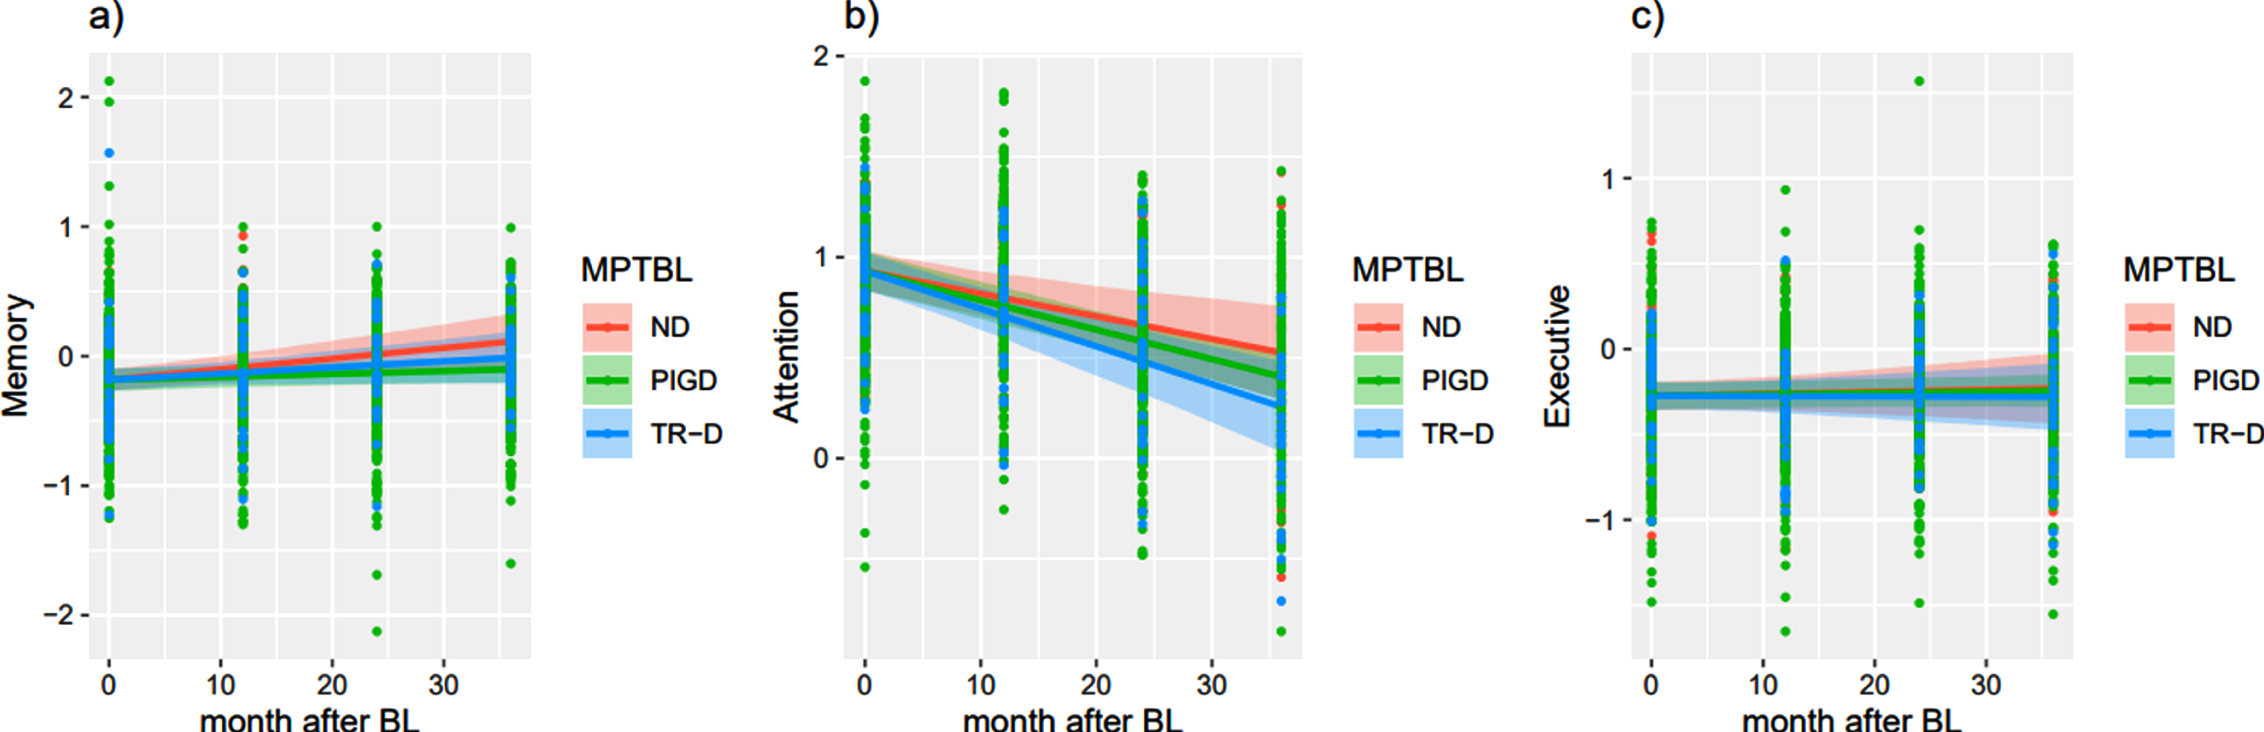
Cognitive decline over three-years compared to baseline depicting conditional means. All variables that are not the time point and are not used for group separation (ND, PIGD, TR-D to BL) are set to average, including disease duration. n differed for each time point. a) Memory functions. Composites are calculated from: CERAD+ word list direct recall, delayed recall, recognition, delayed recall – intrusions and figure delayed recall, WMS-R Digit span forward b) Attention function. Composites are calculated from: Stroop Word Reading: T-score, Stroop Color Naming: T-score, Stroop Interference: T-score, BTA, TMT-A Sec. c) Executive function. Composites are calculated from: CERAD+ semantic word fluency and formal-lexical word fluency, Modified Cart Sorting Test categories, non-perseverative errors and perseverative errors, WMS-R Digit span backward, TMT-B and TMT- B/A. BL, baseline; ND, not-determined; MPTBL, motor phenotype at baseline, PIGD, postural instability and gait difficulty; TR-D, tremor-dominant. Neuropsychological data show z scores if not indicated otherwise. Screening tools scores represent conditional means.
In the analysis of the screening instruments changes were found for the MMSE indicating a decrement by –0.020 per months for the PIGD group compared to the ND-group (SE = 0.009, p = 0.038). Further analyses yielded not significant results.
DISCUSSION
This study provides information on the cognitive deterioration profiles associated with the different motor phenotypes in PD, according to the longitudinal findings from the DEMPARK/LANDSCAPE cohort. First, it was found that in the course of six-year follow-up period, motor symptoms increased while global cognition measured with MMSE and PANDA overall remained stable for all phenotypes and higher age was linked to more cognitive decline in general.
However, in-depth analyses of three-year follow-up data (due to attrition rate of more severely impaired patients in the later stage of the study), motor phenotype changed considerably, with distinct neuropsychological progression patterns in this time frame, showing early executive deficits and yielding to differences in memory performance in the later stages of PD. Finally, we found a decline of overall cognitive performance for PIGD-patients, apparent by the decline in the MMSE after three years follow-up. We observed that PIGD-patients showed a greater decline in memory compared to TR-D and ND-patients and PIGD experienced more often difficulties in daily living as a possible consequence of PD-symptoms.
As memory seems to be a prominent domain affected in PD-progression, understanding the underlying pathology seems to be crucial. Previous research indicated that memory deficits were particularly common in patients with more severe clinical symptoms [27], while retrieval of free recall seems to be more salient earlier in the disease [28] with additional storage deficits followed in the later stages. As PD-MCI and PD-D-patients had a higher drop-out rate, it must be assumed that the stable global cognition, which were present after six-year follow-up, and the positive change in memory are influenced by a drop-out bias of more severely impaired patients.
When analyzing the different phenotypes separately PIGD-patients showed more decline in memory when compared to the ND-group.
In line with our baseline analysis, we revealed a greater cognitive impairment in PIGD compared to TR-D-patients over three-year follow-up. Furthermore, we found that particularly memory performance in PIGD-patients shows an increased decline over this time period. Although this somewhat contrasts with our baseline cross-sectional data showing higher differences in attention and executive functions [6], we also demonstrated that significant group differences for memory were present already at baseline and that PIGD already showed worse memory performance than TR-D. These results can be linked to research highlighting a higher risk of dementia for PIGD-patients in the course of disease progression [13]. Here, the ‘dual-syndrome hypothesis’, that distinguishes executive from posterior cortical dysfunctions, can be related to motor phenotype differences in cognitive impairment [29].
Additionally, PIGD-patients were older at baseline and showed an overall more severe cognitive impairment, as measured by the MMSE and PANDA. Of course, one could also see age as an essential “single feature classifier” for the cognitive outcome, including the possible age-associated co-pathologies [30].
Also, TR-D-patients show a trend in memory functions decline, however these results were not significant. One possible, however in research somewhat critically discussed, explanation for the stronger decline in PIGD, might be an increment in regional white matter hyperintense lesion volumes [31–33], resulting in lower memory performance in PD [34]. Interestingly, neuroimaging investigations of neuronal patterns of PD of the DEMPARK/LANDSCAPE study revealed that cognitive decline on average was measurable after approximately 1.4 years suggesting the thinning of the anterior cingulate cortex (ACC), a main part of the limbic system, might be a predictor for upcoming cognitive deterioration [35]. Similarly, amnestic MCI in PD can be linked to reduced dopamine-2 (D2) receptor binding in ACC [36]. A study by Christopher et al. [37] found that patients with memory impairment had significant lower amounts of D2 receptor binding in ACC, insula and the right parahippocampal gyrus in comparison to controls and PD. Thus, dopaminergic differences in the salience network including ACC plays a crucial role in memory and executive dysfunction.
Interestingly executive functions remain widely stable, while attention functions have a far steeper decline (Fig. 3b, c). One explanation could be that executive deficits are a predominant symptom of the early stages, while in later stages additional cognitive impairments are more dominant. Likewise, a large multicenter study [38] on PD-patients with MCI points to a predominance of mnestic and visual-spatial deficits, assuming that memory deficits in PD may be subsequent to impaired attention and executive dysfunction (Fig. 4).
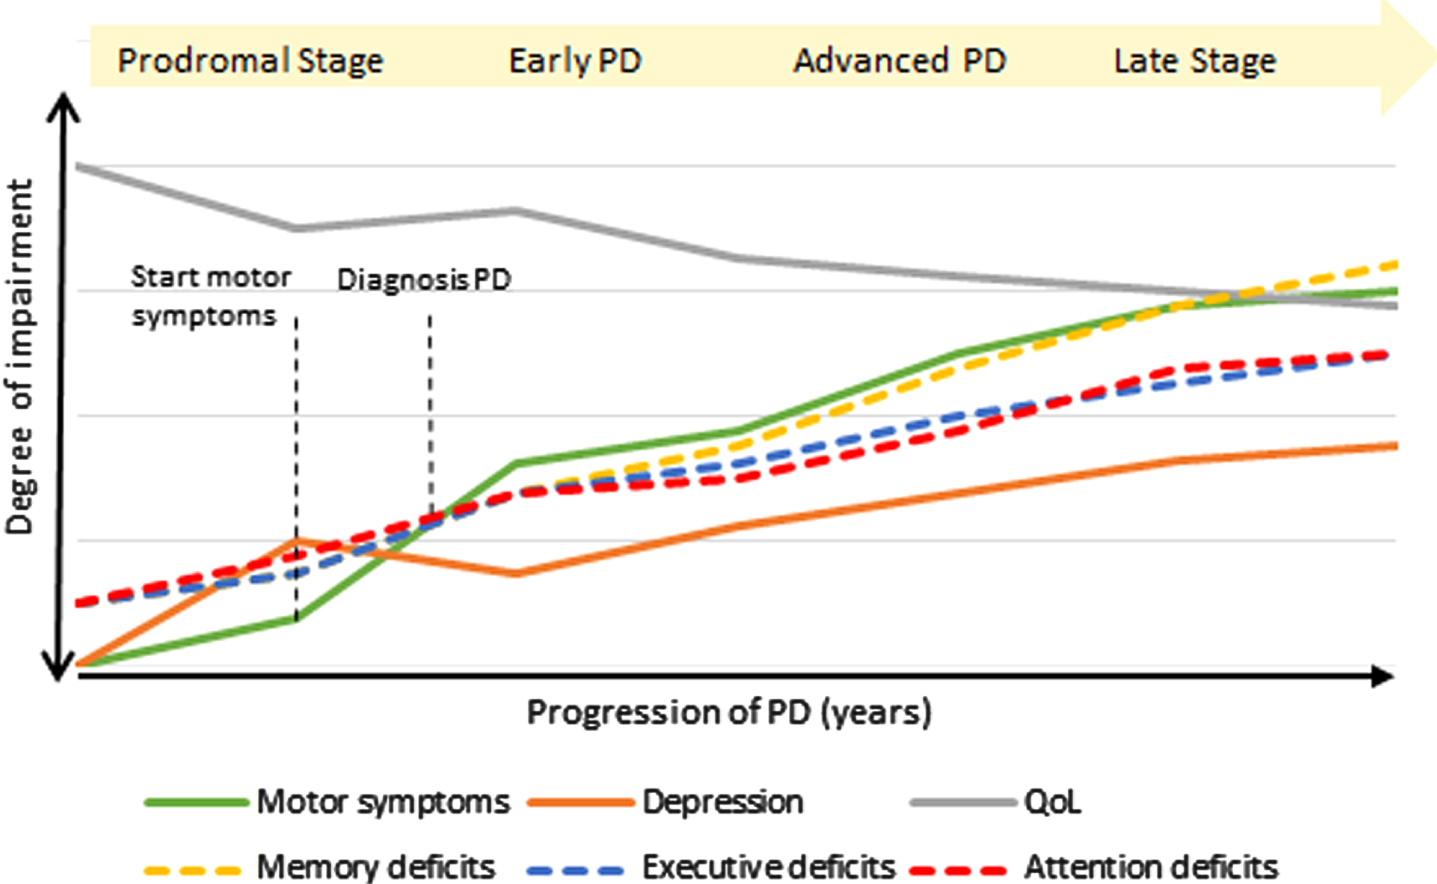
Schematic natural progression of symptoms in Parkinson’s disease.
In the course of the study motor phenotype changed considerably [39], even in newly diagnosed patients [40]; however, a high proportion of TR-D- and ND-patients changed to the PIGD-group, which is in line with our hypothesis and previous studies [10, 40]. Stage-dependent progression from TR-D to PIGD therefore might not be plausible, as conversion might not occur linearly, for example not all patients directly change from TR-D to PIGD. Thus, although difficult to interpret, specific longitudinal changes in motor phenotypes may provide useful clinical information regarding the progression of PD and this study might give first insights to elucidate whether these phenotypes progress differently than others. Nevertheless, it must be noted that research showed that TR-D-patients did not develop dementia when they stayed persistent TR-D and only developed dementia when they convert into the PIGD motor phenotype [12].
It appears that only a small and unique subgroup of TR-D-patients could be seen as “protected”. Interestingly, at baseline those patients were younger, had a shorter disease duration and a lower Hoehn & Yahr state. They also showed fewer motor complaints and better performance in MMSE, although having a lower level of education, and rated their quality of life to be better.
A recent study by Eisenger et al. [39] proposed that during their five-year longitudinal study an overall shift away from TR-D-phenotype to PIGD designation was present, claiming that motor phenotype classification might be affected by disease duration, just as we demonstrate with our data.
The question of whether and if so, which subtypes there are in PD has been discussed extensively for many years and subtypes based on motor features are commonly used, which possibly leads to a classification bias, as clinical PD is concomitant heterogeneous. On this basis, cognition can be a nonmotor feature and therefore as a possible expression of certain subtypes and processes, since the origin and spread of the pathology are included here and non-motor features, such as cognitive impairment, have emerged as important determinants of PD-subtypes [41].
Irrespective of motor phenotype, we found, a negative age effect, particularly in executive functions and attention. Similarly, disease duration was associated with greater cognitive decline across all cognitive domains. A recent study linking a decline in striatal dopaminergic binding to a worsening of cognitive performance and emotional state [42], supports our findings, as especially PIGD-patients experienced more difficulties in daily living. This underlines the importance of early intervention therapy, as studies demonstrated that a combination of motor and cognitive treatment in a multidisciplinary setting led to improvements of these symptoms [43, 44] and resulted in changed brain activation and enhanced functional capacities, which could decelerate cognitive decline in PD-patients [45].
The overall strength of the study is the cohort size which allowed us to gain relatively genuine and consolidated insights about the long-term progression of PD and particularly with regard to the different phenotypes during 3-year follow-up period. Nevertheless, our study has also some limitations. The DEMPARK/LANDSCAPE study included patients with and without dementia, which led to a cohort with advanced PD-stage and might be biased due to a research-oriented selection. Additionally, the study is limited by the attrition rate of follow-up investigations, which was mainly due to increasing disease burden, as more severely impaired patients dropped out (∼18%) [35]. This was also the reason why we focused on three-year follow-up investigations, as robust data sets were available for progression analysis. A further limitation of the study is the unequal group sizes of the several phenotypes, however depicting real-life distribution.
In summary, our hypothesis that there is a distinct progression pattern of cognitive decline in relation to motor phenotype could be confirmed in our longitudinal data. We found significant declines in memory, as well as in attention functioning for PIGD, favoring a shift from early executive problems to later deficits in memory during a three-year follow-up period. Our analysis is the first, to the best of our knowledge, to gain understanding about how different motor phenotypes influence individual progression of cognitive impairment over time. Due to the explorative nature of this work, we encourage further research to these more specified hypotheses. This study may ultimately provide critical information for disease prognosis and can improve therapy, especially for motor phenotype adapted interventions.
Footnotes
ACKNOWLEDGMENTS
The authors wish to thank all patients participating in the study and all staff members in the participating centers who contributed to the study.
The DEMPARK study was funded by an unrestricted grant from Novartis and a grant from the International Parkinson Fonds (Deutschland) GmbH (IPD). The continuation of the study (LANDSCAPE) is funded by the German Ministry for Education and Research (BMBF 01GI1008C).
CONFLICT OF INTEREST
EK has received grants from the German Ministry of Education and Research, Parkinson Fonds Deutschland gGmbH, the German Parkinson Society; honoraria from: Oticon GmbH, Hamburg, Germany; Lilly Pharma GmbH, Bad Homburg, Germany; Bernafon AG, Bern, Switzerland; Desitin GmbH, Hamburg, Germany, outside the submitted work. ILS reports grants from Novartis and German Ministry for Education and Research (BMBF) related to the conduct of the study; grants from Janssen Research and Development, a division of Janssen Pharmaceutica N.V., grants from the Michael J. Fox Foundation, grants from European Commission, H2020-TWINN-2015, International Parkinson Fonds (Deutschland) GmbH (IPD) outside the submitted work. JM is supported by the START-Program of the Faculty of Medicine, RWTH Aachen, Grant. Nr. 27/20KR was funded by the German Federal Ministry of Education and Research (BMBF 01GQ1402). GD reports personal fees from Boston Scientific, Jazz, Functional Neuromodulation, Thieme publishers, grants to his institution from Medtronic. He receives funding for his research from the German Research Council (SFB 1261, T1). KW received reimbursement of congress fees from BIAL and Desitin; and grants from the Federal Ministry of Education and Research and the German Research Foundation. RD reports personal fees and grant support from different pharmaceutical companies, organizations and private foundations. He holds several patents referring to treatments in neurodegenerative disorders.