
Abstract
Background:
Recent technological advances in deep brain stimulation (DBS) (e.g., directional leads, multiple independent current sources) lead to increasing DBS-optimization burden. Techniques to streamline and facilitate programming could leverage these innovations.
Objective:
We evaluated clinical effectiveness of algorithm-guided DBS-programming based on wearable-sensor-feedback compared to standard-of-care DBS-settings in a prospective, randomized, crossover, double-blind study in two German DBS centers.
Methods:
For 23 Parkinson’s disease patients with clinically effective DBS, new algorithm-guided DBS-settings were determined and compared to previously established standard-of-care DBS-settings using UPDRS-III and motion-sensor-assessment. Clinical and imaging data with lead-localizations were analyzed to evaluate characteristics of algorithm-derived programming compared to standard-of-care. Six different versions of the algorithm were evaluated during the study and 10 subjects programmed with uniform algorithm-version were analyzed as a subgroup.
Results:
Algorithm-guided and standard-of-care DBS-settings effectively reduced motor symptoms compared to off-stimulation-state. UPDRS-III scores were reduced significantly more with standard-of-care settings as compared to algorithm-guided programming with heterogenous algorithm versions in the entire cohort. A subgroup with the latest algorithm version showed no significant differences in UPDRS-III achieved by the two programming-methods. Comparing active contacts in standard-of-care and algorithm-guided DBS-settings, contacts in the latter had larger location variability and were farther away from a literature-based optimal stimulation target.
Conclusion:
Algorithm-guided programming may be a reasonable approach to replace monopolar review, enable less trained health-professionals to achieve satisfactory DBS-programming results, or potentially reduce time needed for programming. Larger studies and further improvements of algorithm-guided programming are needed to confirm these results.
Keywords
INTRODUCTION
Deep brain stimulation (DBS) has become a standard treatment option for advanced Parkinson’s disease (PD) [1, 2]. With stimulation of the subthalamic nucleus (STN) as one of the most widely used target, about 50–60%improvement in motor symptoms can be achieved [3, 4]. A recent review found the optimal target region to be central to dorsolateral within the STN [5]. Usual clinical assessment after DBS-implant includes a so-called monopolar review to test each contact on the lead for clinical effect and side effects. The development of directional DBS leads with segmented (i.e., directional), tripartite contacts offers the option to preferentially stimulate regions in a particular direction perpendicular to the lead’s axis [6]. The main aim of this technical innovation is to optimize treatment when lead placement has been suboptimal, i.e., rendering the current towards the optimal target-region such as the dorsolateral/motor STN in PD while avoiding regions related to side effects [6, 7]. Recent studies indicate an enlarged therapeutic window [7, 8] and reduced side effects [9, 10] for directional leads. However, in clinical practice, the tremendous increase in possible contact configurations is an unsolved problem that makes it virtually impossible to cover every possibility in a monopolar review [6], which currently requires a highly trained person [11–14] and still remains the first crucial step in management of DBS-patients. Therefore, strategies are needed to replace the full monopolar review by a semi-automated procedure to identify optimal contact configurations for the further DBS-optimization process. Motor symptom assessment by wearable sensors is increasingly used as a relatively objective, examiner-independent measure and is even discussed to potentially replace clinical evaluation as a gold standard in the future [2, 16]. This study evaluates a semi-automatic iterative-loop algorithm using motion-sensor feedback to determine optimal contact selection and stimulation amplitude in patients treated with STN-DBS.
METHODS
Study design
CLOVER-DBS is a prospective and multicenter study with a randomized, crossover and double-blind design. Because of the exploratory nature of the study, no primary endpoint was defined. The clinically most important exploratory endpoint of the study is DBS-induced improvements in full Unified Parkinson’s Disease Rating Scale (UPDRS)-III scores yielded by computer-algorithm-guided DBS-programming (AgP) compared to standard-of-care (SoC) DBS-settings. During the study visits always the full UPDRS-III was recorded during the assessments. Some analyses in this manuscript required a hemibody UPDRS-III, which is specified in the respective text passage. Further exploratory per-protocol endpoints of the study compare bradykinesia (assessed by an external finger mounted sensor; Kinesia One™, Great Lakes Neurotech, Cleveland, OH) and rigidity scores (clinical assessment) yielded by AgP and SoC DBS-settings. The time and number of steps needed to reach AgP and SoC DBS-settings were intended as an exploratory endpoint in the study protocol. Additional exploratory endpoints added in the final analysis were: a) identification of relevant influencing factors for AgP effectiveness by a mixed-effects model; b) location analysis in Montreal Neurological Institute (MNI) space comparing active contacts selected in AgP and SoC DBS-setting. The study is registered as NCT03037398 at ClinicalTrials.gov.
Study subjects
PD patients were recruited at two German centers (Charité - University Medicine Berlin n = 20 and University Medical Center Hamburg-Eppendorf n = 3). Both centers obtained ethics committee approval for the study and written informed consent was obtained from all subjects prior to study inclusion. Subjects had undergone on-label bilateral STN-DBS (Boston Scientific, Valencia, CA; 8-ring (n = 3) or directional (n = 20) leads) for treatment of advanced PD at least 6 months before enrollment. DBS-programming was carried out according to standard clinical procedures in both centers prior to recruitment for the study. For inclusion in this study, subjects’ pre-operative UPDRS-III score had to be≥25 points in off-medication-state including bradykinetic-rigid symptoms. Subjects with tremor-dominant PD-phenotype were not included as tremor was judged to be potentially less reliable compared to bradykinesia and rigidity. Furthermore, SoC DBS-settings had to be stable for at lead 4 weeks prior to enrollment, and yield≥30%reduction in UPDRS-III scores in the off-medication-state. Finally, study candidates were excluded if their optimal stimulation settings included multiple frequencies or stimulation on non-adjacent contacts. All tests were performed in the off-medication-state, i.e., after≥12 h of withdrawal of antiparkinsonian medication.
Study protocol
The study protocol is summarized in Fig. 1A. The Kinesia One™ sensor system rates the subitems speed, amplitude and rhythmicity of the task on a UPDRS-III-like scale from 0 to 4 by a proprietary signal processing software [17]. The median of all battery subitems was used for analysis.
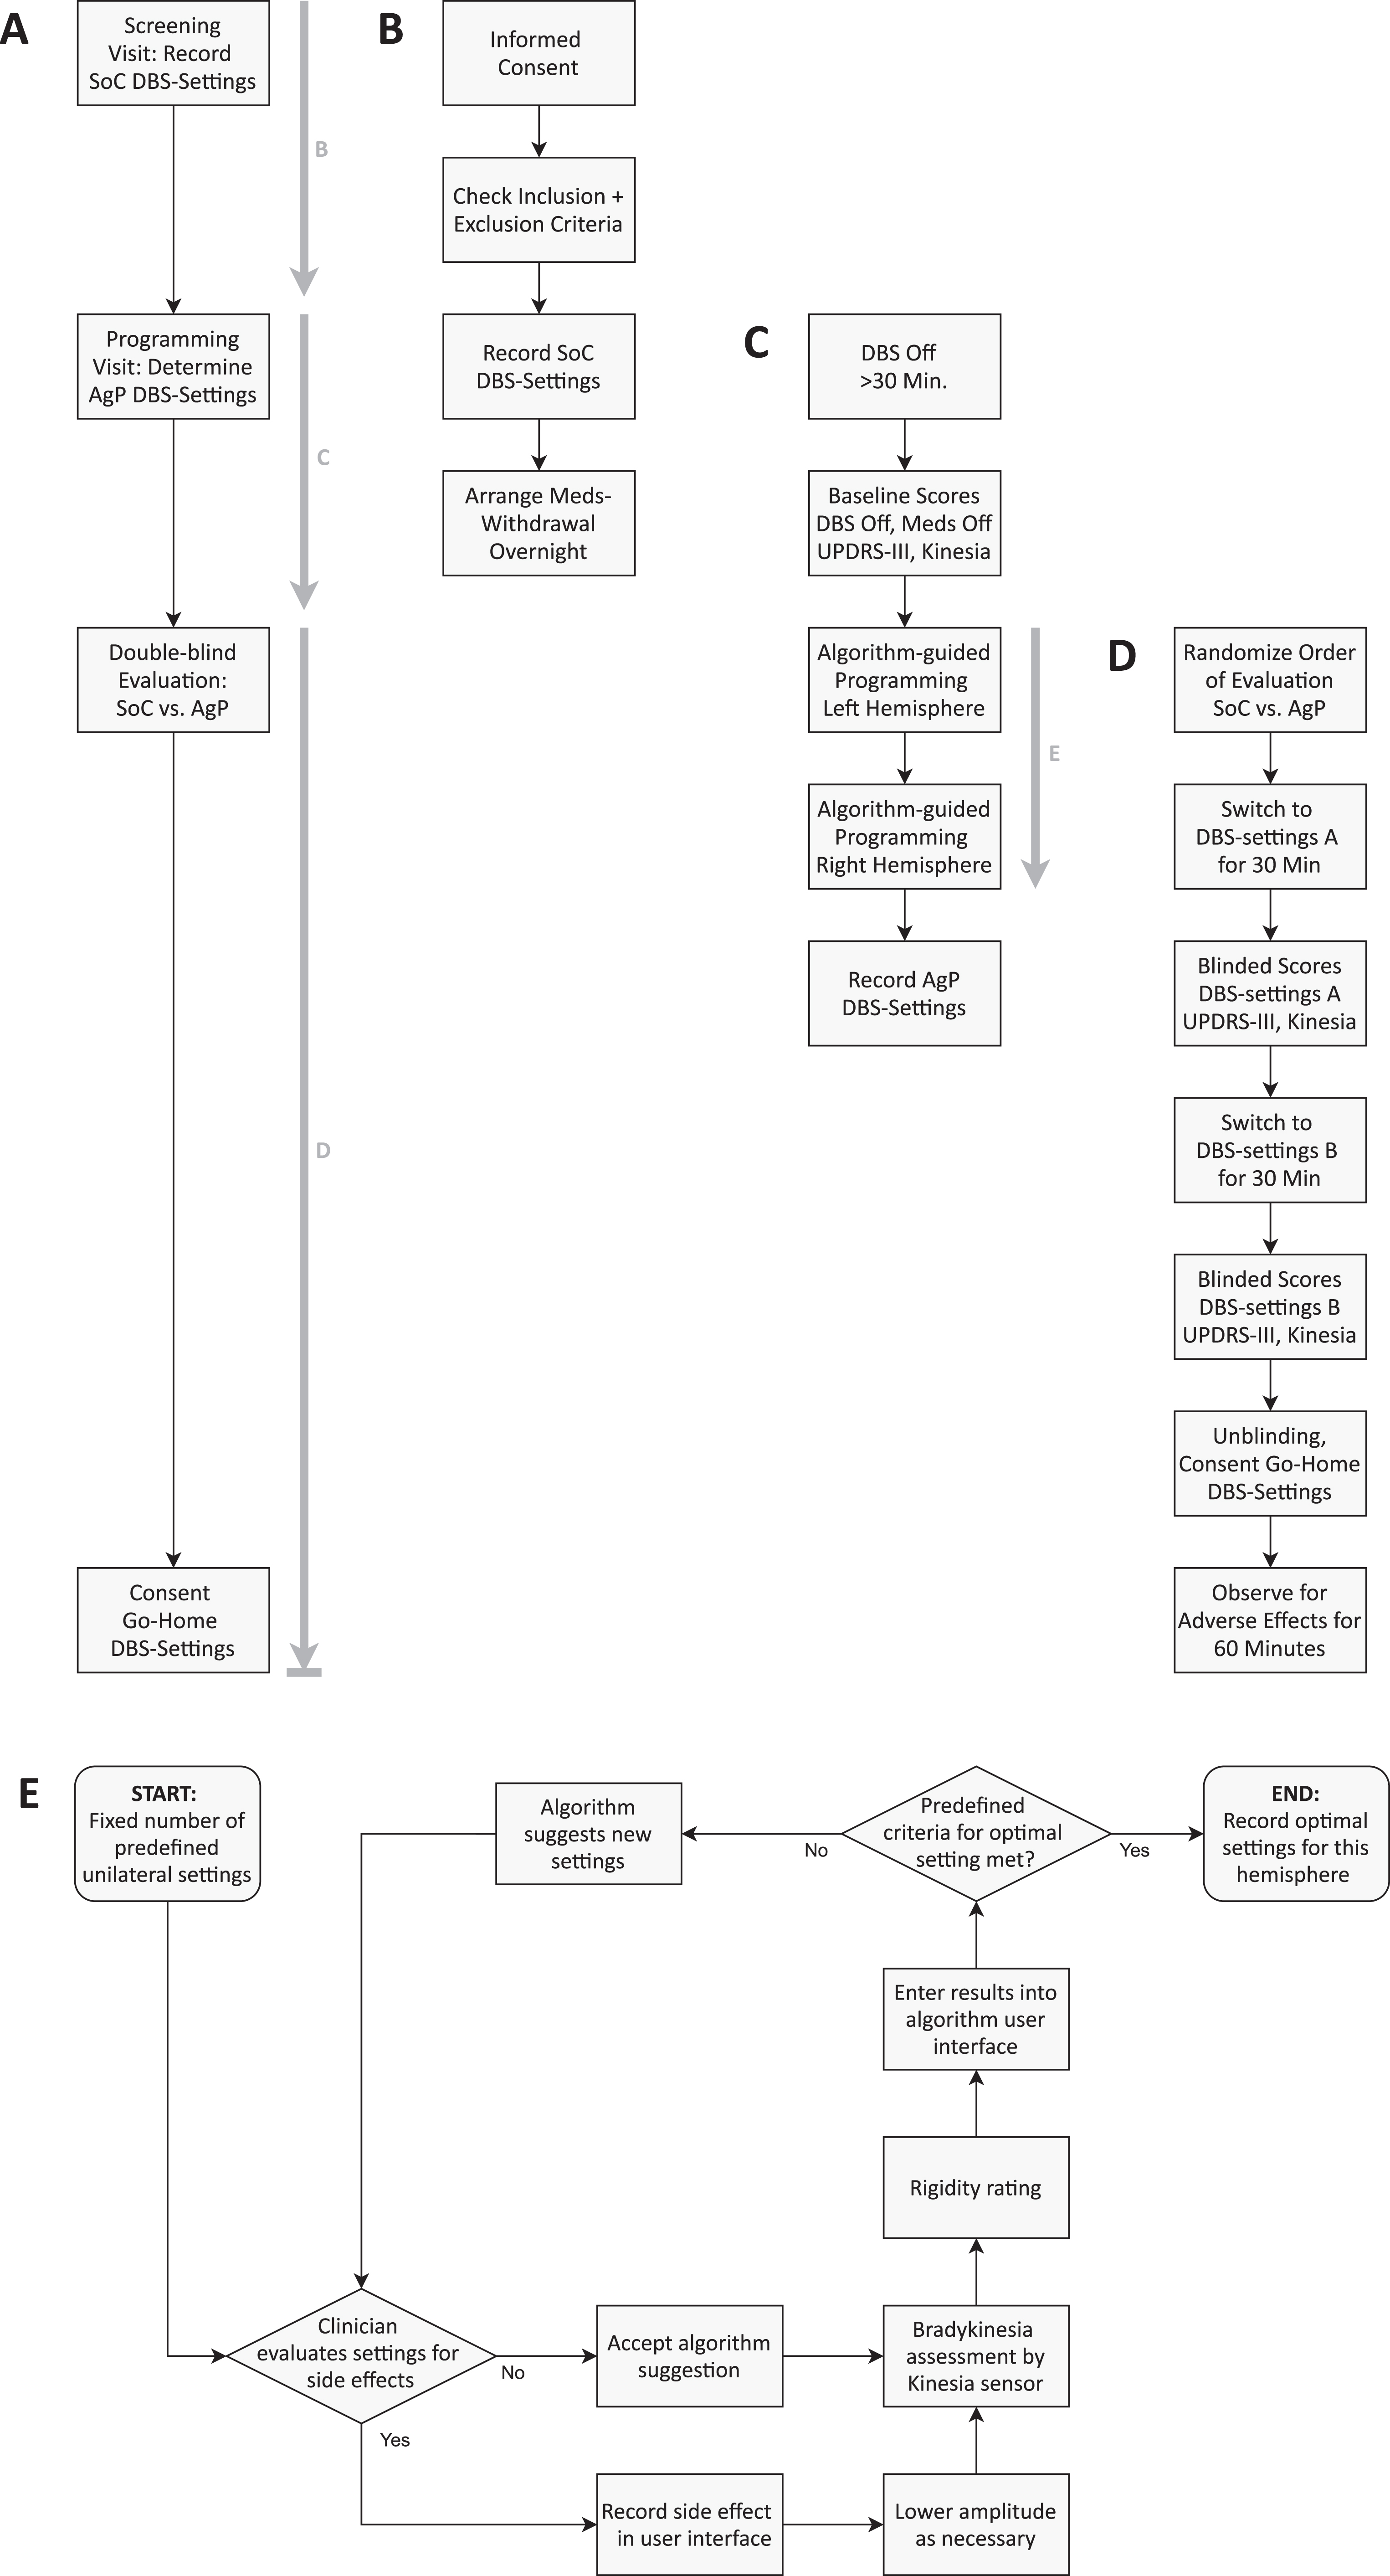
Visual representation of the study design and the algorithm-guided programming-loop. A) Overview of the study workflow. The bold, grey arrows indicate the panels showing a detailed description of this section of the study protocol. B) Screening Visit. After informed consent, SoC DBS-settings were recorded. SoC DBS-settings are defined as the settings established by clinical routine prior to enrollment in the study. Subjects were instructed for an overnight withdrawal of dopaminergic medication. C) Programming visit. After switching off DBS for at least 30 min, baseline UPDRS-III and Kinesia sensor test battery were performed. Then AgP DBS-settings were obtained by an iterative sensor-feedback-loop (E) for left hemisphere first, and then for right hemisphere. D) Subjects were then randomized into one of two study arms that differed in the order by which settings (SoC vs. AgP) were being tested. “DBS-settings A” here refers to the settings tested first and “DBS-settings B” to the ones tested second. After double-blind evaluation, physician and subject agreed on go-home-settings, which could be either SoC or AgP. E) Illustration of the AgP-loop. The exact position of the AgP-loop in the whole study workflow is shown by the arrow in panel C. For a detailed description of the AgP loop see the Methods section.
First DBS was switched off for≥30 min for baseline assessment, which included full UPDRS-III and a sensor-based test battery (finger taps, hand grasps, resting tremor, all bilateral). DBS was then programmed to a unilateral test stimulation suggested by the algorithm. After 30 s wash-in time, bradykinesia was assessed by sensor measurement and rigidity by clinical rating on the contralateral side. Either speed or amplitude were used as input for the algorithm. The choice depended on results from previous subjects and (if available for the respective subject) change of the respective subitem (speed/amplitude) in baseline testing (off-stimulation-state vs. on-stimulation-state). Results were entered in the algorithm user interface and a next suggestion was calculated based on all previous results.
This loop was continued until predefined criteria for sufficiently effective algorithm-guided settings were achieved (see also Fig. 1C). After repeating the algorithm-cycle for the contralateral side, AgP and SoC DBS-settings were evaluated in randomized order by full UPDRS-III and the sensor-based test battery (see also Fig. 1D). For each of the tested DBS-settings, a 30 min wash-in time was allowed and both, the subject and the physician, were blinded to the DBS-settings being evaluated. Subjects and physician then consented the go-home DBS-setting (AgP or SoC). Time consumption for SoC programming was estimated retrospectively from charts and a focused medical history during the study visit.
Generation of DBS-setting-suggestions by the algorithm
The algorithm is a standalone software that explores the clinical effect of different stimulation settings in an iterative loop by representing them in two-dimensional spaces (Fig. 2). Each point in the two-dimensional space represents defined stimulation settings (i.e., contact configuration and stimulation amplitude). Dimensions are stimulation amplitude vs. one spatial dimension, which can be either the vertical position of the activated contacts for ring-mode or the angle of the activated contacts for directional mode stimulation. The algorithm explores these two-dimensional spaces based on a weighting method, whose weights were adjusted manually to improve its performance based on the results of study visits of previous subjects. The weighting method uses sensor-rated scores (e.g., finger tapping speed) yielded by each explored point as input to generate (or update) a score prediction map in the two-dimensional space.
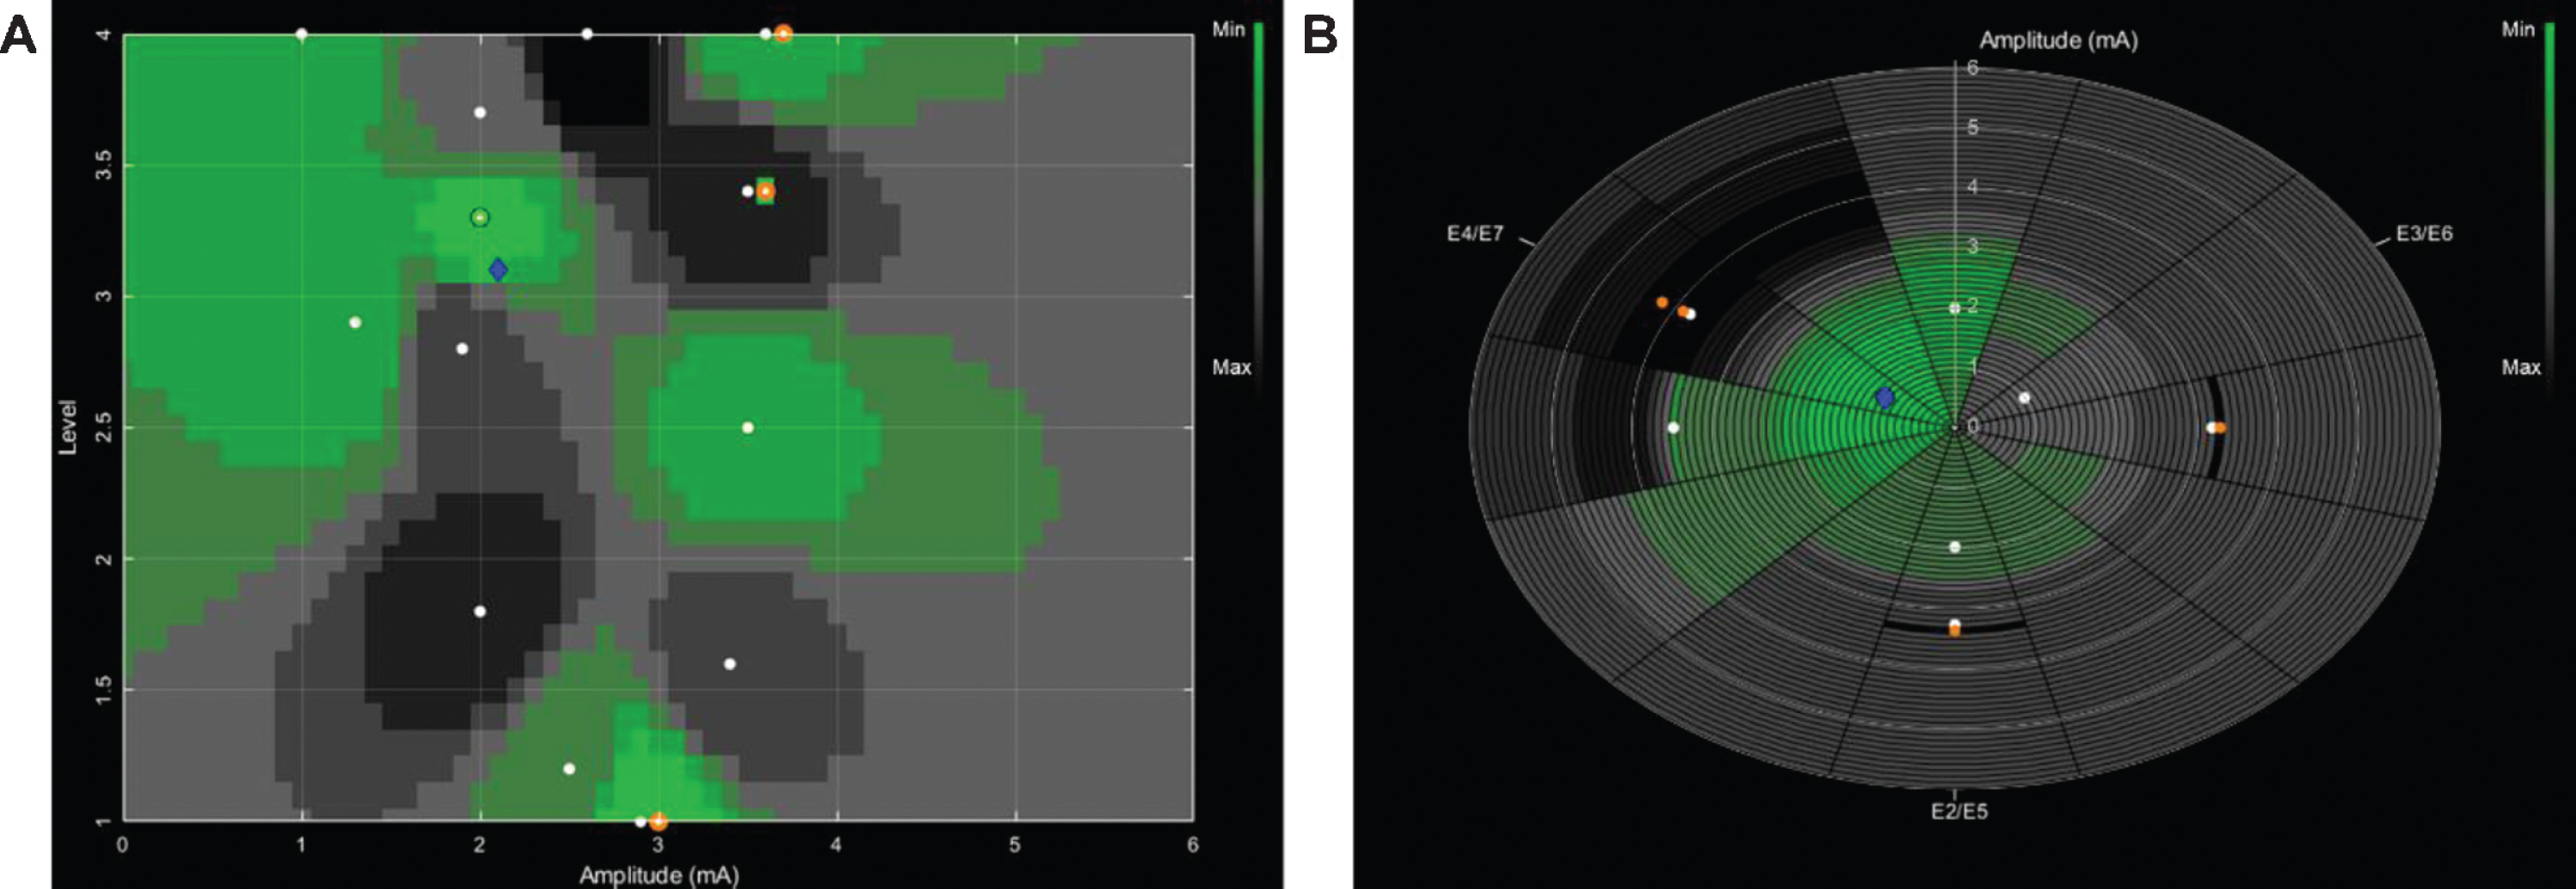
Two-dimensional representation of clinical DBS effects of different stimulation settings in a single subject. Each stimulation setting consists of a contact configuration and a stimulation amplitude. A) Cartesian representation of clinical effects for ring mode stimulation settings. The y-axis corresponds to the four contact levels of the Boston Scientific directional lead. The x-axis corresponds to the stimulation amplitude. B) Polar representation of clinical effects for directional mode stimulation settings. Each of the slices on the plot corresponds to a 30° angle. The labels (e.g., E2/5) indicate the radial orientation of the tripartite contacts in Boston Scientific directional leads, each spanning 120°. The radius of the slices corresponds to the stimulation amplitude. For both representations, each plotted point (white circles) represents the motion sensor score of a previously suggested and tested stimulation. The color-coding of the areas in between the tested stimulation settings (white circles) represents the score predicted by the algorithm. Green colors represent a lower (favorable) value of the predicted score, whereas darker colors represent a higher value. The blue diamond represents the current suggestion of the algorithm for the next stimulation setting to be tested. In panel A this blue diamond refers to a ring mode stimulation setting with a total amplitude of 2.1 mA (upper tripartite contacts, labeled 5, 6 and 7 with 30%and uppermost ring contact, labeled 8 with 10%of total current). In panel B the blue diamond refers to a directional stimulation setting with a total amplitude of 1 mA. The radial current steering is directed to the right-posterior segments of the tripartite contacts (contact 7 with 70%and contact 8 with 30%of total current).
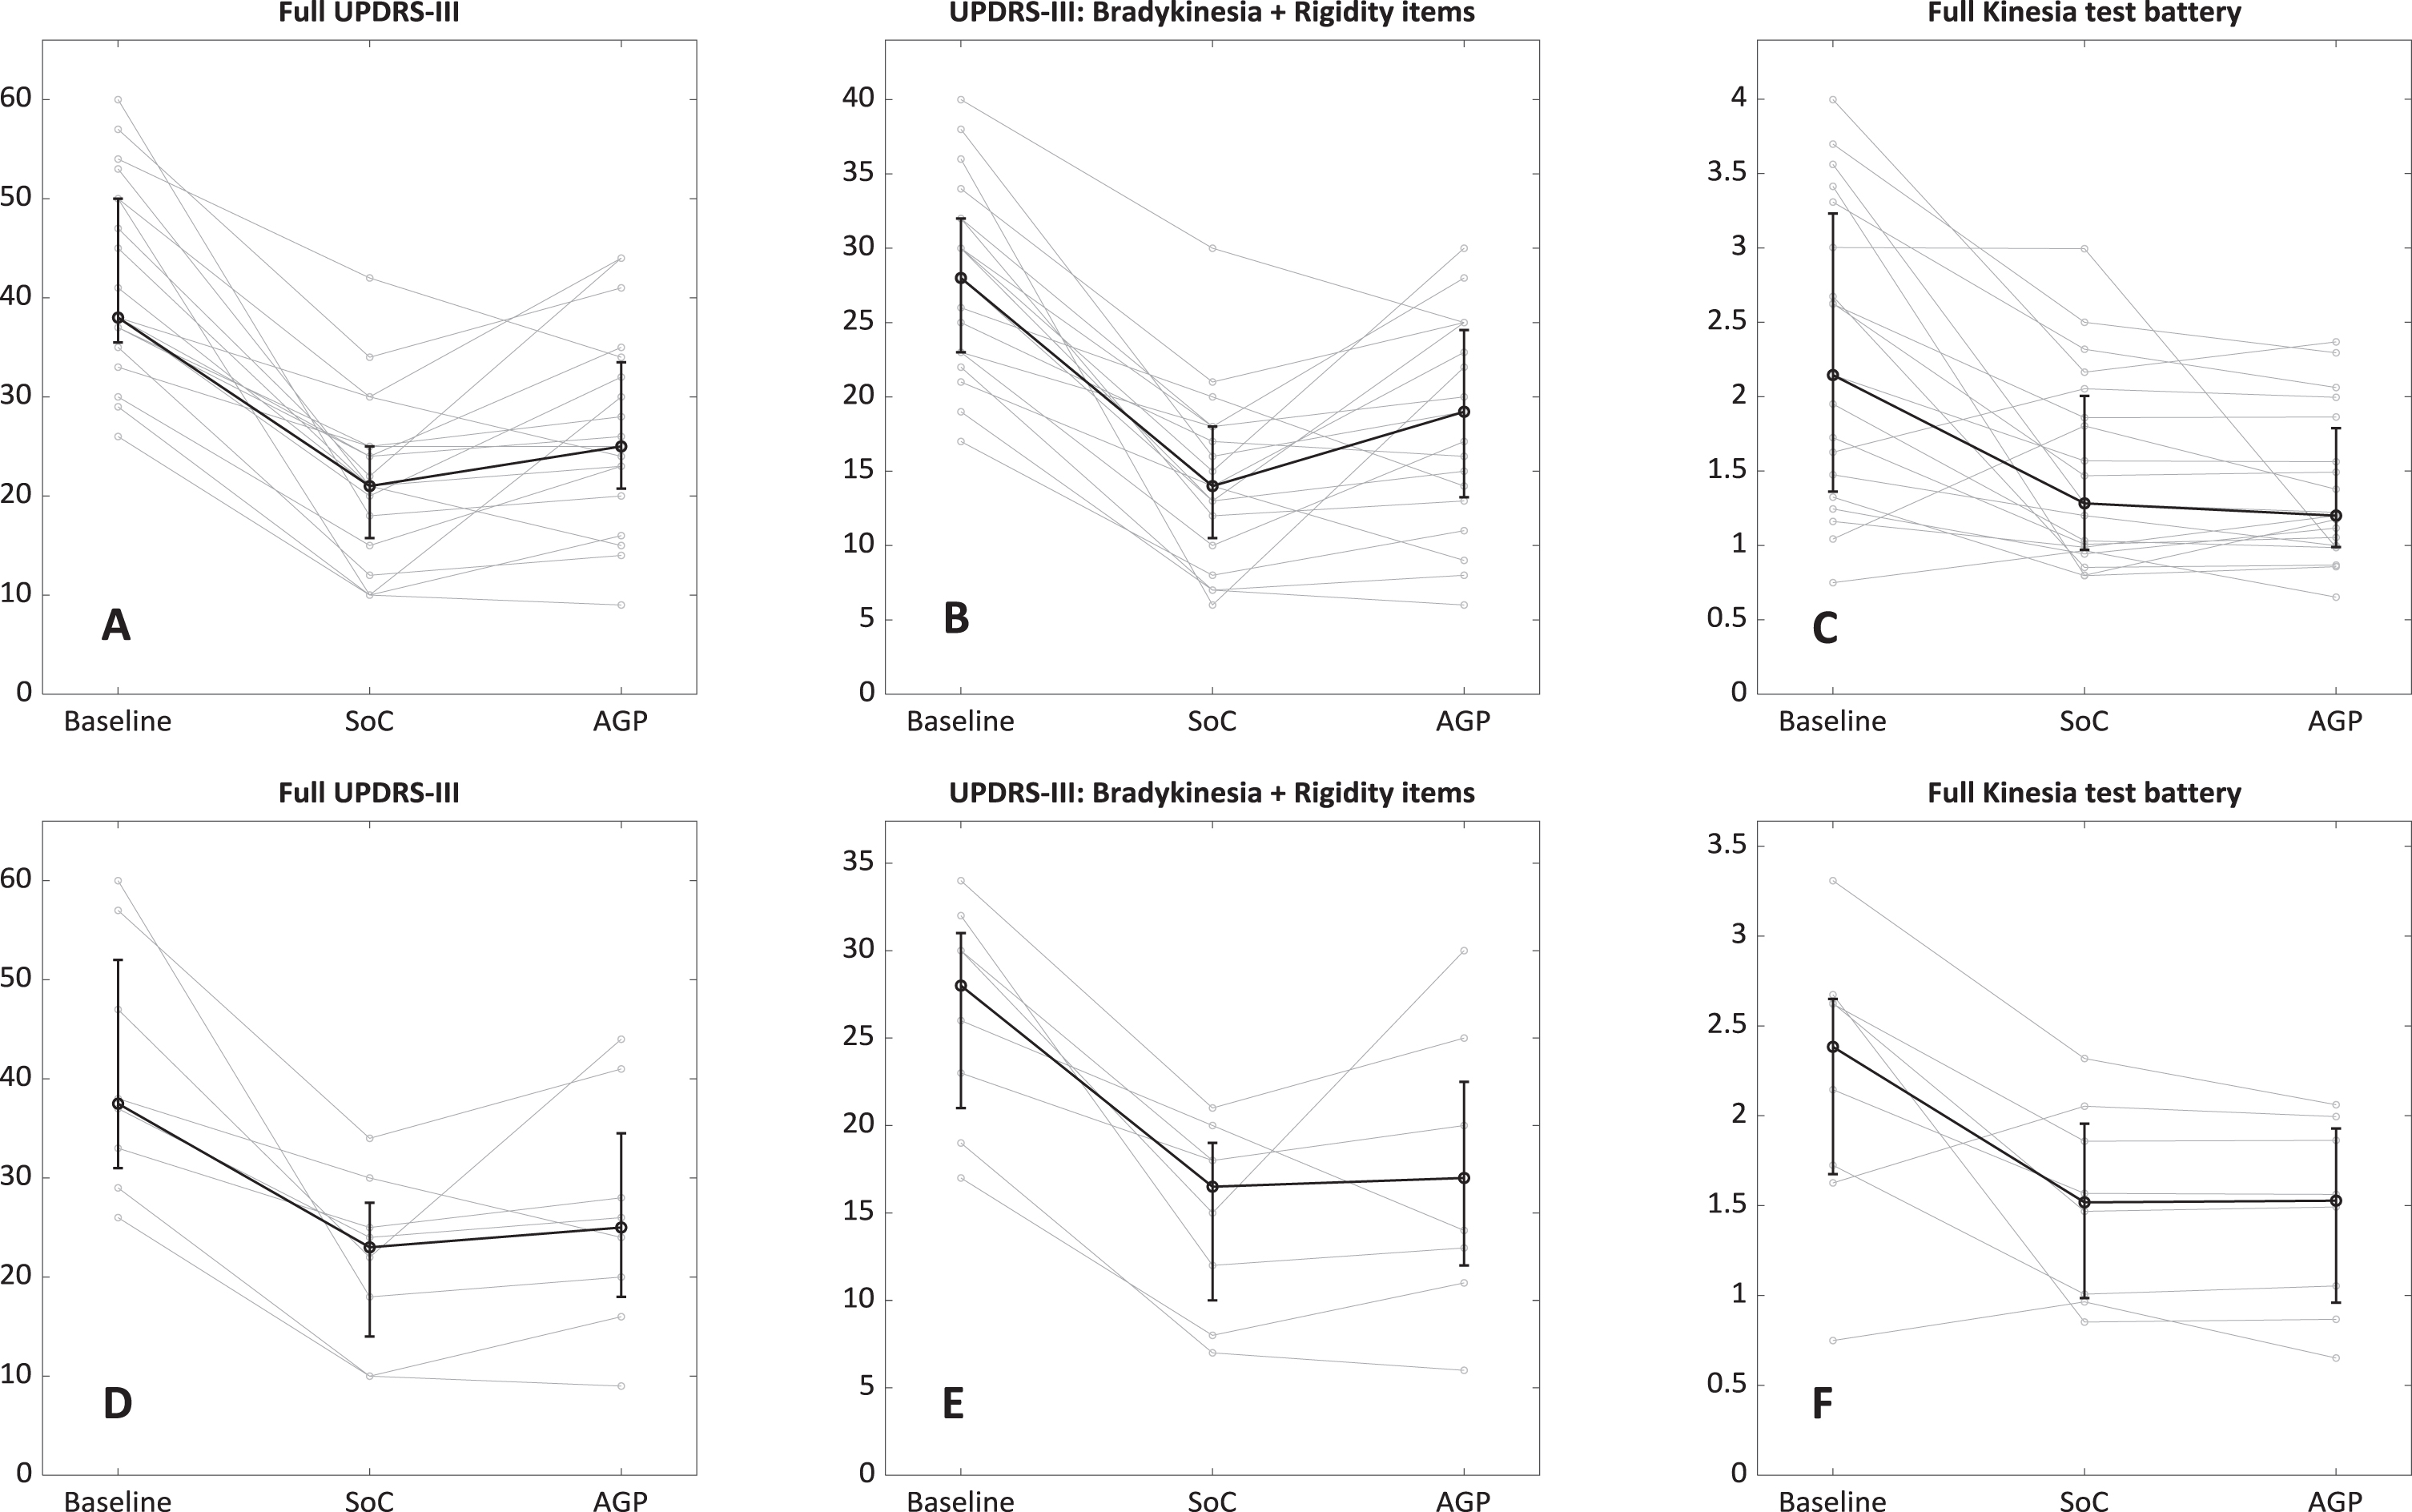
Outcome measures of double-blind evaluation (SoC vs. AgP) in randomized order. The bold black line shows median values with interquartile range. A) Full UPDRS-III scores, entire cohort. B) UPDRS-III-items related to bradykinesia and rigidity, entire cohort. Note the different scaling of the y-axis compared to panel A. C) Median score of motion-sensor full test battery (rest tremor, finger taps, hand grasps, all bilateral), entire cohort. Symptom severity in every task is rated by a proprietary algorithm of the manufacturer on a scale from 0 (best) to 4 (worst) D-F) Same data for subjects in the subgroup with uniform algorithm version.
The algorithm keeps frequency at 130 Hz and pulse width at 60 μs. Six versions of the algorithm were evaluated during the study to optimize the number of iterations and identify the most suitable target symptom to be used as feedback signal. Different algorithm versions were compared against each other by applying them in consecutive visits. After deciding on a most promising algorithm version, this version was used in all further study visits (subj. S0672G017 and subjects enrolled later, see Table 1). A subgroup of 10 subjects with this uniform algorithm version was analyzed separately.
Demographic data of study subjects. The column “Improvement Levodopa challenge” relates to preoperative Levodopa challenge for DBS-evaluation. a) Subgroup with uniform algorithm version, b) subjects with one hemisphere excluded from hemisphere-wise analysis. Subject S0672G009 did not complete the study due to fatigue and was excluded from any analysis
To suggest new points (i.e., new stimulation settings) to explore in the two-dimensional space, the weighting method in the algorithm needs a minimum number of existing data points (see also starting point in Fig. 1E). To generate the number of data points required, a number of three to six (depending on the algorithm version) stimulation settings, scattered over the parameter-space, were chosen as predefined settings to be explored first at each algorithm-guided testing session.
Once the predefined settings (i.e., points on the two-dimensional spaces) are explored, the weighting method determines the next point to explore based on the score prediction map and distances between the explored points. First, the optimal vertical level is determined and afterwards, the algorithm explores radial steering on this vertical level. For every suggestion received, the DBS-settings were first evaluated for side-effects by the clinician. If the stimulation amplitude suggested by AgP led to side effects, the highest amplitude possible without side effects was chosen. After a wash-in time of at least 30 s, bradykinesia was assessed by a single motion-sensor task, and rigidity by a physician. Only the sensor-rated score was used as feedback for the algorithm.
Finally, the exploration method stops when predefined criteria for optimal setting are fulfilled. This is the case if the algorithm has exhausted the points in the two-dimensional space that could potentially lead to a score improvement, i.e., distance between explored and suggested points is below a predefined value.
Statistics
Full UPDRS-III and Kinesia One™ sensor scores were compared by median/interquartile range and programming time by mean/standard deviation. Wilcoxon signed-rank test was used to test for differences in UPDRS-III and sensor-based scores. Due to the exploratory nature of the study, no correction for multiple comparisons was performed. To explore potential factors that influence the effectiveness of AgP (measured as reduction of hemibody UPDRS-III by AgP compared to baseline/off-stimulation-state) a mixed-effects (random intercept) model was used. Predictors tested in the mixed-effects model can be found in the Supplementary Methods. SPSS® was used for the mixed model, Matlab® for all other analyses.
Lead localization and active contact analysis
Lead localizations were performed with the Lead-DBS toolbox (see also Supplementary Methods) [18]. Active contacts of AgP and SoC DBS-settings were compared with regards to their relative anatomical location to the STN, as well as to a literature-reported stimulation target [19]. The proximity of active contacts to this target coordinate has previously been shown to strongly correlate with clinical outcome [18], suggesting it could be an additional criterion for optimal contact selection. To validate this clinical-anatomical relationship in our dataset, distances between active contacts for both conditions (SoC and AgP) and literature-reported stimulation target were first correlated with the relative changes in UPDRS-III hemibody scores, before comparing the distances between the conditions using a paired t-test. Of note, if multiple contacts were activated, a weighted mean distance was calculated according to the current distribution between the respective contacts. In order to determine whether activated contacts for each condition were closer to the literature-reported stimulation target than solely by chance, we applied a permutation approach [20] and calculated distances of randomly activated contacts (10,000 permutations for each condition) to the stimulation target. To retain the number of active contacts per lead and distribution of electrical current in the permuted data, active contacts were first permuted within each lead and then randomly assigned to different leads. Furthermore, permutations with non-adjacent active contact configurations were discarded, since they do not fulfill inclusion criteria of SoC as well as the restrictions of AgP settings. This way only the contact selection was randomized while other possible features, specific for each condition, were kept constant. Two-sided t-tests were then performed between each permutation and the original sample in order to calculate median p-values for each condition. Finally, mean distances to the target were calculated across all permutations for each condition.
RESULTS
In this study, 23 PD patients (4 female, mean age 61.9 years) who underwent STN-DBS were included (hereinafter referred to as “entire cohort”). One subject did not complete the study due to fatigue. In three subjects protocol deviations occurred (wrong programming of settings in one hemisphere (n = 2), reprogramming in one hemisphere due to side effects during blinded evaluation of AgP settings (n = 1)). Therefore, these three subjects had to be excluded from the analyses using full UPDRS-III as the outcome parameter. In analyses using hemibody UPDRS-III as the outcome parameter, only the hemispheres (n = 3) affected by the protocol deviation were excluded. Two of the aforementioned subjects were in the subgroup with uniform algorithm version, thus 2 subjects (2 hemispheres) had to be excluded from analysis across subjects (hemispheres). Subjects’ demographics and clinical data are shown in Table 1. SoC DBS-settings are shown in Supplementary Table 1.
Global clinical outcomes
We found a statistically significant and clinically meaningful median improvement in full UPDRS-III scores for both, SoC (median 49%, interquartile range 36–61%) and AgP (37%, interquartile range 18–54) DBS-settings compared to off-stimulation-state in the entire cohort (both p < 0.0002). The median motion sensor score used for feedback was also significantly improved for SoC by 30%(interquartile range 16–45) and for AgP by 38%(interquartile range 17–48) (both p < 0.003). When considering the entire cohort, a significant difference between SoC and AgP in full UPDRS-III (n = 19, median (interquartile range) SoC: 21 (15.8–25.0), AgP: 25 (20.8–33.5)) and hemibody UPDRS-III (n = 41) scores was found (p = 0.02 in favor of SoC) but not for the sensor-based test battery (p = 0.42; Table 2).
Summary of outcome parameters obtained in blinded evaluation phase (UPDRS-III and Kinesia-sensor full test battery). Median values with interquartile range shown for UPDRS-III and Kinesia-scores. In the group all subjects with heterogenous algorithm versions a significant advantage for SoC with a medium effect size is evident. However, when using the latest algorithm version, no significant difference was observed and also effect size was decreased. No significant differences between bodysides were found
*in favor of SoC.
In the analysis of the subgroup of subjects using only the latest and more advanced version of the algorithm, no significant differences were found between SoC and AgP for full UPDRS-III scores (n = 8, median (interquartile range) SoC: 23 (14.0 –27.5), AgP: 25 (18 –34.5)) or sensor-based test battery. However, a significant difference in hemibody UPDRS-III scores (n = 18) remained between AgP and SoC (p = 0.05 in favor of SoC, Table 2).
Programming time for the AgP-loop (Fig. 1E) was 1.9±0.4 h and estimated programming time for SoC was 4.1±1.6 h in the entire cohort. Similar results were found for the subgroup (SoC: 4.0±1.4 h, AgP 1.8±0.3 h). Due to very different workflows in SoC and AgP, no significance testing was performed between the two programming modalities for time consumption. A mean number of 17.9±5.9 steps (i.e., algorithm cycles in Fig. 1, min. 7, max. 30 steps) per hemisphere was needed to reach the predefined stop criteria for AgP. As no reliable estimation of SoC-steps was possible, a comparison of steps needed for AgP and SoC as an exploratory endpoint was discarded. Side effects of AgP during blinded evaluation phase occurred in two subjects (delayed onset of dyskinesia and capsular stimulation). In three subjects the AgP-settings were chosen as Go-Home-Settings and one of those patients reported to have a sustained benefit from AgP-settings.
Exploration of relevant factors for AgP
A mixed-effects model for the complete dataset (n = 41 hemispheres) showed four significant predictors for the effectiveness of AgP: a) range (difference between best and worst sensor-score obtained during the AgP-loop) of target-sensor-score (estimated regression coefficient β= 0.11±0.04, p = 0.02); b) difference in stimulation amplitude between SoC and AgP (β= 0.07±0.02, p = 0.001); c + d) an interaction term containing hemibody UPDRS-III reduction by SoC and preoperative Levodopa-response (β= 0.91±0.18, p < 0.001). The relative model quality was considerably increased by backwards elimination and adding the interaction term (Akaike information criterion: all variables 7.6/sensor-range and amplitude difference only 0.8/with interaction term added –16.9). Amplitude difference and the interaction term remained significant predictors with regression coefficients in a similar range when the model was applied to the subgroup of subjects with uniform algorithm version (amplitude difference β= 0.06±0.02, p = 0.009; interaction term β= 0.84±0.25, p = 0.007). The range of the target sensor-score did not reach statistical significance in the subgroup but remained as a trend (β= 0.13±0.07, p = 0.074). Stepwise increase of relative model quality was observed in the manner described for the full dataset (Akaike information criterion: 5.9/4.8/–3.0).
Lead localizations
On average, 2.6±1.0 and 2.8±1.4 contacts were activated per lead in SoC and AgP DBS-settings, respectively (see also DBS-settings in Supplementary Table 1). No statistically significant differences were found with regard to stimulation amplitude (SoC: 3.0±1.1 mA; AgP: 2.6±1.1 mA). While 54%of all contacts were identically selected as active or inactive in both settings, some differences in contact selections were observed. Directional settings were selected by SoC in 36%of the cases, whereas AgP selected this kind of settings for 53%of the cases. From the contacts activated by SoC, 89%were located within or at the border of the STN, while for contacts activated by AgP, this percentage decreased to 70%. Upper-level contacts were activated more often in AgP. This led to a difference in active contact locations compared to SoC (p < 0.001), with AgP active contacts being located on average 0.2 mm lateral, 0.4 mm anterior and 0.8 mm dorsal to SoC active contacts (Fig. 4). Dispersion of active contacts was smaller in SoC than in AgP (mean distance between active contacts 3.1±0.8 mm vs 3.9±1.1 mm, p < 0.00001). The distances between active contacts for all analyzed DBS-settings (i.e., SoC and AgP DBS-settings) and a literature-reported stimulation target were correlated to clinical improvements (Pearson r = 0.30, p < 0.01, Fig. 4). In SoC DBS-settings, active contacts were located closer to the target than randomly activated contacts (Permuted mean distance: 2.3±1.4 mm, SoC: 1.8±1.0 mm with p < 0.001). Active AgP contacts showed a trend towards being located closer to the stimulation target than contacts of permuted settings (Permuted mean distance: 2.3±1.4 mm, AgP: 2.0±1.3 mm with p = 0.07). SoC active contacts were not located significantly closer to the stimulation target compared to AgP contacts (p = 0.11). Comparable results were obtained, when analyzing the subgroup of subjects with uniform algorithm version (see Supplementary Results).
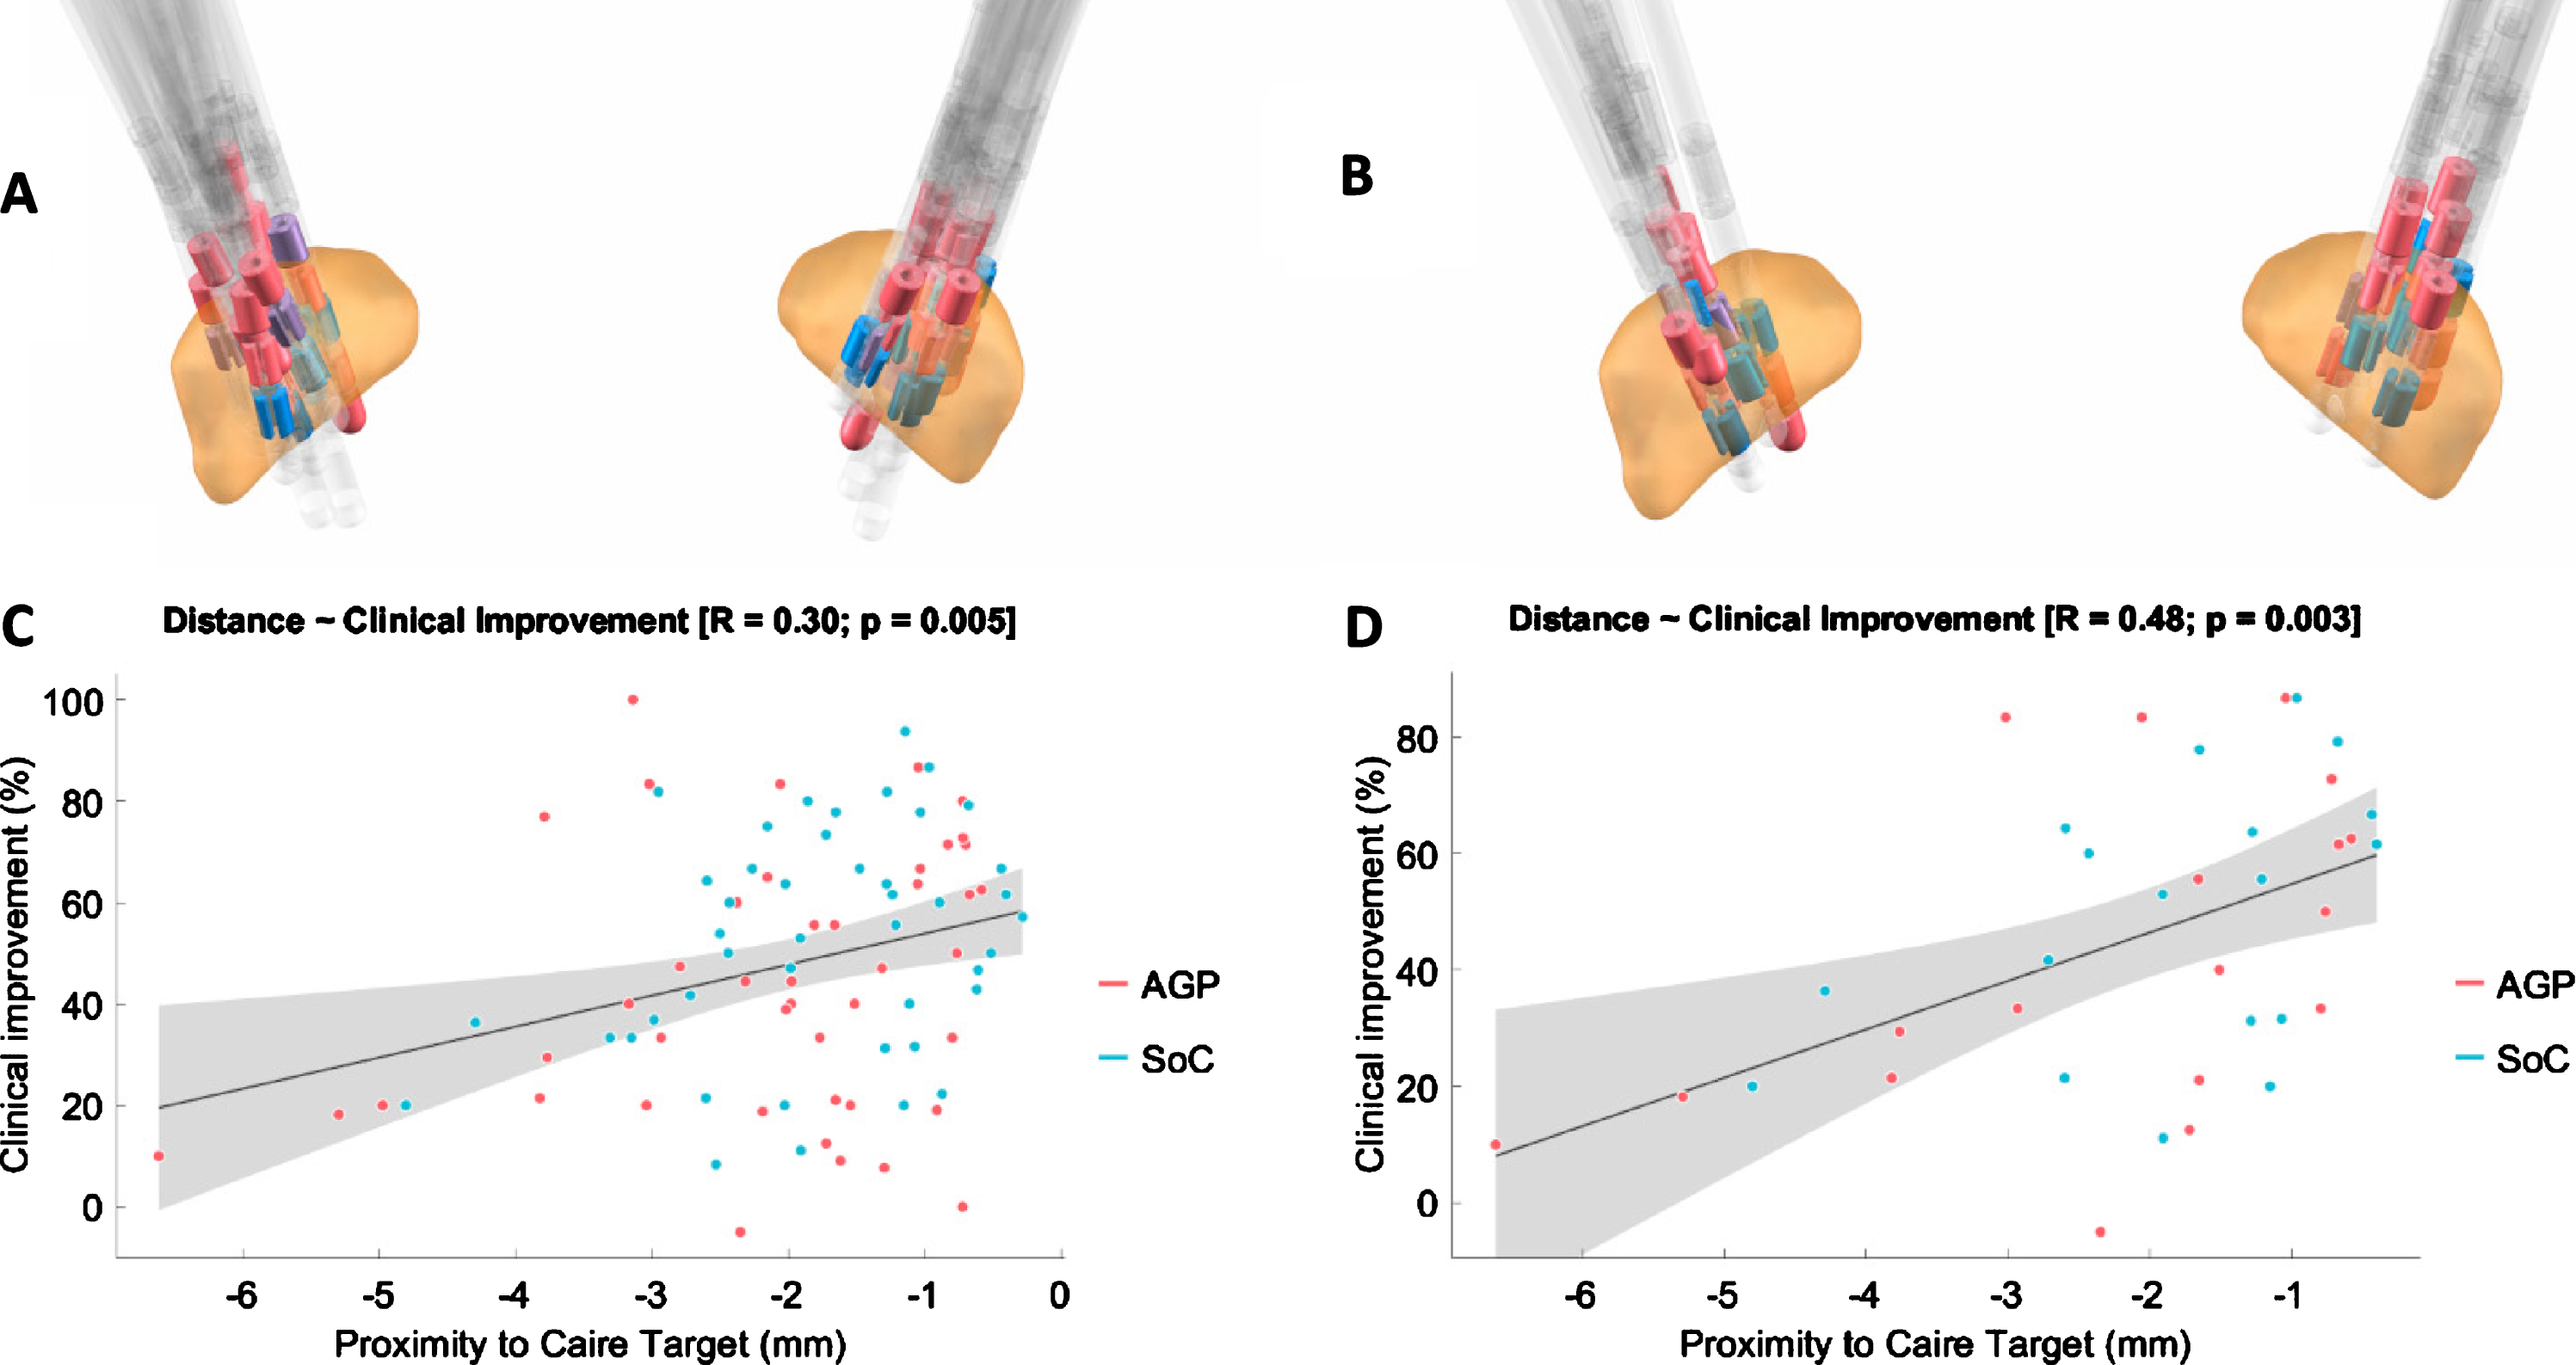
A, B) Reconstructed lead localizations in the STN (orange) by Lead-DBS Matlab toolbox of the full study cohort (left) or the subgroup with uniform algorithm version (right). Red: AgP-contacts, blue: SoC-contacts, purple: shared contacts. Note the dorsally located clustering of red (AgP) contacts. C, D) Correlation plots for the full cohort (left) and subgroup (right) between distance of active contact to a literature reported stimulation target and clinical improvement (hemibody UPDRS-III score, percent improvement compared to baseline, i.e., off-medication-state, off-stimulation-state).
DISCUSSION
There is broad consensus that the complexity of DBS-programming with directional leads requires new approaches to successfully use the full range of settings available and reduce programming-burden for clinicians. Major strategies include feedback by wearable sensors, imaging-based selection of stimulation parameters, neurophysiological or even neurochemical monitoring [2, 21–24].
In our two-center study we investigated the new approach to replace the traditional monopolar review by a largely automated algorithm-guided testing strategy for stimulation settings with segmented leads in a randomized, crossover, double-blind setting. Both SoC and AgP DBS-settings resulted in clinically relevant improvement of motor symptoms compared to off-stimulation-state as measured by full UPDRS-III and motion sensor tasks. Considering the entire cohort, in whom different versions of the algorithm were tested, a statistically significant difference in UPDRS-III scores was found in favor of SoC. There was a difference of 4 points (12%) in median UPDRS-III, which may just reach clinical relevance. Usually, a difference of 5 points or more is regarded as clinically relevant on a group level [25].
With the latest and most advanced version of the algorithm, outcomes did not differ significantly between SoC and AgP but could not be formally tested for non-inferiority. In this vein, the small sample size in this subgroup as well as a difference of 2 points (14%) in median UPDRS-III in favor of SoC has to be considered and needs further evaluation in larger cohorts. Contacts activated in AgP DBS-settings showed a slightly larger average distance to the literature-reported stimulation target used in this work, and a greater spatial dispersion with a tendency to select upper contacts, compared to the contacts activated in SoC.
Previous studies using the same motion sensor system used in this study state a better test-retest reliability and sensitivity to changes in bradykinesia in DBS-patients compared to clinical rating [26, 27], which has been a rationale for using sensor measurements as main feedback for algorithmic programming. The model derived from our dataset suggests that AgP is mostly effective in patients, who show strong clinical treatment effects. One of the significant predictors for finding effective AgP-settings in terms of UPDRS-III improvement describes the effect magnitude of DBS on the sensor-measure used for feedback (larger range between best and worst score during AgP-loop leads to more effective AgP-settings). The other significant predictors describe the general treatment effect in a regular clinical setting (good effect of SoC-settings or Levodopa). This suggests that even though sensors are technically capable of capturing very small differences, in this study setting a quick and sufficiently strong clinical response is required to distinguish the effect of one specific DBS-setting from another setting or noise in behavioral data.
Furthermore, amplitudes were lower in AgP compared to SoC on average and the intraindividual stimulation amplitude difference between AgP and SoC partially explained the effectiveness of AgP. As active contact analysis showed AgP-contacts to be farther away from the stimulation target, one might hypothesize, that in AgP-contacts side effects might occur at lower amplitudes compared to SoC-contacts as AgP-contacts might be closer to adjacent anatomical structures causing side effects. This might hamper increasing the amplitude to an optimally effective level in AgP and lead to the observed effect of amplitude difference on AgP effectiveness.
Up to now, there are only few studies investigating sensor-based DBS optimization. Recently, results from a cohort of patients with STN-DBS and linear 8-contact leads using the same algorithm as this study was published [28]. Similar to our study, SoC and AgP yielded significant improvements in UPDRS-III scores compared to off-stimulation-state and no significant differences were found between the two programming modalities. A significant reduction in steps needed to achieve the final DBS settings was also observed and in contrast to our study SoC programming was performed the same day as the study visit, thus allowing for a direct comparison. However, as only linear leads were investigated, the results only partially apply to our cohort. In directional leads both SoC and AgP most likely require more time and steps.
One study by Haddock et al. shows that AgP performed at least equally to SoC when only tremor rating is assessed [29]. In another study, Heldman et al. achieved a similar algorithm-guided improvement of 35.7%in tremor and bradykinesia but investigated a much smaller parameter-space due to conventional 4-ring-leads with only monopolar configurations [30]. In contrast, the parameter space of directional leads combined with multiple independent current sources in our study is far more complex (although in our study the algorithm only suggested cathodic stimulation settings on adjacent contacts). Furthermore, due to just unilateral testing in the study of Heldman et al., no comparison with standard of care settings or a control group was made [30]. In a similar study setting that used measurements of the same motion-sensor as feedback signal, AgP outperformed a clinical monopolar review in terms of DBS-effect on tremor and bradykinesia measured by the sensor system. However, the effect was mainly attributed to higher voltages chosen in AgP, and no blinded evaluation nor comparison in motor UPDRS scores was performed [31]. Importantly, in our cohort, stimulation-amplitudes were non-significantly lower for AgP.
As PD symptoms show considerable interindividual differences, the signal used for feedback is a crucial factor for AgP. The clinically relevant DBS-effect may differ between patients (e.g., bradykinesia, tremor, gait disorder) and a sensor-based feedback system must be capable of measuring the symptom relevant to the individual patient or ideally, an individually weighted set of symptoms. One limitation of our study was that only a single motion-sensor measurement was used for feedback. Future designs should include a broader range of symptoms being measurable by sensors or physicians in order to continuously adapt stimulation specifically to a patient’s individual symptom spectrum. Here, an advantage of sensor-based approaches, compared to imaging-guided strategies, is the potential to provide a continuous monitoring of symptoms and continuous adaption of PD therapy, including evaluation of different DBS-settings in a long-term outpatient context [32].
Several other approaches for guided programming, especially, image-guided approaches based on atlases [20, 33], tractography [5, 34] or resting-state MRI [35, 36], together with simulation of electrical fields or volume of activated tissue, can provide a high level of automation in the programming process. A recent study compared this method with traditional programming in PD patients with conventional 8-ring contact leads, three days after DBS-surgery. Based on unblinded patient judgment and blinded physician rating, results revealed that imaging-guided programming needed less programming time, but clinical effects were slightly inferior to traditional programming [37]. This is comparable to our results, where AgP and SoC were almost equal in terms of standardized ratings, but in most of the subjects, advantages of SoC were noticeable for the blinded physician (e.g., global impression in gait assessment, small but visible differences in bradykinesia), that did not lead to a change in the respective UPDRS-III item according to rating criteria. This clinical observation is supported by results of our imaging data, which shows a difference in location of the activated contacts for AgP and SoC with regards to the z-axis on the lead, a smaller dispersion of active contacts for SoC, and a higher portion of contacts inside the STN for SoC. The combination of imaging-guided approaches and sensor-feedback-based adjustment could improve AgP strategies in the future.
Several limitations need to be considered when interpreting the results of our study. Because of the exploratory nature of the study, the algorithm was adapted several times, so the subgroup of subjects with a uniform version of the algorithm is small, which did not allow non-inferiority testing. Another limitation is the feedback to the algorithm using only a single sensor-based parameter. This might account for the fact, that while the sensor-based parameter was efficiently optimized by the algorithm, advantages for SoC were noticeable for subjects and the blinded physician. Using multiple symptoms for sensor-based feedback and reducing the parameter space based on imaging could improve AgP approaches in the future. Finally, SoC time consumption was solely based on the physician’s estimation and medical history. Therefore, it is not possible to make a valid, direct comparison between SoC and AgP in terms of time consumption. However, considering clinical experience the usual programming time in clinical routine exceeds 2 h per patient and our results support that future development of effective AgP may help to reduce the programming burden for clinicians.
In summary, we provide evidence for feasibility of algorithm-guided programming in a prospective, randomized, double-blind trial applying motion-sensor-guided programming in directional leads. Although not providing evidence for non-inferiority of algorithm-guidance in long-term clinical application, our results may guide future development in the field of algorithm-guided programming.
Footnotes
ACKNOWLEDGMENTS
JR is funded by a research project to AAK by the Deutsche Forschungsgemeinschaft (DFG, German Research Foundation) under Germany's Excellence Strategy –EXC-2049 –39068808.
Boston Scientific provided financial support for the conduct of the research, but not for the preparation of the article and will not pay the article publication charges. Boston Scientific participated in the study design, prepared formal documents and provided (e)CRFs for the collection of data. Furthermore, Boston Scientific drafted the ‘Methods’ section and provided review for the statistical analysis and the manuscript. All data analysis was performed by GRW and JR independently from Boston Scientific. A review board of Boston Scientific approved the decision to submit the article for publication but did not make any suggestions for changes to the manuscript.
CONFLICT OF INTEREST
GRW received travel expenses and attendance fees by Boston Scientific and Ipsen Pharma.
JR has nothing to disclose.
EG declares travel and attendance grants from Abbvie, Abbott, Medtronic and Bial.
HS, LJP and KW are full-time eployees of Boston Scientific.
MPN received Boston scientific study fees and Abbott study fees.
AAK declares that she is on the advisory board of Boston Scientific and Medtronic and has received honoraria from Boston Scientific, Medtronic, Abbott, Teva and Ipsen.