
Abstract
Background:
The role of the lipidome as a biomarker for Parkinson’s disease (PD) is a relatively new field that currently only focuses on PD diagnosis.
Objective:
To identify a relevant lipidome signature for PD severity markers.
Methods:
Disease severity of 149 PD patients was assessed by the Unified Parkinson’s Disease Rating Scale (UPDRS) and the Montreal Cognitive Assessment (MoCA). The lipid composition of whole blood samples was analyzed, consisting of 517 lipid species from 37 classes; these included all major classes of glycerophospholipids, sphingolipids, glycerolipids, and sterols. To handle the high number of lipids, the selection of lipid species and classes was consolidated via analysis of interrelations between lipidomics and disease severity prediction using the random forest machine-learning algorithm aided by conventional statistical methods.
Results:
Specific lipid classes dihydrosphingomyelin (dhSM), plasmalogen phosphatidylethanolamine (PEp), glucosylceramide (GlcCer), dihydro globotriaosylceramide (dhGB3), and to a lesser degree dihydro GM3 ganglioside (dhGM3), as well as species dhSM(20:0), PEp(38:6), PEp(42:7), GlcCer(16:0), GlcCer(24:1), dhGM3(22:0), dhGM3(16:0), and dhGB3(16:0) contribute to PD severity prediction of UPDRS III score. These, together with age, age at onset, and disease duration, also contribute to prediction of UPDRS total score. We demonstrate that certain lipid classes and species interrelate differently with the degree of severity of motor symptoms between men and women, and that predicting intermediate disease stages is more accurate than predicting less or more severe stages.
Conclusion:
Using machine-learning algorithms and methodologies, we identified lipid signatures that enable prediction of motor severity in PD. Future studies should focus on identifying the biological mechanisms linking GlcCer, dhGB3, dhSM, and PEp with PD severity.
INTRODUCTION
The role of lipids, specifically glycosphingolipids, in Parkinson’s disease (PD) pathogenesis has been highlighted by recent discoveries [1]. The association between PD and lysosomal lipid hydrolases, specifically glucocerebrosidase (GBA) and potentially others (e.g., SMPD1), further supports the need to examine the role of lipids as biomarkers in PD [2]. GBA plays an important role in the glycosphingolipid metabolic pathway, encoding the lysosomal enzyme β-glucosidase (GCase), which hydrolyzes glucosylceramide and glucosylsphingosine to ceramide and sphingosine, respectively. In GCase deficient cells, α-synuclein aggregation has also been linked to reduced ceramide production [3].
In a previous study, we tested the association between plasma lipid concentration and PD diagnosis [4]. Using univariate logistic regression, two lipid classes, monosialodihexosylgangliosides (GM3) and triacylglycerol (TG), were significantly different between PD and healthy controls. A link between GM3 and PD pathology had been previously demonstrated through research on the high affinity of α-synuclein via its ganglioside-binding domain to GM3, and by a study demonstrating that saturating membranes with GM3 accelerates the aggregation of α-synuclein [5, 6]. However, that analysis was limited to univariate regression models, which assumed variable independencies and did not explore interactions across lipids or the potential of joint impact on the probability of diagnosis. Also, in contrast to that study, in this study, neither GM3 nor TG were found significant to PD severity prediction of the Unified Parkinson’s Disease Rating Scale (UPDRS) score.
Recently, machine learning (ML) has been used in biomedical studies for better predictions and richer insights in PD [7–20] and other neurodegenerative diseases [21]. For example, neural networks and regression trees examined the ability to diagnose PD based on biomedical voice measurements [9], and other regression trees such as a random forest (RF) were used to estimate the UPDRS score based on a speech test [16]. Similarly, ML algorithms predicted PD severity using non-motor PD symptoms [7] and a voice data set [15].
Here, we extend our previous investigation of linear connections between lipids and PD diagnosis [4] to a prediction of disease severity using the multivariate non-linear RF algorithm. We also identify interrelations among a lipidome of 517 species from 37 classes and PD severity measured by the UPDRS and the Montreal Cognitive Assessment (MoCA) scores [24]. To our knowledge, this research is the first to study the interrelations between the lipidome and PD severity using a combination of a relatively large cohort and multivariate non-linear ML algorithms.
MATERIAL AND METHODS
Participants and clinical evaluation
The cohort analyzed was as described in an earlier study [4]. In brief, participants in the ‘Spot’ study [22, 23] were recruited between 2010–2016 from the Center for Parkinson’s Disease at Columbia University Irving Medical Center in New York, NY. Among the participants, we randomly selected PD patients (n = 150). All participants were non-carriers of SNCA, LRRK2, and GBA mutations (with the exception of one PD case who was a carrier of the GBA variant E326K, n = 1). Evaluation of all participants included the MoCA, and the UPDRS in the “on” state. Medical history, current medications, and demographics were also collected. The original study also included 100 controls, which were not analyzed here, as our primary aim was to test the link between lipids and disease severity. Data from these controls are presented only in Fig. 2 for illustrative purposes. Plasma collection for lipidomics was as previously described [4]. In brief, blood samples were collected in single EDTA tubes (10 cc in volume) and centrifuged, after which 1 cc plasma aliquots were extracted and stored in a –80°C freezer within one hour of collection. Table 1 includes all the lipids measured in the study and lipid class membership. Informed consent was signed by all participants and the Columbia University IRB approved all study procedures. Since the UPDRS III and UPDRS total score were missing for a single patient, in this analysis, we used the data of 149 participants.
Lipids measured in the study and their class membership
Analysis of lipid classes and PD severity
The first phase of the study focused on identifying the most influential lipid classes that predicted PD severity as determined by the UPDRS and MoCA scores. We predicted both the UPDRS III and UPDRS total scores, although the latter composes of UPDRS I, II, and III and thus depends on the former. The 37 lipid classes, two clinical variables [age at onset (AAO) and disease duration], demographic variables [i.e., age, gender, height, body mass index (BMI), marital status], and education were the predicting variables.
The root mean square error (RMSE) [25], which is the most common measure to evaluate prediction performance, was calculated as an average over a Monte Carlo cross validation, where in each of 200 datasets, 80% of the (149) observations were sampled randomly (without replacement) for training the algorithm, and the remaining 20% used for testing it. This resampling method was chosen to reinforce the significance of the research results when experimenting with the cohort.
In this phase, we wanted first to validate our ML algorithm, the RF, in predicting PD severity. The RF is a popular accurate classifier, which was shown in many previous studies to be efficient and beneficial in various clinical [21, 26–28] and non-clinical [29, 30] domains. The RF classifier [31, 32] holds no assumptions about the data distribution, can cope with very complex problems with minimum overfitting [31, 33–35], and ranks variables by their contribution to accurate (or informative) prediction [36–38]. In this phase, we selected variables that were ranked in the top 30% as contributory by RF. For further explanation about the RF, see the Supplementary Material.
In our case, we expected the RF to help interpret the prediction results by indicating interrelations among lipid classes and species with different stages in the disease. Since the RF has never been used in predicting PD severity, we first validated it through conventional statistical methods. Each statistical method is limited by the assumptions it makes, hence we employed three of them. Each statistical method explored the data from a different angle and selected contributing variables, as specified below. The RF together with the statistical methods create an ensemble of classifiers (though not independent) that is used here as “a panel of experts”.
The statistical models that were used to validate and then to enforce the RF algorithm are: (1) Univariate linear regression (UR), where a variable is selected if considered statistically significant with p < 0.05; (2) Multivariate linear regression (MR), implemented by considering variables using sequential backward selection, sequential forward selection, or sequential floating forward selection (i.e., stepwise), where the model that achieves the lowest Akaike information criterion (AIC) [39] is chosen, and all variables that are statistically significant (p < 0.05) are selected; (3) Lasso regression [40], which is based on ordinary least squares with a penalty factor for the number of variables, forces some of the coefficients to equal to zero, and thereby selects the variables with coefficients greater than zero.
We let each of the four methods identify the most contributing variables among the predictors and kept only variables that at least three methods indicated as contributing highly to prediction of the PD severity.
Analysis of lipid species and PD severity
The second phase was done only for the UPDRS since the first phase results for the MoCA showed poor relation to the lipidome. The same methodology of the first phase was implemented here. However, in this phase, we faced another challenge since the number of variables exceeded the number of examples (patients); that is, the 517 lipid species and eight demographical and clinical variables were much greater than the 149 patients, which made variable selection even more challenging than in the first phase. To accommodate this, we selected only lipid classes that had at least two supporting methods (three methods were employed in the first phase). Then for the lipid species of these classes, we added the eight demographical and clinical variables and let the RF rank these variables as in the first phase. Finally, we sequentially removed lower-ranked variables as long as it did not worsen the RMSE, while keeping at least 10% of the variables to allow for retention of a sufficient number of them.
First in our research plan, we identified and ranked the most contributing lipid classes and species for UPDRS total and UPDRS III scores in a two-stage approach (first classes and then species of the most contributing classes) using the RF classifier that is validated using statistical methods. Second, we examined values of plasma concentrations of the most contributing lipid classes and species in different PD severity levels and considered their sensitivity to gender and age. Third, we identified lipid signatures (combinations of classes, species, and demographics) for different severity levels, and evaluated their interrelations with age, AAO, and disease duration and the impact of the combined signatures on the prediction model accuracy.
RESULTS
Data description
Table 2 presents descriptive statistics for the demographical and clinical data of the 149 PD patients’ cohort. The AAO is platykurtic (kurtosis = –0.52, skewness = 0.029), the disease duration is leptokurtic and positively skewed (kurtosis = 1.99, skewness = 1.35), with 82% of the patients with disease durations shorter than 10 years. Gender, by design, is evenly distributed (75 males and 74 females). The medication (Levodopa) dosage distribution for different UPDRS III scores is presented in Supplementary Figure 1, showing, as expected, that the dosage increases with the severity.
Descriptive statistics of demographical and clinical data of the 149 PD patients cohort
UPDRS, Unified Parkinson’s Disease Rating Scale; MoCA, Montreal Cogntive Assessment.
Lipid classes for prediction of disease severity
Table 3 shows the most contributing variables (as defined above and based on at least three out of four algorithms) from all lipid classes and the demographical and clinical variables for the UPDRS total and UPDRS III scores. As expected, age and disease duration were found among the most influential variables especially for UPDRS total score. Our data shows that dihydroglobotriaosylceramide (dhGB3), dihydrosphingomyelin (dhSM), glucosylceramide (GlcCer), and plasmalogen phosphatidylethanolamine (PEp) are the most contributory lipid classes in prediction of both UPDRS total and UPDRS III scores. While the UR and MR sometimes gave conflicting results regarding the significance of a variable, RF and Lasso were more consistent. Similar to age and disease duration, higher GlcCer, dhGB3, and globotriaosylceramide (GB3) values were associated with higher scores (the first two classes for both UPDRS total and III scores). In contrast, dhSM and PEp (for both UPDRS total and III scores) as well as monoacylglycerol (MG), phosphatidylethanolamine (PE), and dihydro GM3 (dhGM3) (only for UPDRS III score) affected UPDRS negatively. In addition, lipid classes sulfatide (Sulf), free cholesterol (FC), acyl phosphatidylglycerol (APG), lysophosphatidylcholine (LPC), phosphatidylglycerol (PG), and dhGM3, as well as lipid classes triacylglycerol (TG), dihydrolactosylceramide (dhLacCer), lysophosphatidylinositol (LPI), APG, and Sulf had only two supporting methods for UPDRS total and UPDRS III scores, respectively, and thus are not presented in Table 3. Additionally, BMI was not found to be a contributing variable.
Most contributing lipid classes for UPDRS scores prediction
Lipid acronyms: Dihydrosphingomyelin (dhSM), plasmalogen phosphatidylethanolamine (PEp), glucosylceramide (GlcCer), globotriaosylceramide (GB3), dihydro globotriaosyl ceramide (dhGB3), monoacylglycerol (MG), phosphatidylethanolamine (PE), dihydro GM3 ganglioside (dhGM3). Univariate linear regression (UR). Multivariate linear regression (MR). Lipid classes and clinical and demographic variables identified as contributing/statistically significant to severity prediction [as calculated by UPDRS total (upper section) and UPDRS III (lower section)] scores by at least three methods. Also shown is the variable impact/direction (as positive/negative) based on the Lasso regression (since the Lasso coefficient for AAO was zero, we used Ridge regression to get the direction of impact for this variable). The p-value is presented for significant variables only. Variables supported by four or three methods are sorted according first to the UR and then MR p-values, and those common to UPDRS total and UPDRS III scores are in
Average plasma concentrations divided by tertiles of the UPDRS III and UPDRS total scores for the cohort are presented in Fig. 1 for dhSM, GlcCer, PEp, and dhGB3. Figure 1 shows that in most of the cases (e.g., dhSM and PEp), a clear trend can be observed (either increasing or decreasing monotonicity) between the scores in the lower and higher cohorts for both UPDRS total and UPDRS III scores. The figure also demonstrates that while female patients have higher concentrations than male patients in the lower score ranges (both UPDRS total and UPDRS III scores), the difference almost always becomes (very) small in the higher severity level.
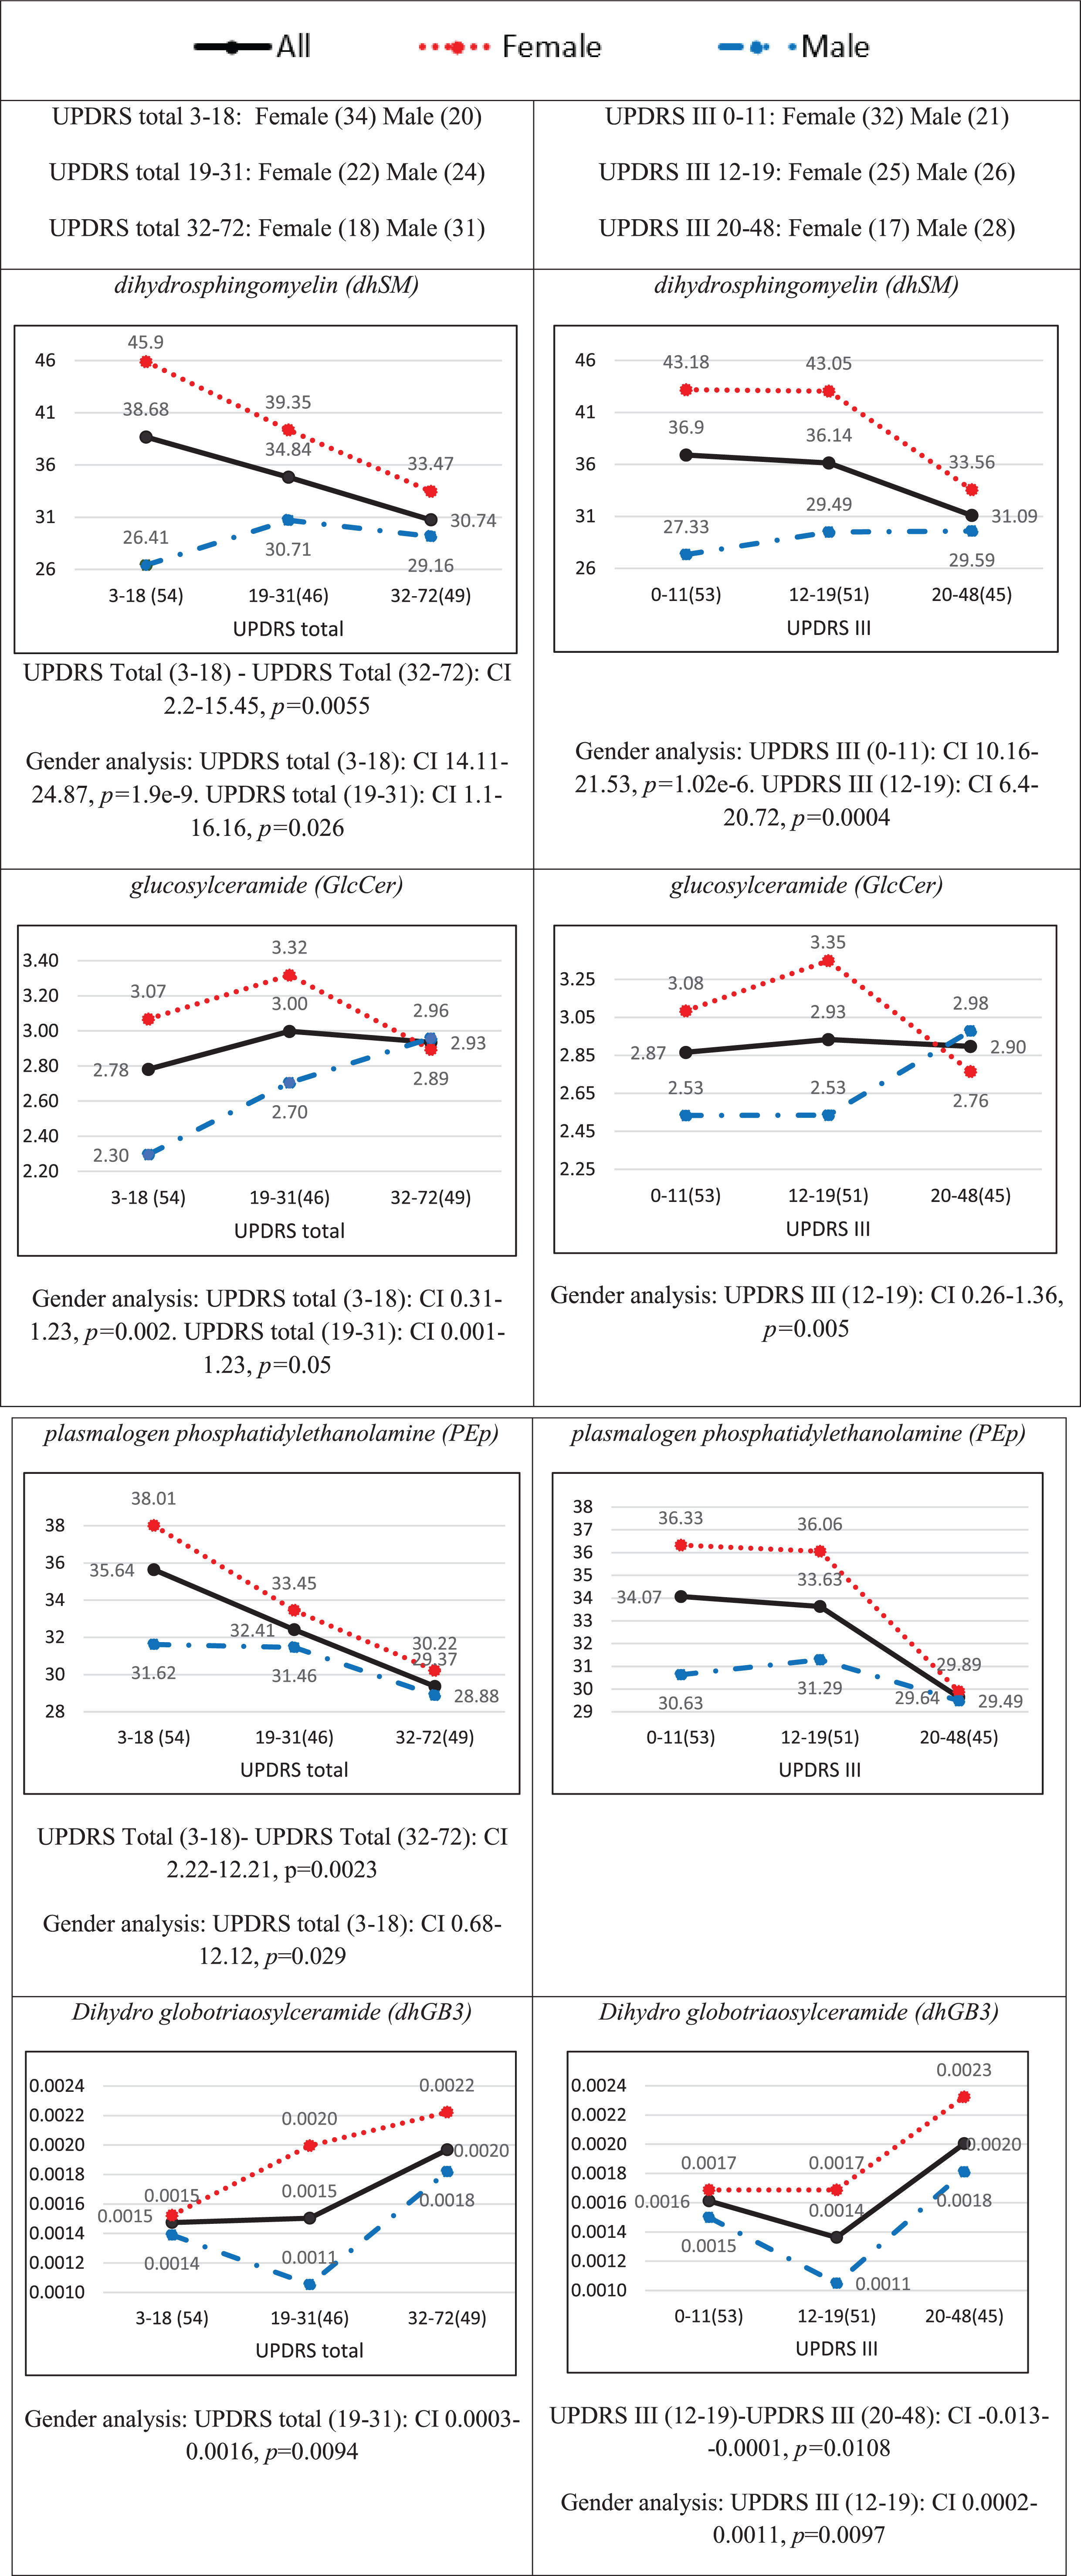
Average plasma concentrations (pmol/μl) for different ranges of the UPDRS total score (left) and UPDRS III score (right) for four contributory lipid classes common to UPDRS total and III scores (Table 3). Numbers in parentheses indicate numbers of observations (patients) in different ranges of severities. The black solid, red dotted, and blue broken lines represent all patients, female patients, and male patients, respectively. The distributions of females and males over UPDRS III and UPDRS total scores ranges are given at the top of the figure. The confidence interval (CI) results for multi comparisons between the severities are based on a post-hoc Tukey HSD test and those between females and males on a two-sample t-test [both CIs are presented below each plot only for statistically significant (p < 0.05) differences].
Figure 2A demonstrates differences between PD patients in three tertiles of their UPDRS III scores with respect to values of their lipid classes and demographics, showing distinct demographic-lipidomic signatures of patients with different disease severities in comparison with controls.
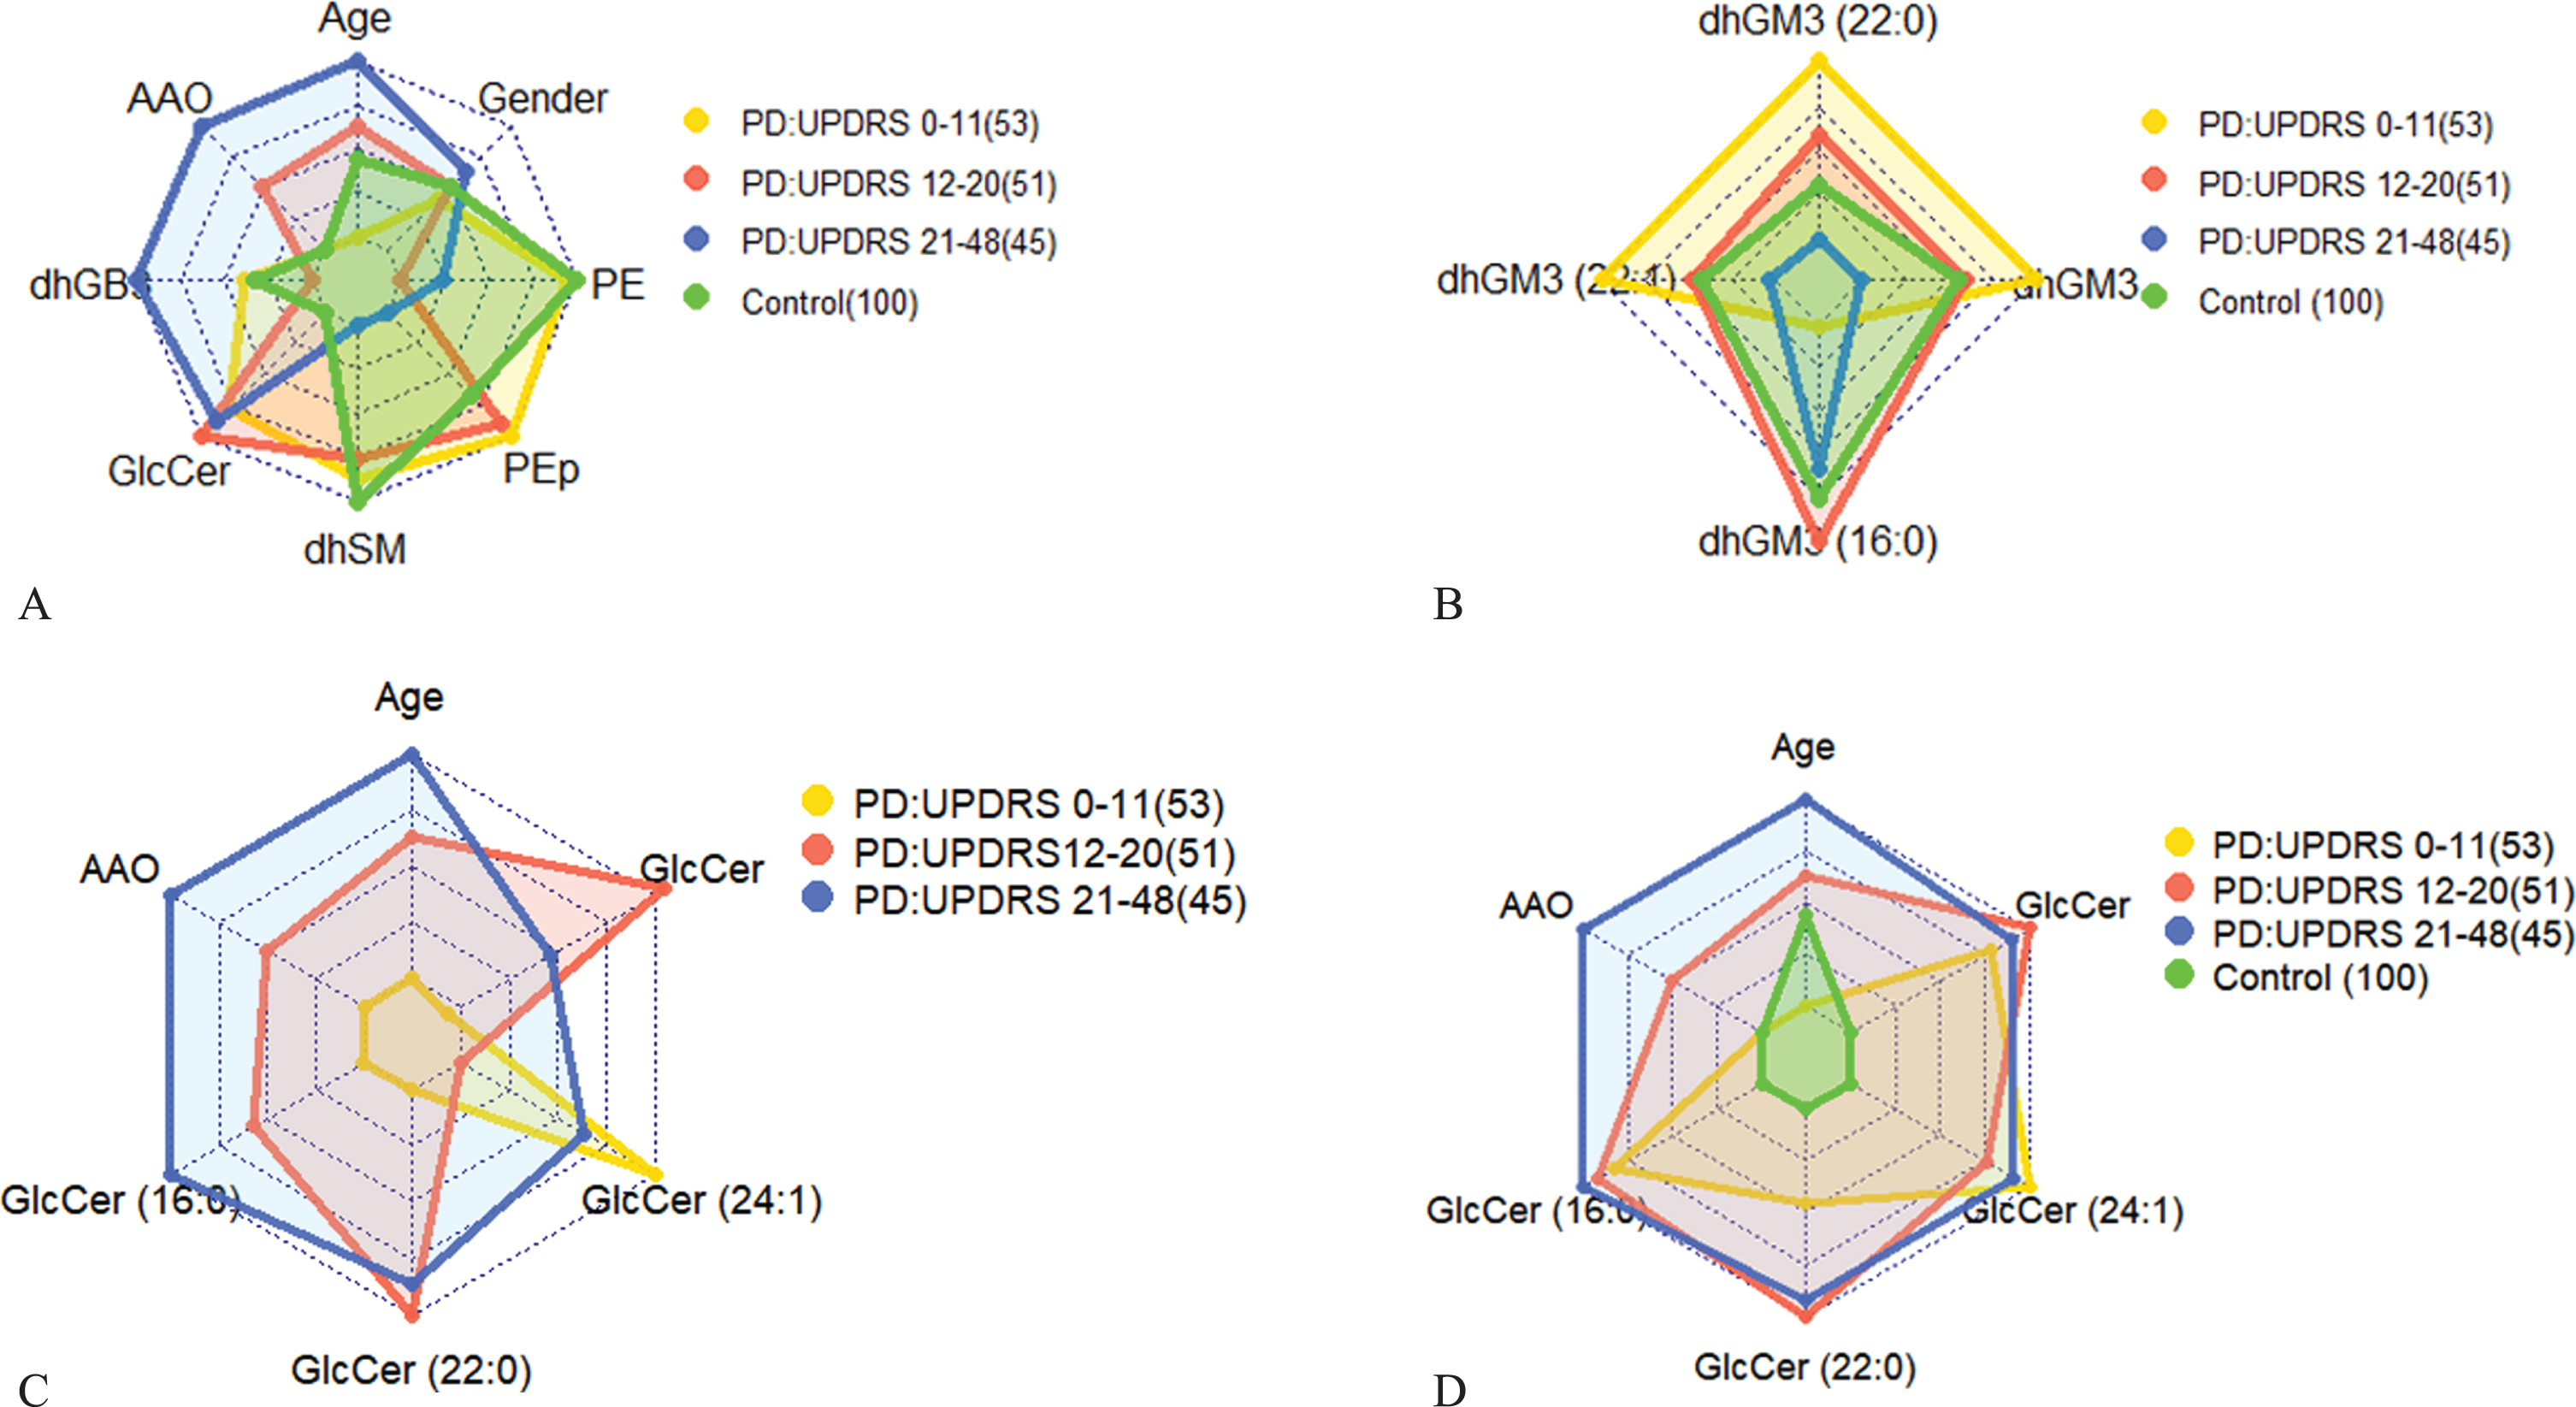
A) Radar plot representing UPDRS III scores and average values of the most contributing lipid classes (Table 3), age, AAO, and gender for three PD stages: early (low severity; yellow), intermediate (red), and late (high severity; blue) in comparison to control (green). The controls are 100 subjects genetically unrelated frequency-matched by gender and age (Avg. = 66.11 years, std. = 9.4) with average and std. BMI values of 25.7 and 4.4, respectively. AAO for the control was set to the value of the low severity. Numbers in parentheses indicate numbers of observations (patients). As we move along an axis from the center/origin of the outer polygon to any of its vertices, the corresponding variable increases its value, e.g., towards higher age, AAO, and lipid class concentrations (and for higher percentages of men than women for the gender variable). The figure demonstrates differences between PD patient groups in three tertiles of UPDRS III scores of 0–11 (lower tertile), 12–20 (middle tertile), and 21–48 (upper tertile) in comparison to control. Among the patients, early stage patients (lowest tertile), mostly women, are recognized by the lowest values of GlcCer (and, of course, of age and AAO values), with extreme values of dhSM, PEp, and PE; the latter value is extremely larger than those of the intermediate and late stage patients (and similar to that of control). Patients with intermediate UPDRS III scores (middle tertile) have dhSM and PEp values similar to those of early stage patients, but also the highest levels of GlcCer and lowest levels of dhGB3. The patients with the highest UPDRS III scores (upper tertile), as expected, are older and have higher AAO values, highest levels of dhGB3, intermediate levels of GlcCer, and PE, and the lowest values of PEp and dhSM. When considering also the control group, we notice two results: a) a perfect order of values from control to low, intermediate, and up to high severities for dhSM and almost perfect order for GlcCer and PE (the two highest severities swapped their order although are very similar in values), and b) for most lipid classes (except PEp and dhGB3), lipid levels of controls are at the extreme ends, i.e., having either the lowest or highest level. B) Similar to (A) for a combination of average (over the patients) values of dhGM3 and its most contributing species. The figure shows that patients in the lower UPDRS III score tertile have the highest values of dhGM3, dhGM3(22:0), and dhGM3(22:1) but the lowest values of dhGM3(16:0). The case is nearly opposite for patients in the highest UPDRS III score tertile, i.e., the lowest values of dhGM3, dhGM3(22:0), and dhGM3(22:1), and relatively high values of dhGM3(16:0). Interestingly, while the intermediate disease severity is characterized by intermediate values of dhGM3, dhGM3(22:0), and dhGM3(22:1), it is also characterized by the highest values of dhGM3(16:0). C) Similar to (A) for a combination of average (over the patients) values of GlcCer and its most contributing species together with age and AAO. The figure shows patients in the higher tertile of UPDRS III scores were older with later AAOs, but also had the highest values of GlcCer(16:0) and relatively high values of GlcCer and all of its other species. On the other hand, patients with the lowest UPDRS III scores are the youngest with the lowest AAO on average and have the lowest values of GlcCer and its species, except for GlcCer(24:1), where these patients have the highest plasma levels. D) The same as (C) including the control group for a reference (the small values of the control subjects changed the scale drastically so previous differences among PD severities were diminished), showing that none of the species of the GlcCer class is expressed in the control subjects, and thereby emphasizing the role of this lipid class in PD.
Finally, the results for the MoCA indicate four variables that had three or four supporting methods: age, education, disease duration, and PE. Age and disease duration were negatively correlated with the MoCA score, the older the patient or the longer the disease duration, the lower the score. Education was positively correlated with MoCA score; the more educated the patient, the higher the score. Note that the MoCA analysis is the sole place where education came up as contributable. PE has a strong monotonic negative impact on the MoCA score (data not presented).
Lipid species for prediction of disease severity
We started this analysis with 517 species and 8 demographical and clinical variables and then minimized this list using the feature selection ML methodology (described in the Material and Methods section), identifying the species that contributed the most for PD severity. This was implemented for UPDRS total and UPDRS III scores, as presented in Tables 4 and 5, respectively. As in the lipid class analysis, age and disease duration are highly ranked in predicting PD severity in the lipid species analysis of UPDRS total score (Table 4). Predictors of the UPDRS total score included 18 species from 11 classes, but the majority of the influential species (n = 15; 83%, Table 4) are from five classes: PEp (5), GB3 (3), dhSM (3), GlcCer (2), and dhGM3 (2). In addition to age and AAO that are influential on both UPDRS total and UPDRS III scores, half of the species (9/18) are influential on both scores (with the same directionality). Most of the classes (9/12) identified for UPDRS III in the first phase have representative species in Table 5. There are three species whose directions are not corresponding with those of their class directions. Two of them, PEp (42:7) and dhGM3(16:0), also appear influential on the UPDRS total score with no corresponding directions with their classes (Table 4).
Most contributing lipid species for UPDRS total score prediction
Lipid acronyms: Plasmalogen phosphatidylethanolamine (PEp), globotriaosylceramide (GB3), glucosylceramide, (GlcCer), dihydrosphingomyelin (dhSM), dihydro globotriaosylceramide (dhGB3), acyl phosphatidylglycerol (APG), dihydro GM3 ganglioside (dhGM3), phosphatidylglycerol (PG). Univariate linear regression (UR). Most contributing variables/species for prediction of UPDRS total score sorted in descending order of importance according to the RF. Most of the species have the same directionality as their classes based on the Lasso regression (unless the Lasso coefficient is zero; in these cases, we used Ridge regression to get the direction of impact), whereas italic font indicates they have different directionalities.
Most contributing lipid species for UPDRS III score prediction
Lipid acronyms: Dihydro globotriaosylceramide (dhGB3), lysophosphatidylinositol (LPI), phosphatidylethanolamine (PE), dihydro GM3 ganglioside (dhGM3), Plasmalogen phosphatidylethanolamine (PEp), glucosylceramide, (GlcCer), acyl phosphatidylglycerol (APG), dihydrosphingomyelin (dhSM), monoacylglycerol (MG). Univariate linear regression (UR). Most contributing variables/species for prediction of UPDRS III score sorted in descending order of importance according to the RF. Most of the species have the same directionality as their classes based on the Lasso regression (unless the Lasso coefficient is zero; in these cases we used Ridge regression to get the direction of impact), whereas italic font indicates they have different directionalities.
Average plasma concentrations of the cohort divided by tertiles based on the UPDRS III score are presented in Fig. 3 for most of the contributing lipid species in Table 5. In most of the cases [e.g., GlcCer(16:0), dhSM(20:0), dhGM3(22:0), and dhGM3(22:1)], the cohort concentration increases/decreases linearly with the disease severity, whereas in other cases [e.g., GlcCer(24:1) and dhGM3(16:0)], a point in an intermediate severity shows a change in the trend of the concentration. We believe this change point is responsible for the mismatch in directionality of impact between a species and its class, as was observed before [e.g., dhGM3(16:0) in Tables 4 and 5]. We also see a similar pattern to that of lipid classes (Fig. 1), where female patients usually have higher concentrations in the low and medium severities, but the difference to male patients usually vanishes for the highest UPDRS III scores. Similar to the lipid class analysis, we show in Figs. 2B-2D radar plots presenting distinct demographic-lipidomic signatures of patients with different disease severities in comparison with controls.
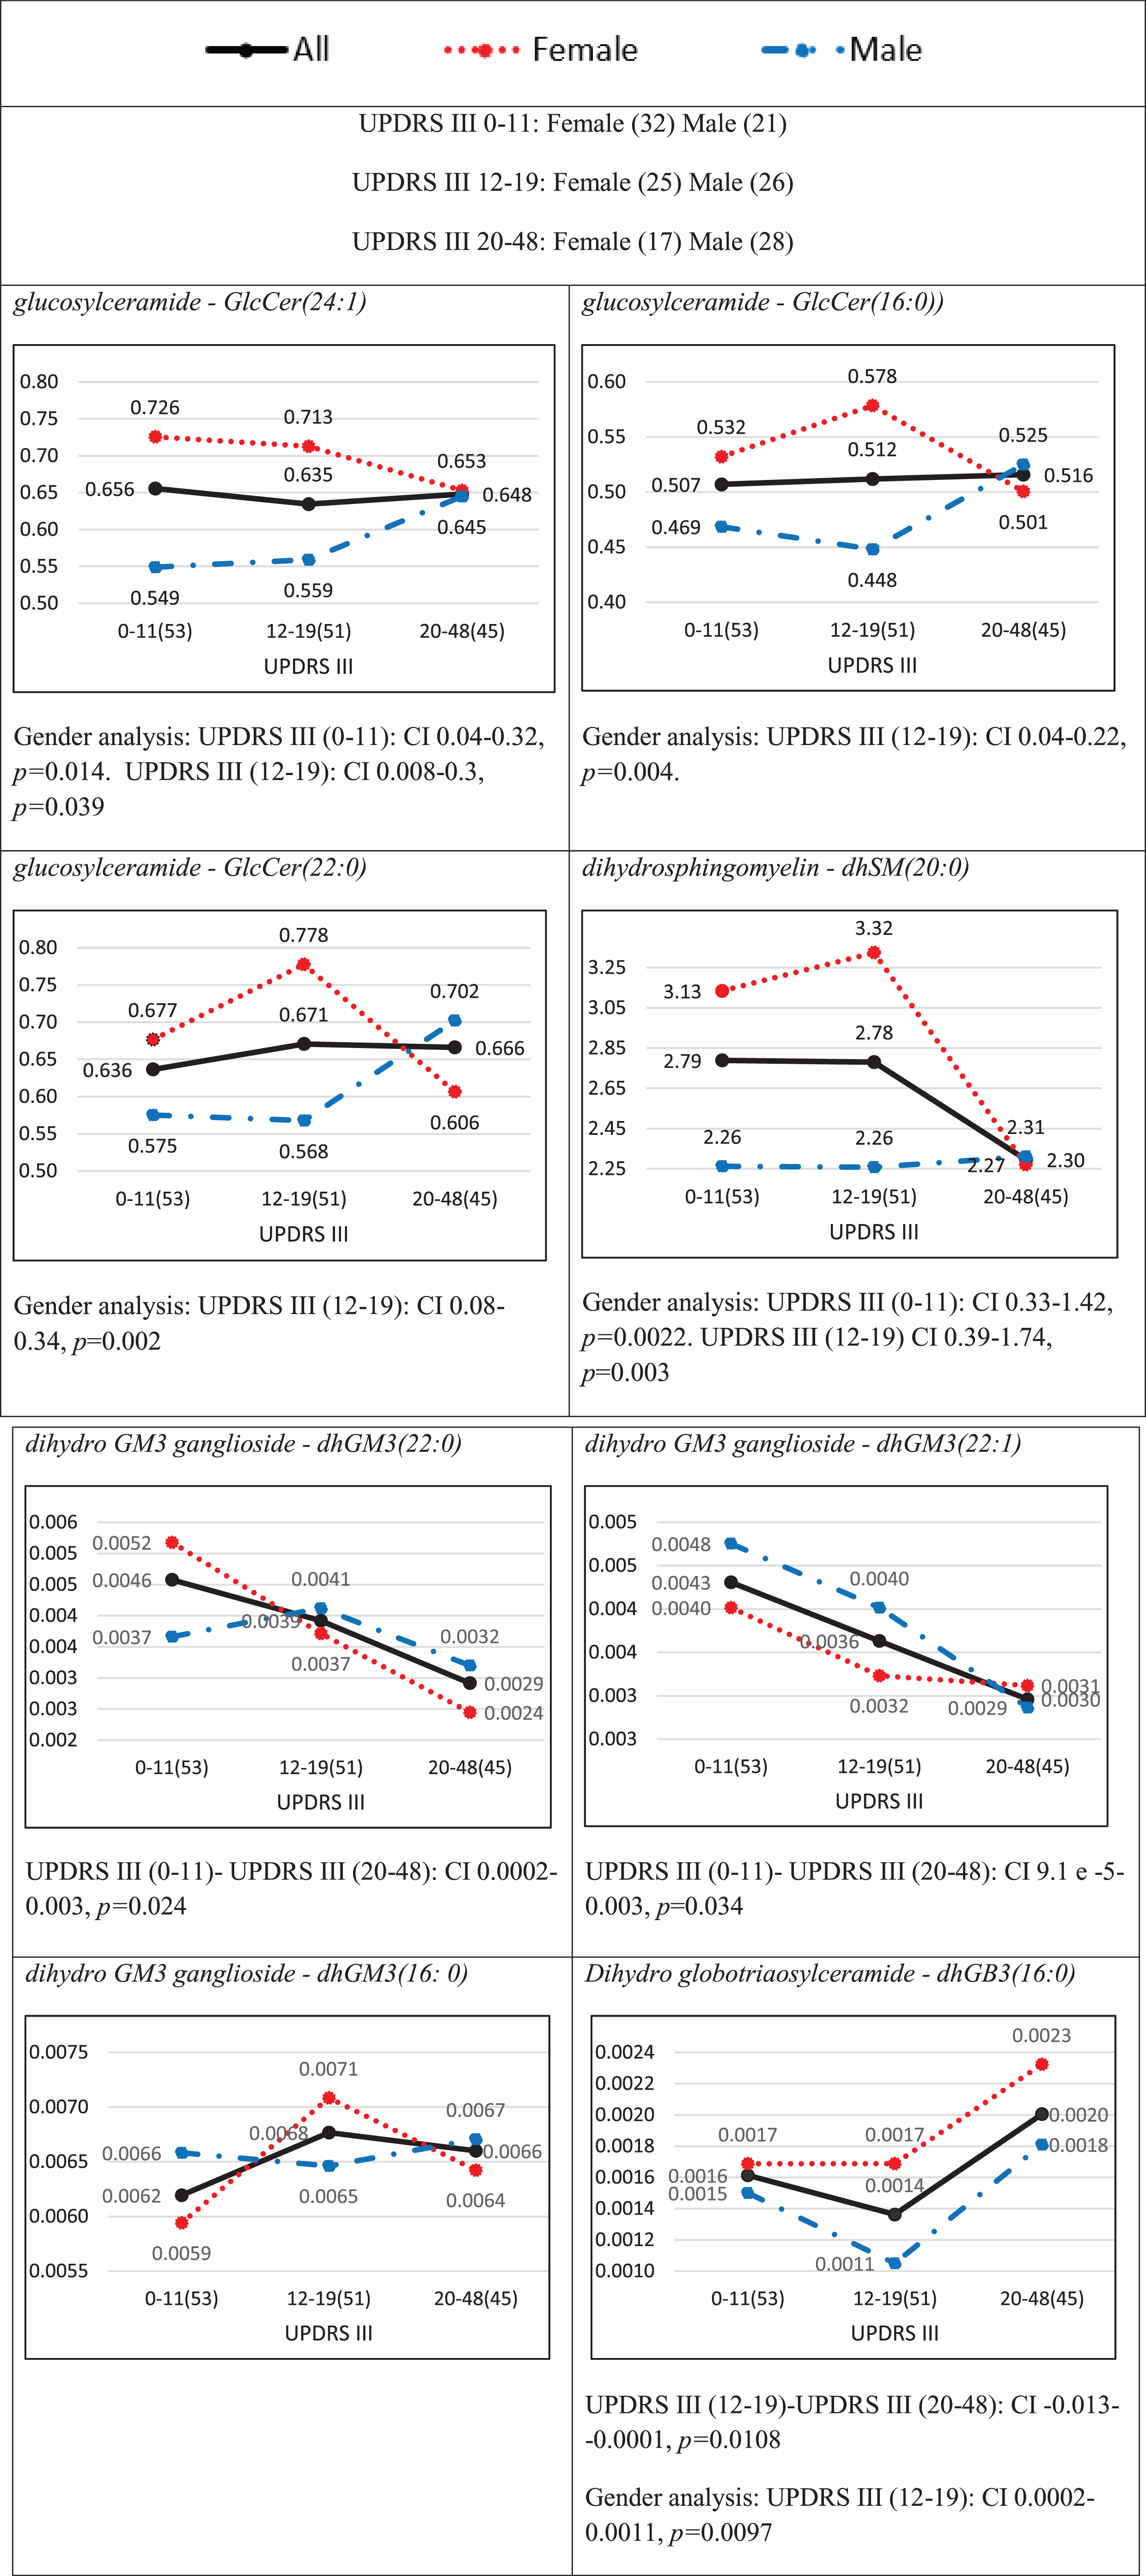
Average plasma concentrations (pmol/μl) for different ranges of the UPDRS III score for species that were identified among the eighteenth important ones (Table 4). Numbers in parentheses indicate numbers of observations (patients) in different ranges of severities. The black solid, red dotted, and blue broken lines represent all patients, female patients, and male patients, respectively. The distributions of females and males over UPDRS score ranges are given at the top of the figure. The CI results for the comparisons between the severities are based on a post hoc Tukey HSD test and those between females and males on a two-sample [both Cis t-test, are presented below each plot only for statistically significant (p < 0.05) differences.]. Note that dhGB3(16:0) is the only species in the dhGB3 class, what explains the identity between the corresponding figures here and in Fig. 1.
Prediction model accuracy for UPDRS III and UPDRS total scores as measured by the RMSE is presented in Fig. 4, with an average of 6.81 and 9.42, respectively. We see that our models are most accurate in predicting UPDRS III and UPDRS total scores in those 50% of the patients whose scores range between 9 and 22, with RMSE values of 2.85–5.72 and 4.48–7.56, respectively, and less accurate in those extreme scores (with UPDRS III score under 5 or over 27). As Supplementary Figure 2 shows, this difference in accuracy is because of few extreme prediction errors due to outliers and high variability in the patient data in the extreme severity ranges.
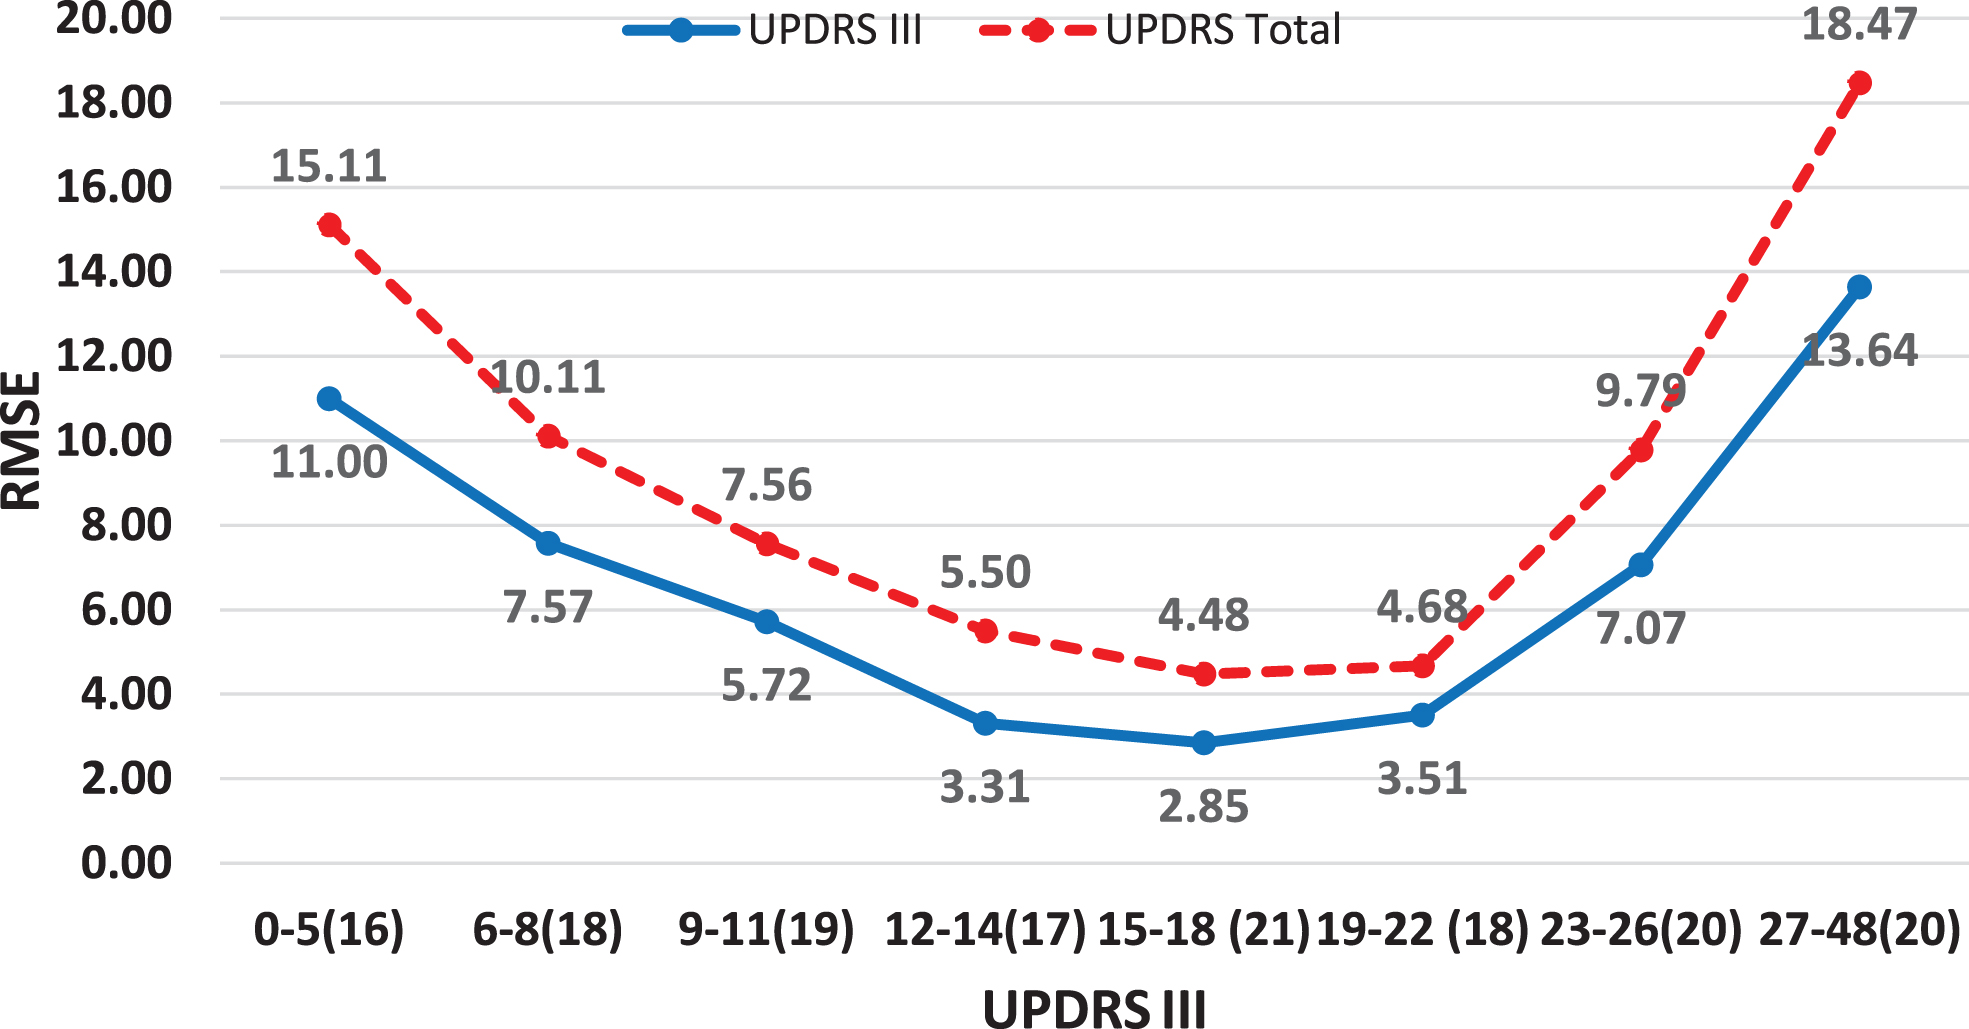
Average prediction RMSE values for UPDRS III and UDPRS total scores and relatively equally populated UPDRS III score ranges.
Supplementary Figures 3A and 3B show the result of excluding age, AAO, and disease duration (the variables and their interactions with the lipids) from the models, relying only on the prediction capability of the contributing lipid species (Tables 4 and 5). While excluding age and AAO (duration was not found contributory to prediction in Table 5 probably because it is a derivation of the former two) did not affect UPDRS III score (Supplementary Figure 3A; RMSE increase of only 3% –4% for all severities), our data show that the absence of these two variables together with duration increased the prediction error for UPDRS total score for most of the severities (Supplementary Figure 3B) between 26% and 198%. We believe that age, AAO, and disease duration mostly affect UPDRS II score (Activities of Daily Living) and especially UPDRS I score (Mentation, Behavior, and Mood) and to a lesser degree the motor examination in the test (UPDRS III score). Supplementary Table 1 shows ranked by RF values of variable importance (ordered by the Gini index) for UPDRS total and UPDRS III scores, reinforcing that age and duration (much more than AAO) contribute to more accurate prediction of UPDRS total score, whereas age and AAO are less influential compared to lipid species (and duration is not even ranked) for accurate prediction of UPDRS III score (compare Gini index values of these variables between UPDRS total and UPDRS III scores). However, the lowest (under 10) and highest (above 36) severities for UPDRS total score (Supplementary Figure 3B) show the opposite picture. The improvement in the average error while excluding age, AAO, and duration is explained by a skewed disease duration in the lowest range (the 25th and 48th percentiles are almost identical) and high variability of this variable in the highest range that together undermine the accuracy of the model that uses all variables.
DISCUSSION
In this current age where large databases (e.g., of omics data) are available for analysis, traditional statistical tools may not be sufficient to gain deep clinical understanding of interrelations within the data. Lipidomics data are a classical example of such an instance. First, lipids are inherently related to one another and assumptions of independence often made by statistical models may not be accurate. Second, as is the case of this study, the amount of data collected on each participant exceeds the number of participants (525 lipid species together with clinic and demographic variables vs. 149 participants), which further requires a careful variable selection procedure as we have applied here. Our contribution in this study is in: 1) providing an RF-based ensemble for PD severity prediction and statistically supported lipidome feature selection that is both accurate and informative; and 2) identifying severity-related lipid class and species signatures that can be used as age-gender-specific PD severity markers.
Our analysis showed several influential lipid classes, and, within each class, several lipid species that contribute to high PD severity prediction accuracy, especially in intermediate severities. This analysis also demonstrated interesting interrelations between lipid classes/species and different UPDRS score ranges representing different stages of the disease. We showed that different lipid classes/species are expressed in different disease stages. Although this result needs further validation, it may open new avenues of research in investigating the roles of the lipids in the progression of PD. A key finding is that plasma levels of four specific lipid classes may predict UPDRS performance of people with PD. Higher levels of GlcCer and dhGB3 are associated with worse performance, and higher levels of dhSM and PEp are associated with better (lower scores) UPDRS performance. Our models did not identify key associations with cognitive performance as measured by the MoCA.
Glucosylceramide is a main substrate of glucocerebrosidase, which is encoded by GBA. Carriers of GBA mutations with PD have faster motor and cognitive progression [41]. Studies have shown faster alpha synuclein aggregation in the presence of glucosylceramide [42]. Of note, our study participants were non-carriers of GBA mutations (with the exception of one), highlighting the potential role of glucosylceramide levels even among non-carriers. The association between higher glucosylceramide levels and more severe PD phenotype has been previously reported in a cohort of 52 PD cases (26 with normal cognition and 28 with impaired cognition) [43]. However, a similar association was not reported with motor functioning [43]. In summary, our findings of higher glucosylceramide levels predicting more severe motor phenotype are consistent with the literature and support the consideration of this lipid class as a drug target.
GB3 is a globoside that contains glucosylceramide as its base cerebroside. This glycosphingolipid and its analogs [44] are the primary lipids accumulated in Fabry disease, a lysosomal storage disease. In Fabry disease, the accumulation of GB3 and its analogs is due to the deficiency of the enzyme α-galactosidase A [45]. We have previously shown that reduced α-galactosidase A is associated with PD status [46], and that there may be a higher incidence of PD among Fabry disease patients [47]. The cause of the elevations in these specific dehydrosphingolipids is unknown.
dhSM is one of the few phospholipids not synthetized from glycerol. In our data, dhSM levels are higher among those with lower UPDRS scores. This finding correlates with observations in Alzheimer’s disease (AD), where it is believed that high levels of SM and dhSM are protective, and lower levels of SM and dhSM are observed in AD patients [48]. The mechanism behind lower dhSM levels and AD or PD progression is unknown. Reduced levels may be the result of an increased rate of ganglioside biosynthesis and a reduction in the pool dihydro ceramides for the synthesis of dhSM. dhCer is the precursor of dhSM (as Cer is for SM). All four sphingolipids are enriched in the brain and are major components of neuronal membranes. Alterations of these sphingolipids have been reported in AD and PD [48–54]. In particular, decrease of SM has been observed in samples from PD patients [55–57].
PE and PEp are also phospholipids. PEp is a plasmalogen phospholipid almost identical to PE, other than the vinyl-ethyl bond in place of the ether bond. The presence of vinyl-ether bonds confers plasmalogens with specific biophysical properties that differ from non-plasmalogen phospholipids [58] such as an increase in the saturation of cellular membranes.
Plasmalogens are highly abundant in the nervous system. The physiological relevance of alterations in plasmalogen synthesis is underscored by disorders such as Zellweger syndrome or chondrodysplasia [59]. While the link between elevation in PEp and better performance on motor examination is unknown, we note that elevations in the synthesis and levels of plasmalogens have been associated with reductions in the biosynthesis of non-plasmalogen glycerophospholipids. Two independent studies in different models linked lower PE levels with PD, supporting this hypothesis. In the first study, cellular and animal models of familial PD that carried pathogenic mutations in SNCA showed significant reduction in PE synthesis [60]. Likewise, Chan et al., 2017 showed reduced levels of PE in plasma samples from male idiopathic Parkinson’s disease (iPD) patients compared to controls [4]. Additionally, Riekkinen et al., 1975 found significant reductions in the levels of PE in the substantia nigra [61]. The relatively high abundance of PEp makes this phospholipid an ideal biomarker candidate since it is easy to detect by regular and consistent lipidomics analysis.
Strengths and limitations
One strength of our study is the novel machine-learning technologies applied to the data. These offer a solid prediction framework around the RF by: 1) designing a careful, statistically-supported training-validation-test ML methodology; 2) initially applying the classifier to select lipid classes (and demographics) that contributed to the smallest prediction error; 3) repeating this application with only highly ranked classes (and demographics) to select the most contributing lipid species; 4) validating and reinforcing this selection using statistical methods; and 5) profiling gender-age lipid signatures in relation to PD severity, establishing lipid-based markers of disease progression.
A second strength of the study is the extensive unbiased lipidomic analysis we applied using our ML methodology to validate our findings. The cohort is carefully phenotyped, and SNCA, GBA (with the exception of one), and LRRK2 mutation carriers were not included. The main limitation of the study is that the participants did not fast at time of the blood extraction. Fasting status could affect the levels of blood sphingolipids [62]. Therefore, ideally, our findings should be confirmed in larger studies, ideally including fasting participants with longitudinal data points, like in the Parkinson’s Progression Markers Initiative (PPMI) study.
In conclusion, we demonstrated lipid signatures for motor disease severity in PD. The links between PD status, disease severity, and lipidomics require further investigation, but we believe ML adds an extra tool that improves the level of interpretation for large and interconnected lipidomics data.
Footnotes
ACKNOWLEDGMENTS
Hila Avisar was supported by the Ben-Gurion University High-tech, Bio-tech, Chem-tech–STEM Fellowship. The lipidomic analysis was funded by the Parkinson’s Foundation and the NIH (K0NS080915).
CONFLICT OF INTEREST
The authors have no conflict of interest to report.