
Abstract
Background:
Mild cognitive impairment (MCI) in Parkinson’s disease (PD) is considered a risk factor for PD with dementia (PDD). Verbal fluency tasks are widely used to assess executive function in PDD. However, in cases of PD with MCI (PD-MCI), the relative diagnostic accuracy of different qualitative verbal fluency measures and their related neural mechanisms remain unknown.
Objective:
This study aimed to investigate the relative diagnostic accuracy of qualitative (clustering and switching) verbal fluency strategies and their correlates with functional imaging in PD-MCI.
Methods:
Forty-five patients with PD (26 with MCI and 19 without MCI) and 25 healthy controls underwent comprehensive neurocognitive testing and resting-state functional magnetic resonance imaging. MCI in patients with PD was diagnosed according to established clinical criteria. The diagnostic accuracy of verbal fluency measures was determined via receiver operating characteristic analysis. Changes in brain functional connectivity between groups and across clinical measures were assessed using seed-to-voxel analyses.
Results:
Patients with PD-MCI generated fewer words and switched less frequently in semantic and phonemic fluency tasks compared to other groups. Switching in semantic fluency showed high diagnostic accuracy for PD-MCI and was associated with reduced functional connectivity in the salience network.
Conclusion:
Our results indicate that reduced switching in semantic fluency tasks is a sensitive and specific marker for PD-MCI. Qualitative verbal fluency deficits and salience network dysfunction represent early clinical changes observed in PD-MCI.
Keywords
INTRODUCTION
Parkinson’s disease (PD) is a neurodegenerative disease mainly characterized by progressive movement symptoms such as bradykinesia, rigidity, and tremor. Cognitive dysfunction is an increasingly recognized feature of PD, with severity ranging from mild cognitive impairment (PD-MCI) to dementia (Parkinson’s disease with dementia: PDD) [1]. Approximately 25% of patients with PD show some degree of cognitive impairment early in the disease course, and up to 80% develop dementia within 20 years after motor symptom onset [2, 3]. Importantly, PD-MCI is a major risk factor for the development of PDD [4–6]. As such, the development of sensitive cognitive screening tests to detect PD-MCI will be key to facilitate early management and interventions.
Cognitive impairments in PD span different domains, including attention, memory, language, executive function, and visuospatial skills [7]. Increasing evidence has revealed that verbal fluency deficits are frequently seen in PD [8–11]. Verbal fluency tasks (VFTs) are widely used to assess executive function, semantic memory, and verbal skills. These tasks require participants to produce as many words as possible in a given time, usually from a particular semantic category or beginning with a given letter. The total number of words produced is the standard quantitative measure of verbal fluency. Semantic and phonemic VFTs represent different cognitive functions, such as semantic memory and executive function, respectively. Lesion analyses in stroke and neuroimaging studies in healthy subjects have associated semantic fluency scores with the temporal lobe, and phonemic fluency scores with the frontal lobe [12–14].
Previous quantitative analyses have shown that patients with PDD generate fewer words in semantic and phonemic VFTs than patients without dementia [9, 15]. More recently, research has increasingly focused on qualitative VFTs, examining “switching” and “cluster size” as alternative clinical measures to assess more specific cognitive functions such as word search and retrieval [16–20]. Switching corresponds to the ability to change from one semantic category to another while attempting to generate new words, and is suggested to be associated with frontal lobe functions [21, 22]. On the other hand, “cluster size” corresponds to the ability to generate words within the same semantic category, and is suggested to be associated with temporal lobe functions [22–24]. Importantly, recent studies have shown that switching and clustering measures discriminate between patients with PD with and without dementia, whereas in quantitative analysis the total number of produced words does not [25, 26].
To date, however, only one study has examined qualitative VFT measures in PD-MCI, showing that patients with PD-MCI switched less frequently than both normal controls and patients with PD with normal cognition (PD-NC) [27]. In addition, the neural substrates underpinning changes in switching and cluster size in PD-MCI remain to be established. Resting-state functional MRI (rs-fMRI) is a neuroimaging technique that is widely used to measure functional connectivity of brain networks and explore the disruptions of neural connectivity in neurodegenerative diseases. Numerous rs-fMRI studies have reported associations of abnormal brain connectivity with cognitive dysfunctions in PD, including PD-MCI. Specifically, the default mode network (DMN), dorsal attention network (DAN), and salience network (SN) have been shown to be disrupted in disorders involving executive function [28–33].
Here, we aimed to examine the diagnostic accuracy and functional imaging correlates of clustering and switching measures of VFTs in patients with PD with and without MCI. We hypothesized that (1) patients with PD-MCI would show poorer performance on qualitative VFT measures than patients with PD-NC, and (2) changes in qualitative VFT measures would be associated with alterations in neural networks underpinning executive functions.
MATERIALS AND METHODS
Participants and neuropsychological testing
Forty-five patients with idiopathic PD and 25 healthy controls (HCs) participated in the study. All patients, recruited from the Yokohama City University Hospital between January 2014 and March 2017, met the clinical diagnostic criteria for PD according to the UK Parkinson’s Disease Society Brain Bank [34]. HCs were recruited from the local community or were family members of enrolled patients with PD with similar age and educational background. All HCs were confirmed to have a Mini-Mental State Examination (MMSE) score of 27 or greater (Supplementary Table 1) [35]. All participants underwent neurological/neuropsychological evaluation and MRI. The exclusion criteria for all patients were as follows: 1) presence of dementia or severe cognitive impairment (MMSE scores below 24), 2) history of major depression, stroke, or head injury with loss of consciousness, and 3) auditory or visual disorders limiting neuropsychological testing. The severity of PD was evaluated using the Hoehn & Yahr scale [36] and the Unified Parkinson’s disease rating scale (UPDRS) [37]. For patients taking anti-parkinsonian medication, the L-dopa equivalent daily dose was calculated by the established formula [38], and all assessments were performed with the patients in their “on” state.
Patients and HC were assessed with the same neuropsychological battery of tests. Global cognition was assessed using the MMSE and the Montreal Cognitive Assessment (MoCA) [39, 40]. General attention was measured by the Digit Span Forward. Working memory was evaluated with the Trail Making Test (TMT) part A [41] and the Stroop color-word test part III [42]. Executive function was assessed using the TMT part B and the Digit Span Backward. The logical memory subtest from the Wechsler Memory Scale Revised (WMS-R) [43, 44] and the Rey-Osterrieth Complex Figure Test (ROCFT) 3-min delayed copy were used for memory assessment [45]. Language was assessed using the 30-item version of the Boston Naming Test (BNT) [46] and the Similarities subtest of the Wechsler Adult Intelligence Scale 3rd edition (WAIS-III) [47, 48]. Visuospatial functions were evaluated by the ROCFT immediate copy and the Judgment of Line Orientation Test [49]. The Geriatric Depression Scale-Short Form [50, 51] and Apathy Scale [52, 53] were applied to assess neuropsychiatric functions.
PD patients were divided into two groups: PD-MCI and PD-NC. The PD-MCI criteria proposed by the Movement Disorder Society (MDS) taskforce were applied for the diagnosis of PD-MCI [7, 54]. The Z-score for each neuropsychological test was calculated from the HC group’s mean score and standard deviations. Patients were diagnosed with PD-MCI if the Z-score of a test was 1.5 standard deviations below the average Z-score of HC in at least two tests in one cognitive domain, or in one test in at least two domains.
Permission for the study was obtained from the local research ethical committee at Yokohama City University, and all participants gave their informed consent and participated voluntarily.
Qualitative analysis of verbal fluency tasks and receiver operating characteristic (ROC) analysis
Verbal fluency was assessed with semantic and phonemic fluency tests. In the semantic fluency test, participants were instructed to generate as many different animal names as possible in 1 min. In the phonemic fluency test, participants were instructed to generate as many words as possible beginning with the letter “ ” (pronounced as /ka/). In accordance with Troyer et al. [18], qualitative analysis was applied to calculate three scores from each verbal fluency test: total words, mean cluster size, and number of switches. For the semantic fluency test, clusters were defined as groups of successively generated words that belong to the same subcategory, such as pets, farm animals, forest animals, birds, and fish. For the phonemic fluency test, clusters were defined as groups of successively generated words that shared the first two letters, and that differed only by a vowel sound, that rhymed, or that were homonyms. Cluster size was counted from the second word in each cluster and the mean cluster size was calculated for each fluency test. Numbers of switches were calculated by counting transitions between clusters.
Normality was checked for scores from all neuropsychological tests, including the verbal fluency test, and intergroup comparisons using one-way analysis of variance with post-hoc Tukey’s honestly significant difference test or the Kruskal-Wallis test and post-hoc Mann-Whitney U test with Bonferroni correction where appropriate. The Mann-Whitney U test was used to compare L-dopa equivalent daily doses between the PD-MCI and PD-NC groups. Categorical variables (e.g., sex) were analyzed using chi-square with residuals test. A probability value < 0.05 was considered statistically significant. Further, to determine the diagnostic accuracy of each neuropsychological test for discriminating PD-MCI from PD-NC, ROC curve analysis was performed. For each neuropsychological test, the area under the curve (AUC) was calculated and the effective cut-off level was determined based on Youden’s index [55]. All analyses were performed using SPSS Statistics, version 22.0 (SPSS Inc.).
MRI analyses
All imaging data were acquired on a 3.0-Tesla GE Discovery MR750w system. The functional images were obtained by single-shot, gradient-echo EPI with the following parameters: TR = 2000 ms, TE = 30 ms, flip angle = 90°, field of view = 256×256 mm, acquisition matrix = 64×64 mm, 4 mm slide thickness, voxel size = 4×4×4 mm, and 35 axial slices. Two hundred volumes were acquired over 6 minutes with the eyes closed. Three-dimensional T1-weighted images were obtained by a gradient-echo sequence with the following parameters: TR = 7.508 ms, TE =2.744 ms, flip angle = 15°, field of view = 256×256×166 mm, acquisition matrix = 256×256 mm, and 1 mm slide thickness.
Image preprocessing and rs-fMRI data analyses were conducted with SPM12 software (http://www.fil.ion.ucl.ac.uk/spm/) with the Functional Connectivity (CONN) toolbox 17.f (http://www.nitrc.org/projects/conn). Functional image realignment, slice-time correction, outlier detection, segmentation of grey/white matter/cerebrospinal fluid, normalization to Montreal Neurological Institute (MNI) coordinates, and spatial smoothing with a 6 mm FWHM Gaussian kernel were performed through the CONN default preprocess pipeline. White matter signals, cerebrospinal fluid signals, and motion parameters were regressed from the functional data. To reduce signal noise from physical movements, images were processed with a band-pass filter of 0.008–0.09 Hz. The 3D T1-weighted images were preprocessed by segmentation of grey/white matter/cerebrospinal fluid, spatial normalization by DARTEL templates, normalization to MNI space and spatial smoothing with an 8 mm FWHM Gaussian kernel.
To investigate the neural networks differentiating PD-MCI from PD-NC, we performed seed-to-voxel analysis. In the first-level analysis, CONN produced a seed-to-voxel correlation map for each subject based on the temporal low-frequency fluctuation of the BOLD signal. Specifically, Pearson’s correlation coefficients were computed between the time course of a certain seed and the time course of all other voxels. Correlation coefficients were converted to Fisher-transformed Z-scores for subsequent general linear model analyses. All seed-to-voxel correlation maps from each subject were then entered into a second-level general linear model to compare the functional connectivity patterns of certain target seeds between PD-MCI and PD-NC. As previously reported, our target networks were DMN, SN, and DAN. CONN includes predefined MNI coordinates for seeds of these networks: four seeds for DMN, seven for SN, and four for DAN. For all 15 seeds, connectivity patterns of the PD-MCI and PD-NC groups were compared using analysis of covariance, with sex, age, and UPDRS part III scores as covariates. The initial uncorrected peak voxel threshold was set to p < 0.00006 (0.001/15) to control for 15 comparisons. Clusters were considered significant when the cluster’s family-wise error-corrected p-level was less than 0.05, based on random field theory [56].
For any connectivity pattern that differed between PD-MCI and PD-NC, connectivity values were exported from CONN to SPSS. To identify the relationship between functional connectivity and verbal fluency, Pearson’s partial correlation analysis was performed for connectivity values and each verbal fluency score; models included sex, age, years of education, UPDRS part III score, and MoCA score as nuisance covariates. The significance threshold was set at p < 0.05. For continuous variables, normality was checked using the Shapiro-Wilk test.
RESULTS
Demographic data and neuropsychological tests
Table 1 illustrates the demographic data of 45 patients with PD and 25 HC. Twenty-six patients with PD met the PD-MCI criteria, showing significantly lower MMSE and MoCA scores than the 19 patients with PD-NC and 25 HC. The PD-MCI group was significantly older and included more males than the other groups (p = 0.046 and p = 0.040, respectively).
Clinical and demographic data of controls and patients
HC, Healthy controls; PD, Parkinson’s disease; PD-NC, Parkinson’s disease with normal cognition; PD-MCI, Parkinson’s disease with mild cognitive impairment; MMSE, Mini-Mental State Examination; MoCA, The Montreal Cognitive Assessment; H & Y, Hoehn & Yahr scale; UPDRS-ME, Unified Parkinson’s Disease Rating Scale part- Motor Examination; LEDD, L-dopa equivalent daily dose. ††The PD-MCI group had a higher proportion of males than the other groups. aOne-way analysis of variance. bChi-square test. cKruskal-Wallis test. dStudent’s t-test. eMann-Whitney U test.
Regarding verbal fluency scores, patients with PD-MCI scored poorly compared to PD-NC in semantic fluency total words (p < 0.001), semantic fluency number of switches (p < 0.001), phonemic fluency total words (p = 0.003), and phonemic fluency number of switches (p = 0.016), whereas there were no statistically significant differences between HC and PD-NC (Table 2).
Verbal fluency test scores of controls and patients
HC, Healthy controls; PD-NC, Parkinson’s disease with normal cognition; PD-MCI, Parkinson’s disease with mild cognitive impairment. aOne-way analysis of variance. bKruskal-Wallis test.
Supplementary Table 2 summarizes the results of all neuropsychological tests. There were no statistically significant differences between HC and PD-NC. Between patient groups, patients with PD-MCI scored poorly compared to PD-NC on all cognitive domains tested except for neuropsychiatric functions.
ROC analyses
Table 3 shows the diagnostic values of qualitative and quantitative VFT scores and neuropsychological tests to differentiate PD-MCI from PD-NC with significant AUC values (> 0.7). MoCA showed the largest AUC (AUC = 0.919, sensitivity 93%, specificity 71%), followed by number of switches in semantic fluency (AUC = 0.851, sensitivity 87%, specificity 62%). The mean cluster size of both semantic and phonemic fluency showed no significance in differentiating PD-MCI from PD-NC. ROC curves of quantitative and qualitative VFT scores, MoCA, and MMSE are shown in Fig. 1.
Diagnostic value of neuropsychological tests determined by receiver operating characteristic analysis
AUC, Area under curve; MoCA, The Montreal Cognitive Assessment; WAIS-III, Wechsler Adult Intelligence Scale 3rd edition; WMS-R, Wechsler Memory Scale Revised; TMT, Trail Making Test; MMSE, Mini-Mental State Examination; ROCFT, Rey-Osterrieth Complex Figure Test.
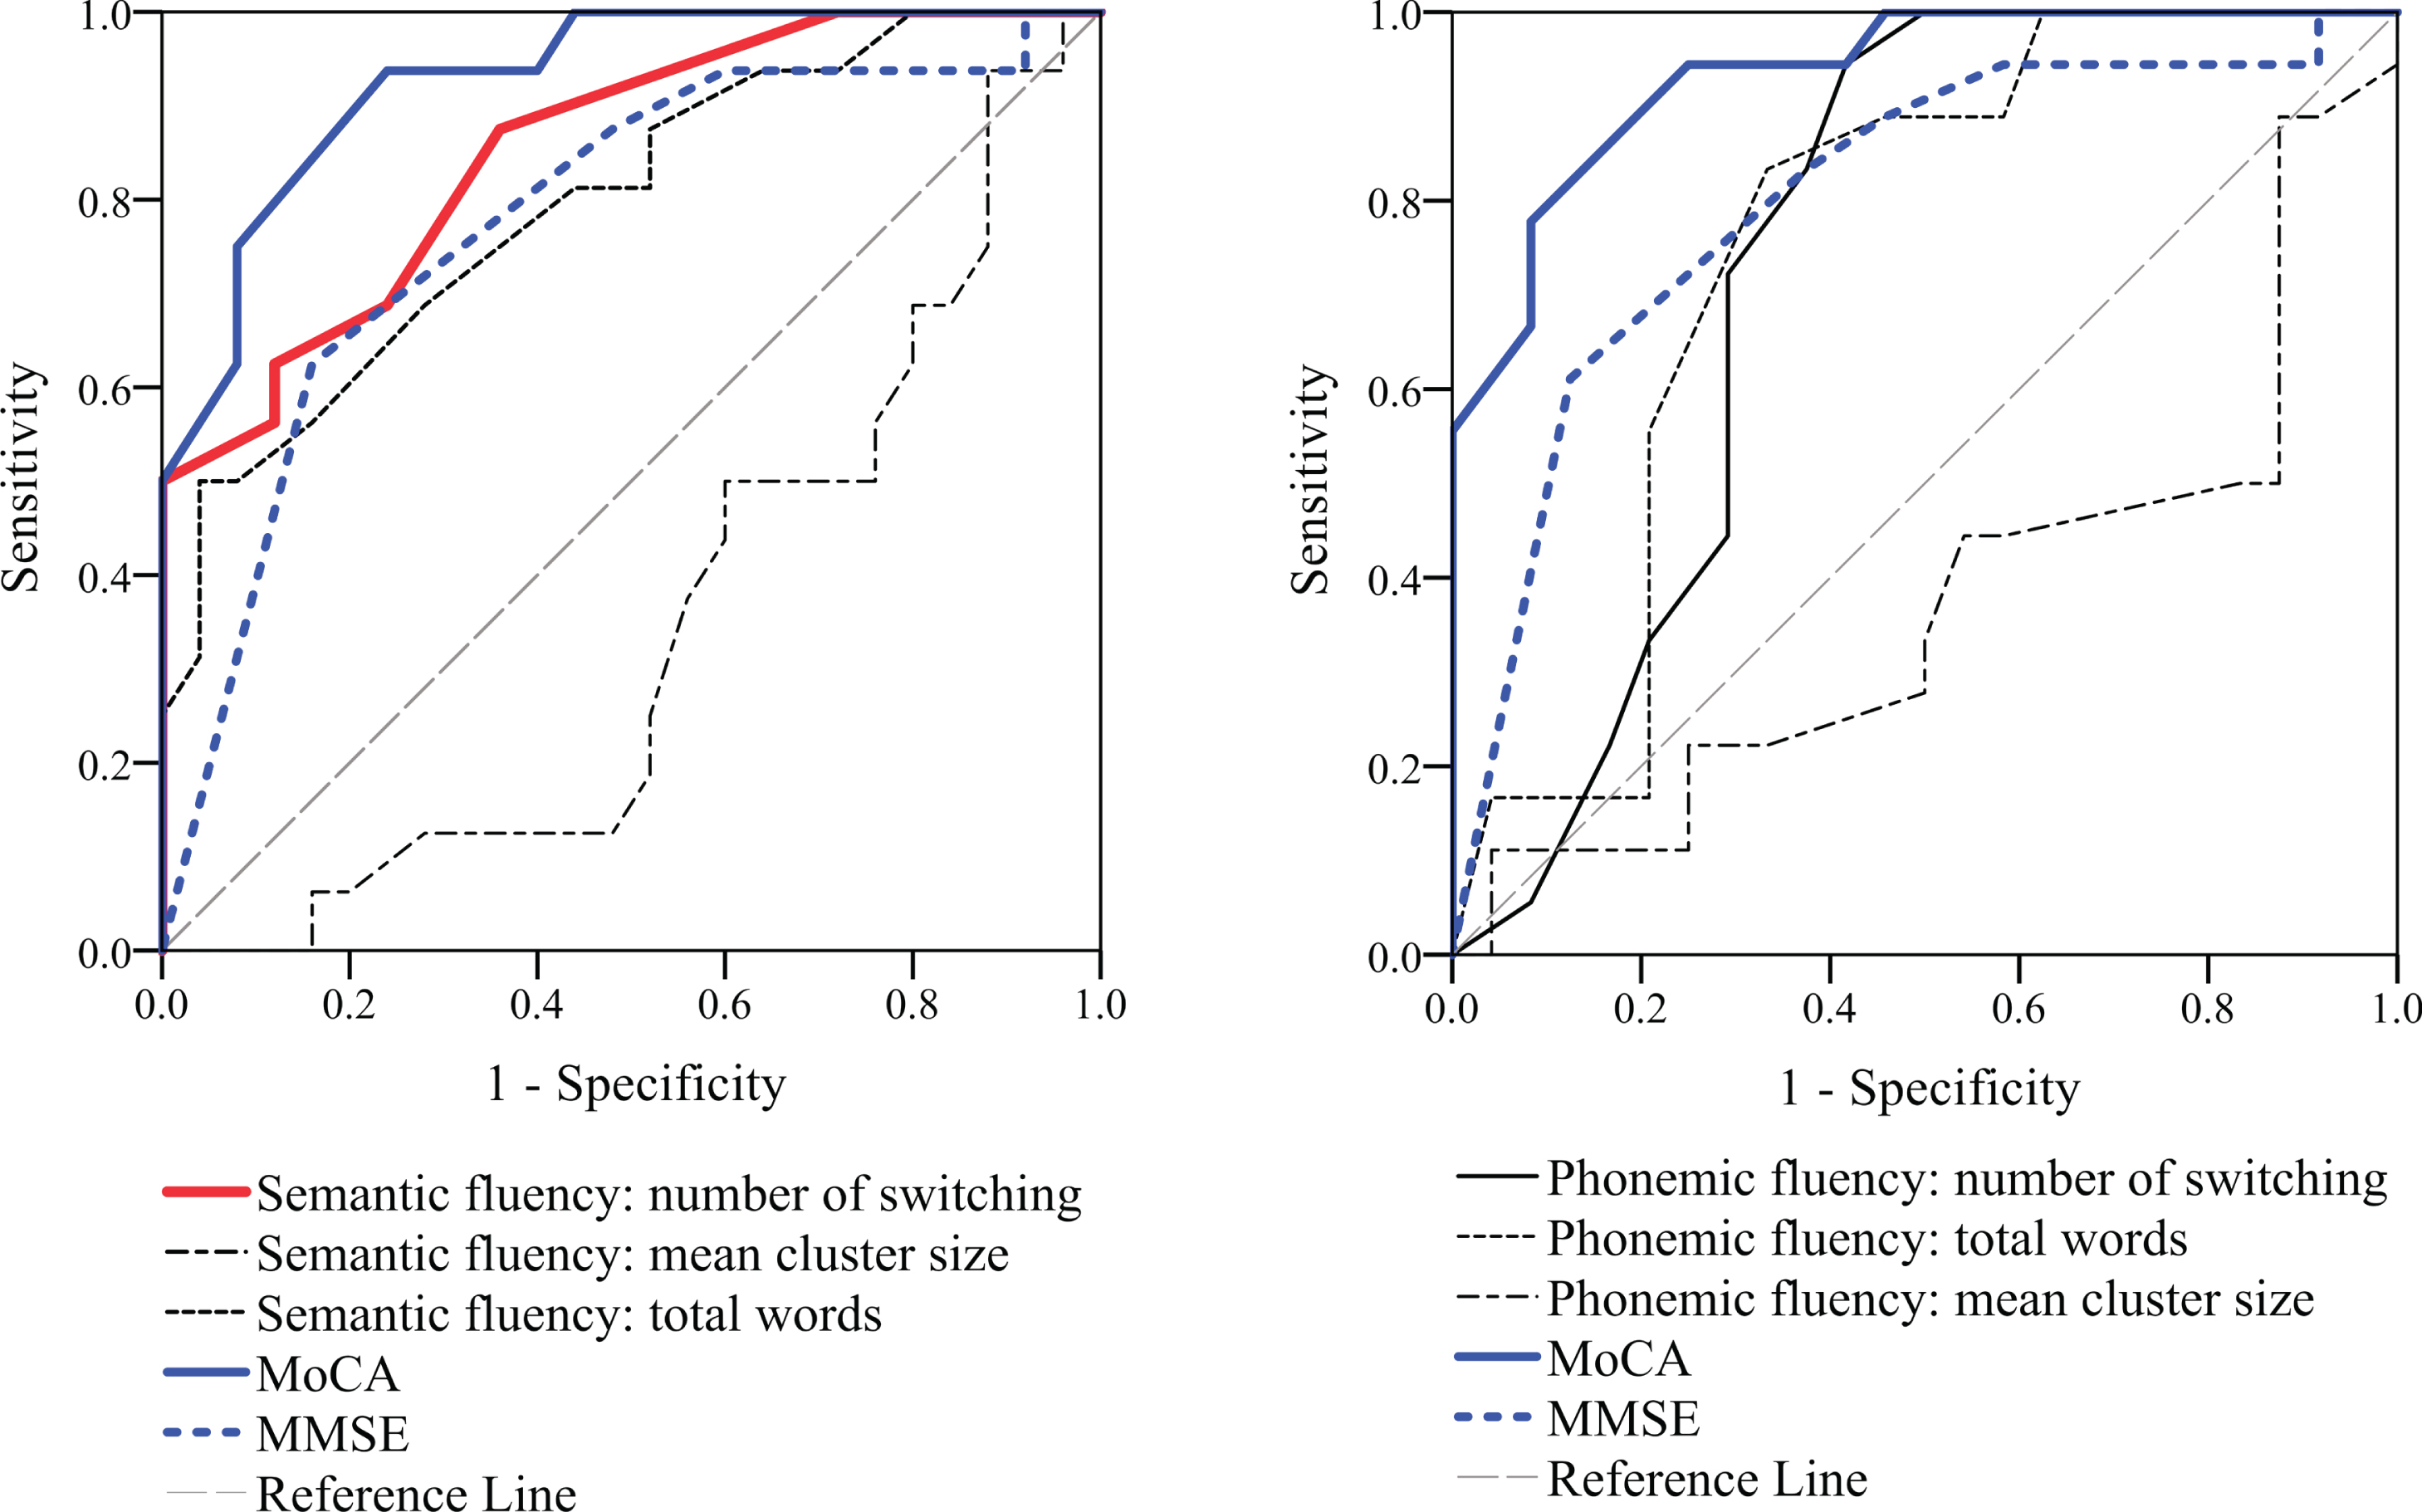
Receiver operating characteristic analysis to differentiate Parkinson’s disease with mild cognitive impairment from Parkinson’s disease with normal cognition. A) Quantitative and qualitative results of semantic verbal fluency test and general screening tests. B) Quantitative and qualitative results of phonemic verbal fluency tests and general screening tests. The number of switches in the semantic fluency test showed the second largest area under the curve. MoCA, The Montreal Cognitive Assessment; MMSE, Mini-Mental State Examination
Resting-state functional MRI data analysis
Eight participants (2 HCs, 3 patients with PD-NC, and 3 patients with PD-MCI) were excluded from rs-fMRI analysis due to incomplete MRI imaging sequences or motion artifacts. A total of 62 participants were analyzed. Compared to the PD-NC group, the PD-MCI group showed significantly reduced connectivity in three of the 15 seeds analyzed: the right rostral prefrontal cortex (RPFC) seed of the SN with the right superior parietal lobule (SPL), the left supramarginal gyrus (SMG) seed of the SN with the right posterior cingulate gyrus (CG), and the right intraparietal sulcus (IPS) seed of the DAN with the right insula (Fig. 2). The distributions of connectivity clusters that reached statistical significance and the MNI coordinates of their peak voxels are shown in Fig. 2 and Table 4. These results revealed that the functional connectivity in each cluster did not differ between the HC and PD-NC groups.
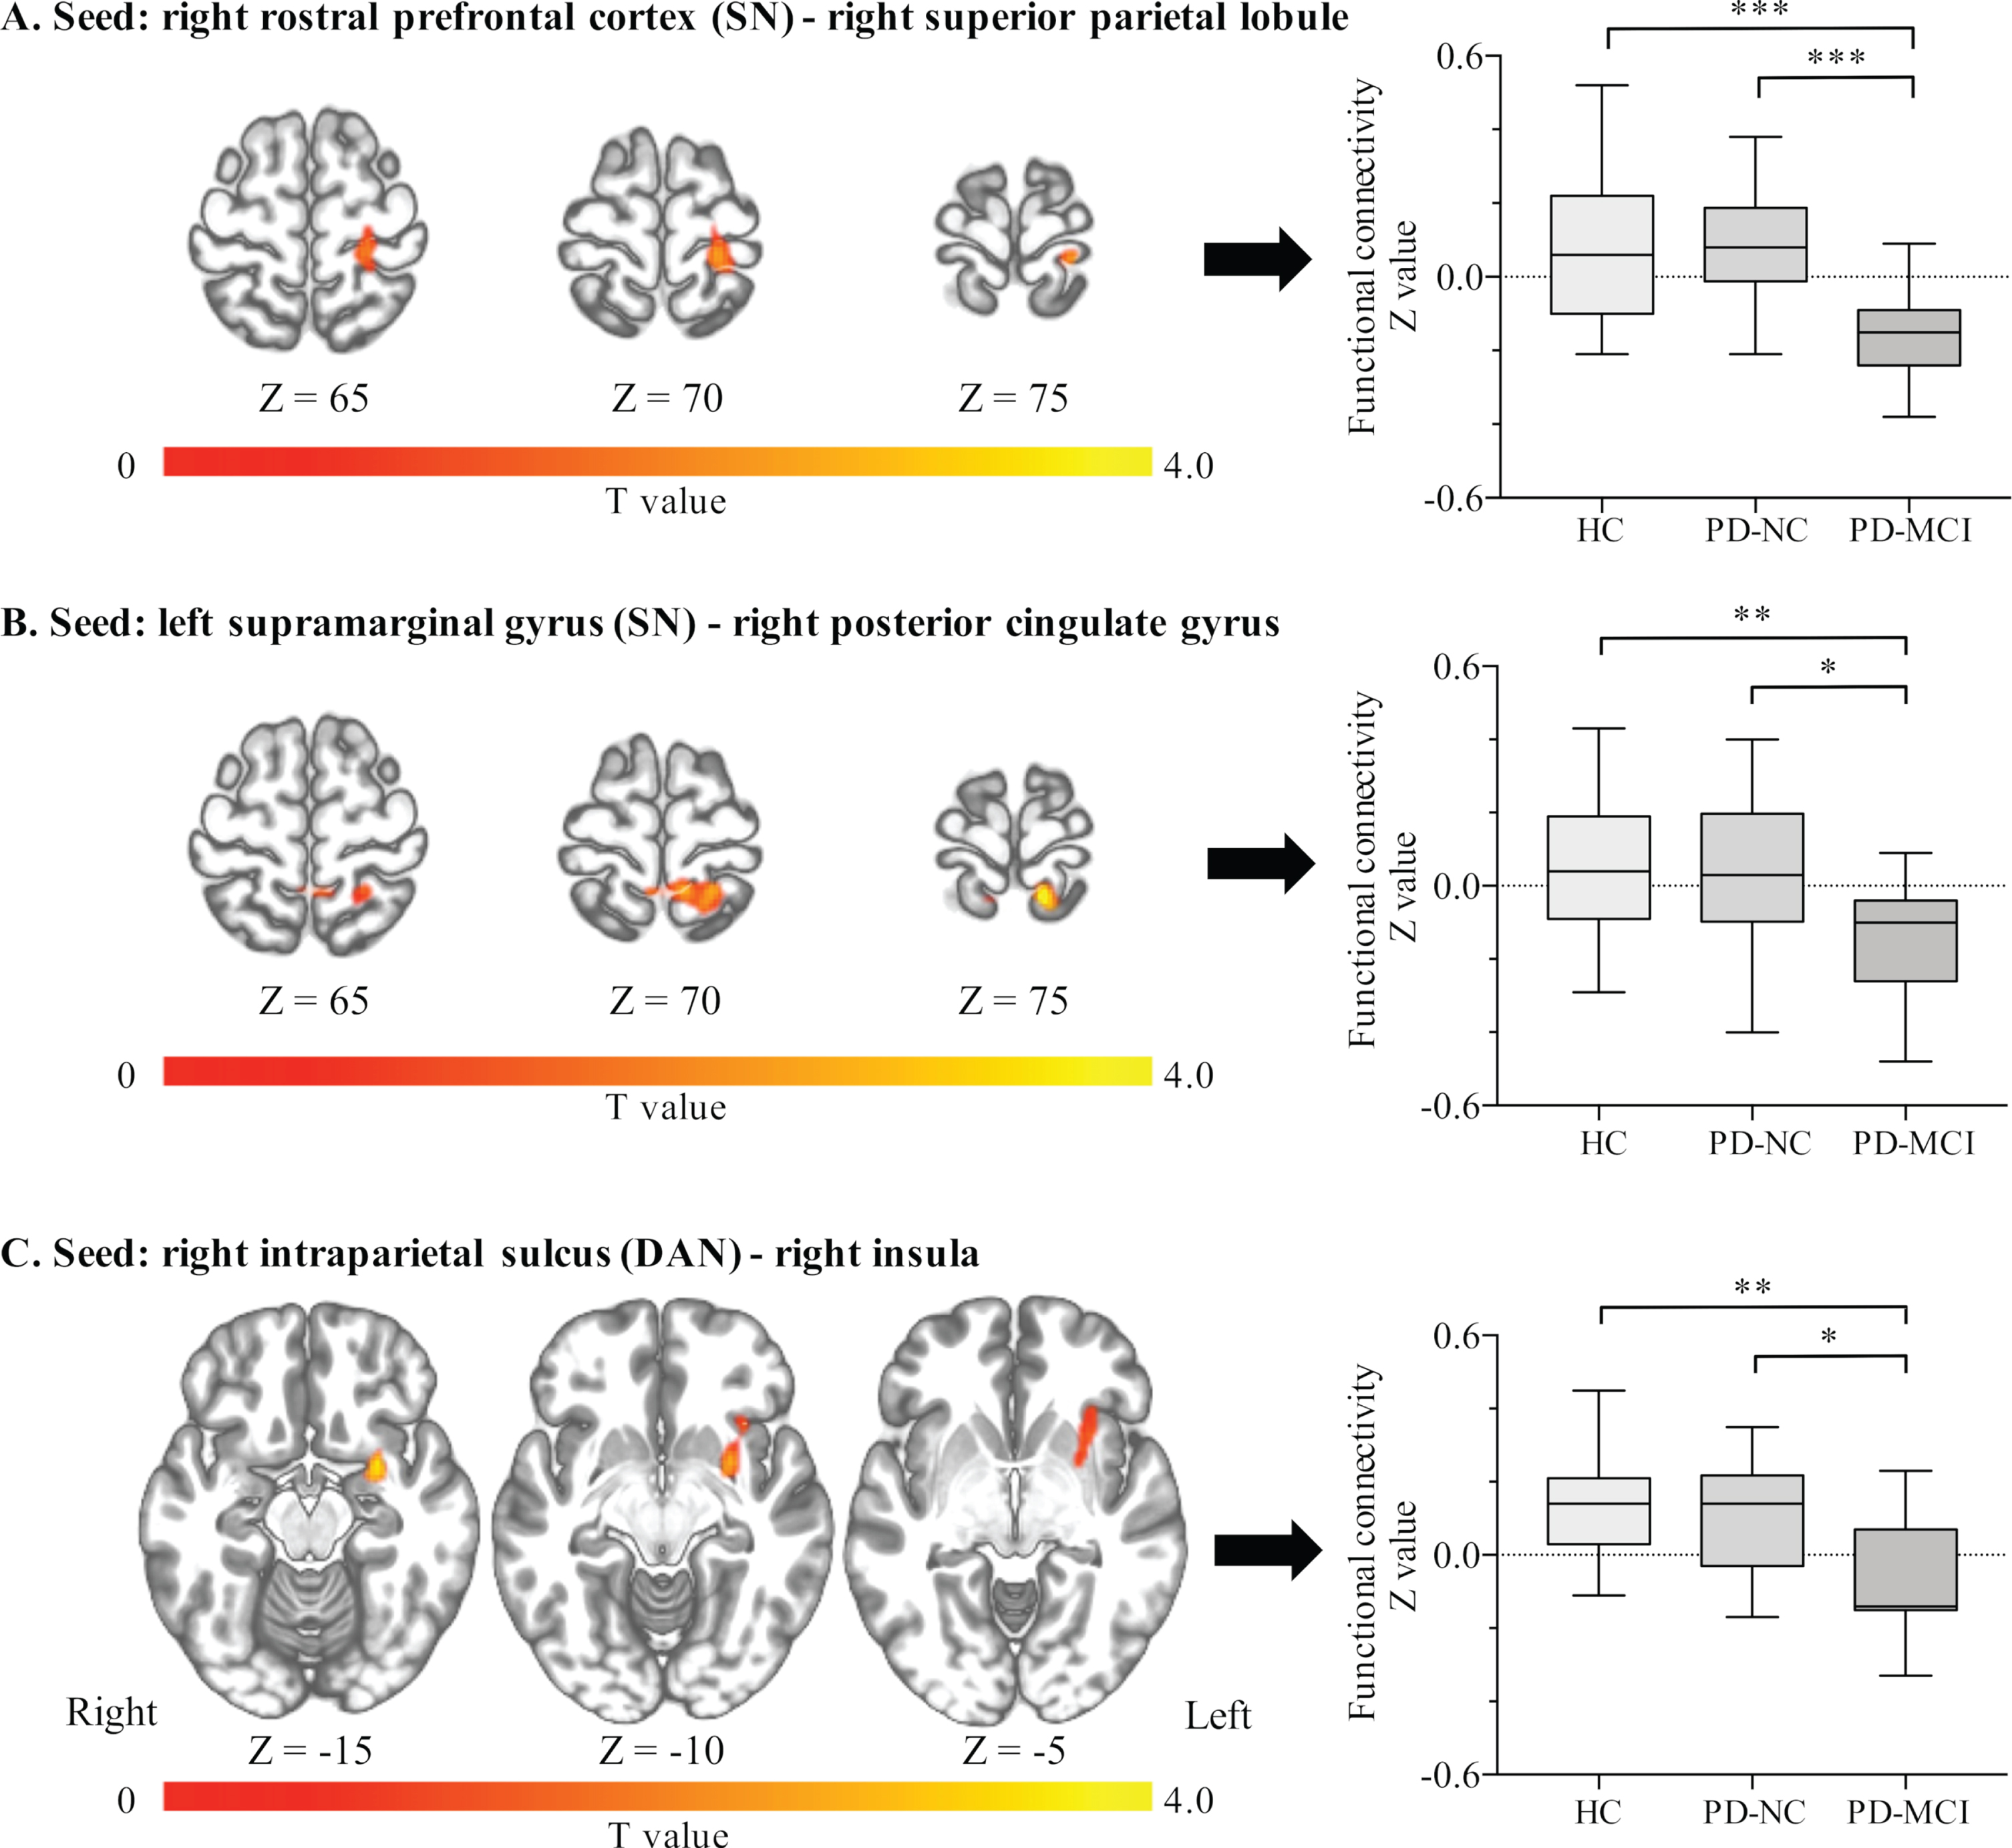
Distributions of significant clusters and functional connectivity values among Parkinson’s disease subgroups. The PD-MCI group showed significantly reduced connectivity (A) between the right rostral prefrontal cortex and right superior parietal lobule (peak voxel: x = 12, y = –48, z = 76), (B) between the left supramarginal gyrus and right posterior cingulate gyrus (peak voxel: x = 22, y = –34, z = 74), and (C) between the right intraparietal sulcus and right insula (peak voxel: x = 28, y = 4, z = –14). *p < 0.05, **p < 0.01, ***p < 0.001 (one-way analysis of variance followed by Tukey’s HSD test). HC, Healthy controls; PD-NC, Parkinson’s disease with normal cognition; PD-MCI, Parkinson’s disease with mild cognitive impairment; SN, Salience network; DAN, Dorsal attention network
Differences in clusters of significant intergroup connectivity among Parkinson’s disease subgroups
†indicates mean group z-values: Mean (SD). HC, Healthy controls; PD-NC, Parkinson’s disease with normal cognition; PD-MCI, Parkinson’s disease with mild cognitive impairment; MNI, Montreal Neurological Institute; FDR, False discovery rate; SN, Salience network; DAN, Dorsal attention network.
Association between functional connectivity and verbal fluency scores
Figure 3 shows the results of correlation analysis between the functional connectivity values of three seeds that differentiated PD-MCI from PD-NC and their verbal fluency scores. The connectivity value between the right RPFC and right SPL was significantly correlated with the number of switches in the semantic fluency task. The connectivity values between the left SMG and right posterior CG significantly correlated with the number of switches in the semantic fluency task. The right IPS and right insula connectivity values showed no significant correlation with any verbal fluency scores (Supplementary Figure 1).
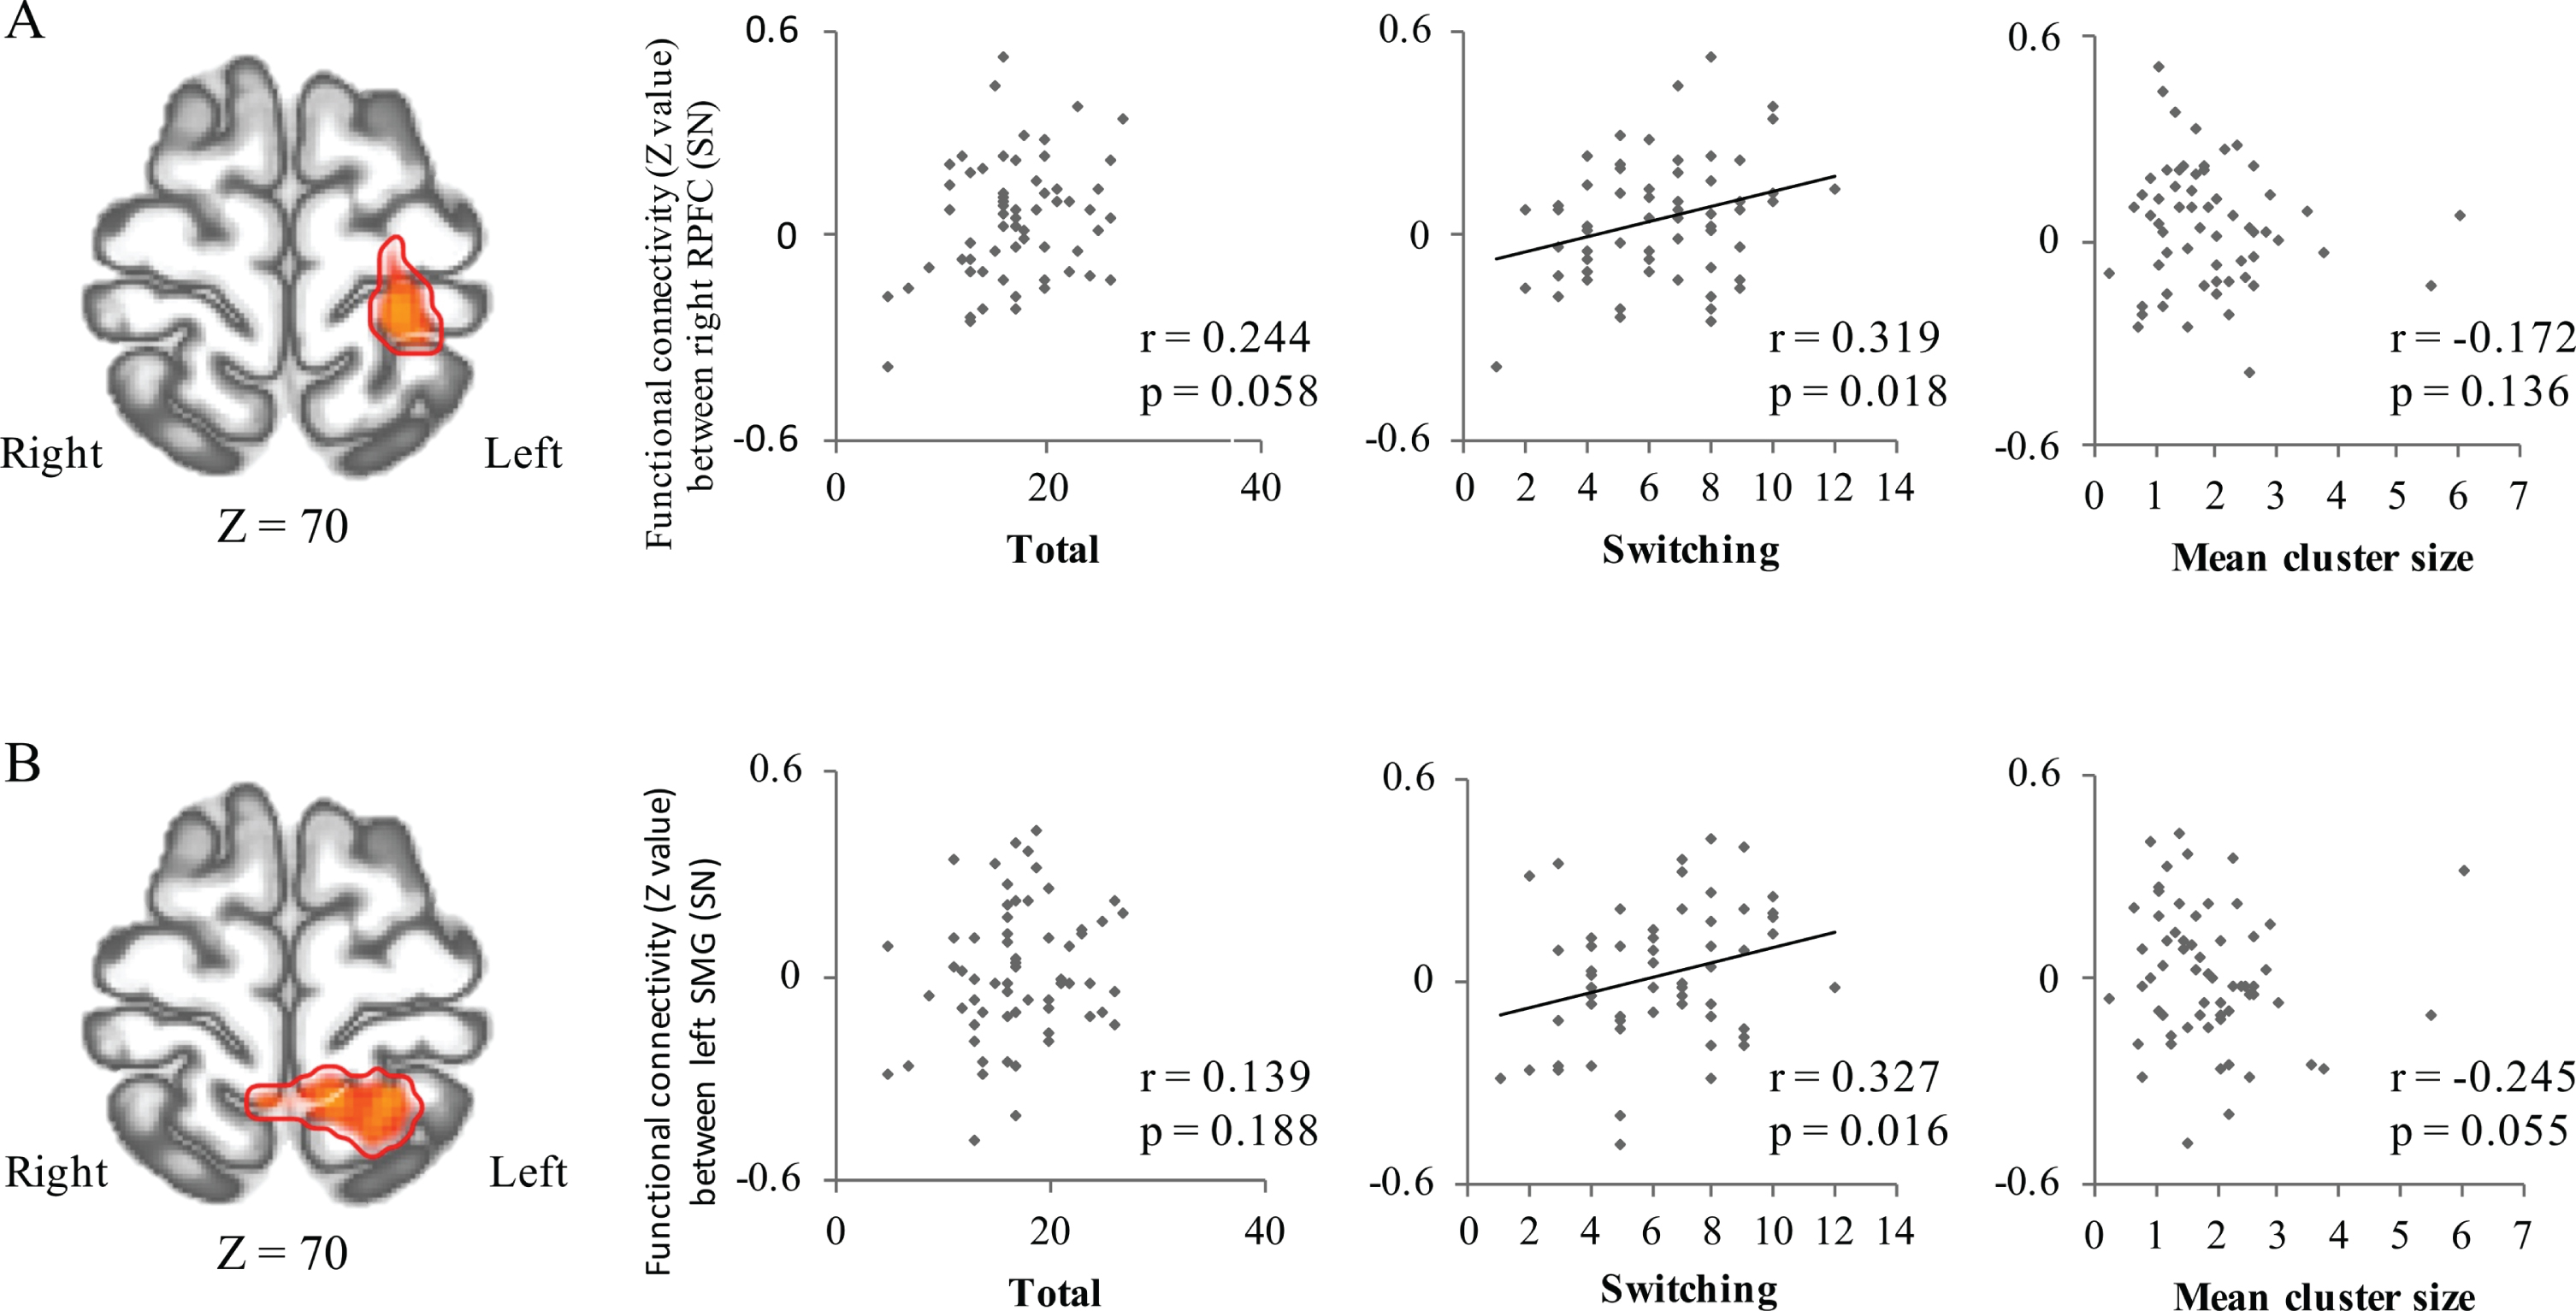
Correlations between verbal fluency scores and functional connectivity in significant clusters. A) Connectivity values between the right rostral prefrontal cortex (from SN seed) and right superior parietal lobule (red color; peak voxel: x = 12, y = –48, z = 76) significantly correlated with the numbers of total words and switches in the semantic fluency task. B) Connectivity values between the left supramarginal gyrus (from SN seed) and right posterior cingulate gyrus (red color; peak voxel: x = 22, y = –34, z = 74) significantly correlated with the number of switches in the semantic fluency task. PD-NC, Parkinson’s disease with normal cognition; PD-MCI, Parkinson’s disease with mild cognitive impairment; VFT, Verbal fluency test; SN, Salience network.
DISCUSSION
In the present study, we examined the diagnostic values of VFT clustering and switching strategies in patients with PD with and without MCI. As hypothesized, patients with PD-MCI switched less frequently in both semantic and phonemic fluency tasks compared to the other groups. Additionally, the number of switches in the semantic fluency test had a high diagnostic yield, as evidenced by the second largest AUC following MoCA. Furthermore, neuroimaging analysis revealed that reduced functional connectivity was associated with some core SN nodes that significantly correlated with number of switches in semantic fluency.
Verbal fluency measures as diagnostic markers for PD-MCI
Our results showed that the qualitative analysis of VFT is a useful clinical diagnostic marker of PD-MCI. Although qualitative analyses of VFT in PDD have shown reductions in the number of switches [25] or in both cluster size and number of switches [26], very few studies are available on PD-MCI. Galtier et al. reported that the number of switches in semantic and phonetic verbal fluency tests discriminated 81.4% of patients with PD-MCI from patients with PD-NC, and proposed that the number of switches is a useful predictor of PD-MCI [27], consistent with our findings. However, our PD-MCI group had a shorter disease duration and higher MMSE score than those in the Galtier et al. study (mean disease duration, 3.93 vs 7.78 years; mean MMSE score, 29.11 vs 28.04, respectively), indicating that even in the early stages of PD-MCI, there are obvious and significant differences with PD-NC or HC in qualitative measures of VFT.
Other studies have also suggested that neuropsychological tests for executive functions, language and visual memory, such as the Stroop test, BNT, and ROCFT-delayed, may be early indicators of conversion from PD-MCI to PDD [57, 58]. Of note, in our study these tests showed worse discriminating ability than number of switches in semantic fluency. Among all neuropsychological tests for executive function, VFTs are the fastest to perform, taking only 1 minute and requiring no devices. Therefore, we consider that the number of switches in semantic fluency is a sensitive and convenient measure for detecting early stages of PD-MCI in daily clinical practice.
Regarding qualitative VFT measures in the PD-NC group, our study revealed no significant differences compared with HC. Previous studies of qualitative measures in PD-NC showed conflicting results. Compared to HC, some authors reported that patients with PD-NC showed no difference in qualitative VFTs [25, 60], while others reported poorer performance in clustering and switching in the phonemic fluency test [59], and worse switching in the semantic fluency test [60]. Presumably, these inconsistencies were partly due to insufficient clinical information; for instance, comprehensive neuropsychological assessment was not performed in most of these reports [25, 59]. Therefore, patients with various degrees of cognitive function may have been included in the PD-“NC” group in these studies. Consistent with our results, a recent sophisticated study employing MDS criteria for differentiating PD-MCI from PD-NC showed no significant differences between PD-NC and HC groups in qualitative VFT measures [27].
Dysfunction of functional connectivity underpins switching deficits in semantic fluency
rs-fMRI analysis in this study showed that compared with the PD-NC group, the PD-MCI group demonstrated significantly reduced connectivity associated with the core SN and DAN nodes, i.e., the right RPFC (SN node) with right SPL, left SMG (SN node) with right posterior CG, and right IPS (DAN node) with right insula. Interestingly, the first two connectivity values significantly correlated with the number of switches in semantic fluency, but not with other VFT measures. Considering that the SPL, posterior CG, and insula are key regions for the DAN, DMN, and SN, respectively, our results indicate that PD-MCI is characterized by disruption of cross-talk in SN with DAN and DMN.
Previous rs-fMRI studies of PD-MCI and PDD demonstrated various alterations in functional connectivity within and between large-scale networks, including the DMN [29, 62], DAN [29], frontoparietal network [29, 63], and SN [64]. Recently, there has been growing interest in the SN as a vulnerable system in the development of PD-MCI. The SN, which is anchored in the insular and anterior cingulate cortices [65], is known to mediate the dynamic interactions between the DMN and the central executive network that is involved in attention-executive function or cognitive control [66, 67]. Specifically, the SN reacts to salient events and activates during tasks requiring selective attention, task switching, and self-regulation [65, 68]. It is also important for initiating cognitive control [66] and for behavioral adaptation driven by error detection [69]. Since switching in VFTs corresponds with the ability to monitor one’s progress and to spontaneously change one’s word search strategy when facing word-finding difficulties, the SN can be considered to play a central role in switching in VFTs.
In PD, the insula, a core region of the SN, is known to be one of the cortical regions affected earliest and most severely according to Braak’s staging of brain pathology [70]. Using positron emission tomography with dopaminergic ligands in patients with PD-MCI, Christopher et al. reported a significant reduction in D2 receptor availability in regions of the SN, including the insula, and suggested that this distinct D2 receptor expression may be ascribed to different degrees of vulnerability to Lewy body deposition [31, 71]. Furthermore, Aracil-Bolaños et al. recently reported that functional and graph-theoretical changes appeared in SN nodes of patients with PD-MCI, without evidence of gray matter loss, indicating that disrupted connectivity but preserved SN gray matter could mark the transition to PD-MCI [64]. Based on these results, our correlation analysis findings regarding functional connectivity suggest that reduced switching in the semantic fluency task represents early changes in the SN in PD-MCI.
There are several limitations to our study. First, the demographic data showed significant differences in sex, age, and UPDRS scores between the PD-MCI and PD-NC groups. It was previously suggested that aging could alter DMN-SN connectivity in PD-MCI [33], and thus these background differences may have confounded our results. However, we included these variables as nuisance covariates in our rs-fMRI analysis, and we still found significant results. Second, we performed all neuropsychological tests and MRI scans in the “on” state. A previous report indicated that dopaminergic medications changed network connectivity in PD [72], thus treatment regimens could have influenced our results. However, since there were no statistical differences in the L-dopa equivalent daily dose between our PD groups, treatment effects on network connectivity should have been similar between groups. Third, we only evaluated one semantic task category and one letter in the phonemic task of verbal fluency. Studies of category-specific naming difficulties in patients with stroke suggest the presence of specific brain lesions related to each particular semantic category [73]. Thus, research involving other semantic categories might reveal the possible effects of category differences on our results. Finally, our cohort was relatively small, especially for analyzing rs-fMRI. Therefore, future studies with more patients (including patients with PDD) and detailed imaging data are needed to validate our findings.
CONCLUSION
Our study demonstrates that a reduced number of switches in the semantic fluency test is a sensitive and convenient measure for differentiating early-stage PD-MCI from PD-NC. This finding is based on functional disruption, centered on SN nodes, that was also an early change in PD-MCI. Accordingly, our data highlight the qualitative analysis of verbal fluency as a robust clinical diagnostic marker for PD-MCI.
Footnotes
ACKNOWLEDGMENTS
This work was supported by JSPS KAKENHI Grant Number JP19K17038, JP16H06280, and a Grant for Strategic Research Promotion from Yokohama City University (# SK2804). R. Landin-Romero is supported by the Appenzeller Neuroscience Fellowship in Alzheimer’s Disease.
The authors thank the patients and the healthy volunteers who selflessly gave of their time to participate in this research.
CONFLICT OF INTEREST
The authors have no conflict of interest to report.