
Abstract
Background:
Cognitive and sleep dysfunction are common non-motor symptoms in Parkinson’s disease (PD).
Objective:
Determine the relationship between slow wave sleep (SWS) and cognitive performance in PD.
Methods:
Thirty-two PD participants were evaluated with polysomnography and a comprehensive level II neurocognitive battery, as defined by the Movement Disorders Society Task Force for diagnosis of PD-mild cognitive impairment. Raw scores for each test were transformed into z-scores using normative data. Z-scores were averaged to obtain domain scores, and domain scores were averaged to determine the Composite Cognitive Score (CCS), the primary outcome. Participants were grouped by percent of SWS into High SWS and Low SWS groups and compared on CCS and other outcomes using 2-sided t-tests or Mann-Whitney U. Correlations of cognitive outcomes with sleep architecture and EEG spectral power were performed.
Results:
Participants in the High SWS group demonstrated better global cognitive function (CCS) (p = 0.01, effect size: r = 0.45). In exploratory analyses, the High SWS group showed better performance in domains of executive function (effect size: Cohen’s d = 1.05), language (d = 0.95), and processing speed (d = 1.12). Percentage of SWS was correlated with global cognition and executive function, language, and processing speed. Frontal EEG delta power during N3 was correlated with the CCS and executive function. Cognition was not correlated with subjective sleep quality.
Conclusion:
Increased SWS and higher delta spectral power are associated with better cognitive performance in PD. This demonstrates the significant relationship between sleep and cognitive function and suggests that interventions to improve sleep might improve cognition in individuals with PD.
INTRODUCTION
Parkinson’s disease (PD) is a progressive neurodegenerative disorder characterized by its motor symptoms. Patients also experience debilitating non-motor symptoms including dysfunction of sleep and cognition [1]. Sleep disorders in PD include sleep fragmentation, alterations in sleep architecture (reductions in slow wave sleep (SWS) and REM sleep), REM sleep behavior disorder, and excessive sleepiness [2–5]. Cognitive dysfunction is also common in PD, affecting up to 80%of patients over the disease course [6]. This symptom can include deficits in multiple cognitive domains, impairs quality of life, increases caregiver burden, and increases risk of institutionalization [7–9].
The contribution of sleep to cognitive health in the general population is well described, with sleep deprivation, sleep-disordered breathing, and sleep fragmentation being associated with cognitive dysfunction [10, 11]. Additionally, in healthy older adults, SWS, the deepest non-REM sleep stage (NREM 3:N3), is important for memory consolidation and is related to language function in normal cognition and mild cognitive impairment (MCI), with selective enhancement of SWS leading to memory improvement [12–14]. Additionally, less SWS is associated with executive dysfunction and selective disruption of SWS can impair visuospatial learning [15, 16]. These associations are compelling, but to our knowledge there are no studies examining the relationship between the percentage of SWS (N3%) and cognition using a comprehensive neurocognitive assessment. Further, many questions remain about the association between SWS and cognition in PD. We hypothesized that PD individuals with less SWS would have lower cognitive function. We investigated this using a level II comprehensive neurocognitive battery, as recommended by the Movement Disorders Society Task Force on diagnostic criteria for PD-MCI [9] and nocturnal polysomnography with measurement of sleep architecture and quantitative EEG spectral power analysis.
METHODS
Participants
This cross-sectional, observational study investigates relationships between sleep and cognition in PD. Participants included 32 individuals with idiopathic PD (based on Movement Disorders Society Clinical Diagnostic Criteria for Parkinson’s disease) [17]. PD participants, Hoehn and Yahr stage 1–3 and age ≥45, were recruited from the University of Alabama at Birmingham (UAB) Movement Disorders Center. Additional inclusion criteria included stable medications for at least four weeks and Montreal Cognitive Assessment (MoCA) score ≥18 due to concern that participants with MoCA <18 might not be able to complete study assessments. Potential participants were excluded if they had signs or symptoms suggestive of atypical or secondary Parkinsonism, or if they had deep brain stimulation or untreated sleep apnea. Because many people with sleep apnea are undiagnosed, study screening included one night of home nocturnal pulse oximetry to assess risk for sleep apnea. If the desaturation index was >5 events/hour, participants had to undergo formal clinical sleep testing to evaluate for sleep apnea and, if diagnosed, were required to be treated with continuous positive airway pressure (CPAP) for at least six weeks before study entry (N = 2). No participants were diagnosed with sleep apnea by polysomnography following a negative screening by pulse oximetry. The UAB Institutional Review Board approved the study and all participants agreed to participate through written informed consent.
Assessments
All assessments described below were performed within a 14-day period, during which actigraphy was worn. Cognitive assessments and polysomnography were counterbalanced to prevent an order effect and performed approximately 5 days apart to prevent any stress associated with the cognitive assessment from negatively influencing the sleep study results.
Comprehensive neurocognitive battery
Participants underwent a level II neurocognitive battery as defined by the PD-MCI diagnostic criteria recommended by the Movement Disorders Society Task Force, which included at least two tests in each of five cognitive domains [9]. All testing occurred at the time of day participants felt their medications were most effective and participants maintained their usual medication schedule. This battery (Fig. 1) included the following tests: Attention/Working Memory Domain: 1) letter-number sequencing subtest of Wechsler Adult Intelligence Scale IV (WAIS-IV) and 2) digit span (forward and backward) of the Weschler Memory Scale-III (WMS-III); Memory Domain: 1) Hopkins Verbal Learning Test (HVLT-R) total immediate recall and delayed recall and 2) 10–36 Spatial Recall Test (10–36) immediate recall and delayed recall; Executive Function Domain: 1) Trails A and B where the score for Trails B minus A (Trails B-A) was used and 2) Delis-Kaplan Executive Function System (D-KEFS) Stroop color-word interference test: Stroop Inhibition; Language Domain: 1) Semantic/category fluency (animal naming) and 2) phonemic verbal fluency (Controlled Oral Word Association: COWA-CFL); Visuospatial Skills Domain: 1) Benton Judgment of Line Orientation (JLO) and 2) Hooper Visual Organization Test (VOT). In addition, we tested the Processing Speed Domain: 1) D-KEFS Stroop color naming, 2) Stroop word naming, and 3) Trails A.
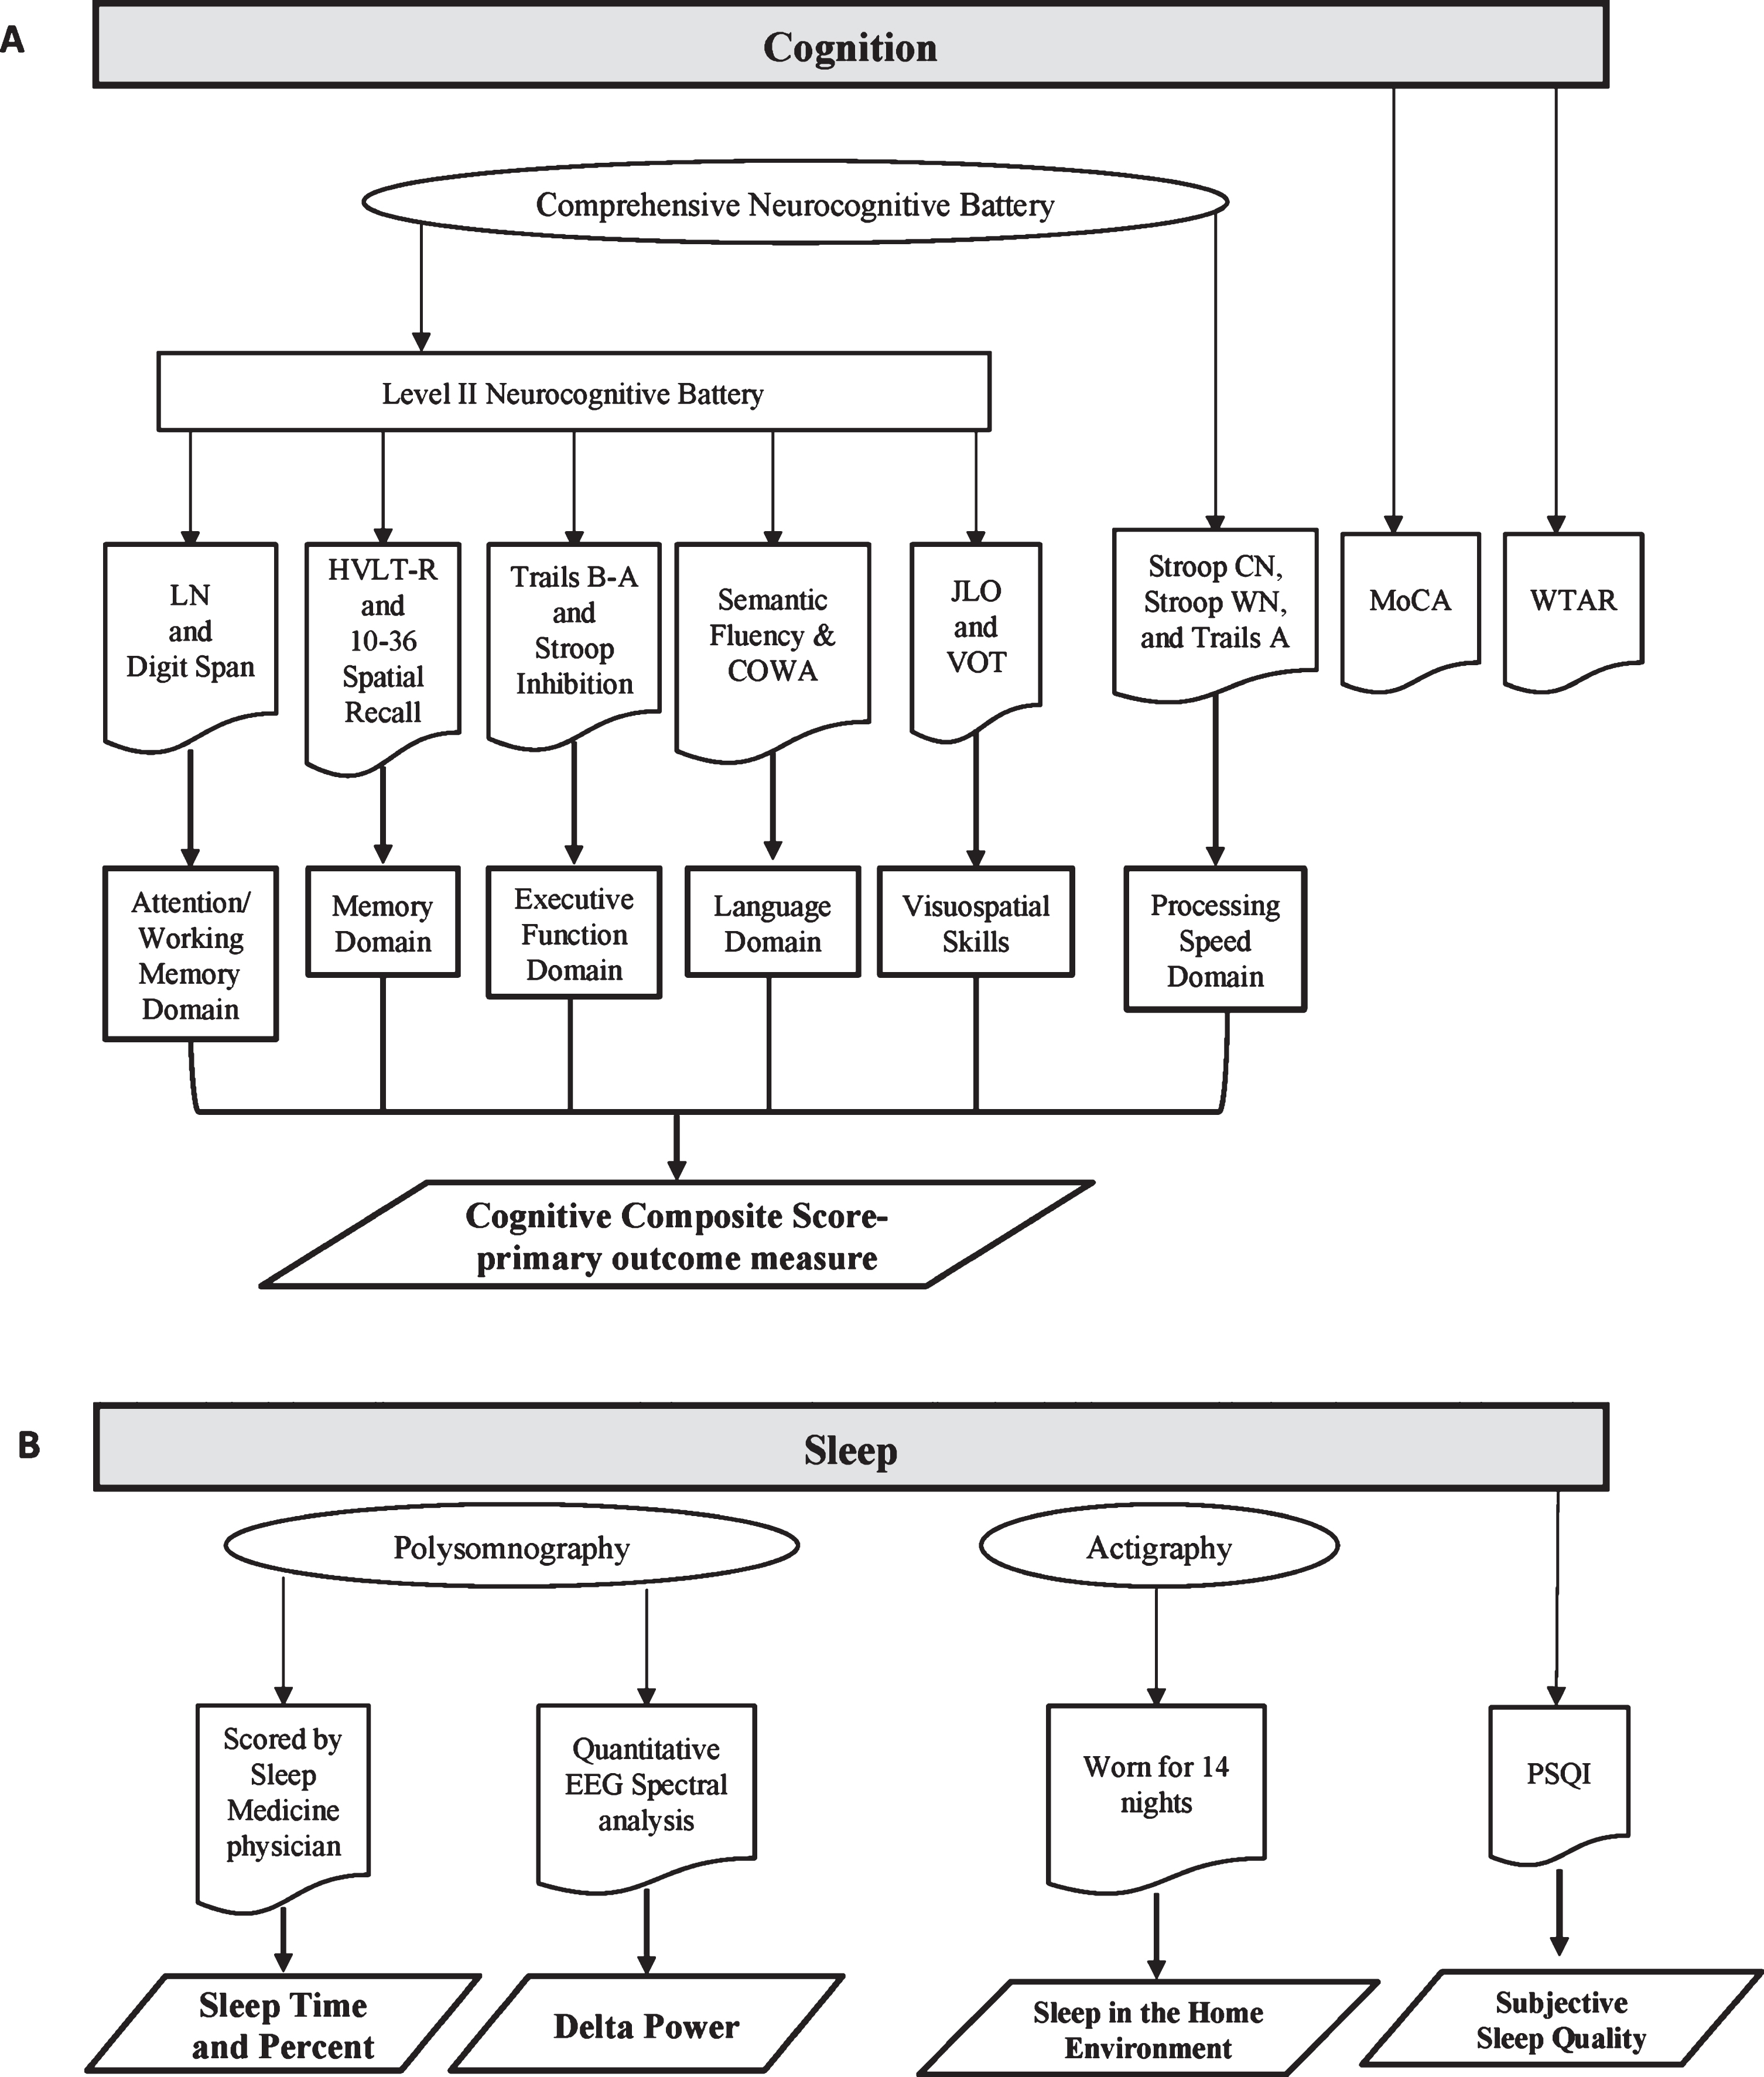
A) Diagram of Cognitive Assessments. B) Diagram of Sleep Assessments. COWA, Controlled Oral Word Association; HVLT-R, Hopkins Verbal Learning Test; LN, letter-number sequencing subset of Wechsler Adult Intelligence Scale IV; MoCA, Montreal Cognitive Assessment; PSQI, Pittsburgh Sleep Quality Index; Stroop CN, color naming; Stroop WN, word naming; WTAR, Wechsler Test of Adult Reading.
Participants also completed the Wechsler Test of Adult Reading (WTAR) as a measure of estimated intellectual function. The MoCA was used for screening and as an additional measure of overall cognitive function.
Polysomnography
All participants were evaluated with laboratory-based, supervised PSG to assess objective sleep out-comes (Fig. 1). PSG recordings included electroencephalography (EEG) (leads F3, F4, C3, C4, O1, and O2 referenced to contralateral mastoid), submental and bilateral anterior tibialis and extensor digitorum electromyograms, electrooculogram, airflow monitoring with thermocouple and nasal pressure, respiratory effort using polyvinylidene fluoride belts at the chest and abdomen, and pulse oximetry. The sampling frequency was set at 512Hz to acquire the input EEG signals. PSGs were scored by a certified sleep technician and a board-certified Sleep Medicine physician (AWA). Using a component of the Sandman Elite Polysomnography software, interscorer reliability was calculated for a randomly selected group of five studies to ensure consistency of sleep stage scoring. REM sleep without atonia was scored according to American Academy of Sleep Medicine Manual for the Scoring of Sleep and Associated Events, version 2.5 [18].
Quantitative EEG delta power analysis
Full-night EEG signals were exported in European Data Format (EDF). Using the EEGLAB toolbox in MATLAB version R2019a, F3, F4, C3, and C4 leads were visually evaluated and frontal leads with least artifact (F3 or F4) were chosen for analysis. Electrical and movement artifacts were then visually detected and sleep epochs containing any artifacts were excluded from further analysis. Spectral analysis was performed on artifact-free 30-second sleep epochs using the fast Fourier transform (Matlab pwelch function). The power content (expressed as μV2) for each 30-second epoch of N2, N3, and REM was determined. The spectral distribution was categorized into the following frequency bands: delta (1.0 to 4.0 Hz), theta (4.1 to 8.0 Hz), alpha (8.1 to 13.0 Hz), beta (13.1 to 30 Hz) and low gamma (30.1 to 50 Hz). The average absolute power for each frequency bandwidth was determined for N2, N3, and REM sleep stages.
Additional assessments
Participants were evaluated with the Movement Disorders Society-Unified Parkinson’s Disease Rating Scale (MDS-UPDRS) [19] in “on” medication state to evaluate disease severity and with actigraphy monitoring (Micro Motionlogger Sleepwatch; Ambulatory Monitoring Inc. NY USA) for 14 nights to evaluate sleep in the home environment. Actigraphy is a watch-like device worn on the wrist that monitors activity levels to estimate sleep and wakefulness in the home environment. Participants’ actigraphy data was considered in the analysis if sleep and wake time could be estimated for at least five nights (N = 28). Actigraphically-derived sleep efficiency, total sleep time, and wake after sleep onset (WASO) were averaged over the available nights of monitoring to determine sleep efficiency, total sleep time, and WASO in the participants’ home environment. Subjective sleep outcomes was measured with the Pittsburgh Sleep Quality Index (PSQI), a validated subjective measure of sleep quality over 1-month with scores >5 indicating subjective sleep dysfunction [20] and he Epworth Sleepiness Scale (ESS), an 8-item questionnaire assessing the likelihood of falling asleep in 8 situations, with scores >10 indicating excessive sleepiness [21]. Dopaminergic therapy usage (Levodopa Equivalent Dose: LED) was calculated as previously described [22].
Statistical analysis
Scores for individual cognitive tests were used to calculate a normalized (z-) score based on normative values, which control for age, sex, race, and education as appropriate for each test. For each participant, individual test z-scores were averaged within each cognitive domain to obtain a domain score, and domain scores were averaged to determine the Composite Cognitive Score (CCS) as a measure of global cognitive function. CCS was the primary outcome measure. Participants were characterized as PD-MCI if they scored at least 1.0 standard deviation (SD) below the mean on at least one test in two cognitive domains or two tests in one cognitive domain [9]. Raw scores were used for the MoCA.
To address the a priori hypothesis that SWS would be associated with cognition, the sample was divided into two groups based on the normative median percentage of SWS for this age group (15.8%N3) [23]. This median was used to divide the sample into High SWS (>15.8%N3) (N = 16) and Low SWS (≤15.8%N3) (N = 16).
Statistical analyses were performed using IBM SPSS Statistics 23.0 (IBM Corporation, Armonk, NY). Summary statistics were calculated and tested for normality (Shapiro-Wilk) for all variables. Group comparisons (High SWS versus Low SWS) were conducted with independent-samples t-tests for normally distributed data and with nonparametric tests (Mann-Whitney U) for non-normally distributed data. Effect sizes (0.2 small, 0.5 medium, or 0.8 large) based on differences in means are expressed as Cohen’s d for normally distributed data and as non-parametric (r) when not normally distributed to quantify magnitude of relative difference between High and Low SWS groups. Due to significant differences in LED and MDS-UPDRS Part IV between High SWS and Low SWS, group differences in cognitive function were also examined with an analysis of covariance (ANCOVA) with LED and MDS-UPDRS Part IV as covariates. Partial eta squared (η p 2 ) represents the magnitude of the effect (0.01 small, 0.06 medium, or 0.14 large effect) of group on cognitive function. Correlations between participant demographics (age, sex, education) and cognitive outcomes (CCS, domain scores, MoCA, and intellectual function) were assessed using bivariate Spearman’s correlation coefficient (ρ) to be conservative. Although individual cognitive test z-score calculations are based on normative values that control for age, sex, and education, to be conservative in our reporting, we performed multiple linear regression to account for significant relationships observed between participant demographics and cognitive performance in this sample. Specifically, age was not correlated with any individual cognitive domain, so no further correction was applied, but sex was correlated with the visuospatial skills domain (ρ= 0.40, p = 0.024) and processing speed domain (ρ= 0.50, p = 0.004) and education with the memory domain (ρ= 0.40, p = 0.025). Therefore, for visuospatial skills, processing speed domain, and memory domain, multiple linear regressions were performed, and the standardized residuals were used in group contrasts, correlational analyses, and calculation of the CCS (average of cognitive domains). Spearman’s bivariate correlations were also used to examine the relationship between sleep and cognitive function. All statistical tests were two-tailed and p < 0.05 was considered significant.
RESULTS
Participant characteristics
Of the 32 PD participants, 16 were categorized as High SWS (>15.8%N3) and 16 as Low SWS (≤15.8%N3) based on published normative median N3%for this age group [23]. There were no significant differences between the groups in terms of age, education, disease duration, Hoehn & Yahr stage, medications known to affect SWS or sleep, or MDS-UPDRS Parts I-III or Total score (Table 1). As expected based on prior studies, significantly more women were in the High SWS group compared to the Low SWS group [23]. Additionally, participants in the High SWS group had lower LED and lower scores for MDS-UPDRS Part IV (motor complications) compared to the Low SWS group (Table 1).
Demographics and Participant Characteristics
*MDS–UPDRS, N = 15 (missing Part IV and Total Score for 1 participant) **Medications potentially affecting sleep include benzodiazepines, non-benzodiazepine hypnotics, narcotics, antipsychotics, melatonin, and sedating antidepressants such as trazodone. Median and IQR (interquartile range) are reported for variables not normally distributed with group differences examined using Mann–Whitney U, exact significance test.
Sleep characteristics
Sleep characteristics for High SWS and Low SWS groups are shown in Table 2. Because the groups were split by percentage of N3 sleep, there was a significant difference in time and percentage of N3 between groups (Table 2). There were also significant differences in percentage but not time of stage N2 (Non-REM stage 2), with less N2%in the High SWS group; and in sleep latency, with shorter latency to sleep onset in the High SWS group. No other differences in sleep architecture were observed between groups (Table 2). There were no differences between groups in terms of subjective daytime sleepiness, as measured by the ESS (p = 0.38), or subjective sleep quality, as measured by the PSQI (p = 0.32) (Data not shown).
Objective Sleep Findings
Mean±SD reported for normally distributed data. N1, non-REM stage 1; N2, non-REM stage 2; N3, non-REM stage 3; REM, rapid eye movement sleep; RBD, REM sleep behavior disorder: defined as ≥27%epochs of REM meeting criteria for REM without atonia [18, 44] and history of or observed dream enactment; *N = 14 because 2 participants did not have REM sleep; ** χ2 reported for this value.
To explore whether the PSG night represented a typical night of sleep for the participants, we compared the mean sleep efficiency, mean total sleep time, and mean WASO for the nights preceding the PSG, as measured by actigraphy, to these measures assessed by PSG, the gold standard. There was a significant correlation between actigraphically-measured and PSG-measured sleep efficiency (r = 0.55, p = 0.002), total sleep time (r = 0.64, p = 0.0003), and WASO (r = 0.40, p = 0.036). This increases our confidence that the PSG night used for measurement of SWS is a typical night of sleep for participants.
Cognitive performance in high versus low SWS
The High SWS group had significantly betterglobal cognition function, as measured by the CCS (primary outcome; further corrected for sex and education), compared to the Low SWS group (p = 0.01, effect size r = 0.45, 95%CI [0.08, 0.41]) (Table 3). As shown in Table 1, the contrast of High versus Low SWS revealed group differences for LED and MDS-UPDRS Part IV. The ANCOVA adjusting for LED and MDS-UPDRS Part IV revealed that there was no significant effect of these covariates on the cognitive outcome in multivariate analysis, and the significant main effect of SWS did not change. Specifically, High SWS had a significantly higher CCS (F(1, 27)=13.95, p = 0.001, η p 2 = 0.34) after adjusting for LED and MDS4 (Supplementary Table 1).
Cognitive Performance by %SWS
#N = 15 for both groups; # #N = 15 for low N3%; †domain corrected for sex; ‡domain corrected for education Median and IQR (interquartile range) are reported for variables not normally distributed, group differences examined using Mann–Whitney U, exact significance test. MoCA, Montreal Cognitive Assessment; WTAR, Wechsler Test of Adult Reading; PD-MCI, Parkinson’s disease-mild cognitive impairment.
Exploratory analyses of cognitive function
While the CCS was the primary outcome for this study, to guide planning of future work, we explored which domains were driving the difference in the CCS between groups. This exploratory analysis revealed that participants in the High SWS group performed better within the domains of executive function (p = 0.006, d = 1.05, 95%CI [–1.72, –0.20]), language (p = 0.012, d = 0.95, 95%CI [–1.61, –0.10]), and processing speed (domain further corrected for sex) (p = 0.003, d = 1.12, 95%CI [–1.69, –0.25]) compared to the Low SWS group (Table 3). These effects remained unchanged after controlling for LED and MDS-UPDRS part IV (Supplementary Table 1). Further, using the MDS Task Force criteria, significantly fewer participants met diagnostic criteria for PD-MCI within the High SWS group (44%) compared to the Low SWS group (81%) (p = 0.029, d = 0.81, 95%CI [–0.01, 0.76]). Although not significant, there was a trend toward better performance of the High SWS group within the domain of attention/working memory and on the MoCA. There were no significant group differences in performance within domains of memory or visuospatial skills (domain further corrected for sex). However, following ANCOVA adjustment for LED and MDS-UPDRS Part IV, memory performance was significantly better in the High SWS group (Supplementary Table 1).
Cognitive function and sleep
To further explore the consistency of our findings, we performed two additional analyses. One investigated the correlations between sleep architecture and cognitive performance, and the second inspected correlations between EEG frontal delta power spectral analysis and cognition. As shown in Table 4 and Fig. 2, higher percentage of SWS (N3%) was significantly correlated with better global cognitive performance, as measured by the CCS (p = 0.024) (Fig. 2A), as well as with better performance in the domains of executive function (p = 0.011) (Fig. 2B), language (p = 0.024) (Fig. 2C), and processing speed (p = 0.018) (Fig. 2D), and on the MoCA (p = 0.010). Classification as PD-MCI, based on MDS Task Force criteria, was also correlated with N3%(p = 0.050). Additionally, N3%was positively correlated with EEG delta power during N3 (p < 0.001) (Fig. 2E).
Spearman’s Rank Correlations between SWS and Cognitive Function
#N = 15 for both groups; # #N = 15 for low N3%; † domain corrected for sex; ‡ domain corrected for education MoCA, Montreal Cognitive Assessment; N3, non-REM stage 3; WTAR, Wechsler Test of Adult Reading; *p < 0.05; **p < 0.01.
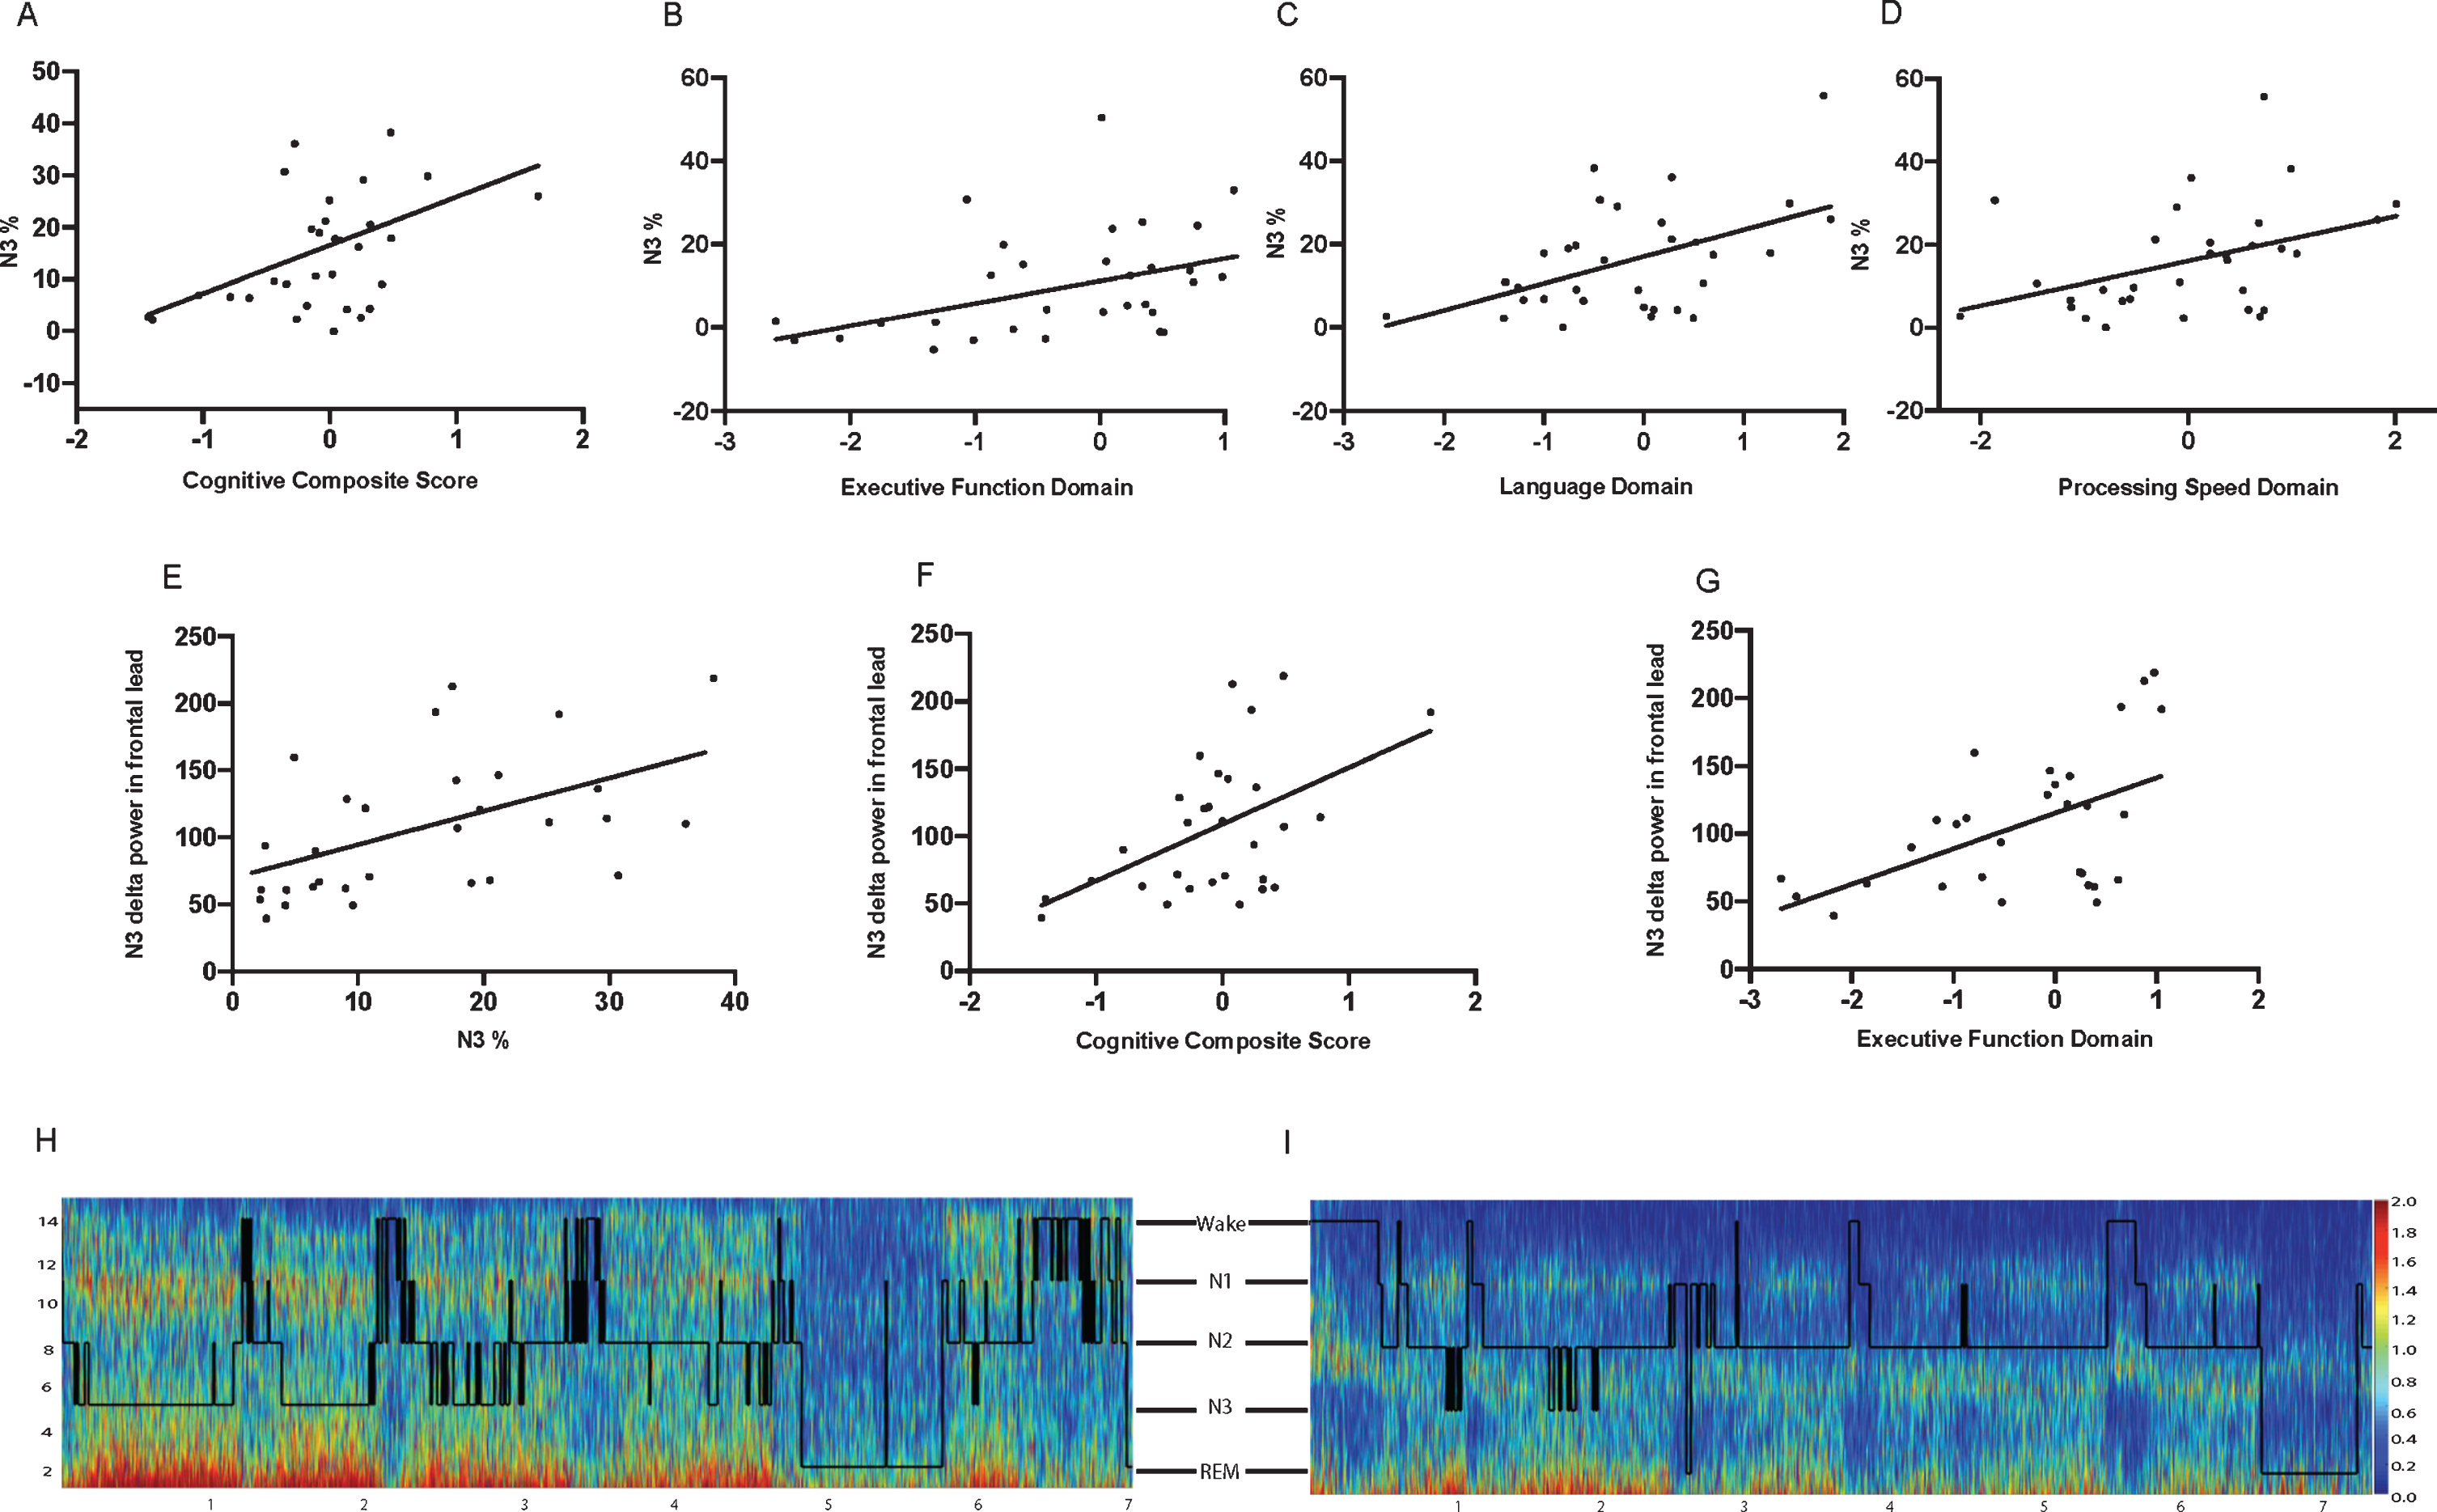
A) Relationship between N3%and Cognitive Composite Score (p = 0.024). B) Relationship between N3%and Executive Function Domain (p = 0.011). C) Relationship between N3%and Language Domain (p = 0.024). D) Relationship between N3%and Processing Speed Domain (p = 0.018). E) Relationship between absolute delta power in N3 and Cognitive Composite Score (p = 0.032). F) Relationship between absolute delta power in N3 and executive function domain (p = 0.017). H, I) Spectrograms with overlying hypnograms to show full night spectral power and corresponding sleep stages. H) Spectrogram/hypnogram from a single participant with high N3 absolute delta power and Cognitive Composite Score: z = 0.27. I) Spectrogram/hypnogram from a single participant with low N3 absolute delta power and Cognitive Composite Score: z = –1.43.
Investigation of the correlations between cognition and EEG delta power spectral analysis during N3 were similar to those between sleep architecture and cognitive performance. Frontal lead delta power during N3 was correlated with the CCS (p = 0.032) (Fig. 2F) and executive function domain (p = 0.017) (Fig. 2G). Unlike sleep architecture and cognitive performance correlations, frontal N3 delta power had only a trend toward correlation with language and was not correlated with processing speed or MoCA. Delta power during N2 sleep was correlated only with the executive function domain (p = 0.02), and delta power during REM sleep was not significantly correlated with any cognitive domain. Representative spectrograms for two participants are shown in Fig. 2H (high delta power) and 2I (low delta power).
Subjective sleep
No differences were observed in subjective sleep ratings between High and Low SWS groups. Spe-cifically, self-reported sleepiness (ESS) was not different between High (8.87±7.90) and Low SWS (7.25±8.32) groups (t=–0.90, p = 0.38). No differences were observed in self-reported sleep quality (PSQI) between High (9.5 [8.0 –12.0]) and Low SWS (8.5 [7.25 –10.0]) groups (U = 101.0, p = 0.32). Sleepiness (ESS) was significantly correlated with REM%(ρ=–0.41, p = 0.021) and with the visuospatial skills domain (ρ=–0.45, p = 0.01). Therefore, a multiple linear regression was performed with visuospatial skills domain as the dependent variable and REM%and ESS as predictor variables. This model was significant (F [2,29] = 5.20, p = 0.012), with an adjusted R2 of 0.213. However, neither predictor was significant, with REM%accounting for 5.5%(p = 0.151) of the variance, and ESS accounting for 10.1%(p = 0.056). No other relationships were observed between ESS and cognitive function. The PSQI was not correlated with objective sleep or cognition.
DISCUSSION
Overall, we found that PD patients with more SWS have better global cognitive performance compared to those with less SWS. In exploratory analyses, we found that this relationship was driven by performance within domains of processing speed, language, and executive function. These findings remained significant after adjusting for participant characteristics. Further exploratory analyses showed that delta spectral power during N3 was correlated with global cognitive performance and the executive function domain. Cognitive performance was not associated with subjective sleep quality. This study expands upon the body of work suggesting interactions bet-ween sleep and cognition by investigating this relationship in PD using objective sleep outcomes and a comprehensive level II cognitive battery.
SWS, the deepest stage of non-REM sleep, is characterized by synchronous delta activity predominantly in the frontal EEG and is thought to represent homeostatic sleep drive, or sleep need [24]. In fact, homeostatic regulation of SWS is linked to synaptic potentiation that occurs during daytime wakefulness, such that increased cortical synaptic potentiation is associated with more SWS [25]. It has also been noted that more SWS during a sleep period following learning is associated with increased retention of the learned task [26, 27]. Thus, it may be that increased slow wave activity is not only a response to active learning but also drives cognitive processes, with the effect of enhanced cognitive performance. We speculate that our findings support the latter idea, in that more SWS is associated with better performance on a comprehensive cognitive assessment, specifically in the domains of executive function, language, and processing speed. However, due to the correlational design of the study, we cannot be certain of the direction of this effect. We further explored this association by performing quantitative EEG spectral analysis and found similar results with a significant association between frontal delta spectral power during N3 and global cognition as well as executive function. Although not significantly correlated with delta power, we also found a trend toward better performance in language. These novel findings have not been previously reported in PD, but are not unexpected since SWS is associated with neural synchrony, synaptic plasticity, and cortical reorganization, particularly within the prefrontal cortex [15, 25], an area important for these cognitive domains. For example, imaging studies have shown that SWS is associated with increased metabolism in the prefrontal cortical areas important for executive function, language, and processing speed, and selective disruption of SWS impairs skill learning [16, 28]. Further, sleep problems that disrupt SWS have been shown to impact the maintenance of brain plasticity and new learning [29, 30]. Additional support for this relationship comes from recent findings that glymphatic clearance, which is proposed to clear neurotoxins such as amyloid beta from the brain, is enhanced during SWS [31–33]. Thus, higher SWS and delta power would be expected to be associated with better cognitive performance. In summary, while prior work based on a healthy population has demonstrated the impact of synchronous delta activity (SWS) within the frontal EEG on brain plasticity and new learning, the current work is the first to suggest that SWS plays a key role across multiple cognitive domains in PD.
Based on the previously well-documented association between memory consolidation and SWS [12], we were surprised by the relatively smaller effect of SWS on this domain, which was only significant after adjusting for LED and motor fluctuations (MDS-UPDRS Part IV) (p = 0.034) (Supplementary Table 1). A trend toward a correlation was also found between N3 delta spectral power and memory (p = 0.059) (Table 4). This smaller effect may be explained in part by the older age of this study population, as aging has been reported to weaken the association between episodic memory and SWS [34]. However, prior studies have largely investigated memory consolidation of a newly learned task following a period of sleep rather than the relationship between cognitive function and SWS [34]. Previous quantitative sleep EEG analysis during NREM did not find strong associations with memory function in PD [35]. In this cross-sectional study, we speculate that the weaker association between SWS and the memory domain here may be due to aging effects or could be specific to PD.
One goal of a level II neurocognitive battery, such as the one employed in this study, is earlier detection of PD–MCI [9]. Therefore, PD–MCI was characterized using MDS Task Force Criteria of 1.0 SD below the mean to increase sensitivity [9]. Our findings suggest that less SWS (N3%) may be a marker for PD–MCI. Specifically, fewer participants in the High SWS group met MCI criteria compared to Low SWS and lower N3%was significantly correlated with classification as PD-MCI. Thus, the evaluation of percentage of SWS and frontal delta spectral power among PD patients may provide additional opportunity for earlier detection of cognitive decline. For example, while prior work investigating characteristics of slow waves (amplitude, density, and slope) during all stages of NREM sleep did not identify these characteristics as predictive of later development of dementia [36], a recent study showed that lower N3%predicted longitudinal decline in MoCA over 4 years [37]. Thus, it is possible that N3%could serve as a more reliable predictor and is an area for additional study. Moreover, percentage of SWS is potentially a modifiable protective factor given that medications such as sodium oxybate increase SWS in PD, and non-pharmacologic interventions, such as exercise, have been shown to increase SWS in both non-PD populations [38–40] and in PD [41]. Finally, sleep architecture and delta power were not correlated with the WTAR (estimated intellectual function), suggesting that SWS is not a trait associated with underlying crystallized intelligence, but could be a modifiable state through which sleep improvement interventions have the potential to attenuate cognitive dysfunction among PD patients.
Strengths of this study include measurement of sleep architecture using the gold standard (polysomnography) in combination with spectral power analysis, actigraphy, and a comprehensive assessment of cognition (level II neurocognitive battery) as recommended by the MDS Task Force for diagnosis of PD-MCI [9]. Limitations include the observational and correlational nature of this study. Although the findings are compelling and fit within our understanding of the SWS function and the anatomical correlates of this sleep stage and the cognitive domains involved, future work will need to include investigation of cognitive outcomes in the setting of SWS disruption or enhancement. Techniques are available for such studies and can be further explored based on the current study [16, 42]. This is particularly important because the current study does not allow us to determine the direction of effects; i.e., does lower SWS impair cognition as we propose, or does cognitive impairment reduce the ability to generate SWS? These findings should also be replicated in a larger sample that includes participants with dementia to increase generalizability. Further, we report several hypothesis-generating exploratory analyses and did not correct for multiple comparisons. However, the focus of the current study is the association between SWS and global cognitive function as a potential predictor of PD-MCI and we used conservative statistical methods (non-parametric analyses and adjustment for covariates). An additional limitation is that we only observed sleep on one night, thus not accounting for potential influence of the first night effect (worse sleep in the sleep lab due to being in an unfamiliar environment). However, in our prior studies, the first night effect has not adversely affected sleep in our participants with PD [43]. In addition, our actigraphy findings suggest that the night in the sleep lab was similar to sleep in the home environment based on the significant correlations between PSG- and actigraphically-measured sleep efficiency, total sleep time, and WASO. Finally, we did not include a non-PD control group. Although this would have been informative, the focus of this study was to identify the association between SWS and global cognitive function in PD, but the relationship between SWS and cognitive function in cognitively healthy adults should be explored in future investigations.
In conclusion, SWS and frontal delta power during N3 are associated with global cognitive function in PD. Exploratory analyses suggest that this relationship is driven by significant correlations between higher SWS and better performance in domains of executive function, language, and processing speed. These findings have potential therapeutic implications and can be used to guide future studies to investigate the impact of pharmacologic or non-pha-rmacologic enhancement of SWS on cognitive outcomes. Further, future research could explore whether SWS could be a predictive biomarker of cognitive decline in patients with PD and could help guide therapy and counseling. This is a particularly important area of exploration considering the prevalence and impact of sleep and cognitive dysfunction on quality of life in PD [1, 8]. This study highlights the potential impact of treatment of sleep dysfunction to improve cognition in PD.
CONFLICTS OF INTERESTS
The authors have no conflicts of interest to report.
Footnotes
ACKNOWLEDGMENTS
Dr. Kimberly Wood received funding from NIH: T32 HD071866 Training Fellowship; Dr. Adeel Me-mon received funding from NINDS R25: NS079188 Training Fellowship; Dr. Marcas Bamman received funding from NIH: UL1TR000165, T32HD071866, and P2CHD086851; Dr. Amy W Amara received funding from NIH (K23NS080912). We are grateful to the research participants, without whom this study would not have been possible.