
Abstract
Background:
Some individuals with Parkinson’s disease (PD) experience working memory and inhibitory difficulties, others learning and memory difficulties, while some only minimal to no cognitive deficits for many years.
Objective:
To statistically derive PD executive and memory phenotypes, and compare PD phenotypes on disease and demographic variables, vascular risk factors, and specific neuroimaging variables with known associations to executive and memory function relative to non-PD peers.
Methods:
Non-demented individuals with PD (n = 116) and non-PD peers (n = 62) were recruited to complete neuropsychology measures, blood draw, and structural magnetic resonance imaging. Tests representing the cognitive domains of interest (4 executive function, 3 memory) were included in a k-means cluster analysis comprised of the PD participants. Resulting clusters were compared demographic and disease-related variables, vascular risk markers, gray/white regions of interest, and white matter connectivity between known regions involved in executive and memory functions (dorsolateral prefrontal cortices to caudate nuclei; entorhinal cortices to hippocampi).
Results:
Clusters showed: 1) PD Executive, n = 25; 2) PD Memory, n = 35; 3) PD Cognitively Well; n = 56. Even after disease variable corrections, PD Executive had less subcortical gray matter, white matter, and fewer bilateral dorsolateral-prefrontal cortex to caudate nucleus connections; PD Memory showed bilaterally reduced entorhinal-hippocampal connections. PD Cognitively Well showed only reduced putamen volume and right entorhinal cortex to hippocampi connections relative to non-PD peers. Groups did not statistically differ on cortical integrity measures or cerebrovascular disease markers.
Conclusion:
PD cognitive phenotypes showed different structural gray and white matter patterns. We discuss data relative to phenotype demographics, cognitive patterns, and structural brain profiles.
INTRODUCTION
Non-demented individuals with idiopathic Parkinson’s disease (PD) subjectively report attention and memory changes [1]. From a neuropsychological standpoint, these reports are consistent with recent research demonstrating that nondemented individuals with PD can present with reduced executive function and declarative memory relative to age matched peers [2–4]. Executive function weaknesses are often observed on measures of processing speed, working memory, and inhibitory functions (e.g., Digit Symbol Coding, Trail Making Test, Stroop Color Word Test) [3, 6], while learning and memory difficulties are typically shown on unstructured list learning tasks (e.g., Hopkins Verbal Learning Test) [3, 6] and, at times, story recall tests (e.g., Logical Memory Test) [6, 7]. The severity of executive and memory impairment varies as well; some individuals may show progressive decline in executive functions, others may show executive and memory difficulties, while others show minimal to no cognitive weaknesses for many years [8].
Researchers are attempting to differentiate the neuroanatomical and biomarker contributions to these executive and memory profiles within PD, but clear profile differences remain inconclusive. The most prominent theory, known as the dual syndrome hypothesis, proposes that working memory and executive dysfunction in PD are caused by dopaminergic denervation due to pathology in substantia nigra, while memory and accompanying visuospatial deficits are caused by cholinergic denervation due to pathology in basal forebrain [9]. However, there are other possible mechanisms underlying cognitive deficits in PD. Vascular disease and white matter disease changes associated with vascular insufficiency are potential contributors to the executive difficulties of PD [10], although some researchers show this pattern to be more prominent for non-PD than PD [11]. Reduced temporal cortex volume, particularly in the mesial structures, may also contribute to reduced encoding and retrieval in PD [4, 12]. For example, some hypothesize increased alpha-synuclein pathology in the anterior temporal cortex, which is typically detected as early as Braak Stage 4 [13]. Amyloid deposition in temporal lobes has also been associated with poor recall in PD, with selective vulnerability of the hippocampus in early PD patients without dementia [14]. There are also questions regarding differences in specific gray-white matter connectivity [6]. Building upon original circuitry research proposed by Alexander Delong and Strick [15], it is theorized that individuals with executive difficulties, specifically in working memory or processing speed, and difficulties on unstructured word-list learning tests may be experiencing disruptions to frontostriatal circuitry. The neural circuit between the caudate nucleus and the dorsolateral prefrontal cortex is particularly relevant to this dysfunction [7, 15]. By contrast, individuals with prominent episodic memory difficulties may have reduced connectivity or integrity within the perforant pathway or hippocampal-retrosplenial regions [4, 16], as these pathways are well known to be involved in memory formation.
Collectively, these theories suggest that individuals with idiopathic PD with primary weaknesses in executive functioning should have distinct profiles from their peers with primary memory weaknesses. To date, however, we know of no study that has strategically examined demographics, vascular, gray-white matter, and a priori connectivity tractography neuroimaging profiles in PD executive and memory phenotypes. Towards this effort, our research team designed the current study.
Borrowing from recent statistical approaches ex-amining cognitive phenotypes in prodromal profiles of Alzheimer’s disease-vascular dementia spectrum disorders (see [17–19]), we prospectively created empirically derived PD cognitive phenotypes among non-demented older adults with idiopathic PD. Clusters were based on neuropsychological measures assessing processing speed, working memory, inhibitory function, and declarative memory. We hypothesized that individuals would classify into three phenotypes: those with primary frontal-striatal (heretofore called ‘executive’) weakness, those with primary declarative memory weakness, and those with no cognitive weaknesses relative to non-PD peers. We then compared these statistically defined phenotypes in terms of demographic and cognitive behavioral features that have known significance to cognitive constructs (i.e., depression, apathy [20]), other cognitive domains (i.e., language, visuospatial) relevant to the dual-syndrome hypothesis [7], PD-related variables (disease severity, duration and dopaminergic medication dose), vascular risk profiles and white matter disease markers, gray and white matter neuroimaging parameters, and specific white-gray matter tracts associated with executive and memory function. Considering progression of the disease through Braak stages and considerations for the dual-syndrome hypothesis, we hypothesized individuals defined with an executive weakness would show the most reduction in cortical thickness in the dorsolateral prefrontal region, reduced white matter globally, and reduced connectivity between the dorsolateral prefrontal cortex (heretofore DLPFC) to caudate nucleus (CN). By contrast, individuals with memory weaknesses were hypothesized to show reduced cortical thickness within the entorhinal cortex (ERC) and reduced structural connectivity between hippocampus and entorhinal cortex (HIPP-ERC).
METHODS
Participants with PD were recruited through movement disorder clinic referrals and advertisements to local MDC support groups affiliated with the movement disorder clinic. Idiopathic PD was confirmed by a fellowship-level movement disorder specialist, using UK Parkinson’s Disease Society Brain Bank Clinical Diagnostic Criteria [21]. Individuals with early, mild to moderate PD with a Hoehn and Yahr scale [22] score between 1–3 were included. The predominant motor PD phenotype; i.e., tremor dominant vs. postural instability-gait difficulty was assessed clinically based on the first presenting symptom or predominant symptomatology on initial and subsequent exams (and also of primary concern to the patient). Non-PD participants were recruited through 1) mailings to demographically similar individuals in two counties, 2) community fliers, and 3) free community memory screenings. Exclusion criteria included other neurodegenerative disorders, significant disease that could limit lifespan, major psychiatric disorder, or dementia determined from structured telephone interview and medical record review. Depression and apathy were not exclusion criteria due to high prevalence in PD [23, 24]. This study was conducted through the Fixel Institute for Neurological Sciences, approved by the UF Institutional Review Board, required consent, and complied with the Declaration of Helsinki.
Procedures involved 1) a structured background interview for demographics (sex, age, years of education), comorbidity (Charlson Comorbidity Index [25]), handedness inventory [26], disease variables (PD duration, age at onset, first symptoms), medications (Magellan Anticholinergic Risk Scale [27] and levodopa dose [28]); 2) Mini-Mental Status Exam [29]; 3) Beck Depression Inventory, Second Edition (BDI-II [30]); Apathy Scale (AS [31, 32]); 4) a comprehensive research neuropsychological protocol; 5) Unified Parkinson’s Disease Rating Scale (UPDRS [33, 34]) completed on-medication at time of cognitive testing by trained staff and double scored by a trained rater blinded to diagnosis; 6) fasting blood draw for homocysteine and uric acid; and 7) a brain MRI conducted within 24 hours of the cognitive assessment. Individuals blinded to diagnosis double-scored and double-entered data. All procedures were completed by a trained movement disorder specialty neuropsychologist (CP, JT) and with review by a trained neurology movement disorder specialist (MF).
Neuropsychological protocol
Participants were assessed in a private room, and all PD participants were on prescribed PD medication(s) at the time of testing in order to be comfortable and provide best performance. The comprehensive research assessment targeted processing speed, working memory, inhibitory function, language, visuospatial function, declarative memory, reasoning, and fine motor function. Seven neuropsychology outcome variables of interest were a priori selected for cluster analysis: executive function [Wechsler Adult Intelligence Scale-III Digit Symbol (total score) [35, 36] and Letter Number Sequencing (total score) [37]; Trail Making Test Part B (total time) [38–40]; Stroop Color-Word Test (total correct in 45) [41]] and declarative memory [Wechsler Adult Intelligence Scale-III (WMS-III) Logical Memory Total Recall [42], Hopkins Verbal Learning Test, Revised (HVLT-R) delay free recall [43], HVLT-R recognition discriminability]. We selected executive function measures known for the assessment of processing speed, working memory, and cognitive flexibility. Individuals with idiopathic PD (no dementia) show reduced performance on these measures [6, 44], and these measures associate with frontal-striatal regions [45] altered in earlier (no dementia) disease stages of PD [6]. We created composites for both domains (executive and memory, respectively) by averaging the standardized scores. This allowed us to compare the cognitive phenotypes for performance differences after cluster analysis. We assessed the cognitive phenotypes and non-PD peers on additional external measures of reasoning [Wechsler Abbreviated Scale of Intelligence Matrix Reasoning (total score) [46], Delis-Kaplan Executive Function System - Tower Test (total achievement score) [48]], and learning/memory (Philadelphia Repeatable Verbal Learning Test; delay score controlling for initial recall [4, 50]). Additionally, we provide scores on measures of language (Animal Fluency [51], Boston Naming Test [39, 52], total scores) and visuospatial function (Judgement of Line Orientation, total correct [53]) to guide future research and assist those interested in a more comprehensive cognitive profile for the PD cognitive phenotypes in the current study. For missing values on the Stroop Color-Word test due to color blindness, regression imputation was used to replace the missing variable [54]. Neuropsychology outcome variables were standardized using z-scores based on published normative age based references. Normative references for the Trail Making Test Part B corrected for age and years of education [55].
Neuroimaging protocol
Participants were scanned on a Siemens 3T Verio scanner and 8-channel head coil with 1) one T1-weighted scan (TR: 2500 ms; TE: 3.77 ms; 176 sagittal 1 mm slices; 1 mm isotropic resolution; 256×256×176 matrix) optimized for gray/white matter segmentation, 2) two separate single-shot EPI diffusion scans, with gradients applied in 6 directions (b = 100s/mm2) and 64 directions (b = 1000s/mm2) (TR: 17300 ms; TE: 81 ms; 73 transversal 2 mm slices; 2 mm isotropic resolution; 256×256×146 matrix); and 3) a Fluid Attenuated Inversion Recovery (FLAIR) scan (TR: 6000 ms; TE: 395 ms; TI: 2100 ms;176 sagittal 1 mm slices, 1 mm isotropic resolution; 256×256×176 matrix).
Gray/white matter volume/thickness
A trained rater (JJT) applied FreeSurfer (Version 6.0; http://surfer.nmr.mgh.harvard.edu/) [56–59] for T1-weighted cortical reconstruction and volumetric segmentation of total gray matter volume, total cortical gray matter volume, total subcortical gray matter volume, and total white matter volume, hippocampus volume, putamen volume, caudate nucleus volume, and thalamus volume. This program also estimated ERC thickness and DLPFC thickness. Total intracranial volume (TICV) [60] served as a control variable for all structural metrics. Leukoaraiosis (LA) [61] was quantified as a marker of vascular disease.
White matter tract connectivity
Two a priori regions of interest (ROIs) were examined: 1) DLPFC-CN with DLPFC quantified by a reliable rater (DSC intra-rater range = 0.80–0.95; mean±SD = 0.89±0.05; Inter-rater range =0.83–0.99; mean±SD = 0.97±0.04) in ITK-SNAP (http://www.itksnap.org) [62] following published guidelines [63]; 2) ERC-HIPP connectivity with regions extracted from FreeSurfer. ROI tractography was acquired through edge weight connectivity by first interpolating the diffusion data to an isotropic resolution of 1x1x1 mm3. Diffusion tensor imaging (DTI) [64] was performed on each data set to extract a fractional anisotropy (FA) image. This FA image was used to create a seed mask of each brain where voxels with an FA larger than 0.05 were seeded with 125 seed points. To inform tractography, the data were modeled to calculate the water probability density function (PDF) in each voxel using the Mixtures of Wishart tensor distribution model [65]. Up to 5 maxima of the PDF were identified, and peak directions were used to lead the tractography algorithm. Deterministic tractography was performed using a fiber step-size of half a voxel and step-to-step track deviation less than 50°. The tractogram was filtered by keeping only tracts that connected the ROI pairs.
To analyze the strength of connectivity between the ROI pairs, a normalized edge weight analysis was performed to bypass biases from standard tract counting techniques [66]. The normalized edge weight representing the connection strength between two ROIs is defined as:
V voxel is the volume of a voxel, P voxel is the number of seed points per voxel, A is the surface area of the connected nodes, n i and n j , and l(f) is the length of the fibers, f, connecting the nodes.
Vascular marker considerations
To consider the relative contribution of vascular factors to the white matter and cognitive profile differences in the PD phenotypes we acquired the following: 1) Fasting Blood Draw–for cardiovascular risk markers (homocysteine, uric acid); 2) Leukoaraiosis (LA [61])–a marker of small vessel vascular disease linked to executive function in non-demented older adults [67]. White matter abnormalities were quantified by a reliable rater (DSC intra-rater range=0.84–0.93; mean±SD=0.84±0.12; Inter-rater range=0.80–0.83) using an in-house macro within ImageJ [68, 69] on FLAIR scans and associating highly with segmentation via FLAIR and T1 images using a k-nearest neighbor algorithm with high reliability manual segmentations [70]. Dependent variables = LA mm3 and LA relative to TICV.
Statistical analyses
Analyses completed with SPSS v25. Using only individuals with PD, a principal component analysis (PCA) was used on neuropsychological outcome variables with both orthogonal and oblique rotations to confirm memory and executive cognitive constructs. As per Kasier (1960) [71], components of eigenvalue greater than 1 were retained. The regression scores derived from the factor loadings for the retained components were used in subsequent cluster analyses. A hierarchical cluster analysis with Ward’s method determined the optimum number of clusters, followed by a k-means analysis for final cluster determination. To test the reliability of the PD cluster solution, we applied a cross-validation approach in which a k-means procedure was completed on a random sample of 50% of the participants five times. These new classifications were then compared to the original k-means analysis solution. Generally, 90% or greater agreement is considered very stable, 80–90% agreement is considered stable, and 75–80% is considered somewhat stable [72]. One-way analyses of variance (ANOVAs) compared group differences on cognitive composite scores. Individual z-scores from the seven tests used within the cluster analyses were also compared between PD phenotypes and non-PD peers. We report how covarying for Wechsler Adult Intelligence Scale-III Digit Symbol (total score) changed group comparisons on the inhibition and set-switching measures (Stroop Color Word Test and Trail Making Test, Part B). ANOVAs compared the groups on the external validation measures of reasoning, memory, language, and visuospatial function.
Non-PD peers were used as a reference group in all comparative analyses, as it is clinically useful and assists with rigor and reliability to compare deviation from age matched non-PD peer group. One-way analyses of variance (ANOVAs) compared PD cognitive phenotypes and non-PD peers on age, education, disease duration, and mood scores (BDI-II, AS) and were followed up with pair-wise independent samples t-tests. Kruskal-Wallis analyses compared UPDRS-III, CCI, Magellan score, and MMSE, as these variables were not normally distributed. A MANCOVA controlling for age, education, and TICV compared MRI volumes of interest (total brain volume, cortical gray matter volume, subcortical gray matter volume, and total white matter volume) between groups. This MANCOVA was repeated controlling for disease duration. ANCOVAs controlling for age, education and TICV compared volume of caudate nucleus, putamen, and thalamus and thickness of DLPFC and ERC between groups. ANCOVAs compared groups in edge weight strength controlling for age and sex. The DLFPC-CN edge weight analysis controlled for TICV, as this edge weight was significantly correlated with TICV. DLPFC-CN edge weights were log-transformed to achieve normality. Alpha level set at 0.05 for all comparisons. Partial Eta squared (ηp2) provides an estimate of effect size with small (ηp = 0.01), medium (ηp2 = 0.06), and large (ηp2 = 0.14).
RESULTS
Of 211 individuals screened, 181 completed cognitive testing (116 PD, 65 non-PD peers; Supplementary Table 1 for demographic information), and 174 of these completed the full neuroimaging protocol (2 missing diffusion scans; 5 did not complete due to claustrophobia). Six participants had to have regression imputation for the Stroop Color-Word test due to color blindness. Cluster analyses were conducted on the 116 PD participants. The PCA of the seven cognitive outcome measures showed 2 factors with eigenvalues greater than 1 (Supplementary Table 2). Hierarchical cluster analysis showed the greatest reduction in squared Euclidian distance between two and three clusters (Supplementary Figure 1). K-means cluster analysis with three clusters yielded three PD cognitive phenotype clusters: 1) PD Executive (n = 25); 2) PD Memory (n = 35), and PD Cognitively Well (n = 56). Cross-validation agreement with the full PD sample ranged from 86.7% to 96.7%, with an average agreement of 92.3% (Supplementary Table 3).
External validation of PD cognitive phenotypes (Supplementary Tables 2, 4, 5)
PD phenotypes and non-PD peers differed on the neuropsychological composites for executive function (F[3,177] = 65.35, p < 0.01, ηp2 = 0.526) and memory (F[3,177] = 60.65, p < 0.01, ηp2 = 0.507). PD Executive scored lowest on the executive composite, while the PD Memory scored lowest on the memory composite. This pattern was present for each individual test even when correcting for Wechsler Adult Intelligence Scale-III Digit Symbol (total score) performance [Stroop (F[3,174] = 5.962, p < 0.01, ηp2 = 0.097) and Trail Making Test Part B (F[3,174] = 19.968, p < 0.01, ηp2 = 0.160). Groups also differed on the standardized external reasoning measures (Matrix Reasoning; F[3,177] = 13.38, p < 0.01, ηp2 = 0.185; PD Executive < PD Cognitively Well, non-PD; Tower Test F[3,177] = 4.431, p < 0.01, ηp2 = 0.070, PD Executive < non-PD), and an external memory measure (PrVLT; F[3,173] = 5.98, ηp2 = 0.094, ps < 0.01; PD Memory < all other groups).
Other cognitive domains
Groups differed on a language test composite (F[3,177] = 10.585, p < 0.01, ηp2 = 0.106) such that PD Executive and PD Memory had significantly lower scores than PD Cognitively Well and non-PD peers (p < 0.01 in all cases). Groups differed in visuospatial function (F[3,177] = 7.098, p < 0.01, ηp2 = 0.107) such that PD Executive had significantly lower scores than PD Cognitively Well and non-PD peers (p < 0.01 in both cases).
Demographic and clinical comparisons (Table 1)
Demographics
Demographic analyses included all participants regardless of their completion of the neuroimaging protocol. Groups were significantly different in years of education (F[3,177] = 4.84, p = 0.02, ηp2 = 0.056) with PD Executive having two years less than PD Cognitively Well (p < 0.02) and non-PD peers (p < 0.01). Age and sex ratio were not different between groups. All participants were Caucasian. A second set of demographic analyses were completed with only individuals containing a full neuroimaging protocol (Supplementary Table 6). Results show the same pattern of findings.
Demographic and General Cognition Characteristics Between PD Cognitive Phenotypes and Non-PD Peers
This sample represents Caucasian non-Hispanic individuals within Florida, United States, at time of study. All values presented as Mean±SD, Min/Max. p-value represents overall between group (PD Executive, PD Memory, PD Well, Non-PD) comparison difference; *indicates significant difference between PD phenotypes. **p-value when comparing PD phenotypes only. Apathy scale [32]; BDI-II, Beck Depression Inventory-2 [30]; Handedness, Modification of Annette (1976) inventory with range –24 to 24 (higher positive = right-side dominance) [26]; l–Dopa Equiv. Score, Levodopa Equivalent Score = Total Daily levodopa dosage intake in milligrams [28]; MMSE, Mini-Mental State Exam [29]; UPDRS III, United Parkinson’s Disease Rating Scale III [33].
Disease and medication
PD phenotypes differed in disease duration (F[2,113] = 3.41, p = 0.04, ηp2 = 0.057; PD Executive > PD Memory, p = 0.01; PD Executive > PD Cognitively Well, p < 0.05). PD phenotypes did not differ in UPDRS-III or levodopa equivalency dose. Anticholinergic load was higher for PD relative to non-PD (p < 0.01), but not within PD phenotypes (p = 0.56). Comorbidity severity was not significantly different between PD phenotypes or to non-PD peers.
Mood/general cognition
Groups differed in depression (F[3,177] = 16.30, p < 0.01, ηp2 = 0.216) and apathy (F[3,177] = 2.95, p = 0.03, ηp2 = 0.048) with PD Executive highest in both (Depression: PD Executive>PD Memory, PD Cognitively Well; ps < 0.04; Apathy: PD Executive > all other groups, ps < 0.01). MMSE was significantly lower than non-PD peers for both low cognition phenotypes (PD Executive and PD Memory<non-PD; ps < 0.01; no difference within PD phenotypes).
Vascular marker considerations (Supplementary Table 7)
There were no significant differences between phenotypes in homocysteine (F[3,175] = 1.84, p = 0.14, ηp2 = 0.031) or uric acid (F[3,176] = 0.06, p = 0.98, ηp2 = 0.001). There was no significant difference in overall LA after controlling for TICV (F[3,169] =1.48, p = 0.22, ηp2 = 0.026).
General brain volumetrics (Fig. 1; Table 2)
In the MANCOVA controlling for age, education, and TICV, the groups differed in the multivariate analysis (F[15,495] = 2.92, p < 0.01, ηp2 = 0.081). The follow-up univariate analyses showed group differences for total brain (F[3,167] = 7.97, p < 0.01, ηp2 = 0.125), ventricle (F[3, 167] = 11.20, p < 0.01, ηp2 = 0.167), cortical gray matter (F[3,167] = 5.10, p < 0.01, ηp2 = 0.084), subcortical gray matter (F[3,167] = 3.51, p = 0.02, ηp2 = 0.059), and total white matter (F[3, 167] = 3.99, p = 0.09, ηp2 = 0.067) volumes. Post-hoc pairwise analyses showed that PD Executive had lower volumes in total brain, subcortical gray matter, white matter, and higher ventricular volume than all others (p < 0.01 in all cases) with less cortical gray matter volume than PD Cognitively Well and Non-PD peers (p < 0.01 in both cases). The differences in total brain, ventricular, subcortical gray, and white matter volumes remained significant after controlling for disease duration. Cortical gray matter was no longer significant after controlling for disease duration. There were no significant group differences in ERC thickness or DLPFC thickness.
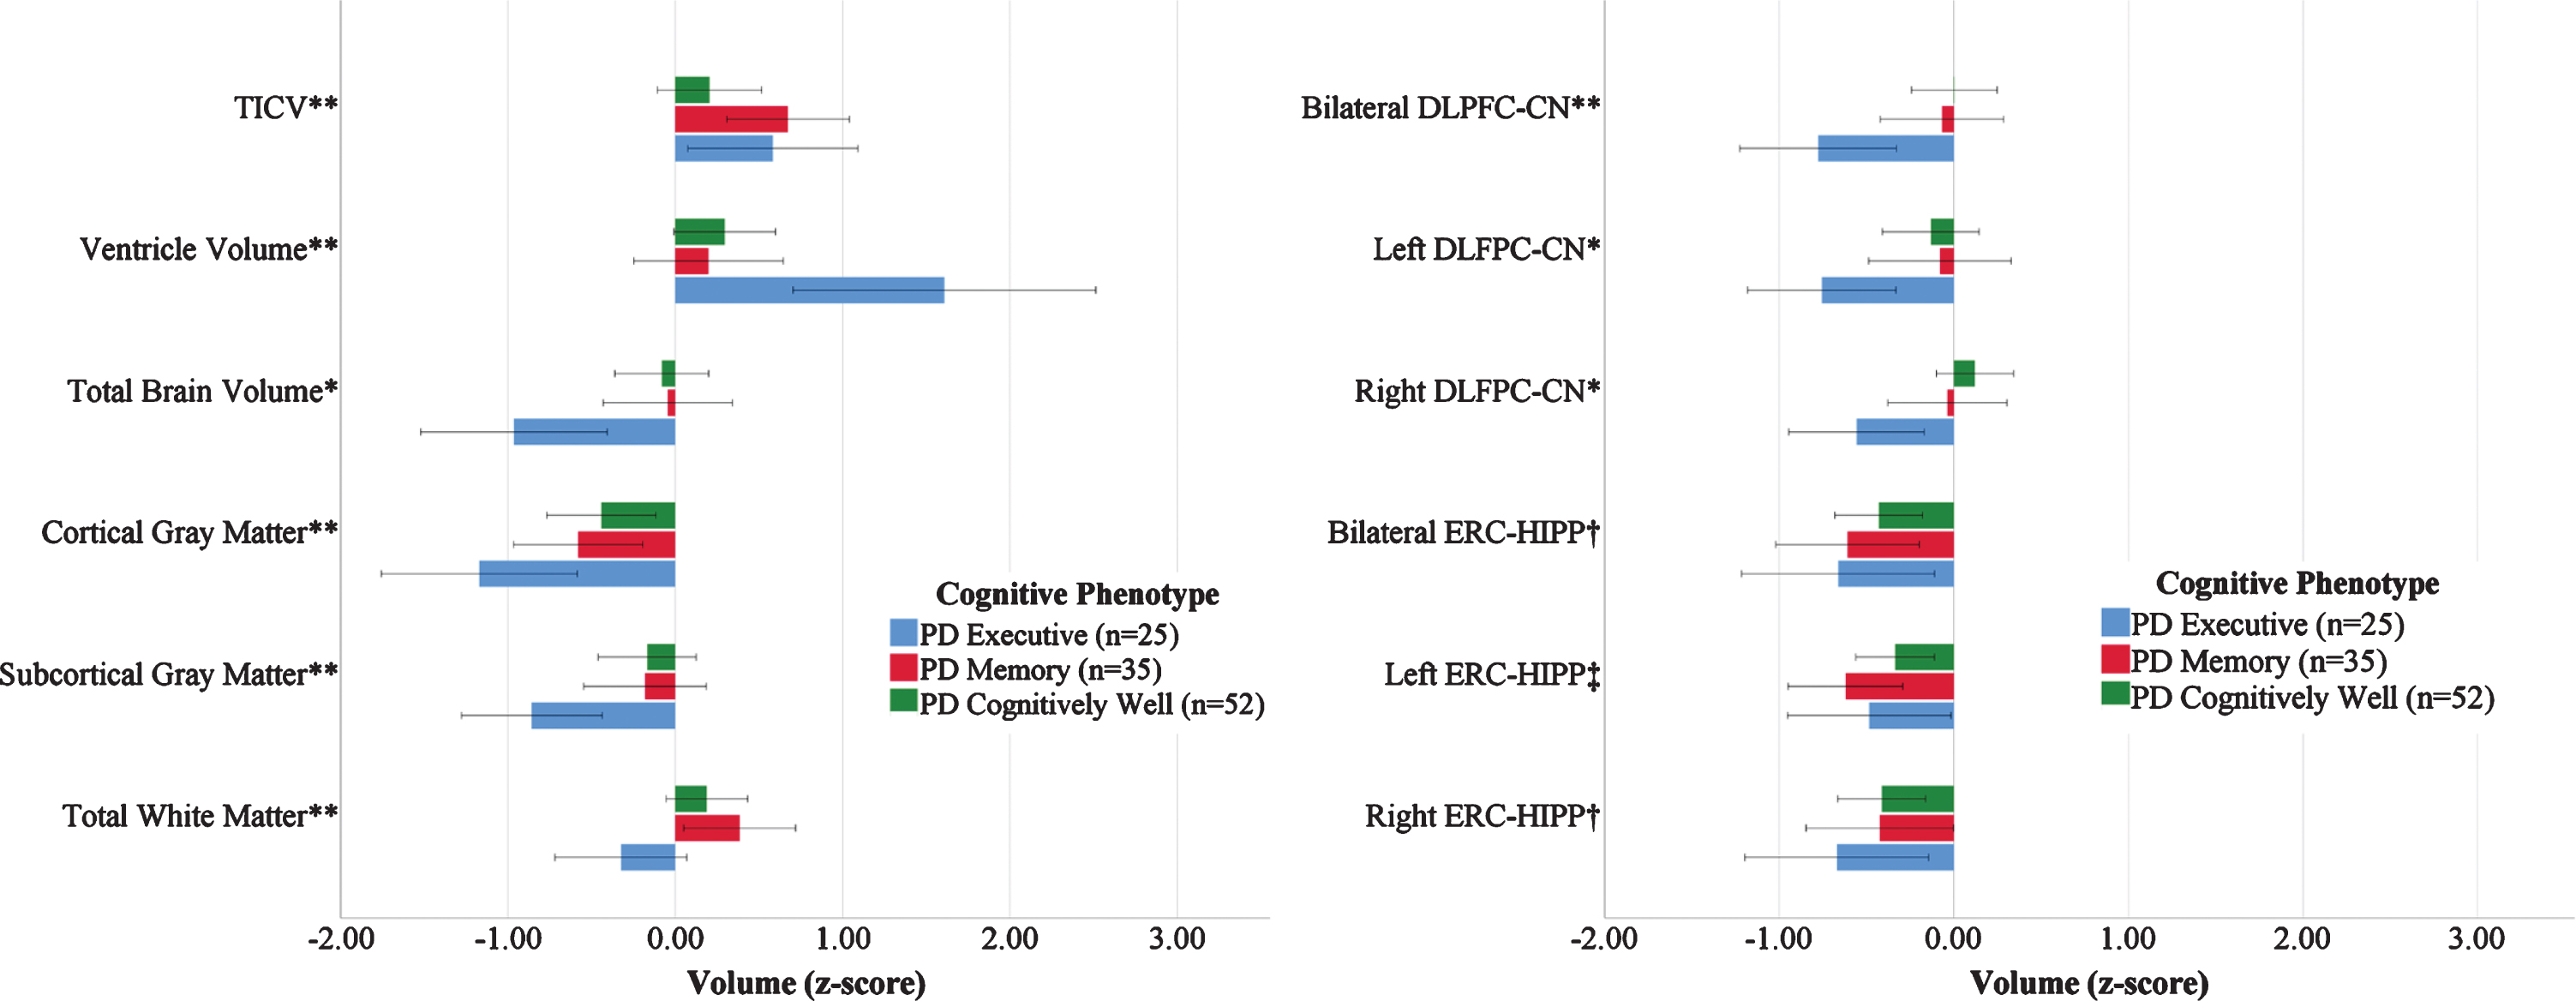
Volumetric and Structural Connectivity Measures by PD Cognitive Phenotype Referenced to Non-PD Peers. Left: Brain Volume Measures; Right: ROI to ROI Structural Connectivity (Edge Weight) Measures normalized by Non-PD peers (n = 62). Bars demonstrate the raw z-scores after normalizing for non-PD peers, and are uncorrected for age or total intracranial volume. Error bars display unadjusted standard error. TICV, total intracranial volume. *PD Executive significantly different from PD Cognitively Well and Non-PD (p < 0.05). **PD Executive significantly different from PD Memory and PD Cognitively Well (p < 0.05) †Non-PD significantly different from all phenotypes. ‡Non-PD significantly different from PD Memory. All volume analyses controlled for age, education, and TICV. DLPFC/Caudate controlled for age, education, and TICV. ERC/Hippocampus controlled for age and education.
Brain Volume/Thickness Characteristics by PD Cognitive Phenotype and Non-PD peers
All values reported as Mean±SD, Min/Max. All volumes reported in cm3; thickness is presented in mm. ERC, entorhinal cortex; DLPFC, dorsolateral prefrontal cortex. *indicates significant difference between PD phenotypes after controlling for disease duration.
Region of interest volumetrics (Fig. 1; Table 2)
After controlling for age, years of education and TICV, groups differed significantly in putamen volume (F[3,167] = 3.795, p = 0.01, ηp2 = 0.064) such that PD Executive and PD Cognitively Well had significantly smaller volume than non-PD peers (p = 0.03 and p < 0.05, respectively). Groups differed significantly in thalamus volume (F[3,167] = 2.849, p = 0.04, ηp2 = 0.049) such that PD Executive had significantly smaller volume than PD Cognitively Well (p = 0.01). Groups did not differ in caudate volume, DLFPC thickness or ERC thickness.
A priori tractography (Figs. 1, 2; Supplementary Table 8)
DLPFC-CN
Groups differed in bilateral DLFPC-CN connectivity (F[3,165] = 3.00, p = 0.03, ηp2 = 0.052; PD Executive < all groups, ps≤0.02). Exploratory hemispheric follow-up analyses found group differences in right DLPFC-CN connectivity (F[3,165] = 2.70, p < 0.05, ηp2 = 0.047; PD Executive < PD Cognitively Well, Non-PD, p’s < 0.05), but not left DLPFC-CN (F[3,165] = 1.69, p = 0.17, ηp2 = 0.030). These patterns were unchanged after correcting for disease duration.
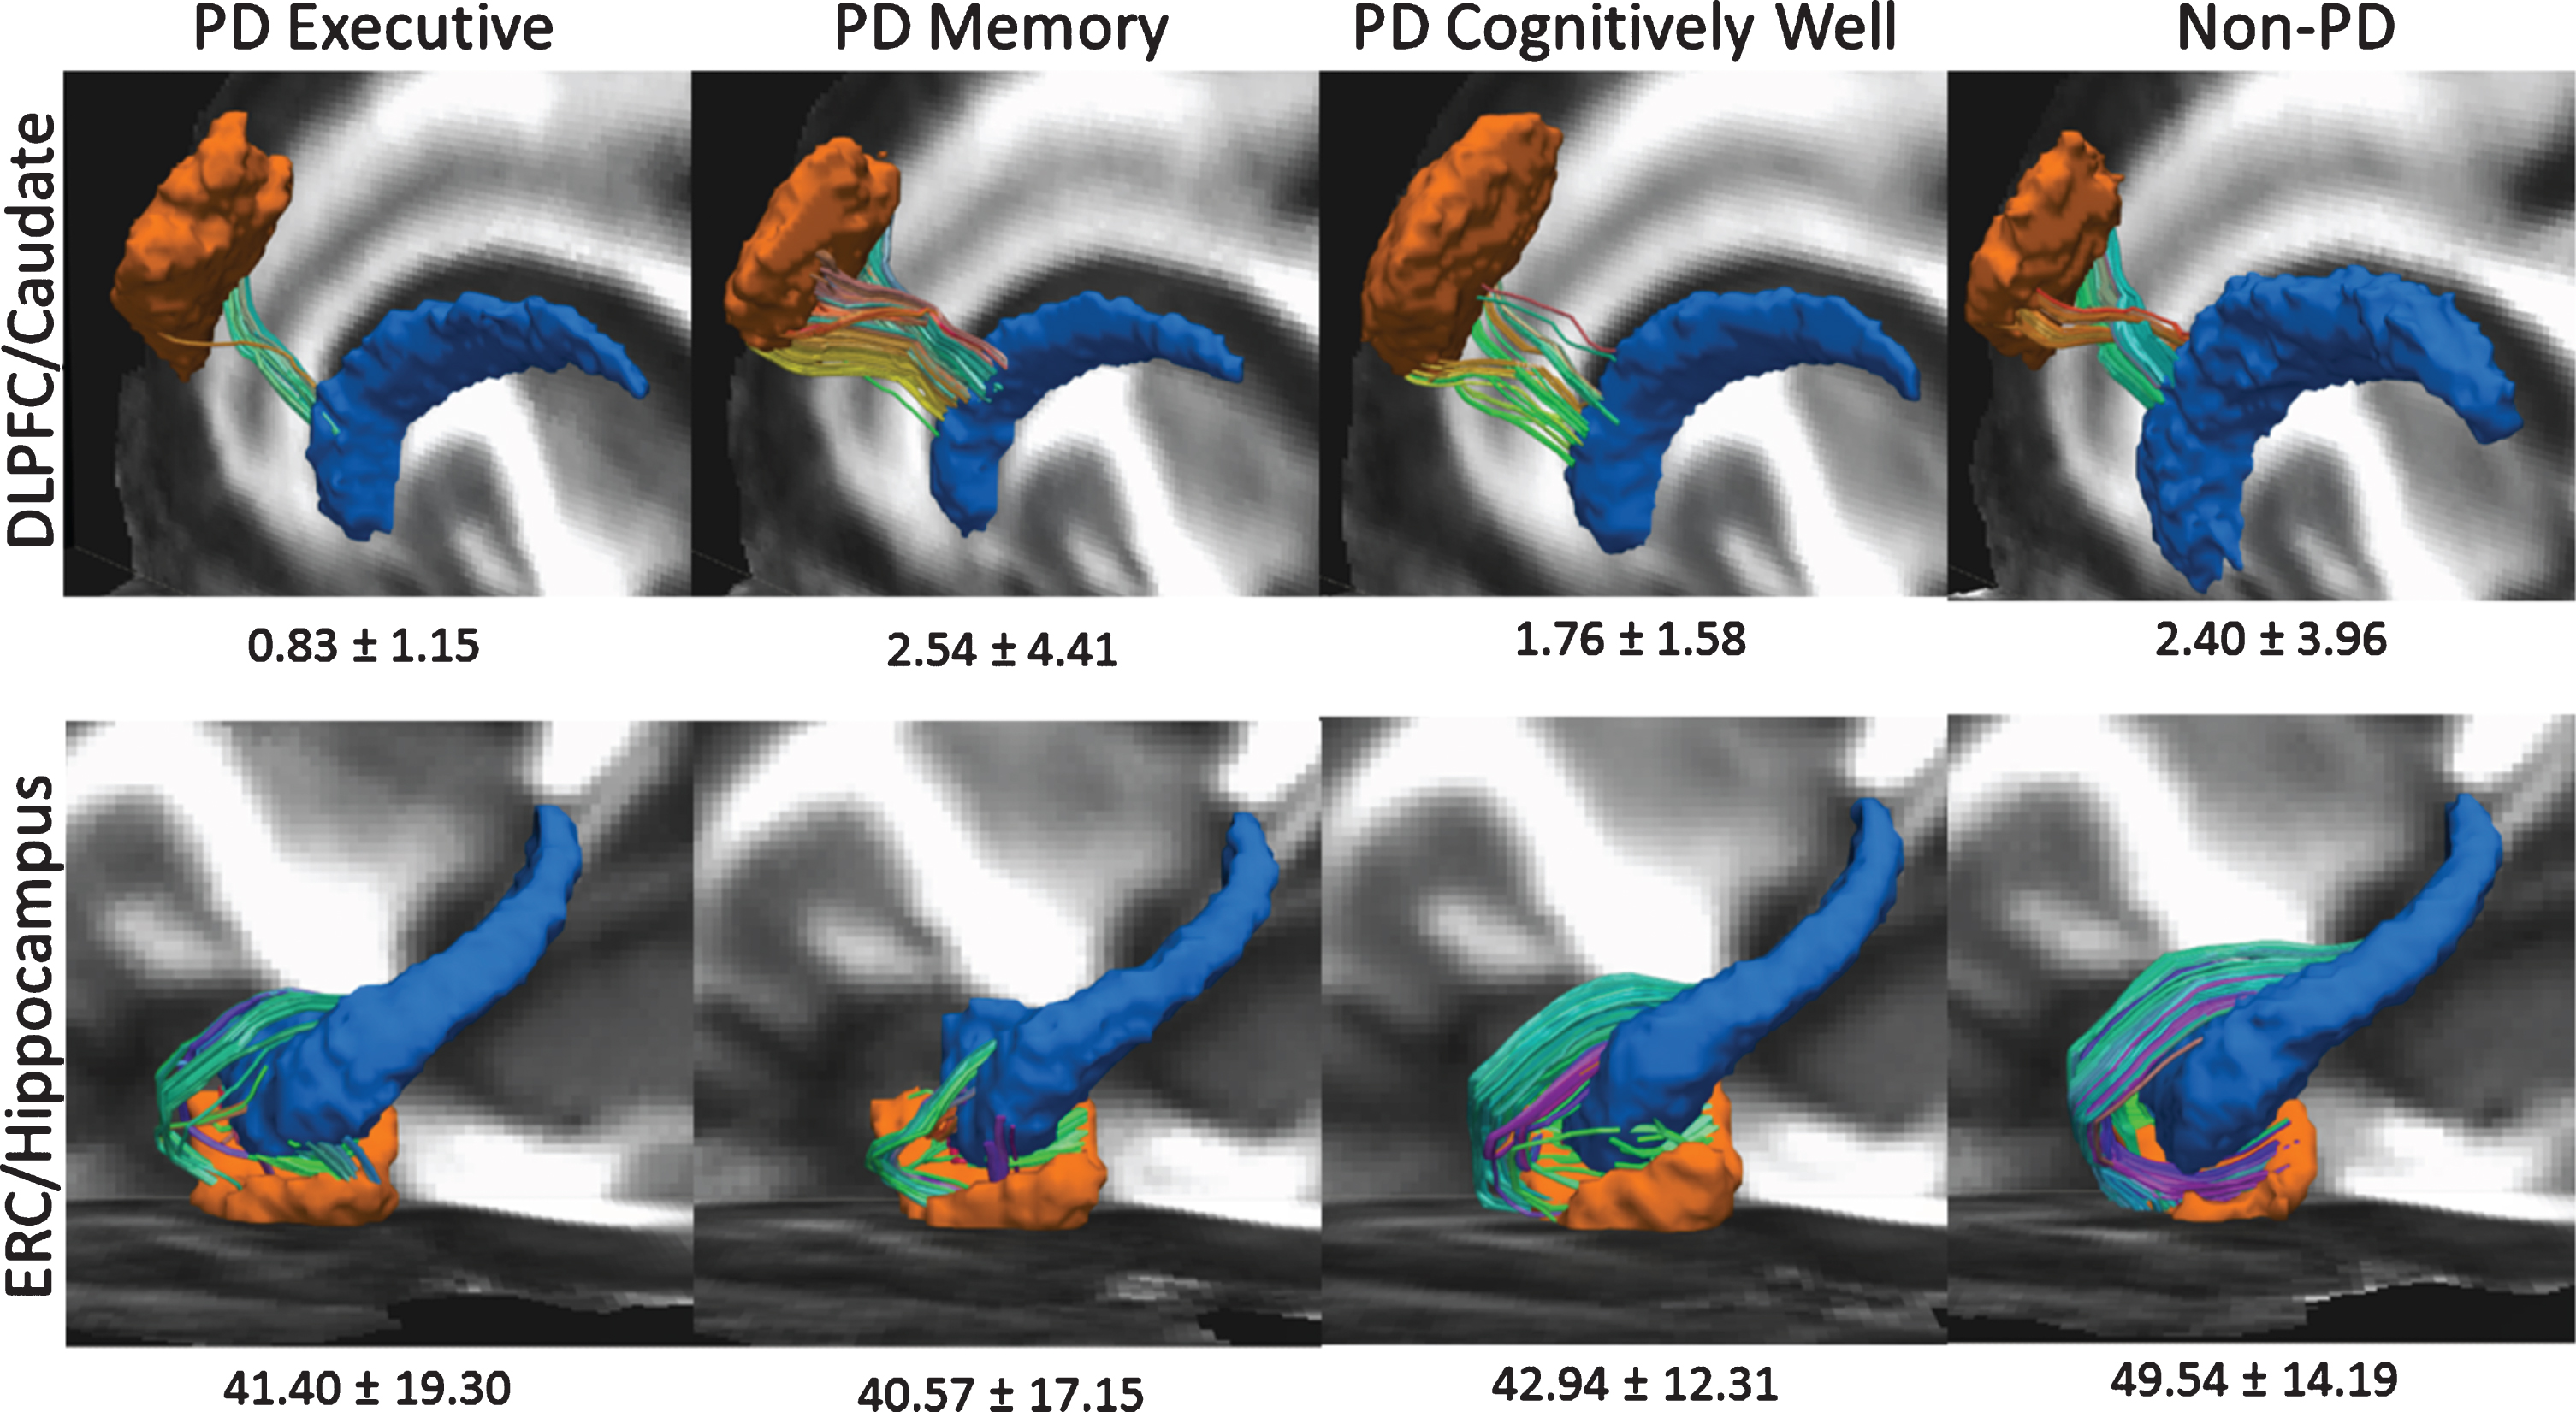
Region of interest Raw Edge Weights by PD Cognitive Phenotype (Executive = 25; Memory = 35; Well n = 56) and Non-PD Peers (n = 62). Left hemisphere shown only. To create this image, FA images from all datasets were first aligned to the FMRIB58_FA template using nonlinear registration. This nonlinear registration was applied each participants’ diffusion data and region of interest masks. Voxel-wise diffusion data averaging was then performed across subjects for each subgroup to create a group-wise averaged diffusion dataset. Deterministic tractography was performed using the parameters and methodology listed above to create a group-wise average tractogram. Registered ROI masks of the dorsolateral prefrontal cortex (DLPFC), caudate nucleus (CN), hippocampus (HIPP), and entorhinal cortex (ERC) for each phenotype group were superimposed and thresholded to create group-wise averaged ROI masks. The tractogram of each group was then filtered using the corresponding ROI masks to obtain the tracts connecting the DLPFC to CN, and the ERC to HIPP. TOP ROW: DLFPC in orange, CN in blue. Bilaterally, PD Executive < all groups after controlling for age, sex, and TICV. BOTTOM ROW: ERC in orange, HIPP in blue. Non-PD>all cognitive PD phenotypes in bilaterally and in right hemisphere; PD < Non-PD the left hemisphere.
ERC-HIPP
Bilateral ERC-HIPP connectivity differed between groups (F[3,165] = 4.09, p < 0.01, ηp2 = 0.069; non-PD>all PD phenotypes, ps < 0.01). Exploration of hemisphere showed a group difference was present for the left hemisphere (F[3,165] = 4.24, p < 0.01, ηp2 = 0.071) but only PD Memory was lower than non-PD peers (p < 0.01), while all three PD phenotypes differed from non-PD peers in the right hemisphere (ps < 0.03). These findings were unchanged after correcting for disease duration.
DISCUSSION
The present study reliably separated individuals with idiopathic PD into three cognitive phenotypes, which differ in a manner consistent with prior literature relating cognition, disease duration, and mood variables. Even after correcting for disease duration, the cognitive phenotypes differed in gray and white matter volume and showed different structural white matter connectivity, with particularly pronounced and lower connectivity between the dorsolateral prefrontal cortex and the caudate nucleus only for PD individuals with executive dysfunction. Each PD group had reduced bilateral white matter connectivity between the entorhinal cortices and hippocampi relative to non-PD peers. Exploratory hemispheric analyses suggest this reduction for PD is largely based on right HIPP-ERC weaknesses; only the PD Memory phenotype had lower connectivity in both the left and right hemisphere. Collectively, these findings provide convincing evidence that individuals with PD can be differentiated into cognitive phenotypes based on performance on executive and memory measures, and that these phenotypes warrant additional neuroscientific investigation. In the paragraphs below we discuss the data relative to phenotype demographics and cognitive profile patterns, brain volume and vascular disease findings, and white matter connectivity results.
Cognitive and behavioral profile differences by PD phenotype
The PD phenotype cluster shows that approximately 48% of our participants with PD were classified as cognitively well, with remaining classified as PD Executive (∼22%), and PD Memory (∼30%). These two cognitive phenotypes performed almost 1.5 standard deviations below their peers in respective executive or memory domains. Although the PD Executive and Memory phenotypes also showed significantly lower language and visuospatial composites relative to the non-PD peers, we note the scores are in the average range suggesting these cognitive functions were not a dominant area of weakness at the time of testing. The PD Cognitively Well group did not statistically differ from the non-PD peers in terms of cognition and performed average or higher in all domains.
Cognitive phenotypes differed in disease duration and mood symptoms, with findings consistent with expectations. PD Executive averaged nine years of disease duration—approximately three years longer than PD Memory and two years longer than PD Cognitively Well. Longer disease duration is associated with increases in a number of motor and nonmotor symptoms, including worsening bradykinesia and rigidity, more frequent freezing of gait, declining balance, increased sleep disturbances, and reduced heart rate variability [73]. This association between longer disease duration and motor symptoms is reflected in our data; the PD Executive phenotype averaged 4 points higher on the on-medication UPDRS motor subscore than the PD Cognitively Well phenotype, reflecting a 23.8% difference in on-medication motor symptom severity. This difference was not significant (p = 0.08), but nonetheless suggests a possible association between disease duration and motor symptom severity for our PD Executive phenotype sample. Furthermore, executive function also declines with longer disease duration [74]. Therefore, the PD Executive phenotype’s disease-related variables are largely consistent with the existing literature. The PD Memory, however, had relatively similar disease duration to the PD-Well with an average of 6 and 7 years, respectively. Despite this, the PD Memory phenotype has dominant memory weaknesses ( 1.5 standard deviations below the PD Cognitively Well and non-PD peers). Research to date has limited information on individuals with PD and a primary memory deficit, but has noted that memory deficits in PD associate with abnormalities in temporal regions [4, 75].
In contrast to the PD Executive and Memory cognitive phenotypes, the PD Cognitively Well phenotype is notable for cognitive performance on par with non-PD peers despite similar disease duration to PD Memory peers and comparable levodopa dosage to other phenotypes. They showed milder motor symptoms than the other phenotypes, with the on-medication UPDRS III four points lower than both other phenotypes. Some of this may be due to their higher level of education, as PD Cognitively Well averaged almost one additional year of education than the other two phenotypes. This suggests higher cognitive reserve [76, 77]. Education is a major component of cognitive reserve, and higher education in PD associates with better global cognition, attention, visuospatial functioning, executive functioning and memory [78], as well as less severe PD motor symptoms [79], which may explain the lower symptom severity within this phenotype. This underscores the importance of considering degree of education when assessing current cognitive function and prognosis of individuals presenting with PD.
In addition to varying disease duration, the phenotypes differed in mood symptom severity. This is important to mention given the relevance of this symptom to cognition and brain profiles. The PD Executive phenotype had significantly more severe depressive and apathy symptoms than other phenotypes, though all three phenotypes had significantly more severe depressive symptoms than non-PD peers. These findings are consistent with the extant literature, which consistently finds associations between apathy and executive function, as well as associations between depression and both executive function and memory [80]. In addition, given that the PD Executive phenotype also had the highest disease duration, this finding is consistent with prior literature reporting depressive and apathy symptoms increase over the disease course [81]. Thus, the findings in both disease duration and mood variables are consistent with prior research, lending further validity to the derived cognitive phenotypes.
Phenotype structural neuroimaging profiles
As expected, phenotypes showed distinct subcortical white matter, subcortical gray matter volume, and gray-white matter connectivity differences even after correcting for disease duration. PD Executive had less overall subcortical gray than non-PD peers and the lowest putamen, thalamus, and white matter volumes as well as the largest ventricles of the three phenotypes. This pattern was present without significant group differences in vascular disease risk markers, dopaminergic medication or anticholinergic medication dosages. These findings, combined with the cortical gray matter volume differences, suggest that the PD Executive phenotype has a unique subcortical gray and white matter profile differentiating them from their PD Memory and PD Cognitively Well peers. This is consistent with prior research, which has demonstrated an association between white matter integrity and executive function performance in PD [82, 83].
It is important to emphasize that while PD Executive had lower executive function than the other phenotypes, their cognitive impairments are generally mild; some individuals within the group might not be classified as impaired within clinical settings. However, given that they display significant subcortical and white matter volume reduction, this group may be more likely to convert to PD dementia than other phenotypes. Prior research has shown that PD pathology in subcortical regions and white matter generally predates cortical atrophy [84]; cortical atrophy is more typical of individuals with PDD [85]. Therefore, the Executive participants may be at the most risk for further cognitive decline. Follow-up analyses should determine whether those in this phenotype convert to PDD at a higher rate than other phenotypes. In addition to widespread volumetric differences, PD Executive had significantly lower DLPFC-CN white matter structural connectivity than other phenotypes. This is consistent with established theory suggesting structural abnormalities in corticostriatal circuits influence executive dysfunction in PD [15, 82].
In contrast to the widespread brain abnormalities in PD Executive, the PD Memory phenotype showed lower left ERC-HIPP connectivity relative to non-PD peers, with no evidence of significantly reduced cortical gray, subcortical gray, or white matter volumes. This suggests focal white matter neurodegeneration in the area of the perforant pathway without broader apparent atrophy in adjacent gray matter—a finding consistent with previous reports of lower temporal lobe white matter connectivity for non-demented PD with memory weaknesses (e.g., retrosplenial to entorhinal cortex [4]). Previous studies have shown ERC atrophy largely in those with PD dementia [12], although one group showed reduced right entorhinal thickness over time in PD MCI [86]. This reduced connectivity may be secondary atrophy caused by cholinergic denervation, as proposed by the dual syndrome hypothesis [9], or the result of direct synuclein pathology in anterior temporal lobe, which is typically the first region of cortex to show Lewy bodies [13]. If this is the case, our findings suggest that individuals with PD presenting with primary memory deficits might have more temporal synuclein pathology than individuals of other phenotypes. It is also important to note that the nature of the memory deficits in this phenotype might vary between participants, as some individuals with PD show deficits in memory encoding, while others show deficits in memory retrieval [4, 43]. Further investigations of memory deficits in PD should focus on comparisons in temporal region and differentiate deficits in encoding vs retrieval.
The PD Cognitively Well group had lower putamen volume and lower connectivity between the right entorhinal cortex and hippocampus than non-PD peers. We previously reported on extensive putamen and hippocampal morphometric differences in a subgroup of this sample [87]. Thus, the differences from non-PD peers in putamen and hippocampal regions for the PD Cognitively Well group are not surprising. It is possible these regions serve as sensitive markers of PD without cognitive phenotype specificity.
Other considerations
It is useful to compare our group findings relative to the dual syndrome hypothesis. This hypothesis proposes that dopaminergic denervation contributes to working memory and inhibitory difficulties in PD, while cholinergic denervation contributes to learning/memory and accompanying visuospatial difficulties. While we do report two distinct executive and memory phenotypes in PD, there is no compelling difference between these two groups on measures of language or visuospatial function. Relative to the non-PD and PD Cognitively Well, only the Executive phenotype performed significantly worse on a measure of visuospatial function. Perhaps participants in the PD Executive group are experiencing some of the cholinergic denervation proposed to drive the visuospatial and semantic fluency deficits suggested in the dual syndrome hypothesis [9]. Prefrontal cholinergic activity is associated with executive function [88], and cortical cholinergic denervation is associated with executive dysfunction in PD [89]. The Memory phenotype, by contrast, may reflect temporal dysfunction not directly driven by the cholinergic system, different levels of amyloid-β and tau [90], or altered levels of alpha-synuclein [91–93]. These are areas for future research.
It is also useful to consider the possible relationship between motor and cognitive phenotypes in our sample, as some researchers show relationships between motor profiles and cognitive weaknesses, e.g., [94], and cognitive change over time, e.g., [95]. To address topic, we report here on a post-hoc analysis of motor phenotype classification using our on-dopaminergic medication UPDRS cluster scores for tremor dominant (TD) and postural instability/ gait difficulty (PIGD) [34, 96]. Our participant sample classified as 31.6% TD, 28.9% intermediate, and 39.5% PIGD classification. Motor groups did not significantly differ in memory or executive profile composites (all p’s > 0.80) or by edge weight structural measurements (all p values > 0.21). These post-hoc findings suggest on-medication motor type does not predict the cognitive phenotypes defined in this investigation.
While we do recognize limitations for assessing cognition in PD while on dopaminergic medication, we planned this approach so that participants would be more comfortable and able to provide best effort. Being on-medication, however, may have stabilized executive function subdomains (processing speed, working memory, inhibitory function) without improving memory function [97]. This might explain why the PD Executive phenotype was the smallest of the three, despite executive dysfunction being the most typical deficit in PD [6]. It might also explain our higher percentage of participants in the Cognitively Well phenotype. For these reasons, we encourage future research to consider if cognitive phenotypes differ on versus off dopaminergic medication and if these profiles relate to motor type presentation and disease progression.
Other considerations include the homogeneous demographics, standardization approach, focus on structural imaging only, and need for replication. Our sample is highly educated and Caucasian and so the sample findings cannot be extended to other demographic samples. Regarding our cognitive metrics, our memory measures were verbally biased, limiting our appreciation for memory for more visual based information. This may be particularly important to the right ERC-HIPP connectivity role in our PD phenotypes. In addition, the cluster analysis used z-scores from published normative test sources which may not reflect sociodemographics of the current study sample. Due to our concern for normative referenced potential bias on our cluster analyses, we replicated (post-hoc) the cluster analyses using age and education corrected z-scores based on our local non-PD sample. These post-hoc analyses show adequate agreement to our original normative reference clusters (102/116 clustered in the same domains; 87.9% agreement). We encourage future researchers to consider the value of published versus local normative reference groups for their sample of cognitive phenotypes [98]. For imaging methodology, we exclusively examined structural brain variables. There is extensive literature, however, demonstrating resting state network dysfunction in PD [99]. Future analyses should examine differences in resting state function between these phenotypes, particularly the interaction between established resting state networks such as the default mode network and salience network. Finally, although we used an a priori hypothesis approach and report results with effect sizes, we recognize the findings need replication.
Despite limitations and the need for follow-up research, the current study has many design strengths. These include the prospective and hypothesis driven nature of the investigation, recruitment of individuals who received the same cognitive and neuroimaging protocols to strategically examine gray-white matter connectivity regions of interest using tractography methods, and the comprehensive neuropsychological test protocol providing opportunity to assess cognitive phenotypes even among individuals with largely average cognition. Cognitive phenotypes were also considered relative to demographic and clinical characteristics, vascular markers, dopaminergic medication dose, anticholinergic medications, and depressive and apathy symptoms. The results provide convincing evidence that individuals with idiopathic non-dementia PD can be differentiated into cognitive phenotypes based on performance on executive and memory measures, and that these phenotypes present with unique neuroimaging profiles at least from a structural standpoint.
CONFLICT OF INTEREST
The authors have no conflict of interest to report.
Footnotes
ACKNOWLEDGMENTS
This work was conducted at the University of Florida. Sources of funding include NINDS R01 NS082386 (CP), K23 NS060660 (CP), and T32-NS082128 (DB, SC on training grant), as well as UL1TR001427 (UF CTSI). The content is solely the responsibility of the authors and does not necessarily represent the official views of the National Institute on Aging or the National Institutes of Health.
We wish to sincerely thank the participants who provided time and effort towards this investigation. Without them, this study and research would certainly not have been possible. Also thank you to the research coordinators Donna Weber and Kristy Ayers for their valuable time in study coordination and assistance. Additional thanks to Michael Okun, M.D., UF, for his study encouragement.