
Abstract
Background:
Individuals with Parkinson’s disease (PD) experience significant vocal communication deficits. Findings in the Pink1–/– rat model of early-onset PD suggest that ultrasonic vocal communication is impaired early, progressively worsens prior to nigrostriatal dopamine depletion, and is associated with loss of locus coeruleus neurons, brainstem α-synuclein, and larynx pathology. Individuals with PD also demonstrate ventilatory deficits and altered sensory processing, which may contribute to vocal deficits.
Objective:
The central hypothesis is that ventilatory and sensory deficits are present in the early disease stages when limb and vocal motor deficits also present.
Methods:
Pink1–/– rats were compared to wildtype (WT) controls at longitudinal timepoints. Whole-body flow through plethysmography was used to measure ventilation in the following conditions: baseline, hypoxia, and maximal chemoreceptor stimulation. Plantar thermal nociception, and as a follow up to previous work, limb gait and vocalization were analyzed. Serotonin density (5-HT) in the dorsal raphe was quantified post-mortem.
Results:
Baseline breathing frequencies were consistently higher in Pink1–/– rats at all time points. In hypoxic conditions, there were no significant changes between genotypes. With hypercapnia, Pink1–/– rats had decreased breathing frequencies with age. Thermal withdrawal latencies were significantly faster in Pink1–/– compared with WT rats across time. No differences in 5-HT were found between genotypes. Vocal peak frequency was negatively correlated to tidal volume and minute ventilation in Pink1–/– rats.
Conclusion:
This work suggests that abnormal nociceptive responses in Pink1–/– rats and ventilatory abnormalities may be associated with abnormal sensorimotor processing to chemosensory stimuli during disease manifestation.
INTRODUCTION
Parkinson’s disease (PD) is the second most common neurodegenerative disorder, affecting approximately 10 million people worldwide [1]. Although PD is often associated with hallmark motor signs, such as tremor, postural instability, and bradykinesia, there are numerous non-classical or ‘other’ sensorimotor, sensory, and autonomic dysfunctions that occur often in the preclinical stages of the disease, as reviewed in Schapira, Chaudhuri, & Jenner, 2017 [2]. However, the onset, progression, and underlying pathology of these non-classical signs are poorly understood.
Approximately 90% of PD individuals develop dysarthria (disordered voice/speech) that impairs communication and quality of life [3–9]. Changes to general respiratory function such as dyspnea, reduced chest wall compliance/volume, inspiratory weakness, and reduced voluntary cough as well as changes to speech breathing (abnormal lung volume initiation and expenditure, inappropriate pauses, shorter utterances) have been well-documented [10–18] (for a review, see [11, 18]). Further, sensory alterations in the oropharynx [19], larynx, [20, 21], and extremities [22] have been reported in addition to increased pain sensation [23, 24]. These sensory abnormalities can precede the onset of classical motor signs.
Sleep disordered breathing [25–27] and reduced chemosensory-stimulated ventilatory responses [28] may appear early in disease progression, possibly due to initial pathologic changes in brainstem areas critical to ventilatory control. Despite these reports of ventilatory impairment in PD, the mechanisms underlying these breathing alterations remain unclear. Because deficits in brainstem-mediated behaviors such as ventilation, speech, and sensory processing appear early in the disease process, further study of the onset, progression, and underlying pathology is warranted.
Genetic rodent models of PD provide an opportunity to identify and quantify early- and mid-stage behavioral deficits and related pathology associated with PD. Mutations in the phosphatase and tensin homolog-induced putative kinase 1 (Pink1) gene are the second most common cause of autosomal recessive PD [29, 30] and are also implicated in sporadic cases [31, 32]. Pink1, together with Parkin, maintain a pathway critical for mitochondrial integrity and function [33, 34]. The Pink1 gene is hypothesized to protect cells during stress-induced mitochondrial dysfunction [35]. Loss of function mutations in Pink1 results in mitophagy and autophagy of the mitochondria [36, 37]. Previous work has shown that Pink1–/– rats develop metabolic and mitochondrial pathogenesis [38] as well as sensorimotor deficits and nigrostriatal dopamine cell loss [39] in the early stages; thus, they are a useful model to study early sensory, motor, or autonomic changes associated with PD. In our previous work, Pink1–/– rats also show early, progressive ultrasonic vocalization and oromotor deficits correlated with reduced tyrosine hydroxylase immunoreactivity in the locus coeruleus, as well as α-synuclein neuropathology in regions important for cranial sensorimotor control such as the nucleus ambiguus and periaqueductal grey [40, 41]. However, there has been little investigation of other monoamine neurotransmitters, including serotonin, as there is a strong link between serotonin loss, PD, and respiratory function [42–46]. Moreover, the impact of the loss of Pink1 function on other early signs of PD such as ventilation and sensation (nociception) has not been characterized.
To address these important gaps in knowledge, we quantified ventilatory responses at baseline as well as under hypoxia and maximal chemoreceptor stimulation in Pink1–/– and wildtype (WT) rats at 2, 4, 6, 8, and 10 months (mo) of age. We hypothesized that Pink1–/– rats would show progressive declines in respiratory function that may be linked to vocalization behavior. In addition, limb withdrawal latency times in response to a thermal stimulus (nociception) were also assessed over time; we hypothesized that Pink1–/– rats would have increased latencies due to abnormal nociceptive processes and bradykinesia. Limb motor function on a tapered balance beam and cylinder, as well as vocal motor (ultrasonic vocalizations) were assayed to benchmark disease progression at 10 mo of age, as this time point had not yet been characterized. At 10 mo of age, serotonin was quantified in the dorsal raphe with the specific hypothesis that Pink1–/– animals would have reductions in densities compared to WT.
MATERIALS AND METHODS
Animals, housing, and habituation
Male Long-Evans rats (Pink1–/– n = 10, WT n = 10) (SAGE Laboratories (Horizon Discovery Group®) Boyertown, PA; [39]) were housed in same-sex pairs (like genotypes paired together) in standard polycarbonate cages (17 cm×28 cm×12 cm) on a 12 hr reverse light cycle, with all testing occurring during the dark period in partial red-light illumination. All rats arrived at 6 weeks of age and were handled and acclimated to the study tasks for at least 2 weeks prior to the first testing cycle. Food and water were provided ad libitum. Core body temperatures were taken rectally with a rodent temperature sensor (RET-2, Physitemp Instruments Inc., Clifton, NJ). Rats were placed in a rodent basket for body weight measurement (Mettler Toledo Scale, ML1501E NewClassic SG, Columbus, OH). All rats were tested at 4, 6, 8, and 10 mo of age for ventilatory function and 2, 4, 6, 8, and 10 mo for thermal nociceptive function. Limb motor (tapered balance beam measures, cylinder assay) and vocal motor (ultrasonic vocalizations) were assayed at 10 mo of age. All rats were immediately euthanized after behavioral testing at 10 mo. The experimental timeline is outlined in Fig. 1. Additional females from the stock colony (WT, Long Evans) were used in the ultrasonic vocalization experiment to elicit male calls, but data were not collected on these rats. All procedures were approved by the University of Wisconsin-Madison Animal Care and Use Committee (Protocol Numbers: M005177, V005473) and were conducted in accordance with the Guide for the Care and Use of Laboratory Animals (NIH, Bethesda, MA) as well as the Use of Animals and Humans in Research published by the Society for Neuroscience.
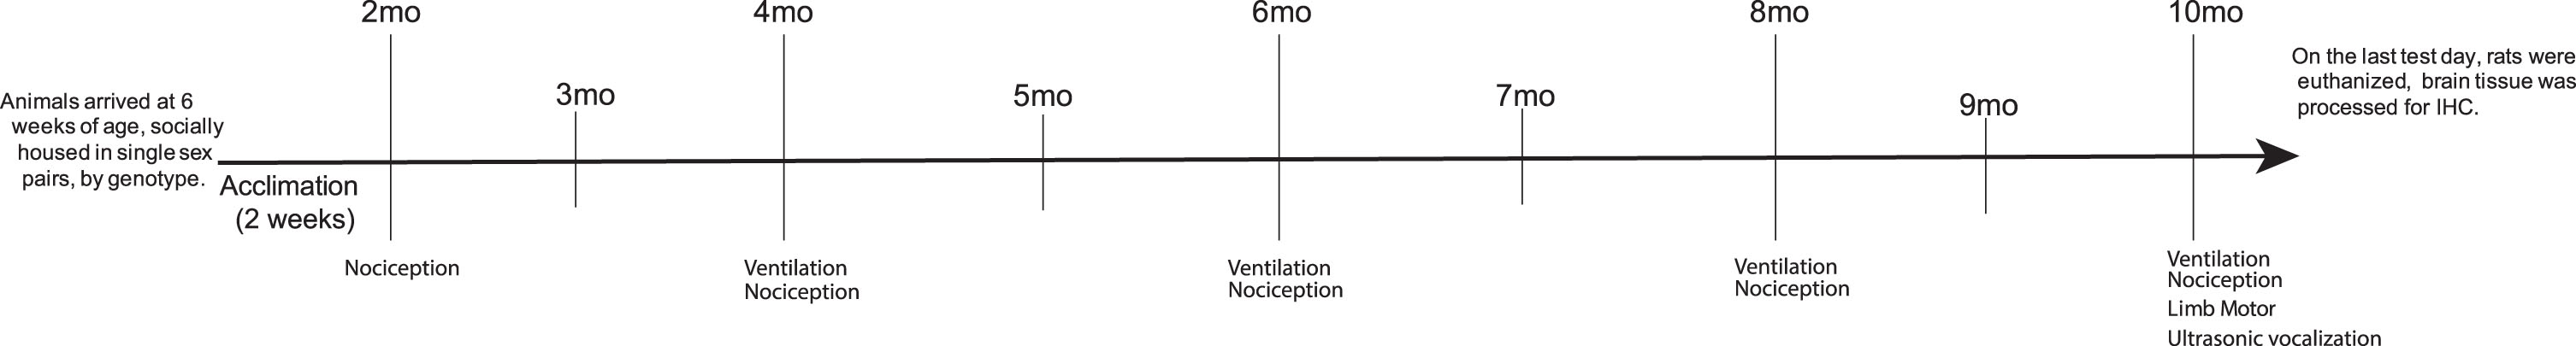
Experimental timeline. Outline of the behavioral assays by timepoint. mo, month.
Ventilation experiments
At each testing time point, ventilatory responses at baseline and to hypoxia and maximal chemoreceptor stimulation (MCS; hypoxia/hypercapnia) were assessed in unanesthetized, unrestrained WT and Pink1–/– rats using a whole-body flow through plethysmograph (Data Sciences International., St. Paul, MN). This technique allows for quantitative measurement of ventilation in unanesthetized, freely behaving animals while simultaneously controlling inspired gas concentrations. Briefly, a pressure calibration signal, the plethysmograph temperature, and ambient and chamber pressures were used by the computer software to continuously calculate breath-by-breath ventilatory variables using the equations described by Drorbaugh and Fenn (1955) [47] as modified by Jacky (1978) [48]. Data were rejected if there was evidence of pressure fluctuations caused by gross body movements or sniffing behavior.
Similar to previously published protocols [49], rats were weighed (g), body temperatures were recorded, and then rats were individually placed into the plethysmograph chamber (approximately 2 L volume) while breathing room air (21% oxygen, balance nitrogen) flushed through the chamber at approximately 4 L/minute. Once the rats were quiet, but awake (∼30–60 min following placement into the chamber), ventilatory measurements were recorded continuously for at least 30 min during baseline conditions (21% oxygen, 0% carbon dioxide, balance nitrogen), followed by 10 min of hypoxia (11% oxygen, balance nitrogen), and 10 min of maximal chemoreceptor stimulation with a combination of hypoxia and hypercapnia (11% oxygen, 7% carbon dioxide, balance nitrogen). At the conclusion of the testing session, rats were removed from the chambers and body temperatures were rerecorded. The data used in analysis for each rat was collected during the last 5 min of each exposure period.
Ventilatory variables were averaged for each genotype under three conditions: in normocapnia/normoxia (baseline), hypoxia, and hypoxia/hypercapnia (maximal chemoreceptor stimulation, MCS) at each timepoint (4, 6, 8, 10 mo). Measurements included breathing frequency (f), inspiratory time (TI), expiratory time (TE), tidal volume (VT), minute ventilation (the product of breathing frequency and tidal volume,
Sensorimotor responses: Nociception
Thermal sensitivity as an indicator of nociceptive threshold was measured using the latency of hindlimb withdrawal from a radiant heat stimulus [50]. Thermal withdrawal latencies were evaluated in all rats using a commercial thermal latency device (Plantar Analgesia Test Apparatus, Ugo Basile, Varese, Italy), similar to previously published protocols [51]. Stimulus intensity and rate of heating of the thermistor was kept constant throughout the study to establish an average of 9–10 s withdrawal latency in a normal animal during initial baseline readings. Maximal time of heat exposure for all measurements was cut off at 20 s to prevent thermal burns. A focused thermal heat stimulus was applied to the plantar surface of each hind paw and the time until the paw was lifted in response to the stimulus was defined as the ‘latency interval’. Rats were habituated to the restraint device for at least 10 min prior to experimentation. Each rat was tested three times with at least 5 min between trials. The mean latency response was calculated. This pattern allowed sufficient time between latency measurements to prevent learned responses or the development of hyperalgesia secondary to repeated noxious stimuli in quick succession [52]. Although both feet were tested, for consistency, only the average left hind paw latency was used in the statistical analysis.
Limb motor function: tapered balance beam and cylinder locomotion
Two assays were used to evaluate limb motor function at 10 mo of age. Rats were assessed for overall limb motor function while they traversed a 165 cm long tapered balance beam [53]. The total time to cross the whole beam (s), time to cross the last 1/3 of the beam (s), and the total number of foot faults were averaged over the five trials per rat. The average was compared statistically between genotypes. Additionally, the cylinder assay of overall limb motor activity was used to compare the number of hindlimb movements, forelimb movements, and total number of rears+lands in a transparent cylinder (20 cm×30 cm) [54]. All analysis was done by experienced raters, masked to genotype and testing conditions.
Vocal motor: Ultrasonic vocalizations
At 10 mo of age, recordings were made by using an ultrasonic microphone (CM16; Avisoft, Berlin, Germany) with 16-bit depth and a sampling rate of 250-kiloHertz (kHz). The microphone was mounted 15 cm above a standard polycarbonate rat cage (17 cm×28 cm×12 cm). Experimental rats were placed alone in their home cage with a sexually receptive (in estrus) female. When the male demonstrated signs of interest in the female (e.g., sniffing, mounting, chasing), the female was removed, and the male ultrasonic vocalizations were recorded for 90 s. Testing and recording was done in a sound-proof room using an ultrasonic microphone with high directional recording properties (CM16 Avisoft, Germany), a flat frequency range of up to 150 kHz, and a working frequency response range of 10–180 kHz.
The offline acoustic analysis was performed with a customized automated program in SASLab Pro (Avisoft). Spectrograms for each rat were built from each waveform with the frequency resolution set to a fast Fourier transformation of 512 points, a frame size of 100%, a flat top window, and the temporal resolution set to display 75% overlap. The vocalization analysis was performed by experienced undergraduate and graduate student raters masked to genotype. Each call was visually and acoustically inspected, a 25 kHz filter was applied to eliminate noise below this threshold, and the ultrasonic calls were manually classified, and statistical analysis focused on the frequency modulated (FM) call types [40, 55]. The total number of calls and percent of complex calls were collected and analyzed. Additionally, the following acoustic variables were analyzed: average duration in s, average bandwidth in Hertz (Hz), average peak frequency in kHz, and average intensity in decibels (dB), range of intensity (dB) [56, 57].
Tissue processing and serotonin immunohistochemistry
After testing concluded at 10 mo, all animals were deeply anesthetized with 5% isoflurane, transcardially perfused with 200 mL of cold saline (0.9%) followed by 500 ml of cold 4% paraformaldehyde. Fixed brains were excised, post-fixed for 24 h in 4% paraformaldehyde at 4°C, cryoprotected in 0.02% sodium azide in 0.1 M PBS solution. Brains were mounted on a freezing microtome and 40 μm coronal sections were harvested throughout the cortex and brainstem. Free-floating sections were stored in cryoprotectant at –20°C until they were stained for serotonin immunoreactivity over every 5th section.
Briefly, tissue sections were rinsed in 0.01 M phosphate buffered saline (PBS, pH = 7.4) with 0.3% Triton X-100 (PBS-T), incubated in 0.5% H2O2 for 15 min, blocked in 20% normal goat serum (NGS, Equitech-Bio Inc, Kerrville, TX) made in PBS-T for 60 min, and then agitated and incubated overnight in primary solution at 4°C (anti-5-HT, 1 : 10 K, ImmunoStar #20080, ImmunoStar, Hudson, WI). Sections were rinsed in PBS-T and incubated in conjugated biotinylated secondary solution for 2 h at room temperature (goat anti-rabbit IgG, 1 : 500; EMD Millipore, Madison, WI), rinsed in PBS-T, incubated in avidin-biotin solution (Vectastain Elite ABC, Vector Laboratories, Burlingame, CA) for 1 h, rinsed and the avidin–biotin complex was labeled using filtered 3,3-diaminobenzidine (DAB Easy Tablets, Acros®, Thermo Fisher Scientific, Waltham, MA). Tissue was rinsed, float mounted onto gelatin-coated slides, dried overnight, dehydrated in a graded series of alcohols and xylenes, and coverslipped. Antibody specificity was verified by omitting the primary step.
For image analysis, at least two anatomically equivalent sections that contained the dorsal raphe (Fig. 2A, B) were selected from each rat. Images (1334×764 pixels; 8-bit) were taken with a DP80 Olympus camera attached to an Olympus BX53 upright microscope (Olympus, Madison, WI) at 10× magnification. Analysis on grayscale images was done using ImageJ Optical Density Macro (National Institutes of Health, Bethesda, Maryland), a density measure on each image, for each animal was generated and averaged. The average optical density for each genotype per brain region was analyzed statistically; final sample size was n = 8 per genotype due to incidental sample loss.
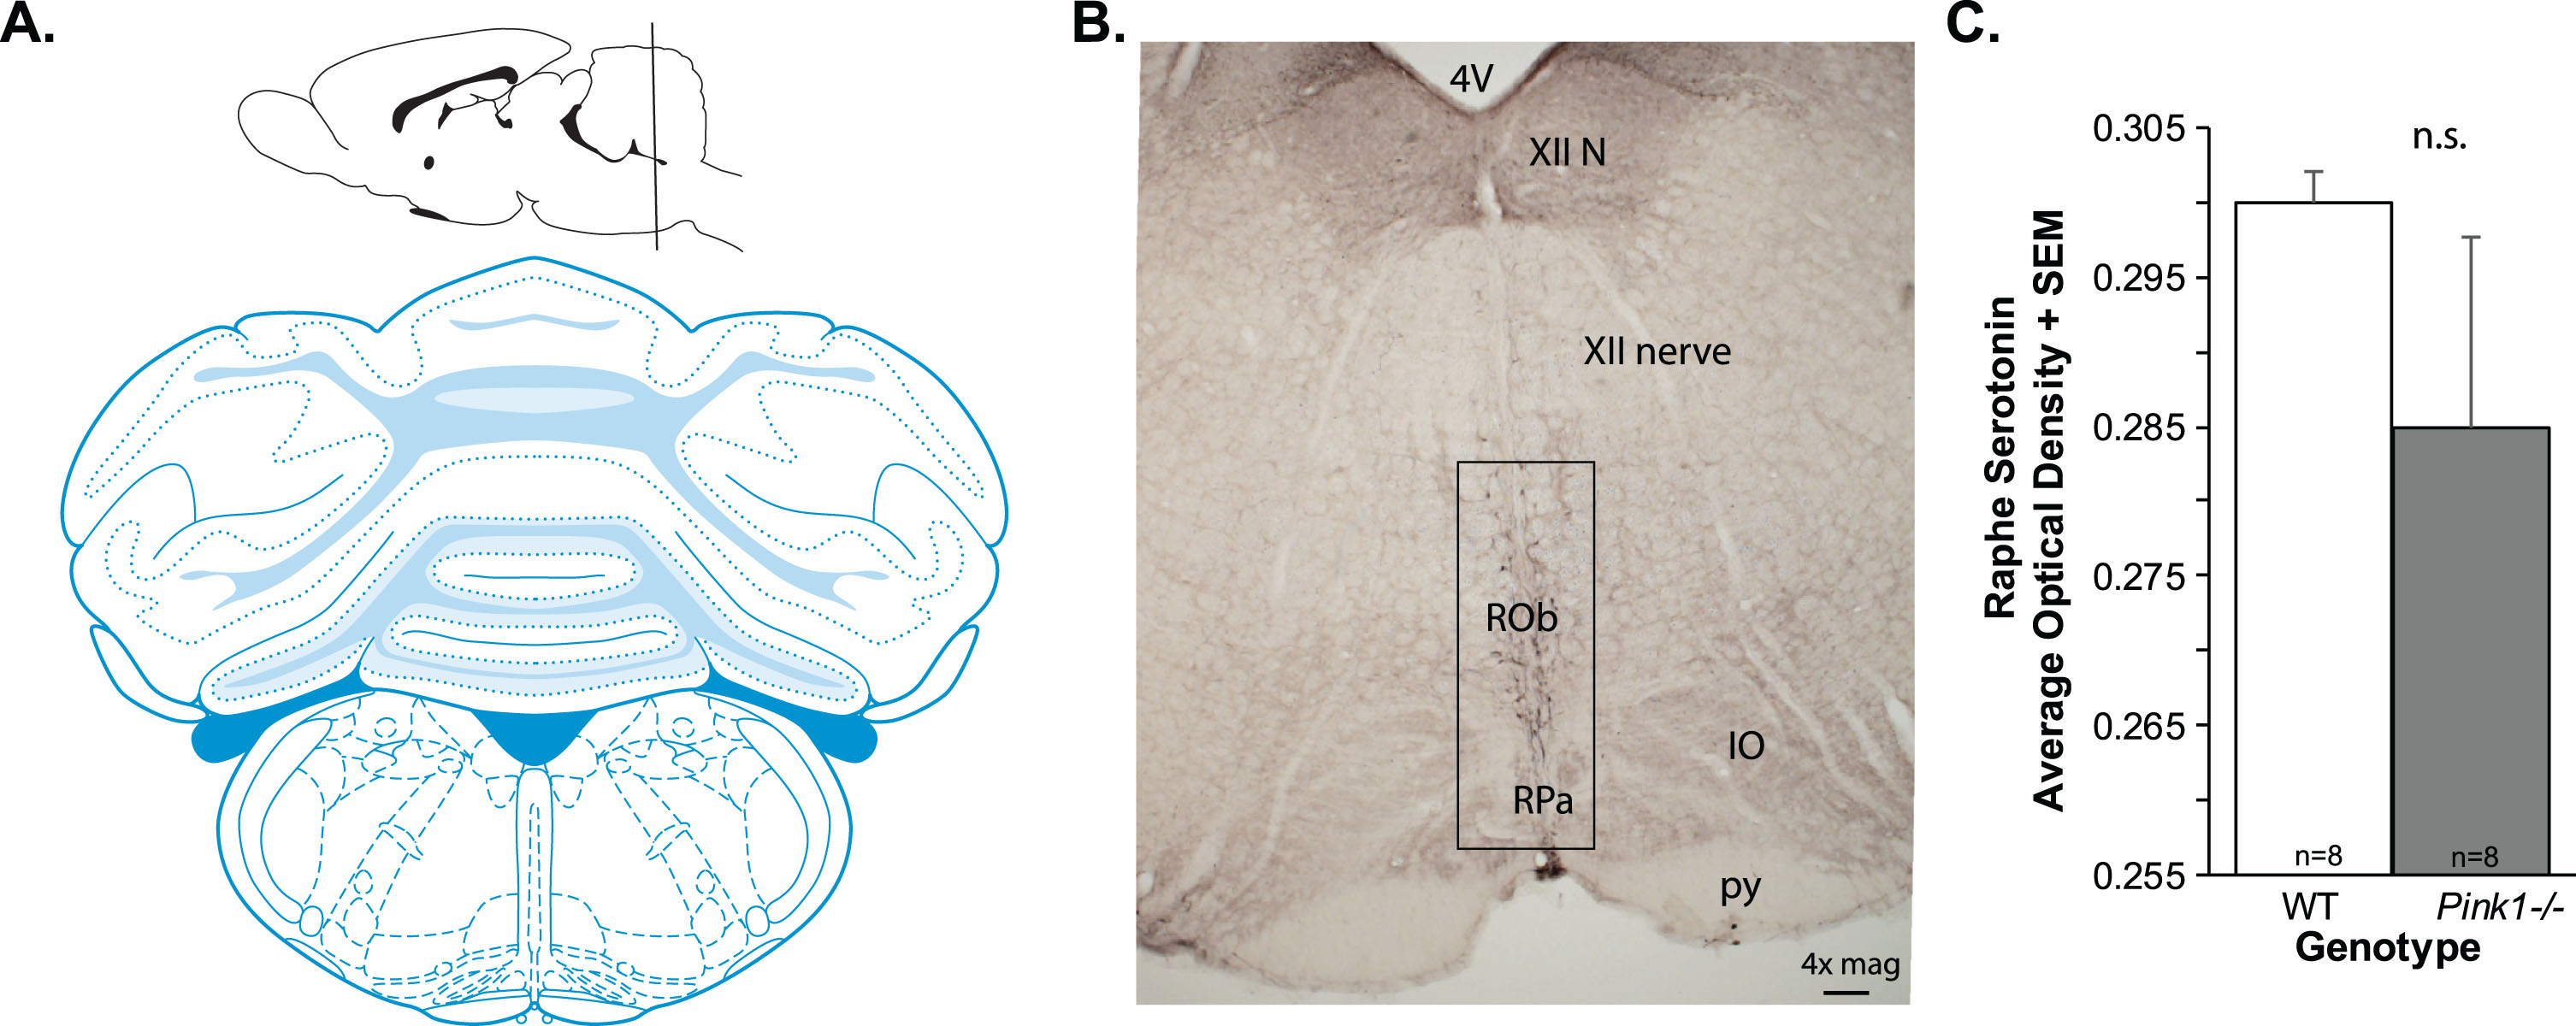
Brain schematic and 5-HT data. A) Coronal brain schematic adapted from Paxinos and Watson (1). B) Representative image of anti-serotonin (5-HT) immunolabeling at 4×magnification. 4 V, 4th ventricle; XII, hypoglossal nerve; ROb, RPa=, IO, inferior olive; py, pyramids. Box shows approximate region of interest. C) 5-HT optical density in the raphe + standard error of the mean (SEM). Wildtype (WT, n = 8) in white bar, Pink1–/– n = 8) in gray bar.
Statistical analysis
All statistical analyses were conducted with SigmaPlot 14.0 (Systat Software, Inc., San Jose, CA). Normality of data distribution was tested with the Shapiro-Wilk test and equal variance was assessed with the Brown-Forsythe test. All data are presented as means and standard error of the means (SEM). Critical level for significance for all testing was set a priori at 0.05. All analyses were executed by laboratory personnel; raters were blinded to condition (including genotype, timepoint, and ventilatory condition). A reliability threshold of minimum 0.90 was met for data analysis.
Body weight: A two-way repeated measure analysis of variance (ANOVA) was used to analyze changes in body weight between genotypes (WT vs. Pink1–/–) and over time (2, 4, 6, 8, 10 mo). All pairwise multiple comparison procedures were analyzed with the Fisher LSD method.
Body temperature: Pre and post body temperatures during ventilation experiments were analyzed with a paired t-test at each timepoint.
Ventilatory function: First, we wanted to examine changes to breathing in normal conditions (baseline) between genotypes and over time. To do so, we used a mixed model repeated measures ANOVA with ventilatory variables as the dependent variables and genotype (WT vs. Pink1–/–) and time (4, 6, 8, 10 mo) as the independent variables. A Fishers’s LSD was used for post-hoc comparison. As a complementary method to analyze the data, we examined changes to ventilatory variables at each specific timepoint for all of the breathing conditions. Separate two-way ANOVAs were run at 4, 6, 8, and 10 mo of age with ventilatory variables as the dependent variables and genotype (WT vs. Pink1–/–) and breathing condition (baseline, hypoxia, maximal chemosensation) as the independent variables. A Fisher’s LSD was used for post-hoc comparison. The second set of analyses is presented as Supplementary Figure 1 and Table 2. This dual approach allows for a more comprehensive examination of interactions between genotype, time, and breathing condition and graphic depiction of data is in multiple forms.
Summary of ventilatory variables, abbreviations, units, and general findings
Means (SEM) for WT and Pink1–/– rats in each of the three testing conditions (baseline, hypoxia, MCS) over time. Statistical significance within variables is indicated by asterisk (*p < 0.05, **p < 0.01, ***p < 0.001)
Thermal withdrawal: Thermal withdrawal latency was compared between groups using a two-way repeated measures ANOVA design with independent variables of timepoint (2, 4, 6, 8, 10 mo) and genotype (WT, Pink1–/–). Assuming Fishers LSD.
Limb motor function and vocal motor function: At the 10 mo timepoint, independent two-tailed Student t-tests were used to make comparisons between genotypes (WT, Pink1–/–) for limb motor variables for both the tapered balance beam and cylinder tests, and ultrasonic vocalization acoustic variables.
Tissue analyses: Independent two-tailed Student t-tests were used to make comparisons between genotypes (WT, Pink1–/–) for optical density measures.
Correlations: Pearson correlation analysis was used to assess the relationships between vocalization measures and ventilatory variables.
RESULTS
Body weight and temperature
Body weight significantly increased in both genotypes at each timepoint. Mean (±SD) weights of Pink1–/– rats were 284.1±19 g, 473±33 g, 568±45 g, 582±52 g and 631±76 g and in WT rats were 285±19 g, 441±39 g, 503±46 g, 536±52 g and 586±69 g at 2, 4, 6, 8 and 10 mo, respectively (all p < 0.05 for all comparisons). Consistent with other publications on this PD model, Pink1–/– rats were significantly heavier than WT rats at each timepoint (all p < 0.05). Body temperatures did not differ pre- and post-plethysmography experimentation at any given time point (all p > 0.05 at each testing timepoint, data not shown).
Ventilation
A summary of the ventilation findings is presented in Table 1. A summary of the ventilatory means (SEM) is in Table 2. In general, Pink1–/– rats have altered respiration frequencies and tidal volumes compared to WT in a resting (baseline) state. There were significant main effects of time for multiple variables; thus, rats in general showed changes to breathing frequency, tidal volume, minute ventilation, and inspiratory flow measures as they aged. Likewise, with hypoxic conditions, all rats, regardless of genotype, showed changes with age for all ventilatory variables. With maximal chemosensory stimulation, there was a genotype and age interaction for breathing frequency but not for any of the other variables tested. Results presented below describe interactions (genotype×time), main effect of time, and main effect of genotypes.
Baseline ventilation
There was no significant genotype×timepoint interaction for baseline breathing frequency (F(3, 54) = 0.804, p = 0.50). There was a significant main effect of genotype on breathing frequency (F(1, 54) = 10.98, p = 0.004; Fig. 3A); specifically, Pink1–/– rats had increased breathing frequency compared to WT rats. Additionally, there was a main effect of time (F(3, 54) = 6.401, p < 0.001), all rats had decreasing breathing frequencies with age.
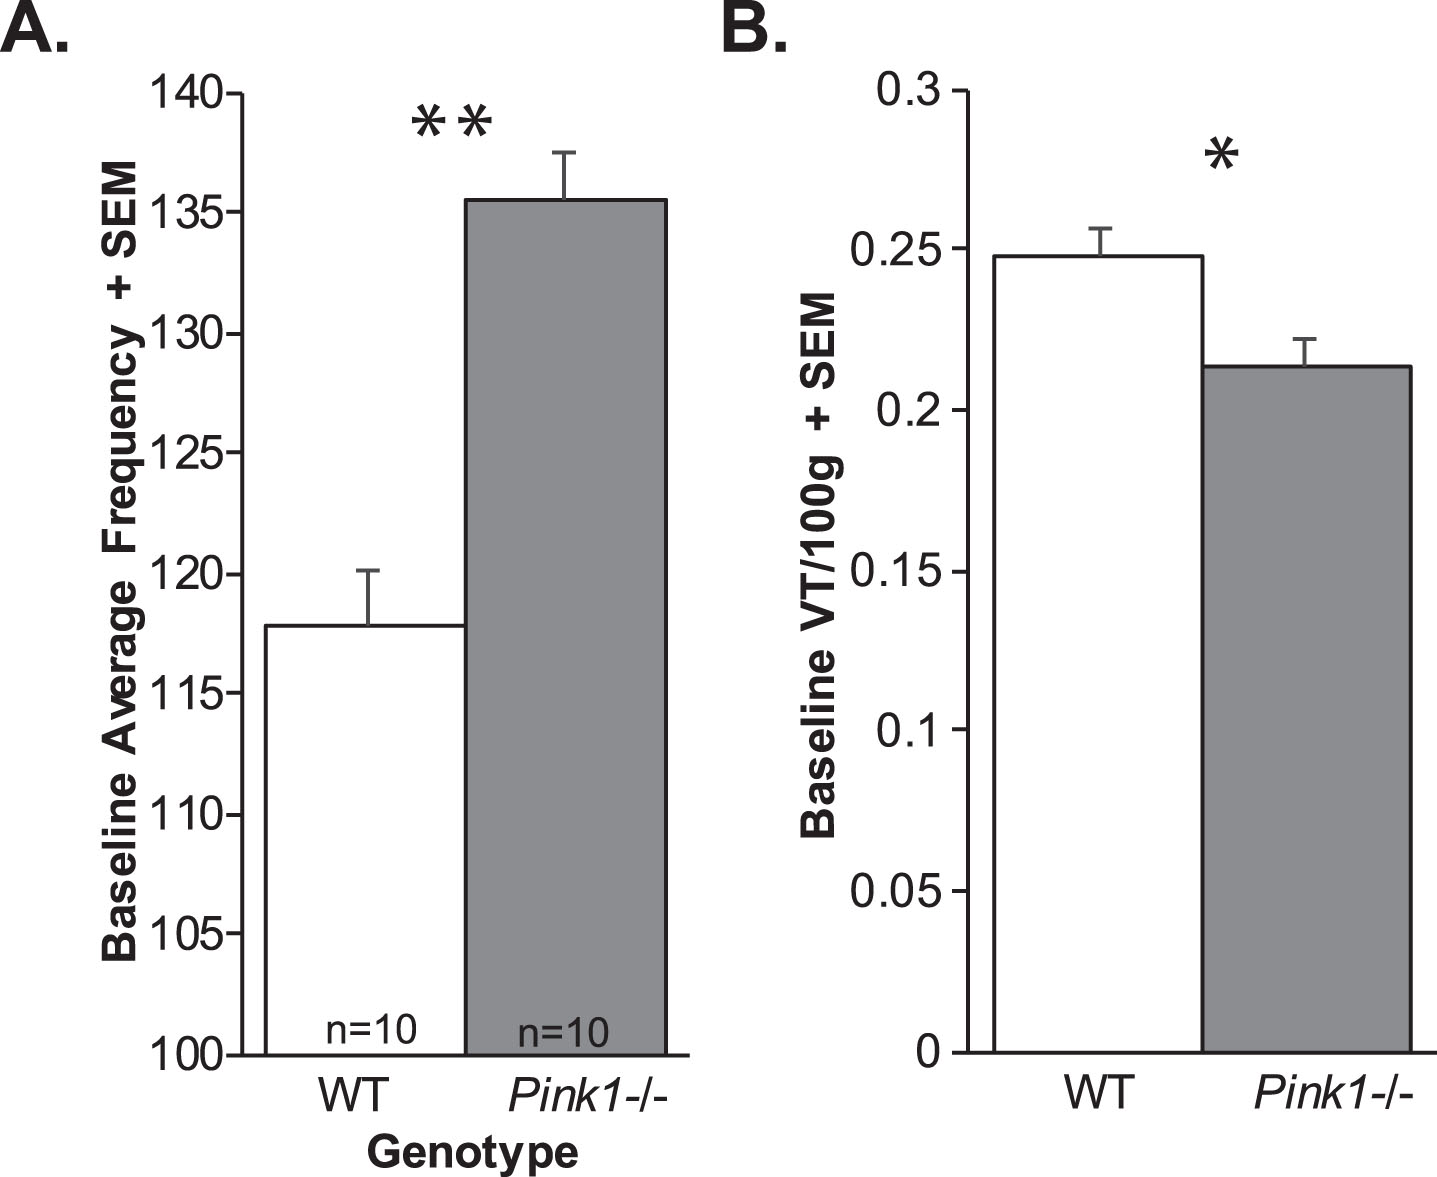
Ventilation data. A) Baseline average frequency + standard error of the mean (SEM) and B) baseline tidal volume (VT/100 g) + SEM. White bar = wildtype, Gray bar = Pink1–/–; sample size is 10 per genotype. Statistical significance indicated by: *p < 0.05, **p < 0.01.
There was no significant genotype×timepoint interaction for tidal volume (F(3, 54) = 0.85, p = 0.47). However, there was a significant main effect of genotype for baseline tidal volume (F(1, 54) = 4.43, p = 0.05 Fig. 3B). Specifically, Pink1–/– rats had reduced tidal volume compared to WT. Additionally, there was a significant main effect of timepoint (F3, 54) = 28.42, p < 0.001); with 4 mo significantly differing from 6, 8, and 10 mo (p < 0.001 for all comparisons).
There were no significant genotype×timepoint interactions (F(3, 54) = 0.66, p = 0.58) for minute ventilation. However, there was a significant main effect of timepoint at baseline (F(3, 54) = 52.27, p < 0.001). All rats demonstrated reductions in minute ventilation over time with significant differences between 4 mo and 6, 8, 10 mo (p < 0.001) and 6 and 8 mo (p = 0.002) and 8 and 10 mo (p = 0.017). There was no significant main effect of genotype (F(1, 54) = 0.058, p = 0.81).
There was no significant genotype×timepoint interaction for baseline mean inspiratory flow (F(3, 54) = 1.27, p = 0.29). However, there was a significant main effect of timepoint (F(3, 54) = 71.36, p < 0.001); specifically, a general reduction over time with 4 mo differing from 6, 8, and 10 mo (p < 0.001 for all). There were also reductions in mean inspiratory flow between 6 and 8 mo (p < 0.001), and 8 and 10 mo (p = 0.008).
There were main effects of time for peak inspiratory flow (F(3, 54) = 13.35, p < 0.001) and peak expiratory flow (F(3, 54) = 12.68, p < 0.001), but no other significant interactions between timepoint×genotype, or main effects of genotype for any of these ventilatory measures at baseline (p > 0.05).
Hypoxic ventilatory responses
Under hypoxic conditions, there were no significant interactions between genotype and timepoint for any of the measures. Additionally, there were no significant main effects of genotype. As expected, there were significant main effects of time for all variables. Breathing frequency with hypoxia decreased in all animals over time (F(3, 54) = 3.76, p = 0.02); specifically from 4 to 10 mo (p = 0.008) and between 6 and 10 mo (p = 0.006). As expected, there was a main effect of time for tidal volume (F(3, 54) = 44.77, p < 0.001), with specific reductions between 4 mo and 6, 8, and 10 mo (p < 0.001) and 8 and 10 mo (p = 0.01). Mean inspiratory flow (F(3.54) = 73.29, p < 0.001) was significantly reduced from 4 mo compared to 6, 8, and 10 mo (p < 0.001) and reduced from 6 to 8 mo (p = 0.01 and between 8 and 10 mo (p = 0.007). Peak inspiratory flow (F(3, 54) = 14.85, p < 0.001) was increased at 10 mo compared to 4 (p = 0.009), 6 (p < 0.001) and 8 mo (p < 0.001). Peak inspiratory flow was reduced at 8 mo compared to 4 mo (p < 0.001) and reduced significantly at 6 mo compared to 4 (p = 0.04). Finally, peak expiratory flow (F(3, 54) = 7.55, p < 0.001) was also significantly increased at 10 mo compared to 6 mo (p = 0.005) and 8 mo (p < 0.001). Peak expiratory flow was also reduced at 8 mo compared to 4 mo (p = 0.004).
MCS (hypoxia/hypercapnia)
There was a significant interaction of genotype and timepoint for breathing frequency (F3, 54) = 6.96, p < 0.001; Fig. 4). Specifically, within the Pink1–/– genotype there were significant genotype differences over time, where breathing frequency was decreased at 6, 8, and 10 mo compared to 4 mo of age (p < 0.001 for all comparisons). Pink1–/– rats also showed significant differences between 6 and 10 mo (p = 0.035). There were no differences between timepoints within the WT genotype (p > 0.05).
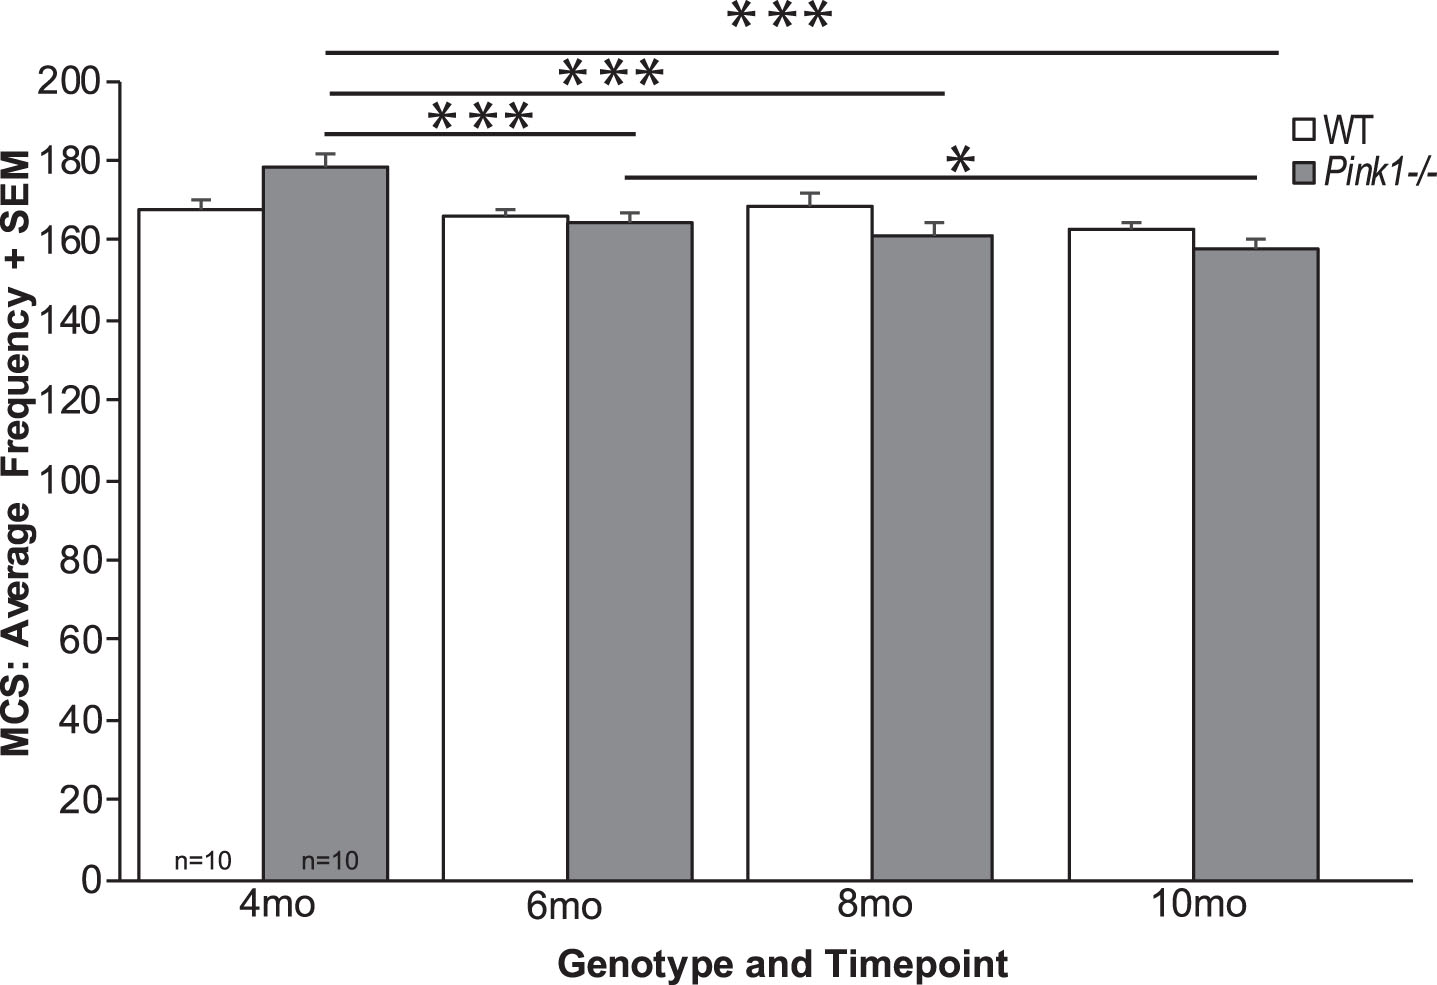
Average frequency of breathing with MCS. Average frequency with maximal chemoreceptor stimulation (MCS)+standard error of the mean (SEM) over time (4, 6, 8, and 10 months (mo)) and genotype (wildtype = white bar, Pink1–/– = gray bar; sample size is 10 per genotype). Statistical significance is denoted by a bar and asterisk: *p < 0.05, ***p < 0.001.
There were main effects of timepoint for tidal volume (F(3, 54) = 48.904, p < 0.001), minute ventilation (F(3, 54) = 68.30, p < 0.001), mean inspiratory flow (F(3, 54) = 62.59, p < 0.001), peak inspiratory flow (F(3, 54) = 15.17, p < 0.001), and peak expiratory flow (F(3, 54) = 10.58, p < 0.001).
There were no other significant interactions for timepoint×genotype, or main effects of genotype for any of the ventilatory measures with MCS (p > 0.05).
Nociception
There was no significant genotype×timepoint interaction for the latency to withdrawal (F(4, 72) = 1.4, p = 0.243). There was a significant main effect of genotype (F(1, 72) = 21.63, p < 0.001), Pink1–/– rats were significantly faster to withdraw their hindfoot from the heat source, approximately 2 s faster than WT controls (Fig. 5A). Additionally, there was a significant main effect of timepoint (F(4, 72) = 20.84, p < 0.001) where all rats, regardless of genotype, increased the latency to withdraw from 2 mo to 10 mo of age (Fig. 5B). Post hoc tests demonstrated statistically significant differences between 2 mo and 4, 6, 8, and 10 mo (p < 0.001 for all comparisons) as well as differences between 4, 6, 8 and 10 mo (p < 0.001 for all comparisons). There were no differences between 4 and 6 mo (p = 0.98), 4 and 8 (p = 0.99) and 8 and 6 mo (p = 0.94).
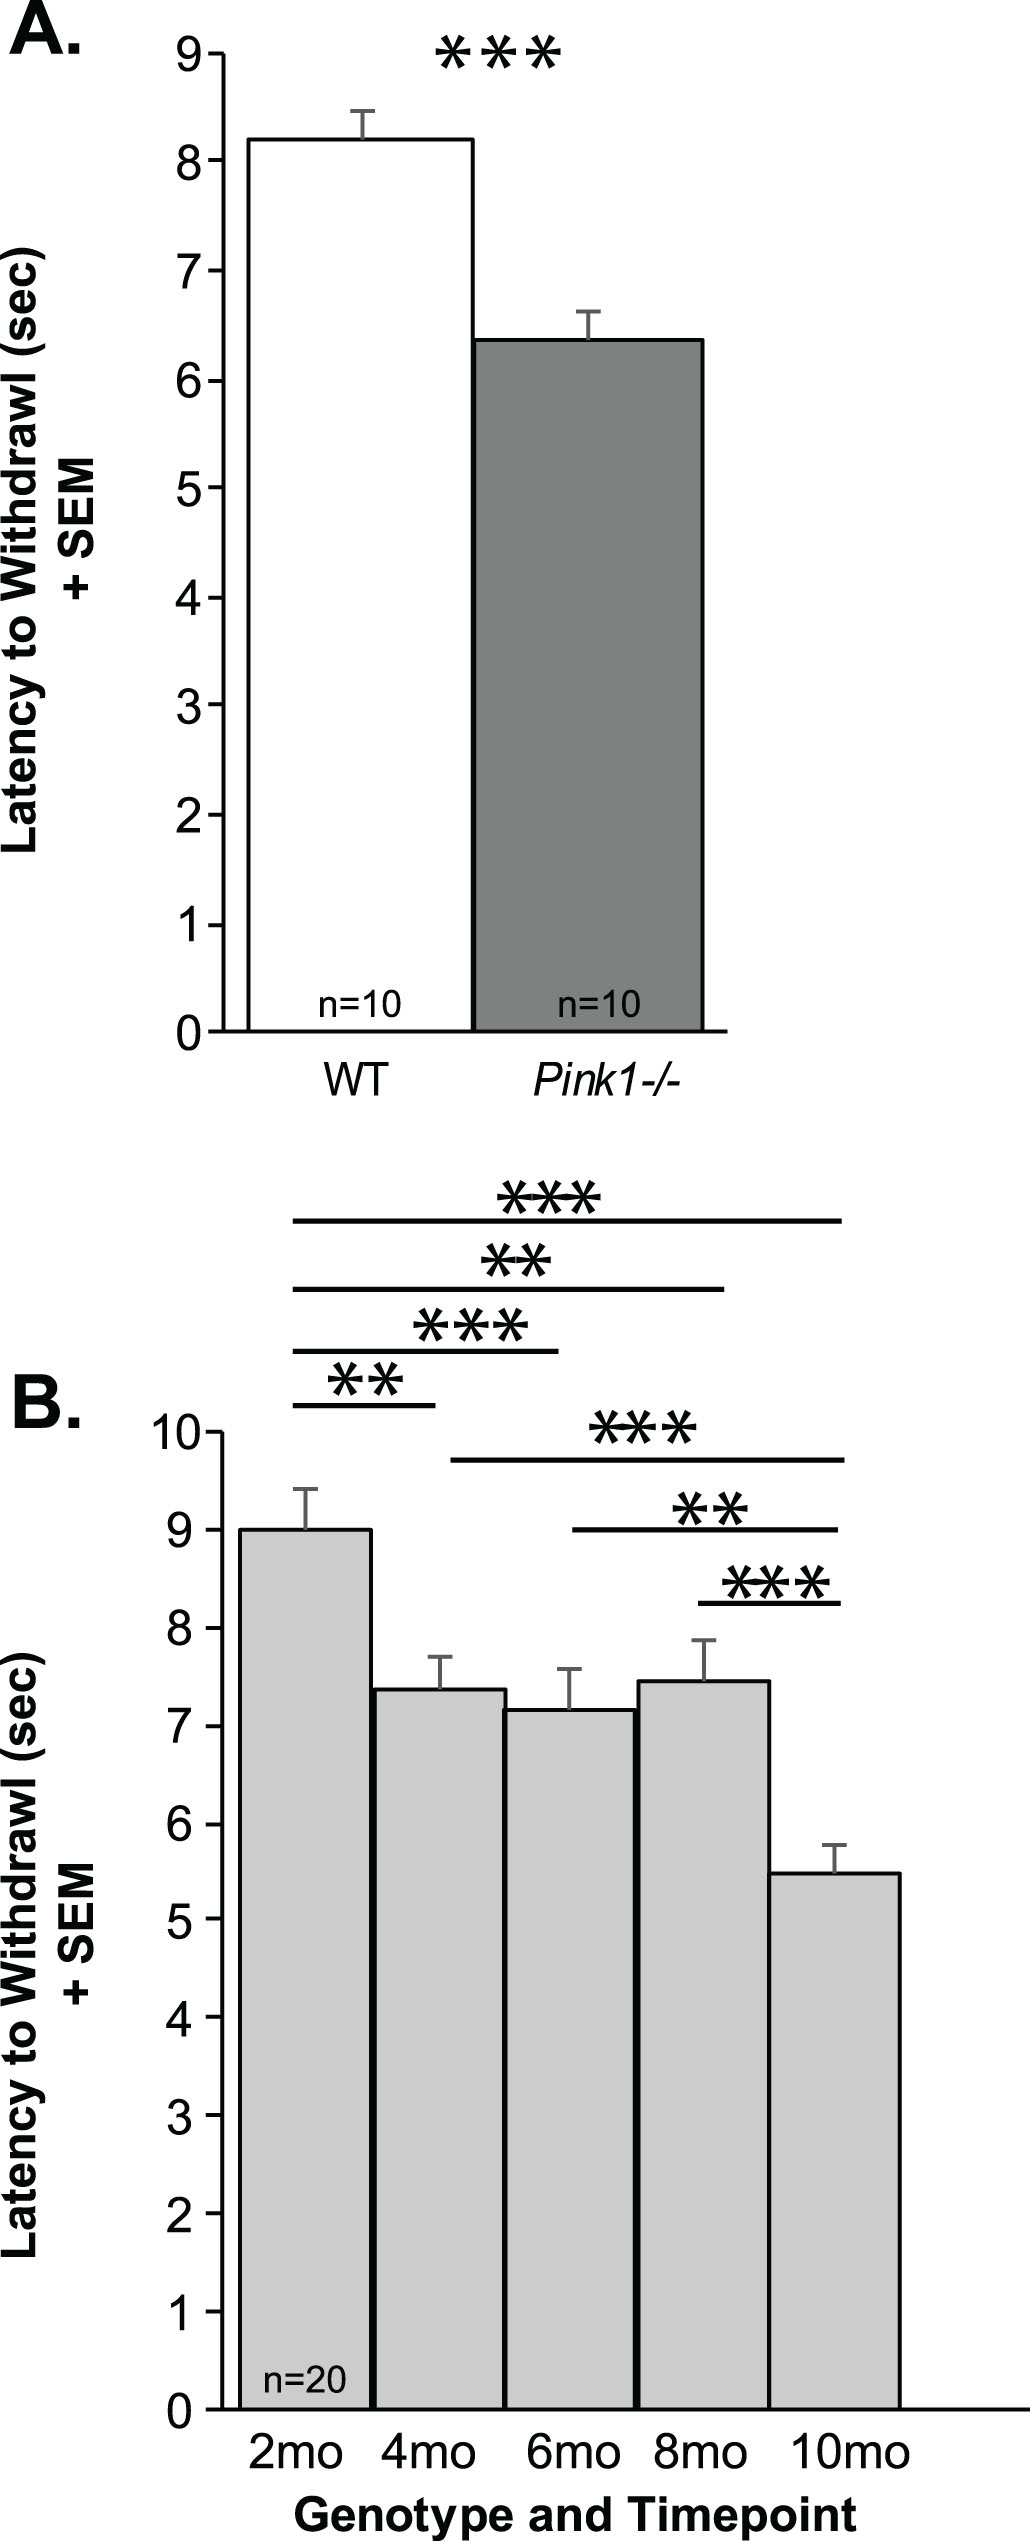
Thermal withdrawal latency. A) Latency to foot withdrawal (seconds, sec) between genotypes + standard error of the mean (SEM) (WT = white bar, Pink1–/– =gray bar, n = 10 per genotype). B) Latency to foot withdrawal (sec) over time (2–10 mo of age; light gray bars) + SEM. Statistical significance is denoted by a bar and asterisk: **p < 0.01, ***p < 0.001.
Limb motor
At 10 mo of age, Pink1–/– rats were significantly slower to cross the whole tapered balance beam (t(18) = 2.49, p = 0.023; Fig. 6A), they were slower to cross the challenging last 1/3 of the beam (t(18) = 2.20, p = 0.04; Fig. 6B), and Pink1–/– rats had significantly more foot faults (t(18) = 3.24, p = 0.0046; Fig. 6C) compared to WT.
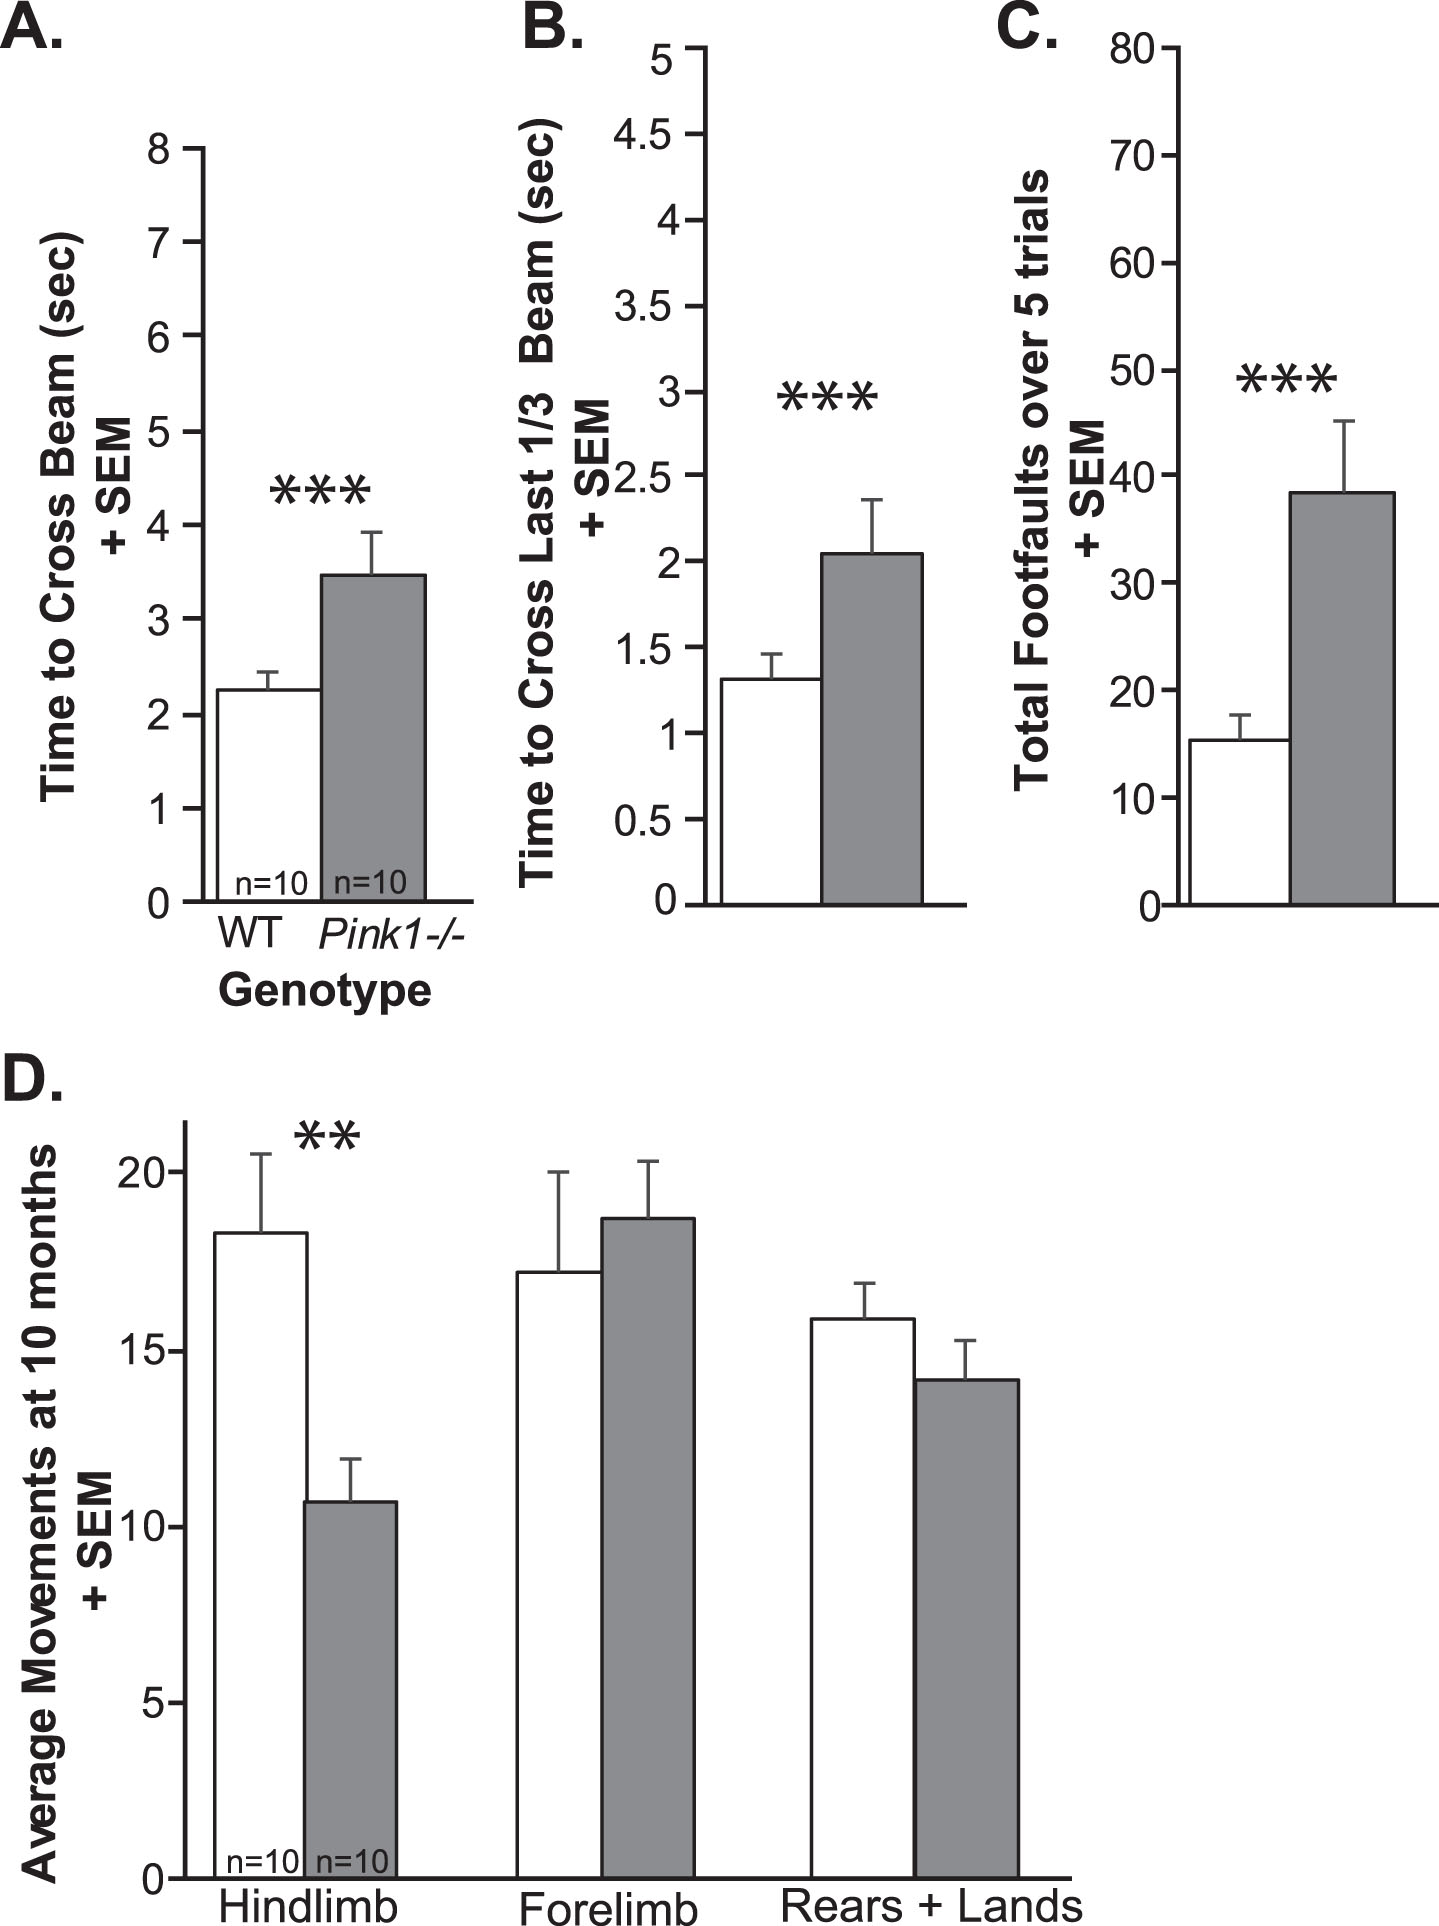
Limb motor data at 10 months of age. A) Time to cross the whole tapered balance beam (seconds, sec) + standard error of the mean (SEM). B) Time to cross the last 1/3 of the beam + SEM. C) Total number of foot faults over 5 consecutive trials + SEM. D) Average number of movements in the cylinder test: hindlimb movements + SEM, forelimb movements + SEM, and rears + landings + SEM. Wildtype (WT) = white bar, Pink1–/– = gray bar, n = 10 per genotype. Statistical significance is denoted an asterisk: **p < 0.01, ***p < 0.001.
At 10 mo, there was a significant difference between Pink1–/– and WT for hindlimb movements (t(18) = 2.963, p = 0.00833), where Pink1–/– have reduced movements in the cylinder. However, there were no significant differences for the number of forelimb movements (t(18) = 0.47, p = 0.65) or total rears and lands (t(18) = 1.13, p = 0.27) (Fig. 6D).
Together, these results confirm that at 10 months Pink1–/– rats demonstrate limb motor deficits as previously observed at 8 months.
Ultrasonic vocalization
At 10 mo of age, there were significant differences in the intensity (loudness) of the calls (t(18) = 2.61, p = 0.02); specifically, Pink1–/– rats had significantly louder (increased intensity) calls compared to WT at 10 mo (on average 2 dB) (Fig. 7A). There was a trend for Pink1–/– rats to exhibit a greater intensity range (t(18) = 2.032, p = 0.057; Fig. 7B); the mean intensity range of Pink1–/– rats was 29.23 dB compared to 24.91 dB in WT. Pink1–/– rats also had significantly reduced peak frequencies compare to WT (t(18) = 3.78, p = 0.001; Fig. 8A). There were no significant differences between genotypes in the average duration of the FM calls (t(18) = 0.504, p = 0.62) or the average bandwidth (t(18) = 0.31, p = 0.76).
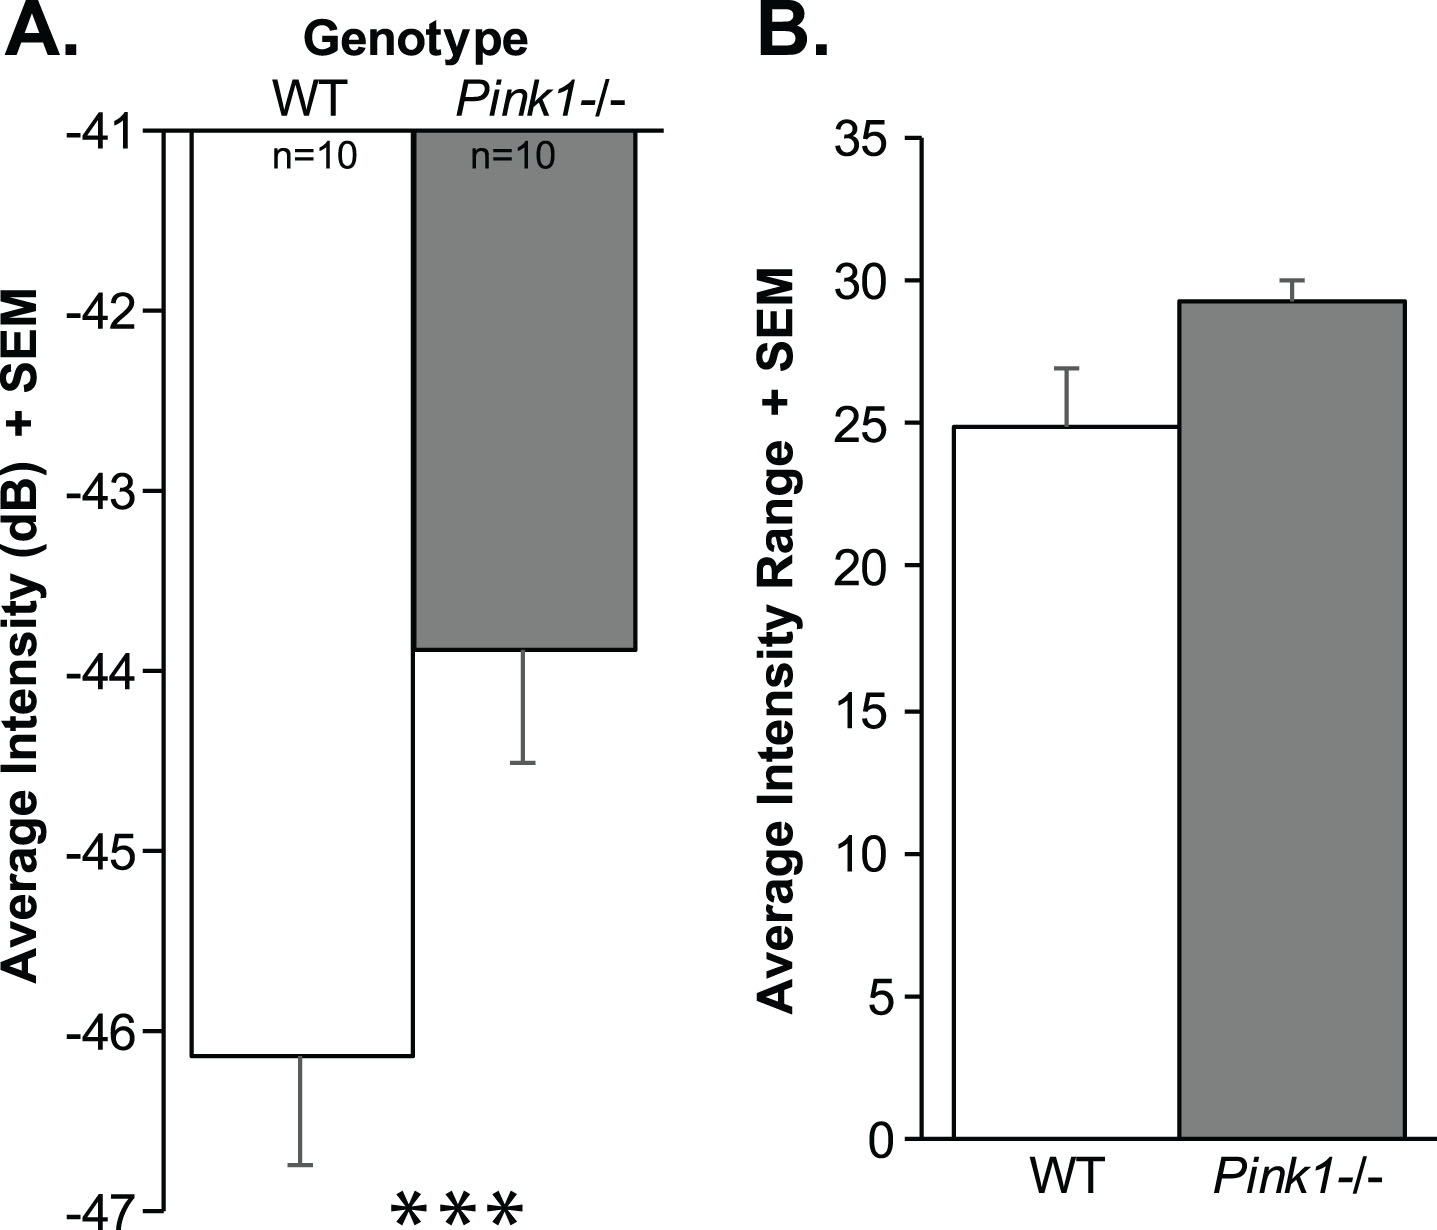
Ultrasonic vocalization intensity (loudness). A) Average intensity of vocalizations (decibels, dB) + standard error of the mean (SEM). B) Average range of intensity measures + SEM. Wildtype (WT) = white bar, Pink1–/– = gray bar, n = 10 per genotype. Statistical significance is denoted an asterisk: ***p < 0.001.
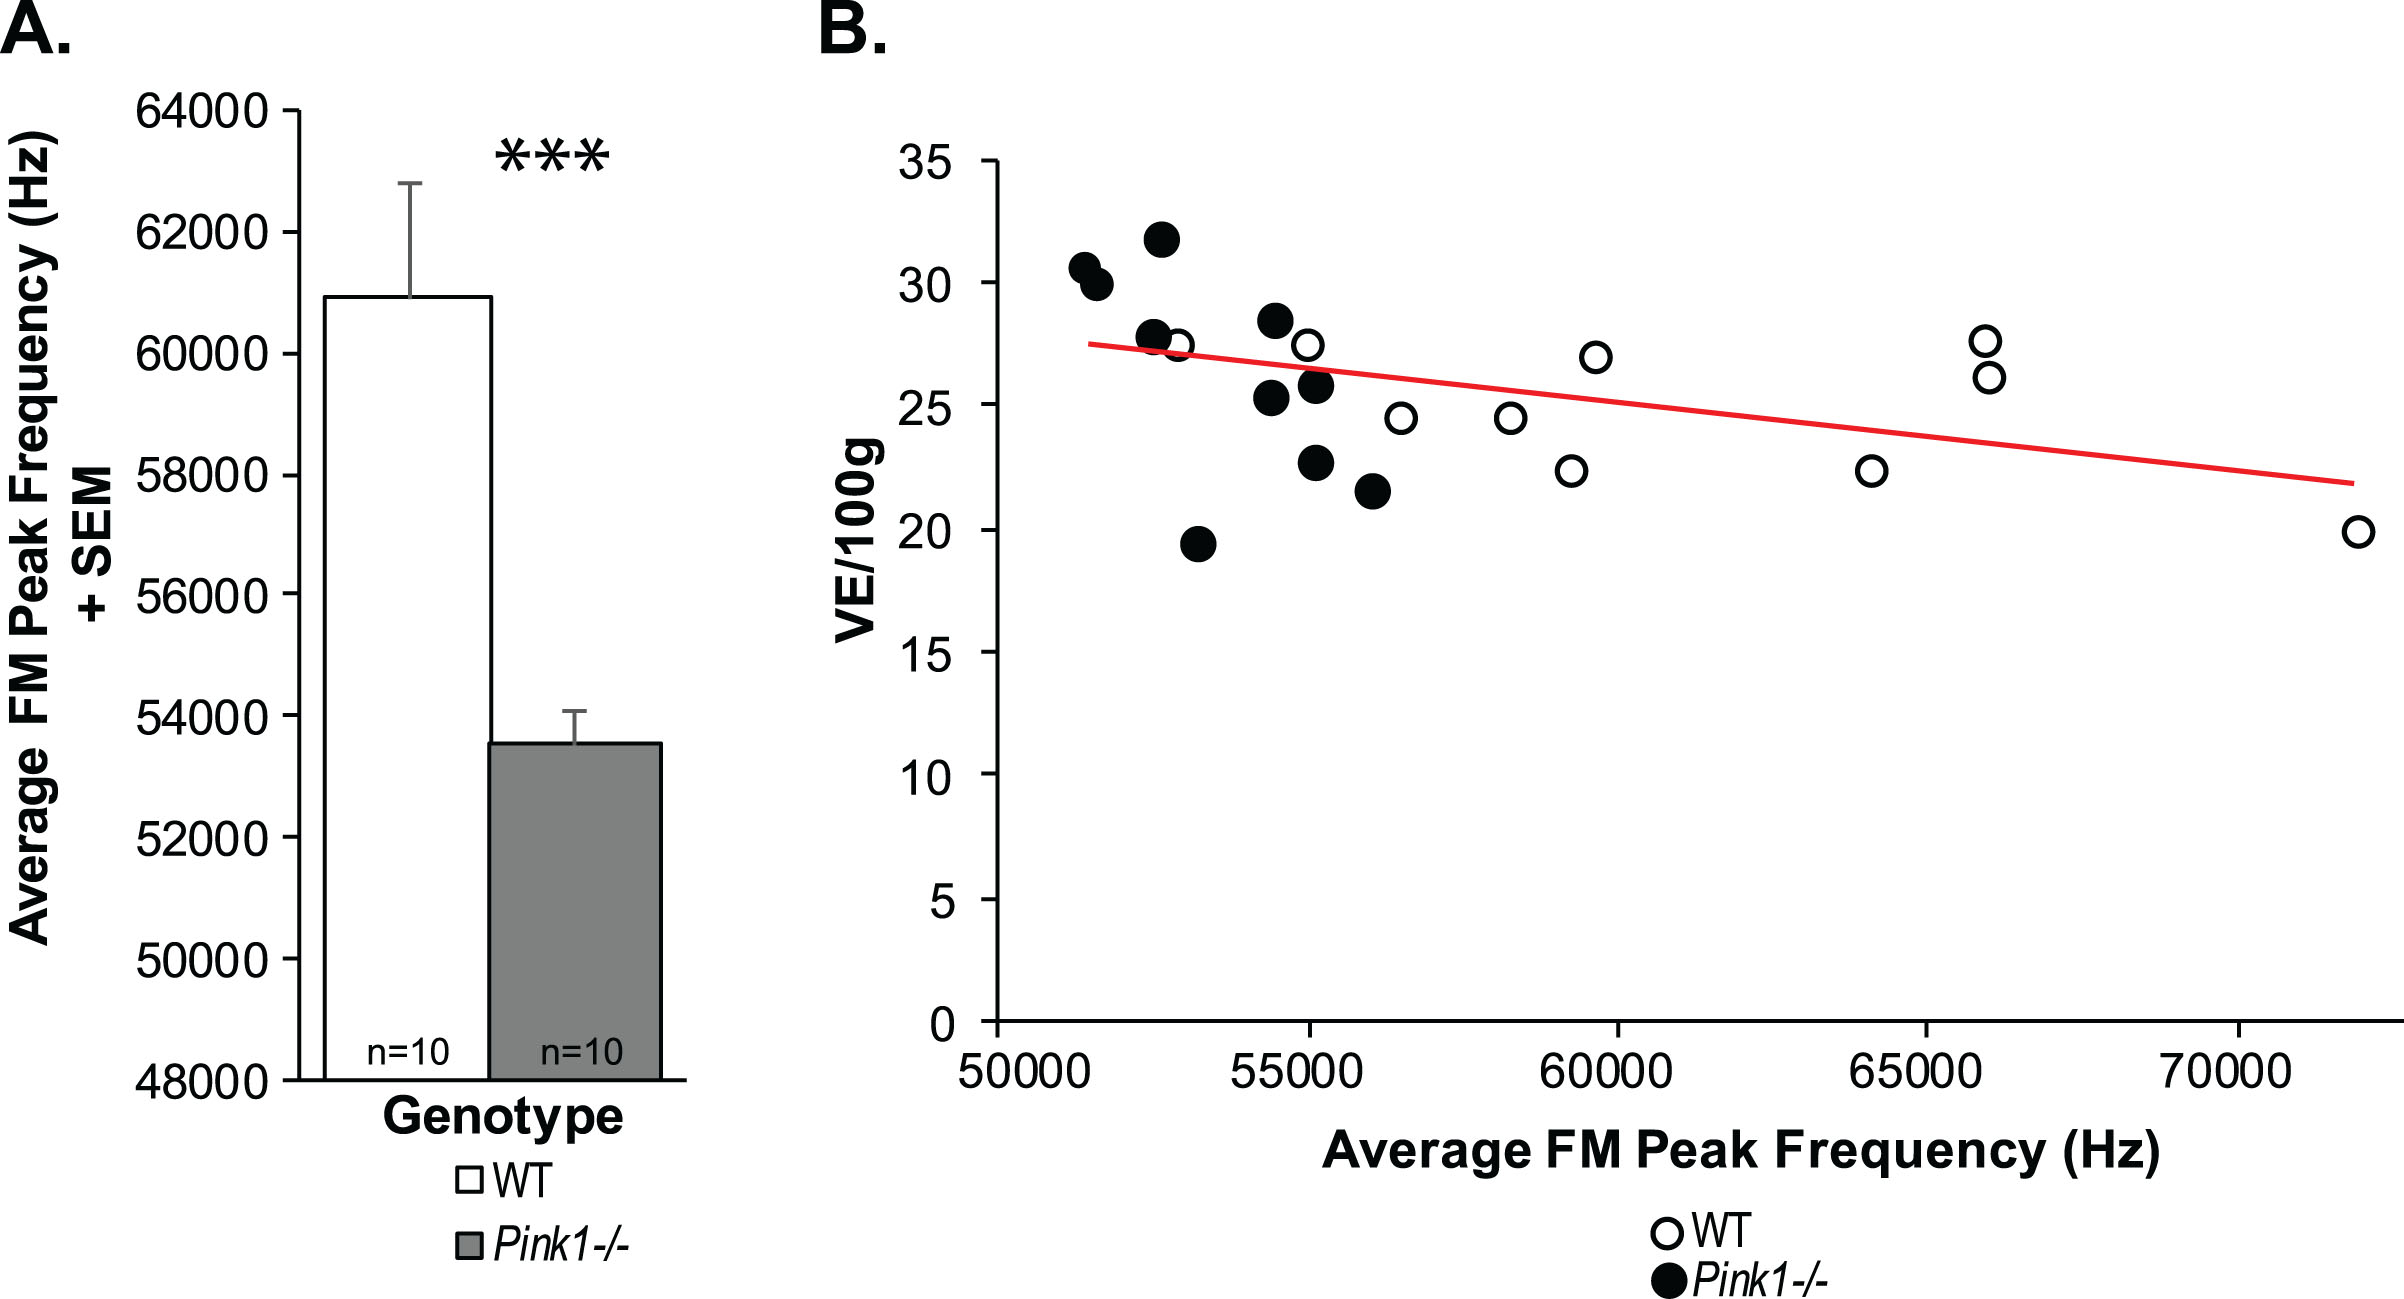
Peak frequency and minute ventilation. A) Average frequency-modulated (FM) peak frequency (kH) + standard error of the mean (SEM). Wildtype (WT) = white bar, Pink1–/– = gray bar, n = 10 per genotype. Statistical significance is denoted an asterisk: ***p < 0.001. B) Pearson correlation between minute ventilation (E/100 g) and average FM peak frequency. Red line denotes significant correlation. Open circles = WT, black circles = Pink1–/–.
Serotonin immunolabeling
There was no significant difference between Pink1–/– and WT rats for the 5-HT optical density measurements within the dorsal raphe (t(14) = 1.14, p = 0.27; Fig. 2C). Standard error of the mean (variability) within the Pink1–/– genotype was significantly increased compared to WT.
Ventilation and vocalization correlation analysis
There was a significant negative correlation between average vocalization peak frequency and minute ventilation at baseline (all rats combined: r = –0.44, p = 0.05, n = 20; Fig. 8B); specifically, within the Pink1–/– rats (Fig. 9A) this correlation was significant (r = –0.64, p = 0.04, n = 10), but did not exist within the WT rats (r = –0.51, p = 0.13, n = 10; data not graphed separately). Within the Pink1–/– genotype, there was a significant positive correlation between average vocalization peak frequency and breathing frequency (r = 0.78, p = 0.0081, n = 10; Fig. 9B), and a significant negative correlation between tidal volume (r = –0.72, p = 0.01, n = 10; Fig. 9C). There were no other statistically significant correlations between vocal acoustics and ventilation behavioral measures (p > 0.05 for all comparisons).
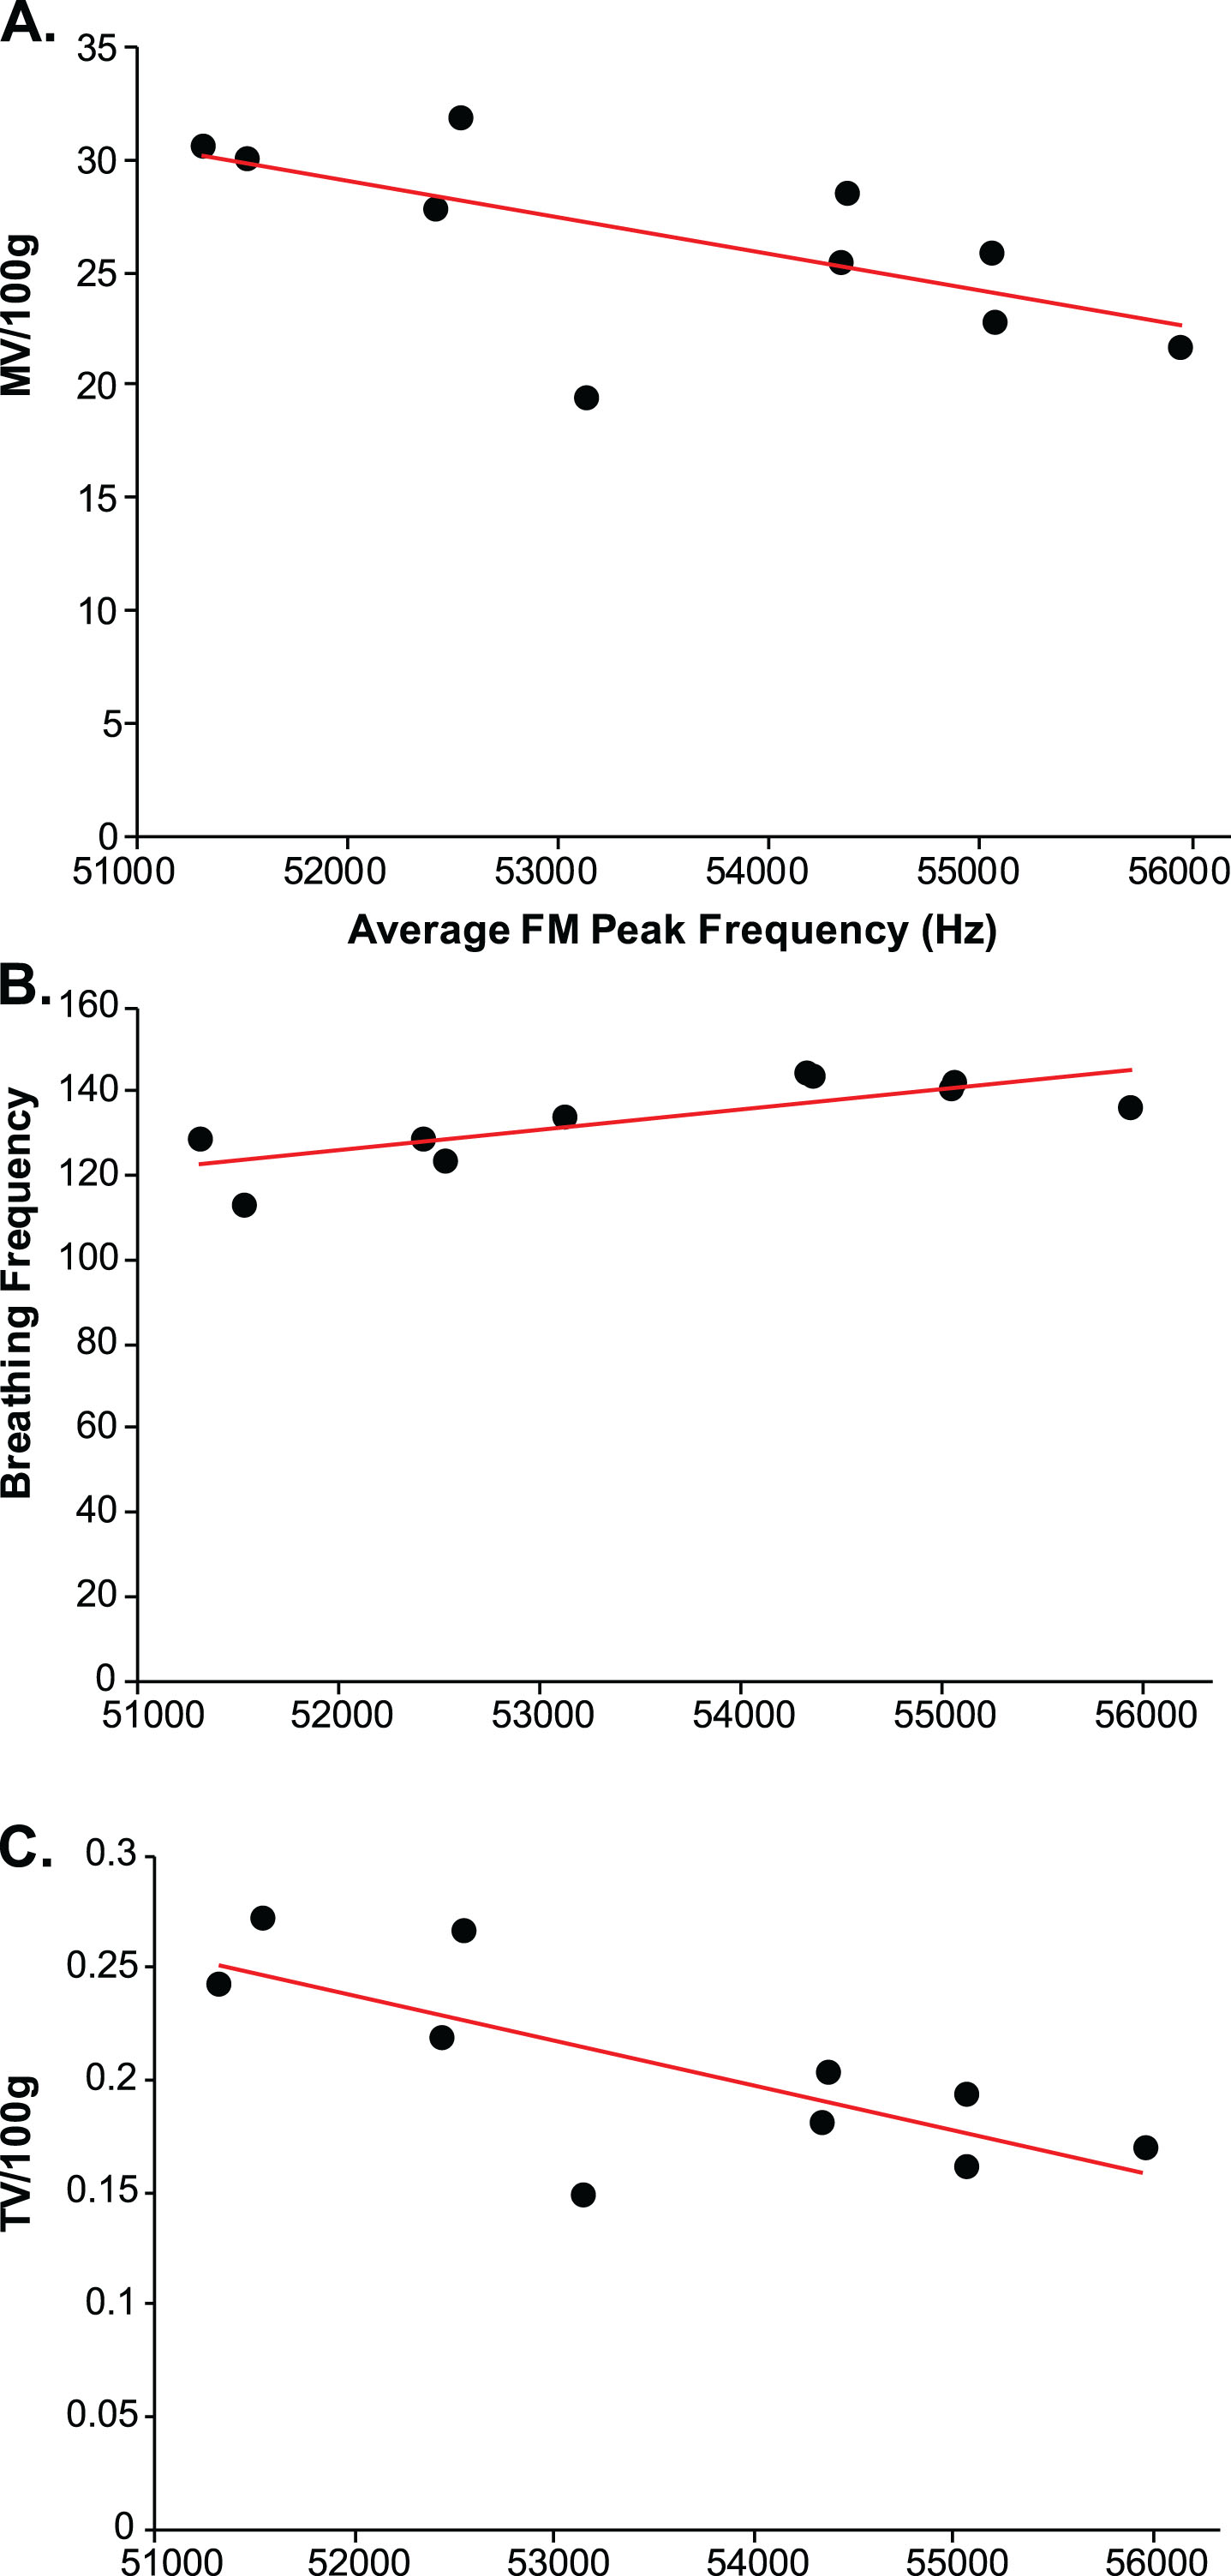
Ventilation and peak frequency correlations in Pink1–/– rats (dark circles). Average frequency-modulated (FM) peak frequency (kH) correlated with (A) minute ventilation (MV/100 g), (B) baseline breathing frequency, and (C) baseline tidal volume (VT/100 g). Red line denotes significant Pearson correlation.
DISCUSSION
The purpose of the study was to determine if Pink1–/– rats demonstrated ventilatory and sensory abnormalities over early disease progression (∼2–10 mo) compared to WT controls. Additionally, we aimed to expand on our previous work and assay vocal motor and limb motor deficits in Pink1–/– rats at the 10 mo (mid-stage) time point compared to WT controls. We hypothesized that Pink1–/– rats would show altered breathing responses in baseline, hypoxic, and maximum chemoreceptor stimulation conditions compared to WT and that impairments would progress over time. We were partially able to support these hypotheses, discussed below. Further, we hypothesized that due to bradykinesia and possible reduced sensation, Pink1–/– would have longer plantar withdrawal latencies during thermal stimulation compared to WT controls, which would advance over time. Contrary to our hypotheses, Pink1–/– rats showed shorter latencies. Interpretation of these findings is also found below. As expected, at 10 mo of age, Pink1–/– rats showed differences in vocal motor and gross motor assays compared to WT controls. Interestingly, vocal changes were correlated to reductions in minute ventilation, tidal volume, and breathing frequency in Pink1–/– rats. We predicted that reductions in brainstem serotonin (dorsal raphe nuclei; 5-HT density) would be present in Pink1–/– rats. However, there were no significant differences between genotypes, although Pink1–/– showed more variability. Together, these results further validate the Pink1–/– rat model as an early-onset model to human Parkinsonism.
Ventilatory impairments
Respiratory impairment is becoming increasingly recognized in PD patients [10–13, 58]. However, little is known concerning the underlying mechanisms of respiratory dysfunction in PD and if respiratory dysfunction contributes to changes in vocal motor control. Although chemosensory ventilatory deficits have been shown in patients with regard to hypoxia [28, 59] and hypercapnia [28], research investigating mechanisms underlying this dysfunction, including relationships between respiratory mechanics and central control of breathing networks is lacking. To this end rodent models have been used to study pathophysiologic dysfunction in the respiratory system of PD patients. A common model of PD is to create nigrostriatal dopamine depletion through infusion of the neurotoxin 6-OHDA. This model has been used extensively to study ventilatory regulation [60–66]; however, methods vary in terms of site of infusion, timing of testing with regard to infusion, and gas parameters. During awake plethysmography, rats with unilateral 6-OHDA infusion show increased tidal volume [64] or decreased respiratory rate with decreased minute ventilation during normoxia [60] and decreased breathing frequency but increased tidal volume during hypercapnia [64]. However, this model replicates only part of this complex pathology. In the Pink1–/– model, we have found degeneration in the locus coeruleus that precedes nigrostriatal compromise [40, 41]. Others have shown that neurotoxin lesions to the locus coeruleus also modulate chemoreception and breathing patterns [60, 66]. Since the Pink1–/– rat encompasses a wider pathology, including early degeneration of the locus coeruleus, we expected to find more robust breathing deficits.
At baseline breathing, respiratory frequency was faster in 6–10 mo old Pink1–/– rats compared with age-matched controls. Furthermore, Pink1–/– rats were able to maintain
Our studies cannot confirm the precise mechanisms or anatomical sites where this impairment is occurring since alterations/impairments of supra-pontine, brainstem (i.e., dorsal and ventral respiratory groups, pneumotaxic and apneustic centers, pre-Bötzinger complex), Kölliker-Fuse Nucleus, nucleus tractus solitarius, nucleus ambiguus, reticular activating system, or other cortical or spinal integrative pathways with inputs from the periphery may be associated with the mechanisms underlying respiratory impairment. Certainly, disruption of serotonergic pathways would be implicated and should be studied in-depth. In addition, changes in the peripheral nerves, muscles, or the neuromuscular junction themselves cannot be ruled out as contributors to the respiratory deficiencies seen. For example, preliminary work in the Pink1–/– rat show early changes to laryngeal muscle [67]. 6-OHDA rats also show impairments in hypercapnic ventilatory responses, which may include respiratory muscle activity as well as pathways involving central areas such as the substantia nigra, periaqueductal gray matter and the retrotrapezoid nucleus [65]. In any case, by 10 mo, deficiencies in VT/TI were no longer statistically significant.
Nociceptive impairment
Pink1–/– rats showed significant thermal hyperalgesia from 6–10 mo of age, manifesting as shorter withdrawal times to a normally painful stimulus (heat) compared with their WT controls. Human patients with PD frequently manifest primary pain symptoms early in disease progression as compared with onset of motor impairment [68–70]. Pain results from complex neural interactions involving the lateral and medial pain pathways that project to many regions including brain stem nuclei, the thalamus, the substantia nigra and striatum (for review, see Tseng and Lin, 2017) [68]. Interestingly, PD patients with and without pain show increased sensitivity to painful (heat) stimuli and brain hyperexcitability, likely due to abnormalities in nociceptive processing. Further, PD patients exhibit early degeneration of peripheral A-delta and C sensory fibers as well as deposition of phosphorylated α-synuclein in cutaneous sensory and autonomic nerves, with compensatory attempts to improve function such as increased branching and sprouting of nerves [71–73]. Additionally, central nociceptive processing, including upregulation of neurotransmitters involved in central integration of nociceptive responses are also likely affected, potentially leading to abnormal pain states such as hyperalgesia and/or allodynia [74]. As mentioned above, Pink1–/– rats show abnormalities in structures that modulate pain, such as the locus coeruleus and periaqueductal grey [40, 75].
We hypothesized that a potential mechanism for the observed changes might be loss of 5-HT in the dorsal raphe as 5-HT is one of the main neurotransmitters involved in endogenous peripheral, spinal and supraspinal pain-modulating systems [76]. Contrary to our hypothesis, we did not find any differences in levels of 5-HT in the dorsal raphe. However, our methods did not examine changes to receptor subtypes or turnover.
Ultrasonic vocalizations in rats and vocal communication in humans are controlled by similar physiological mechanisms [77–82]. In addition, rat ultrasonic vocalizations serve a communicative function in that they are semiotic in nature and capable of eliciting a response from the signal recipient [83, 84]. Given this, rat vocalizations have been used previously to relate neural mechanisms to vocal parameters [40, 85]. In this study, vocalizations were significantly different between genotypes. In contrast to previous reports [40], Pink1–/– rats in this study had significantly increased intensity of (i.e., less negative) vocalizations compared to WT. However, the average range of the intensity in Pink1–/– was significantly increased suggesting increased motor variability, consistent with previous findings of increased variability in cranial sensorimotor behaviors such as licking and swallowing [40, 86]. While the vocalizations had increased intensity, there was no significant difference in frequency range (bandwidth) of the vocalizations. Pink1–/– rats also had significantly reduced average peak frequency, another finding that has been repeatedly reported in previous work. Our previous work [87] demonstrates altered conspecific responses in a playback and choice paradigm (i.e., listening to male vocalizations); the data show that normal female rats can discern information from the acoustic playback of WT and Pink1–/– and prefer WT vocalizations. The average peak frequency negatively correlated to minute volume (whereas high minute volumes are correlated with reduced peak frequency); a finding driven by Pink1–/– data points. Breathing frequency and tidal volume also correlated to average peak frequency; however, the correlations were only significant for the Pink1 genotype. Pink1–/– rats are heavier in body weight compared to WT rats. The Pink1–/– mutation alters metabolism which likely accounts for increases in body weight. However, this does not mean that size (functional anatomy/physiology of the lungs and larynx) is also larger. In fact, this has been investigated in research using peripheral tissues [67]. Additionally, we have analyzed the data using body weight as a covariate and it does not change the outcome of the findings for any of the measures. Together, these data suggest that vocalization output in the Pink1–/– rat may be related to respiratory function.
At 10 months of age, Pink1–/– rats show limb motor impairments including significant differences compared to WT for all measures the tapered balance beam and reduced hindlimb movements in the cylinder. These data are a continuation of previous studies that evaluated performance up to 8 mo of age and together these data demonstrate a persistent motor impairment.
Conclusion
The goal of this work was to assay ventilation and nociception in the Pink1–/– rat model of PD. This work suggests that, in addition to limb and vocal motor differences, abnormal nociceptive responses in Pink1–/– rats and ventilatory abnormalities may be associated with abnormal sensorimotor processing to chemosensory stimuli during early disease manifestation.
CONFLICT OF INTEREST
The authors have no conflict of interest to report.