
Abstract
Background:
Well water frequently is considered a risk factor for Parkinson’s disease (PD), but few studies were designed appropriately to test whether geographic factors affect PD risk.
Objective:
To determine the risk of PD in relation to residential use of private well water.
Methods:
In a nationwide, population-based case-control study, we identified all incident PD cases (N = 89,790) and all comparable controls (N = 21,549,400) age 66–90 who solely relied on Medicare coverage in the U.S. in 2009. We estimated the probability of use of private well water using zip code of residence at diagnosis/reference and U.S. Census data on household water source. We modeled this exposure linearly in logistic regression to calculate the odds ratio (OR) and 95% confidence interval (CI) of PD risk in relation to well water use. We adjusted for age, sex and race/ethnicity, and verified that smoking and use of medical care did not confound results. We repeated analyses with a 2-year exposure lag and separately within each U.S. state.
Results:
Use of well water was inversely associated with PD risk (OR = 0.87, 95% CI 0.85–0.89). We confirmed this association in a Cox survival analysis in which we followed controls for 5 years, death or PD diagnosis. There was little evidence that well water use increased risk of PD in any individual state.
Conclusions:
Although it remains possible that exposures in well water in more narrow geographic regions increase PD risk, in general these results suggest that exposures more common in urban/suburban areas might also be relevant.
Keywords
INTRODUCTION
Although numerous genes contribute to Parkinson’s disease (PD) risk [1–3], studies in twins indicate that environmental risk factors play a prominent role [4–6]. As such, identification of environmental risk factors for PD is an essential step in reducing disease burden through primary prevention.
One potential risk factor that has received considerable attention is residential use of private well water as the primary source of water for drinking, cooking and bathing. Several epidemiologic studies have concluded that the use of well water might increase the risk of PD [7–24], presumably due to water contaminants. However, other studies observed an inverse association [25] or no association [26–41]. While geographic differences in the quality of well water in different regions makes comparison across studies difficult, the inconsistency in results is also likely due to differences in study design. Most of the studies either were very small, or were not designed to test the hypothesis that PD risk is associated with a geographically varying exposure and therefore may have been biased. In particular, most well water studies were clinic-based and included prevalent PD cases. Only one study, conducted in the Central Valley of California, was adequately sized, population-based, restricted to incident PD cases and avoided geographic matching of controls to cases [19]. In that study, PD risk was increased in relation to well water potentially contaminated with the insecticide diazinon. Nonetheless, there was no clear association between PD and ever using well water in general during one’s lifetime (odds ratio [OR] = 1.2, 95% confidence interval [CI] 0.82–1.80).
In order to address the limitations of most other prior studies of PD and well water, we utilized United States (U.S.) Medicare data to conduct a large, population-based case-control study with incident PD cases and controls (comparable to the cases yet selected without geographic matching). Based on the results from the study in California [19], we hypothesized that any positive association between well water and PD would be modest and would vary depending on potential well water contaminants and hence geographic location.
MATERIALS AND METHODS
Protection of human subjects/data
This study was approved by the Centers for Medicare and Medicaid Services (CMS) and Washington University’s Human Research Protection Office. CMS de-identified all data prior to release to Washington University. Informed consent was not required because this was a records-based study only using de-identified data.
Overall study design
We conducted a population-based case-control study using U.S. Medicare data. We used comprehensive administrative claims data and beneficiary annual summary (base) files from 2004-2009 to identify all cases and controls [42]. In summary, in the year 2009 all cases and controls lived in the U.S., were 66–90 years of age and had Medicare Parts A and/or B, but had no health maintenance organization coverage (the main exclusion in age-eligible beneficiaries).
Case ascertainment
We included as cases (N = 89,790) all Medicare beneficiaries in 2009 who met all above criteria and who had ≥1 International Classification of Diseases, Ninth Revision, Clinical Modification (ICD-9) diagnosis code 332 or 332.0 in any file (inpatient/skilled nursing facility, outpatient, carrier, home health care, or durable medical equipment) in 2009 but not in 2004-2008. Cases did not have a code potentially indicative of an atypical parkinsonism or Lewy body dementia.
Control selection
We included as controls (N = 21,549,400) all Medicare beneficiaries in 2009 who met all of the same criteria as cases, but who had no ICD-9 code for PD and who had survived to their randomly assigned reference date in 2009. We included all eligible controls to maximize statistical power. We avoided matching controls to cases to ensure that we did not overmatch with regard to geography. Instead, we addressed potential confounding analytically, and we verified that we had excellent statistical power. Matching is most important when gains in statistical efficiency are necessary [43], but even without matching we had >99.9% power to detect an OR as modest as 1.09.
Determination of type of water source
Medicare base files contain each beneficiary’s residential zip code for the respective benefit year. We assigned each beneficiary’s residential zip code as of the diagnosis/reference year (2009) to the 2010 ZIP Code Tabulation Area (ZCTA) using a lookup table [44]. We then assigned each beneficiary to the latitude and longitude coordinate of the population centroid of the ZCTA weighted for households with residents age ≥65 using ArcMap [45]. Next, we spatially joined each coordinate to the corresponding 1990 U.S. Census block group [46], which is the most recent year for which the U.S. Census collected data on household water source [47]. From this Census data, we estimated the percent of households in each block group that used private well water by dividing the number of households served by individual drilled or dug wells by the total number of households. In most areas the remaining households use water from a “public system or private company” that originates from deeper wells, or surface water sources, monitored for compliance with federal drinking water standards [48]. We thus assigned the percentage of households that use water from individual drilled or dug wells (hereafter “wells”) to each beneficiary, such that exposure was expressed probabilistically, ranging from 0% to 100%. We were able to estimate exposure for all but 85 (0.09%) cases and 22,375 (0.10%) controls.
We validated our exposure assessment approach by applying a similar approach to estimate the probability of well water for 107 residences sampled from Washington State through random digit dialing [49]. Residents reported their source of drinking water and their mailing and street addresses; 18 (17%) used an individual or shared private well and the remainder used water from a publicly monitored source. Even when we applied our exposure assessment approach using only the 5-digit mailing zip code, we observed good agreement between probability of well water use and our gold standard measure, self-reported water source (biserial correlation coefficient = 0.45, p = 0.0001). As a secondary validation we compared our probability of well water use variable, which was based on 1990 Census data, to a variable that was assessed at the time of PD diagnosis/reference, a county level variable from 2010 from the U.S. Geological Survey [50]. Specifically, we calculated the percent of the population in the county whose “domestic” water was “self-supplied” in that year. This county level variable also agreed well with our primary (zip code level) variable despite the different geographical scale and 20-year time gap (Spearman’s ρ= 0.49).
Determination of covariates
We obtained beneficiary date of birth (age), sex and race/ethnicity from the Medicare base file for 2009. Medicare base files also include individual level summaries of use of medical care, including the number of physician visits (visits to physician offices as well as outpatient institutional visits). We obtained the number of physician visits from the 2008 base file so that we did not count post-diagnosis visits. We also had complete Medicare claims data from 2004-2009 for all cases and all 118,095 controls in a 0.5% random sample of the full control group. In these cases and controls, we calculated the total count of unique diagnosis codes prior to PD diagnosis/reference (as another indicator of use of medical care) and three other covariates previously associated with PD. These included ever/never tobacco smoking,[51, 52] physical activity [53–55] and constipation [56]. We determined constipation from ICD-9 codes 564.0x. For physical activity, we were interested in assessing lifetime physical activity [53, 54]. In addition, individuals in rural areas might have more opportunity for some types of outdoor physical activity, including from an outdoor occupation, which itself has been associated with a reduced risk of PD [57, 58], presumably due to greater physical activity and/or exposure to ultraviolet light (UV). Therefore, we used UV-related cancers as a proxy for lifetime outdoor physical activity including from an outdoor occupation. We classified the following cancers as UV-related: lip cancer (ICD-9 140.xx); squamous, basal cell or melanoma skin cancer (ICD-9 172.xx, 173.xx); ocular melanoma/conjunctival squamous cell carcinoma (ICD-9 190.3, 190.5, 190.6, 190.8, 190.9) [59].
We estimated the probability (0% to 100%) of “ever smoking” tobacco using a multifaceted approach [42, 60]. We assigned a probability of 100% to any beneficiary with a diagnosis or procedure code specific to tobacco use, primarily ICD-9 305.1 (tobacco use disorder) or ICD-9 V15.82 (history of tobacco use). Otherwise, we estimated the probability from a logistic regression model that we created based on sex, race/ethnicity, birth cohort and >600 other diagnosis or procedure codes. We have detailed the development and validation of this predictive model previously [42].
We used publicly available data to create variables for selected environmental exposures likely to be associated with use of well water. Overall, well water use is more common in areas with intensive use of agricultural pesticides than in urban areas without any well water use. Given the suspected association between residential exposure to agricultural pesticides and PD [61–63], we obtained county level data on kilograms of agricultural pesticides applied in each county of the U.S. in 2009 [64]. Specifically, we calculated the midpoint between the lower and upper estimates for each pesticide and then summed across all pesticides. Then we divided this total by the land area (acres) in the county to standardize agricultural pesticide use in terms of intensity of pesticide use. We also obtained the prevalence of daily smoking in the county in 2009 [65]. We used this as a proxy for exposure to environmental tobacco smoke (ETS), since some studies suggest that ETS, not just active smoking, is associated with a reduced risk of PD [66, 67].
Statistical analysis
We performed all statistical analysis using Stata [68]. We used logistic regression to estimate the OR and 95% CIs for well water use and PD. Probability of well water use ranged from 0% to 100%. We retained this as a continuous variable that ranged from 0 to 1, so that a one unit change (i.e. the OR) can be interpreted as the risk of PD among beneficiaries with vs. without well water (100% vs. 0% probability of well water). This also allowed the substantial number of beneficiaries (51.0% of cases, 52.4% of controls) with intermediate probabilities of well water use to contribute to risk estimation.
In all models we adjusted a priori for age (as 2 linear splines with a knot at age 85), sex and race/ethnicity (in seven categories unless noted). We then examined the effect of adjustment for the following variables: geographic region (state) of residence, agricultural pesticide use (kg/acre) and ETS. We also examined the effect of adjustment for several individual level variables, including use of medical care. We adjusted for use of medical care because we previously found that greater use of care is associated with a greater PD case ascertainment in the present study and can bias associations [60]. In the present analysis, our concern was that use of medical care could be a nuisance mediator. In this context, a nuisance mediator should be handled as a confounder to factor out any effect on the PD-well water association if beneficiaries in more rural areas tend to have fewer encounters with physicians or receive fewer ICD-9 codes on average than their counterparts from more urban areas (Fig. 1, Supplementary Table 1). Our primary indicator of medical care was the total number of physician visits in 2008 for each individual. This was our primary indicator because it was available in the full case-control sample. Among beneficiaries for whom we had complete Medicare claims data, we alternatively considered the total number of unique diagnosis codes up to the PD diagnosis/reference date. Among this same subset of beneficiaries we examined the effect of adjusting for smoking and UV-related cancer, as well, with the latter as a proxy for outdoor occupations and outdoor physical activity in general. Finally, we checked whether constipation modified the association between use of well water and PD, given that constipation long precedes PD diagnosis and could affect drinking water habits. Except where noted, we modeled continuous variables linearly, and coded all percentage variables on the 0 to 1 scale, so that the OR could be interpreted easily as described above.
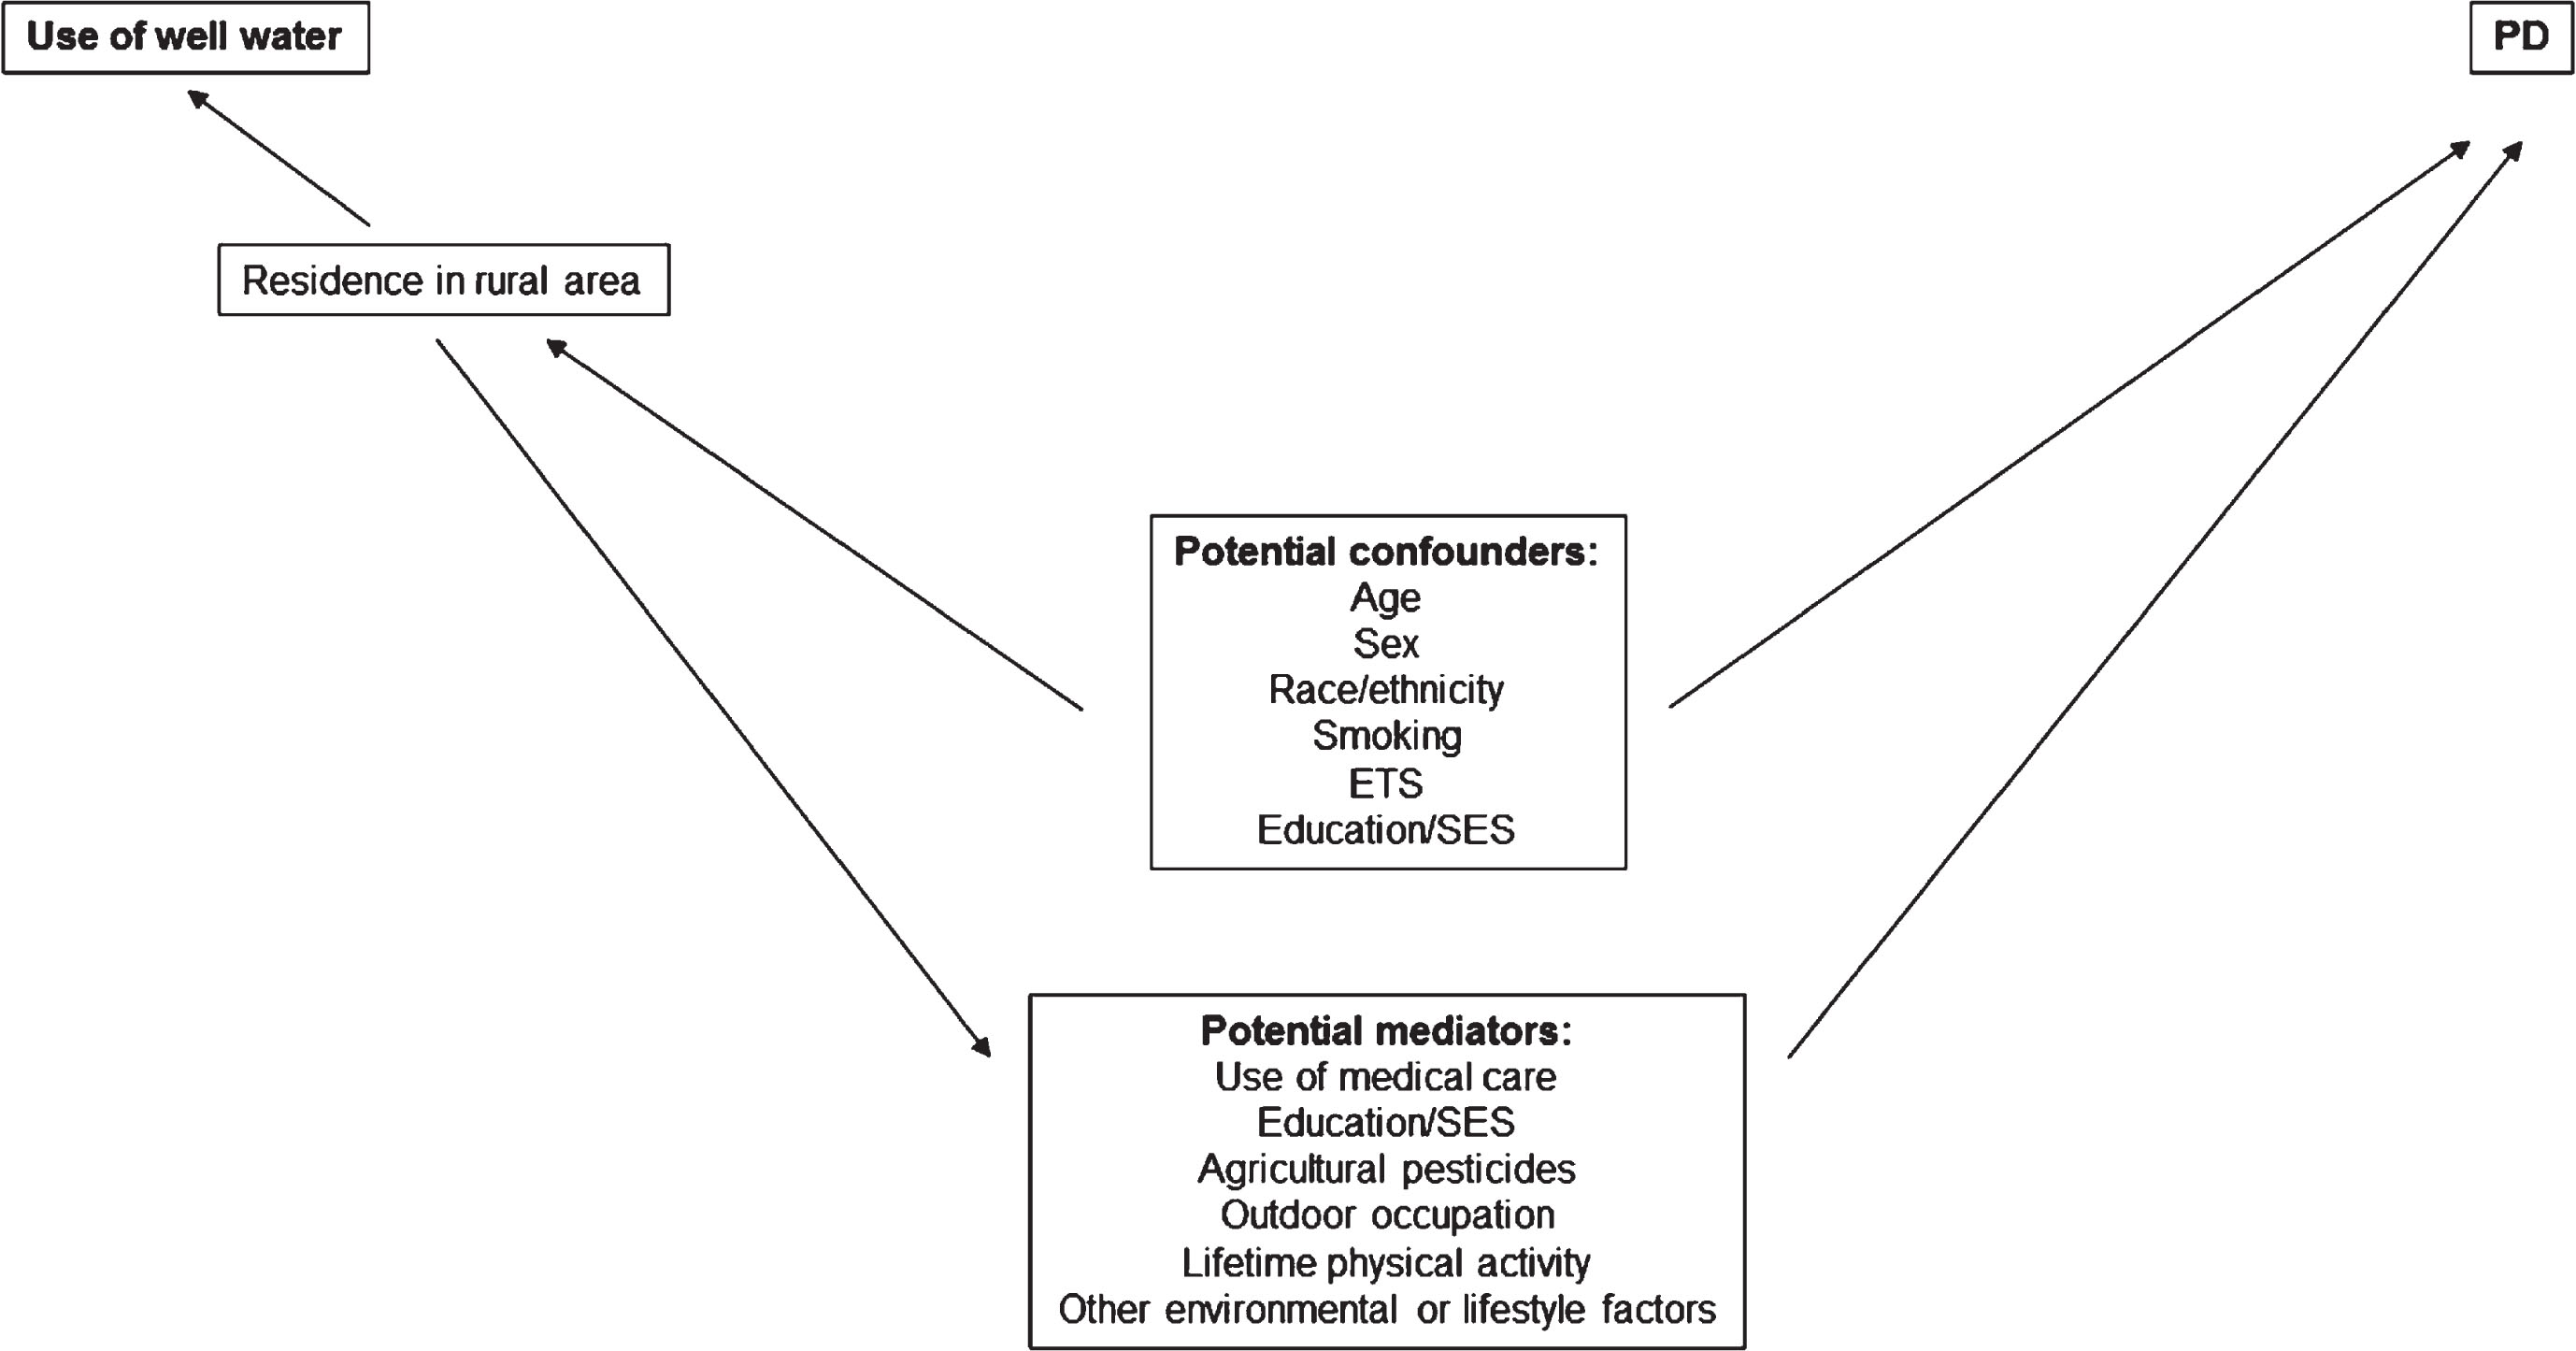
Factors potentially affecting the association between use of well water and Parkinson’s disease (PD). Several variables might act as potential confounders on the association between use of well water and PD because of the strong positive association between residence in a rural area and use of well water. These include age, sex and race/ethnicity, which might bias the PD-well water odds ratios upward, and tobacco smoking and environmental tobacco smoke (ETS) exposure, which might bias the PD-well water odds ratios downward (see Supplementary Table 1). Several additional variables likewise might mediate the association between PD and well water, but should be treated analytically as confounders to remove their potential effect on the PD-well water odds ratios. These potential “nuisance” mediators include use of medical care, agricultural pesticides, outdoor occupation, lifetime physical activity and other environmental and lifestyle factors, including ETS. Education and socioeconomic status (SES) could act as a confounder and/or mediator.
We conducted four sensitivity analyses. First, since it is possible that residence could change during the prodromal period of PD, due to PD symptoms, we lagged exposure by 2 years. Specifically, we used the probability of well water according to the beneficiary’s zip code in 2007, the first year that residential zip code was usually recorded at the 9-digit (vs. 5-digit) zip code level. Second, we restricted to those cases and controls who had the same 5-digit zip code in 2004 as in 2009. Third, we restricted to beneficiaries with either 0% or 100% probability of well water use. This allows for a traditional analysis with a simple 0/1 dichotomous exposure variable, and also restricts to the cases and controls whose exposure in 2009 was known with the greatest certainty. Fourth, we restricted our analysis to PD cases who received a PD diagnosis code from a neurologist or who had ≥3 PD diagnosis codes.
We considered a 2-sided p-value of <0.05 significant in the nationwide analyses, as evidenced by 95% CIs that excluded the value of one. We repeated all statistical analyses for each of the 50 U.S. states individually. For this state-by-state analysis, we applied a Bonferroni correction to account for multiple comparisons (2-sided α= 0.001).
Data sharing
Per our agreement with CMS, we are not allowed to share individual beneficiaries’ data.
RESULTS
Characteristics of cases and controls
The demographic characteristics of cases and controls were consistent with known risk factors for PD (Table 1). Half of cases were male, compared to 43% of controls. Proportionally more white and Hispanic beneficiaries had PD than other beneficiaries. On average, cases were older than controls; the mean age was 78.8 years (standard deviation [SD] 6.1) for cases and 76.0 years (SD 6.2) for controls. Among beneficiaries with claims data, PD was inversely associated with smoking (OR = 0.70, 95% CI 0.67–0.72) after accounting for the above demographic differences and greater use of medical care among cases than controls. After accounting for the same variables, as well as (active) smoking and state, PD also appeared to be inversely associated with ETS (OR = 0.87, 95% CI 0.63–1.19) and UV-related cancer (OR = 0.86, 95% CI 0.84–0.87), although the former was non-significant.
Characteristics of Parkinson’s disease cases and controls, U.S. Medicare 2009
SD, standard deviation; International Classification of Diseases Ninth Revision Clinical Modification, ICD-9; kg, kilograms. aNumbers and percentages of controls exclude 58 (0.0003%) controls with unknown sex. bPredicted probability of ever smoking tobacco divided by the person’s total number of unique diagnosis codes (or 1 for 292 cases and 6,227 controls without any diagnosis codes). cAvailable for all cases and for all controls in a randomly selected subset of 118,095 controls for whom claims data were available. dLip, skin and selected eye cancers [59] as a proxy for lifetime outdoor physical activity, including from outdoor occupations. eTotal number of unique ICD-9 diagnosis codes up to the PD diagnosis/control reference date. fTotal kilograms of agricultural pesticides applied in 2009 in the county of residence in 2009, divided by the total number of agricultural and non-agricultural acres in the county. Excludes 1268 (1.4%) of cases and 327,323 (1.5%) of controls. gPercent of individuals in the county of residence who smoked daily in 2009.
Well water and PD risk
A total of 10,579 (11.8%) of cases and 2,824,319 (13.1%) of controls had a >50% probability of using well water. In the nationwide sample we observed an overall inverse association between use of well water and PD (OR = 0.87, 95% CI 0.85–0.89) (Table 2, Supplementary Table 2). This OR attenuated by <5% with adjustment for any of the individual potential confounders that we considered, with the greatest effect through adjustment for total number of unique diagnosis codes. In the subset of cases and controls for whom we could calculate this indicator of use of medical care, further adjustment for all potential confounders resulted in a modestly attenuated OR that remained significant (OR = 0.91, 95% CI 0.88–0.95). The inverse association between well water and PD also attenuated slightly but clearly remained in each of the sensitivity analyses. Risk of PD in relation to use of well water was 0.90 (95% CI 0.88–0.92) when applying a 2-year lag; 0.88 (95% CI 0.85–0.90) when restricting to beneficiaries who had the same 5-digit zip code in 2004 as in 2009; 0.89 (95% CI 0.84–0.95) when only retaining beneficiaries with 0% or 100% probability of using well water; and 0.89 (95% CI 0.83–0.94) when restricting to the most certain PD cases. The PD-well water association was inverse among beneficiaries with or without constipation (respectively, OR = 0.84, 95% CI 0.79–0.90; OR = 0.88, 95% CI 0.85–0.92).
Risk of Parkinson’s disease in relation to use of well water, U.S. Medicare 2009
OR, odds ratio; CI, confidence interval; International Classification of Diseases Ninth Revision Clinical Modification, ICD-9; kg, kilogram; UV, ultraviolet light; ETS, environmental tobacco smoke. aExcludes 85 (0.09%) of cases without data on well water use. bExcludes 22,375 (0.10%) of controls without data on well water use (including 124 [0.10%] of controls with claims data), and 58 (0.0002%) additional controls with unknown sex. Sex was known for all subjects with claims data. cAll cases and a random sample of 0.5% of controls, who represent all cases and controls for whom complete Medicare claims data for 2004-2009, and therefore data on number of diagnoses and smoking, were available. dAdjusted for age (as 2 linear splines with a knot at age 85), sex and race/ethnicity (in 7 categories); and, if noted, additional covariates with all continuous variables modeled linearly. eProbability of well water use is a continuous variable ranging from 0 to 1 (0% to 100%), such that a one unit change, and hence the OR, compares beneficiaries with 100% probability of well water use vs. beneficiaries with 0% probability of well water use, i.e., similar to a dichotomous exposure variable. Use of well water means the probability of well water from an individual dug or drilled well, based on residential zip code in the PD diagnosis/control reference year. fNumber of physician visits (outpatient institutional visits and visits to physician offices combined) in 2008 (prior to PD diagnosis/control reference). gTotal number of unique ICD-9 diagnosis codes up to PD diagnosis/control reference date. hProbability of ever/never tobacco smoking, determined based on tobacco-specific ICD-9 diagnosis codes and a probabilistic model based on sex, race/ethnicity, birth cohort and >600 other diagnosis and procedure codes. iPercent of county residents who smoke tobacco daily. jAny UV-related cancer [59] according to ICD-9 diagnosis code, as a proxy for lifetime outdoor physical activity.
Because the inverse association contrasted with a majority of previous studies, we conducted a post hoc Cox proportional hazards survival analysis to attempt to replicate our results using a different analytical approach. Using complete Medicare claims data and base files for 2010–2014, we followed all controls for whom we had claims data and who survived through 2009 (N = 115,492) for up to 5 years, from January 1, 2010 until death, PD diagnosis (N = 2,326) or December 31, 2014. Again we observed an inverse association between use of well water and PD (hazard ratio = 0.83, 95% CI 0.72–0.97). Similarly, in another post hoc analysis given our unexpected findings, we examined the association between PD and the probability of well water use as assessed at the county level in 2010, i.e. at the time of diagnosis/reference. Here again we observed a significant inverse association despite the broader geographic scale when estimating exposure (OR = 0.94, 95% CI 0.89–0.99, adjusted for age, sex, race/ethnicity, smoking and number of diagnosis codes). Finally, we explored whether the inverse association between well water use and PD could occur due to greater recognition or coding of PD in the most urban areas. We recategorized controls as PD cases if they had each of the following: tremor (ICD-9 333.1 or 781.0), gait/coordination abnormality (ICD-9 781.2 or 781.3) and at least one additional condition associated with PD (constipation [ICD-9 564.0x], REM sleep behavior disorder [ICD-9 327.42] or smell/taste disturbance [ICD-9 781.1]) The association between our primary well water variable and PD remained inverse (OR = 0.92, 95% CI 0.90–0.95) when we treated the 794 (0.7%) of controls from the control group who met these criteria as PD cases who each represented 200 cases nationwide. We applied this weight (in logistic regression) because our controls were a 0.5% random sample of all eligible controls.
Well water and PD risk by state
Use of well water was not associated with greater risk of PD in any individual state after Bonferroni correction (Fig. 2). In addition, all OR point estimates >1 were relatively modest. ORs were >1.10 in only four states: Alaska, Connecticut, Massachusetts and Tennessee. The association between well water use and PD in Tennessee represented the largest positive association (1.33, 95% CI 1.07–1.65, p = 0.01). This association weakened (OR = 1.24, 95% CI 0.99–1.54) when we excluded Memphis, which is both populous and served by ground water rather than surface water. However, the risk of PD in relation to well water use in Alaska was very similar in models with or without Fairbanks, which shares these relatively unique features with Memphis.
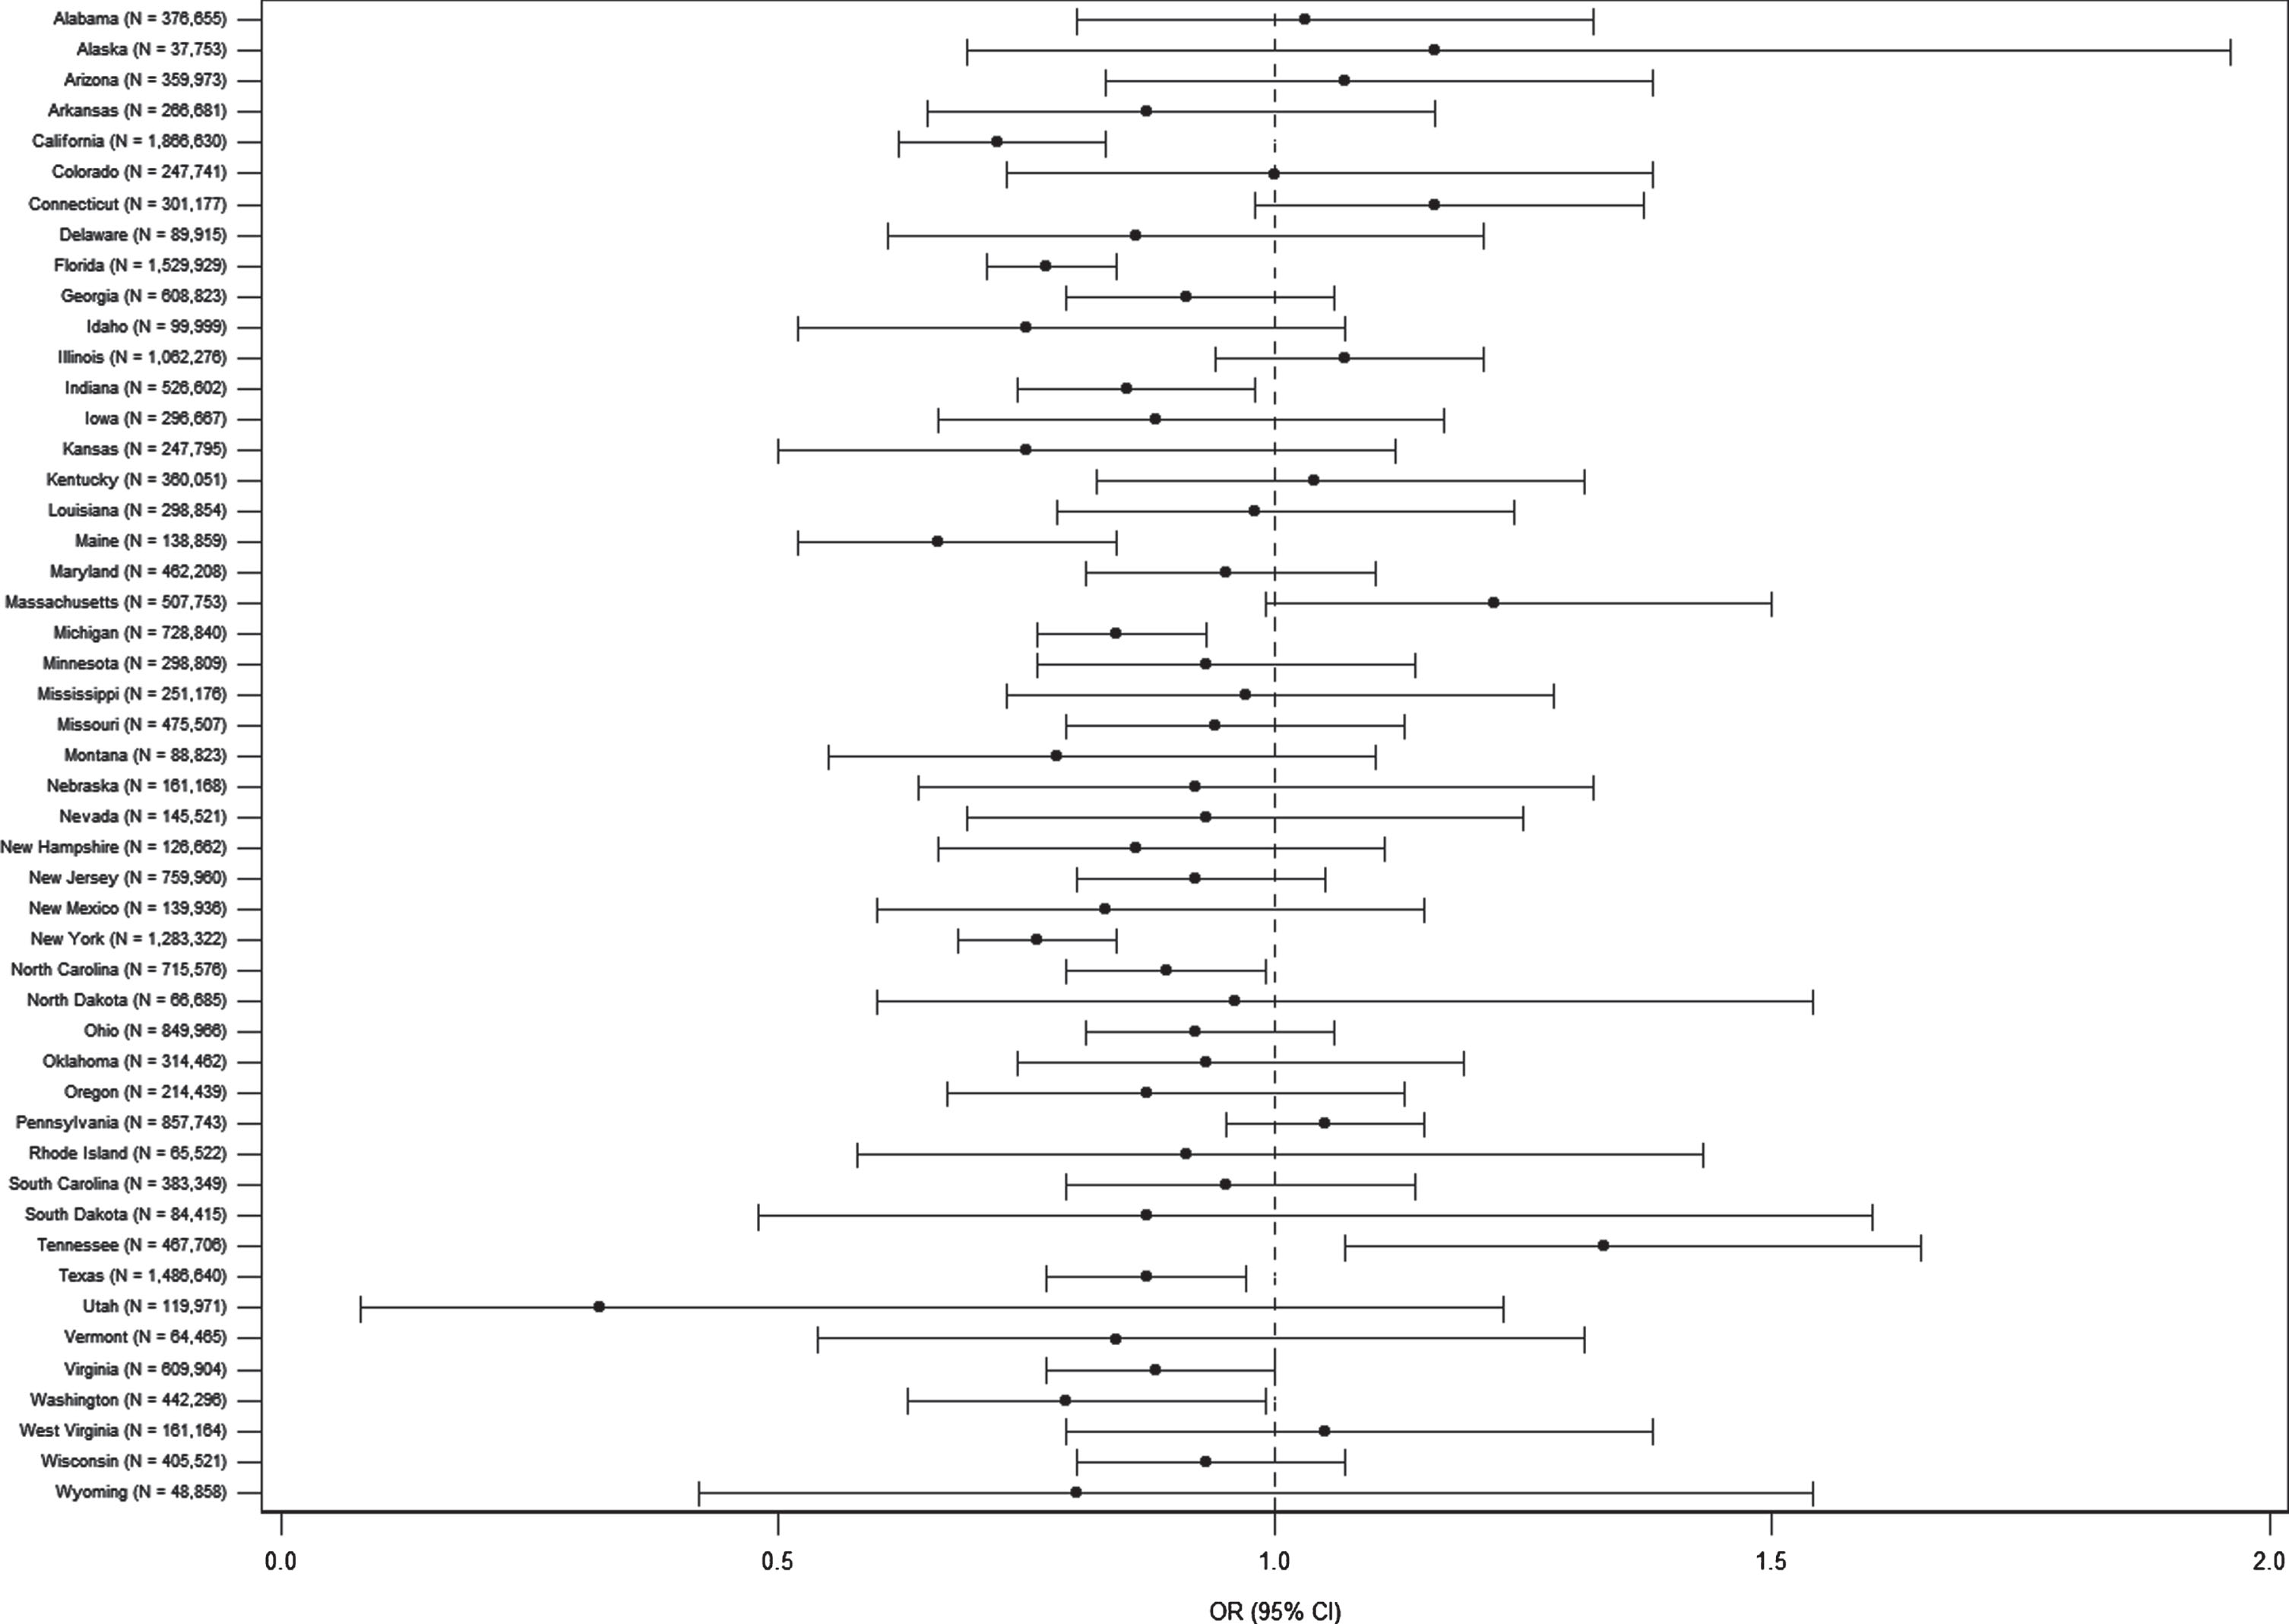
Risk of Parkinson’s disease in relation to use of well water, by state, U.S. Medicare 2009. Use of well water was not significantly positively associated with Parkinson’s disease in any individual state after Bonferroni correction (p < 0.001). Use of well water means the probability of well water from an individual dug or drilled well, based on residential zip code in the PD diagnosis/control reference year. Probability of well water use is a continuous variable ranging from 0 to 1 (0% to 100%), such that a one unit change, and hence the OR, compares beneficiaries with 100% probability of well water use vs. beneficiaries with 0% probability of well water use, i.e., similar to a dichotomous exposure variable. All ORs and 95% CIs are adjusted for age (as 2 linear splines with a knot at age 85) and sex. ORs and 95% CIs are adjusted for race/ethnicity in as much detail as possible for each state (Supplementary Table 3). OR, odds ratio; CI, confidence interval.
Five states had a significant inverse association between well water use and PD after Bonferroni correction: California, Florida, Maine, Michigan and New York (Fig. 2). These were among the most populous states (Fig. 2) or among those with above average use of well water (Supplementary Table 3).
DISCUSSION
In this large, population-based study of well water and PD risk across the entire U.S, we observed a modest inverse association between use of private well water and PD, in contrast with several previous studies [7–24]. The large number and geographic distribution of residences allowed for a statistically powerful nationwide analysis and an ability to explore results in disparate regions. We did not observe an increased risk of PD nationwide or, after correction for multiple comparisons, in any individual state. There are several reasons our results might differ from previous studies of the association between well water and PD risk. Of particular note, most prior studies have been clinic-based interview studies, and it is very plausible that PD cases were more willing than controls to travel farther to reach the clinic in order to receive care or participate in the study. In general, this would bias the PD-well water OR upward, and thus potentially even create a spurious positive association when the true association is inverse. Our study was records-based and therefore not subject to this bias. In addition, we identified incident cases and highly comparable controls within a well-defined population. Accordingly, our PD study demonstrated all known demographic associations, as well as the known associations for smoking, constipation and REM sleep behavior disorder [42]. These expected results provide evidence of the strength of our design and the generalizability of the results. Of note, a meta-analysis of PD and well water use did observe an OR of 1.0 when restricting to the highest quality studies [69]. The present work further calls into question the generally accepted notion that the use of well water increases PD risk.
In a state-by-state analysis, the states with a significant inverse association between use of well water and PD either had either a particularly large number of Medicare beneficiaries or above average use of well water, and therefore relatively good statistical power. While no states demonstrated a strong positive association between well water and PD, our analysis does not rule out such an association in smaller geographical areas. Specifically, our study was not designed to test for highly localized geographic effects of specific contaminants. For example, one well-designed case-control study determined that exposure to PD risk was increased in relation to well water potentially contaminated with diazinon in an agricultural region of California [19]. We did not consider geographic regions smaller than states, which is a limitation since many states are diverse in terms of land use. We observed an inverse PD-well water association for California overall, despite some agricultural regions within California potentially having an increased risk of PD among well water users. Similarly, we did not systematically explore whether any particular environmental exposure might affect PD risk. Selected pesticides and solvents are among the most common contaminants in private wells in the U.S. [70], and a recent geographic study in France confirmed that both groups of chemicals might include agents that increase PD risk [71]. However, in private wells in the U.S. pesticides and solvents are typically present at levels below federal drinking water standards [70] and “well water” is likely a poor indicator of exposure to these classes of chemicals from drinking water. In addition, a complete examination would require consideration of multiple sources of exposure, not just water.
Overall, the inverse association we observed between the use of well water and PD nationwide was robust. We also found little evidence for confounding by a variety of potential confounders, or for reverse causation, whereby individuals with prodromal PD might move to urban areas as they begin to manifest symptoms. However, we cannot fully discount either of these possibilities, or other effects of prodromal PD, given the limited ability to apply exposure lagging or to account for potential confounders using individual level data. At the same time, we cannot rule out the possibility that PD risk is increased by environmental exposures that are more prevalent in regions served by public water. For example, disinfection byproducts are more common in public tap water than in water from individual private wells, although there is currently no evidence that exposure to these chemicals is associated with a greater risk of PD. In addition, air quality is poorer in urban areas than in rural areas, particularly with respect to fine particulate matter (PM2.5) [72]. Air pollution, particularly from traffic, including PM2.5, was associated with increased risk of PD in a recent meta-analysis [73]. Such an association is biologically plausible because urban air pollution has been associated with neuroinflammation and cerebrospinal fluid oligomeric α-synuclein in humans [74, 75]. Similarly, a variety of other exposures might be more common in non-rural areas. For example, exposure to agricultural pesticides is not the only source of pesticide exposures. It is possible that as compared to rural areas, which often are non-agricultural areas, residential use of pesticides in and around homes might be more common in urban and suburban areas. We were unable to consider this potential confounder in the present records-based study. Given a 42% increased risk of PD in relation to pesticide exposure [76], we estimate that the difference in exposure to pesticides would need to be very marked – for example a 15% prevalence of pesticide exposure among controls who use well water but a 55% prevalence of pesticide exposure among controls who do not use well water – in order to have biased an OR of 1.00 down to the OR we observed.
We also acknowledge some additional limitations. There are other potential confounders that we could not address that also could have biased ORs downward, such as some types of physical activity and education/socioeconomic status. Another important potential limitation is that PD ascertainment was based upon claims data that may contain some inaccuracies. Nonetheless, we observed a clear, significant inverse association even when restricting to our most certain PD cases, or when we explored the effect of broadening our case criteria to include controls with evidence of PD, based upon motor signs identified by ICD-9 codes, but not yet identified as having PD. Similarly, there will be misclassification of exposure because we only considered water source for the most recent residence; however, some beneficiaries lived in other regions earlier in life, and early life exposures might be relevant [6]. In addition, we relied on a probabilistic measure of exposure. We note, though, that use of well water in our nationwide Medicare-aged sample from 2009 is consistent with the overall estimate that 15% of homes in the U.S. used well water in 2007 [77]. More importantly, results were unchanged when we restricted to beneficiaries with probabilities of either 0% or 100%, i.e. essentially with water source known. Finally, some beneficiaries likely drank bottled or filtered water, so their assigned water source might not accurately reflect exposures from ingesting water. However, insofar as exposure measurement error did not differ by PD case status, this error likely biased our results toward null. Therefore, exposure measurement error is an unlikely cause of the inverse association between well water and PD.
In summary, reliance on well water does not appear to increase risk of PD in general. While this does not preclude the possibility that specific contaminants in well water increase PD risk in more focused geographic regions, it does provide substantial reassurance that well water is not a risk factor for PD. This contradicts the generally accepted notion that use of well water increases PD risk, and the inverse association we found suggests potentially that some future environmental epidemiologic studies might focus on urban risk factors for PD.
CONFLICT OF INTEREST
The authors have no conflicts of interest to report.
Footnotes
ACKNOWLEDGMENTS
We thank Dr. Beth A. Mueller of the Fred Hutchinson Cancer Research Center for assisting us with the primary validation study component of the present work. We appreciate the assistance of the American Academy of Family Physicians, which provided the Uniform Data System (UDS) Mapper (![]() ).
).
The results reported herein correspond to specific aims of grant K01ES028295 to Susan Searles Nielsen from NIH – NIEHS. This work was also supported by grants K24ES017765 from NIH – NIEHS; grants from the Michael J. Fox Foundation; grants from the American Parkinson Disease Association (APDA); an APDA Summer Student Fellowship (PDF-APDA-SFW-1664); the Washington University School of Medicine Dean’s Fellowship and R03CA94735 from NIH – NCI. The funding organizations played no role in the study design, analysis or decision to publish.