
Abstract
Background:
Flortaucipir PET, a marker of tau tangles, has shown lower than expected cortical uptake in Parkinson’s disease (PD), than would be predicted from neuropathologic estimates of Alzheimer’s disease co-pathology. Instead, the most characteristic finding of flortaucipir imaging in PD is decreased uptake in the substantia nigra, reflecting reduction in its “off-target” binding to neuromelanin. We have previously reported these observations in cross-sectional studies.
Objective:
Here, we present two-year follow-up data of cortical and nigral flortaucipir uptake in PD patients.
Methods:
Seventeen PD patients received repeat flortaucipir PET two years after baseline. We interrogated vertex-based group-wise cortical tracer binding (SUVRs) with a cerebellar reference using the general linear model while mean substantia nigra SUVRs were compared with volumes of interest group comparisons and voxel-wise group analyses using ANOVA. Finally, we performed linear regressions of tau load with changes in MoCA and UPDRS motor scores.
Results:
We found no significant changes in substantia nigra or cortex flortaucipir uptake in Parkinson’s disease patients over two years and no association with changes in cognitive symptoms. Signal reduction in the medial substantia nigra trended towards an association with worsening of motor symptoms.
Conclusion:
No significant increase in tau tangles occurred after a two-year follow-up of Parkinson’s disease patients using flortaucipir PET.
INTRODUCTION
Tau paired helical and linear tangle imaging in Parkinsonian disorders has potential for differential diagnostic use and for identifying subgroups of Parkinson’s disease (PD) patients likely to benefit from treatment targeting Alzheimer’s disease (AD) co-pathology. However, initial results from tau imaging studies in PD have shown inconsistent findings [1–4].
Most studies of in vivo tau imaging have been conducted using positron emission tomography (PET) with the first generation tau-paired helical tangle tracer flortaucipir, previously known as [18F]-T807 and [18F]-AV1451 [5]. Other first generation tracers include [18F]-THK5351 and [11C]-PBB3 [6]; the former has subsequently been shown to preferentially bind monoamine oxidase type B (MAO-B) [7] while PBB3 binds to both linear and paired helical tau fibrils [6].
The differential diagnostic potential of tau imaging within Parkinsonian disorders relies on differences in tangle distribution in PD and the tauopathies progressive supranuclear palsy and corticobasal degeneration [8]. However, in vivo flortaucipir binding to the 4-repeat tau present in the atypical diseases has proven to be lower than expected [9, 10]. Analyses have been further complicated by the presence of additional binding targets in key regions of interest, including neuromelanin in the substantia nigra [9, 11], monoamine oxidase type A (MAO-A) [12], MAO-B [12] in areas with gliosis [7, 14], age- and iron-containing targets in the basal ganglia [15], and uptake by the choroid plexus [16, 17].
Tau binding of flortaucipir has also proven lower than predicted in PD from pathological studies [1–4, 19], and is often absent even when PD is associated with single and multi-domain mild cognitive impairment [2, 18], in contrast to its frequent presence in pre-clinical AD [20–23].
The most striking feature in flortaucipir imaging of patients with PD is the loss of signal seen in the substantia nigra [2–4, 11]. This most likely reflects a loss of neuromelanin, levels of which have been extensively studied using post-mortem methods [24–31]. Neuromelanin shows a continuous buildup with age [29], and progressive loss in PD [32]. In this study, we present a two year follow-up findings of flortaucipir binding in the substantia nigra [11] and cortex of PD patients [18]. We hypothesize that (a) cortical uptake increases with cognitive decline, as seen in AD [20]; (b) flortaucipir uptake in the substantia nigra decreases over time in PD [32].
METHODS
Recruitment
Patients with PD were recruited as previously described [11, 18]. In brief, all PD patients were diagnosed by movement disorder specialists according to UK Brain Bank criteria and all patients showed nigrostriatal dysfunction on dopamine transporter single-positron emission computed tomography or 18F-FDOPA PET. Patients were stratified into groups with (PD-MCI) or without (PD-nonMCI) mild cognitive impairment after baseline neuropsychometric evaluation, as described [18]. Healthy controls were recruited through advertising in local newspapers. Healthy controls underwent neuropsychometric evaluation to rule out cognitive decline. The project was approved by the regional Ethics Committee. However, due to radiation dose considerations, we were unable to perform follow-up PET on healthy controls.
Follow-up
Follow-up involved repeat interviews, Montreal cognitive assessments (MoCA), ratings with the Unified Parkinson’s Disease Rating Scale Part 3 (UPDRS-III) and flortaucipir PET as previously described [11]. In short, subjects were injected with 300 MBq of 18F-flortaucipir. Six minutes transmission scans were performed immediately before the emission scans in list-mode from 80 to 120 min post-injection. The PET emission data were binned into eight time frames of 5 min each. Image based frame-by-frame motion correction was performed if needed. All follow-up scans were performed with the same Siemens High-Resolution Research Tomograph (ECAT HRRT; CTI /Siemens) as used for baseline scans. All UPDRS-III ratings were performed in the ON state at both baseline and follow-up. Magnetic resonance imaging (MRI) was not repeated for follow-up.
PET analysis
Significant changes in PET uptake data over two years were interrogated with Statistical Parametric Mapping version 12 (SPM12, http://www.fil.ion.ucl.ac.uk/spm/) on a MATLAB R2017b (MathWorks, Natick, Massachusetts, USA) platform and with FreeSurfer 6.0 (https://surfer.nmr.mgh.harvard.edu/). Baseline and follow-up PET were coregistered to baseline T1-weighted MRI with SPM12. PET and T1-weighted MRI were then transformed into standard Montreal Neurological Institute (MNI) stereotactic space using this software.
Substantia nigra
The substantia nigra was analyzed using a volume of interest (VOI)-based analysis followed by a voxel-wise analysis.
VOIs were sampled in MNI space using a modified version of Hammers’ maximum probability atlas [33] and extracted in MATLAB using an in-house script. Modifications to Hammers’ atlas were similar to those used in the baseline studies; (1) the substantia nigra VOIs were expanded and split into lateral and medial halves; (2) a cerebellar reference region was created from the original cerebellar VOIs, shrunk by 2 mm and excluding the anterior lobe. All individualized VOIs and PET coregistrations were visually inspected in template space on the normalized T1-weighted MRI. No post-filtering of the PET data was used in the volume of interest analyses.
For voxel-wise analyses within the substantia nigra, standardized uptake value ratio (SUVR)-maps with intensity normalization to the cerebellum reference were created. Difference maps were calculated using SUVR maps of baseline and follow-up PET (ΔSUVR = SUVRfollow - up – SUVRbaseline). Using SPM12, voxel-wise two-tailed t-tests of ΔSUVR maps of PD-nonMCI and PD-MCI were created with individual groups versus zero, and the one group versus the other. Search space was confined to the substantia nigra. Two approaches were used: (1) a conservative approach with family-wise error correction (FWE), and a liberal approach with a cluster-defining p-value of 0.01.
Cortex
The cortex was analyzed using a VOI-based analysis followed by a vertex-wise analysis. For estimation of Braak’s cortical tau stages, additional VOIs defining the entorhinal cortex, precuneus and primary visual cortex were added. In addition, the hippocampus and fusiform cortex were split into anterior and posterior parts. Cortical VOIs were individualized by convolving the atlas with the subject’s gray matter probability maps segmented using an intensity threshold of 0.5.
For cortical vertex-wise analysis, T1-weighted MRIs were imported into FreeSurfer using its built-in pipeline. Baseline, follow-up and ΔSUVR PET images in MRI space were created using SPM12, and imported into FreeSurfer. A 6 mm FWHM smooth was applied to increase signal to noise. Using FreeSurfer, a general linear model was created including ΔSUVR maps of PD-nonMCI and PD-MCI. Between group t-tests and t-tests versus zero were performed. Cluster-wise correction for multiple comparisons was performed using a vertex-wise/cluster-forming threshold p-value of 0.05, one-sided, positive, to look for signal increase compared to zero. In addition, two models were created comparing ΔSUVR in PD patients with (1) ΔMoCA score, one-sided p = 0.05, searching for negative association, and (2) change in UPDRS-III score, one-sided p = 0.05, searching for positive association.
Statistical analysis
Demographics and VOI data were statistical interrogated with Stata 13.1 (StataCorp LP, Texas). Continuous variables were tested for a normal distribution using Shapiro-Wilk’s test, and equality of variance using Bartlett’s test. Normally distributed equal variance continuous variables were interrogated using one-way ANOVA, with post hoc pairwise comparison of the mean using t-test. Non-normal distributed or unequal variance continuous variables were interrogated using the Kruskall-Wallis test, with post hoc pairwise comparison using Wilcoxon’s (Mann-Whitney’s) rank-sum test. Because we did not have a healthy control group for follow-up, ΔSUVR values were also compared versus zero change using one-sample Student’s t-test or, if non-normally distributed, Wilcoxon’s signed rank test. Categorical data were compared using Fisher’s exact test. Linear regression was used for interrogating association, followed by model verification by diagnostic plots of residuals. The seven VOIs used for Braak staging of tau tangle distribution were tested for association with changes in MoCA (ΔMoCA = MoCAfollow - up – MoCAbaseline): entorhinal, hippocampus, fusiform, middle and inferior temporal gyri, superior temporal gyrus, precuneus and primary visual cortex (Supplementary Figure 1). P-values < 0.05 were considered statistically significant. The Holm correction was applied for multiple comparisons in the cortex.
RESULTS
All 26 PD patients from baseline were contacted requesting follow-up. Two patients were physically unable to attend, two patients had undergone deep brain stimulation surgery, three did not respond. Two patients were excluded due to technical difficulties during scans (delayed start or cerebellum reference outside field of view). Demographics and VOI-based analyses at baseline and follow-up for the remaining 17 are presented in the Table. Eleven out of the 17 patients received MAO-B inhibitor treatment at baseline, and eight still received this treatment at follow-up. One patient had stopped MAO-B inhibitor treatment more than 9 months before follow-up, two did not remember exactly when they had stopped. No-one had started MAO-B inhibitor treatment between baseline and follow-up.
Substantia nigra
The VOI-based analysis revealed no differences between the PD-nonMCI and PD-MCI groups in ΔSUVR of the total substantia nigra VOI (N = 17, t-test, t = 1.28, p = 0.22), or in the lateral (t = 1.18, p = 0.26) or medial subdivisions (t = 1.14, p = 0.27) (Table 1, Fig. 1). No significant decreases were seen in ΔSUVR in the PD group as a whole (one sample t-test ΔSUVR versus zero, N = 17, t = –1.47, p = 0.16), or in the PD-nonMCI alone (N = 14, t = –0.84, p = 0.42). The absence of significant nigral ΔSUVR reductions in the PD group as a whole and the PD-nonMCI group was confirmed in the voxel-based analysis (Fig. 2).
Demographics and results
First column: (A/B), groupwise p < 0.05 at baseline, ANOVA / Kruskal-Wallis. (C/D), groupwise p < 0.05 at follow-up, ANOVA / Kruskal-Wallis. Other columns: (a/b): p < 0.05, post-hoc t-test or Wilcoxon rank-sum test, versus Controls / PD-nonMCI. (d/e): p < 0.05, ΔSUVR versus 0, t-test / Wilcoxon signed-rank test). Uncorrected p-values. Mean±SD.
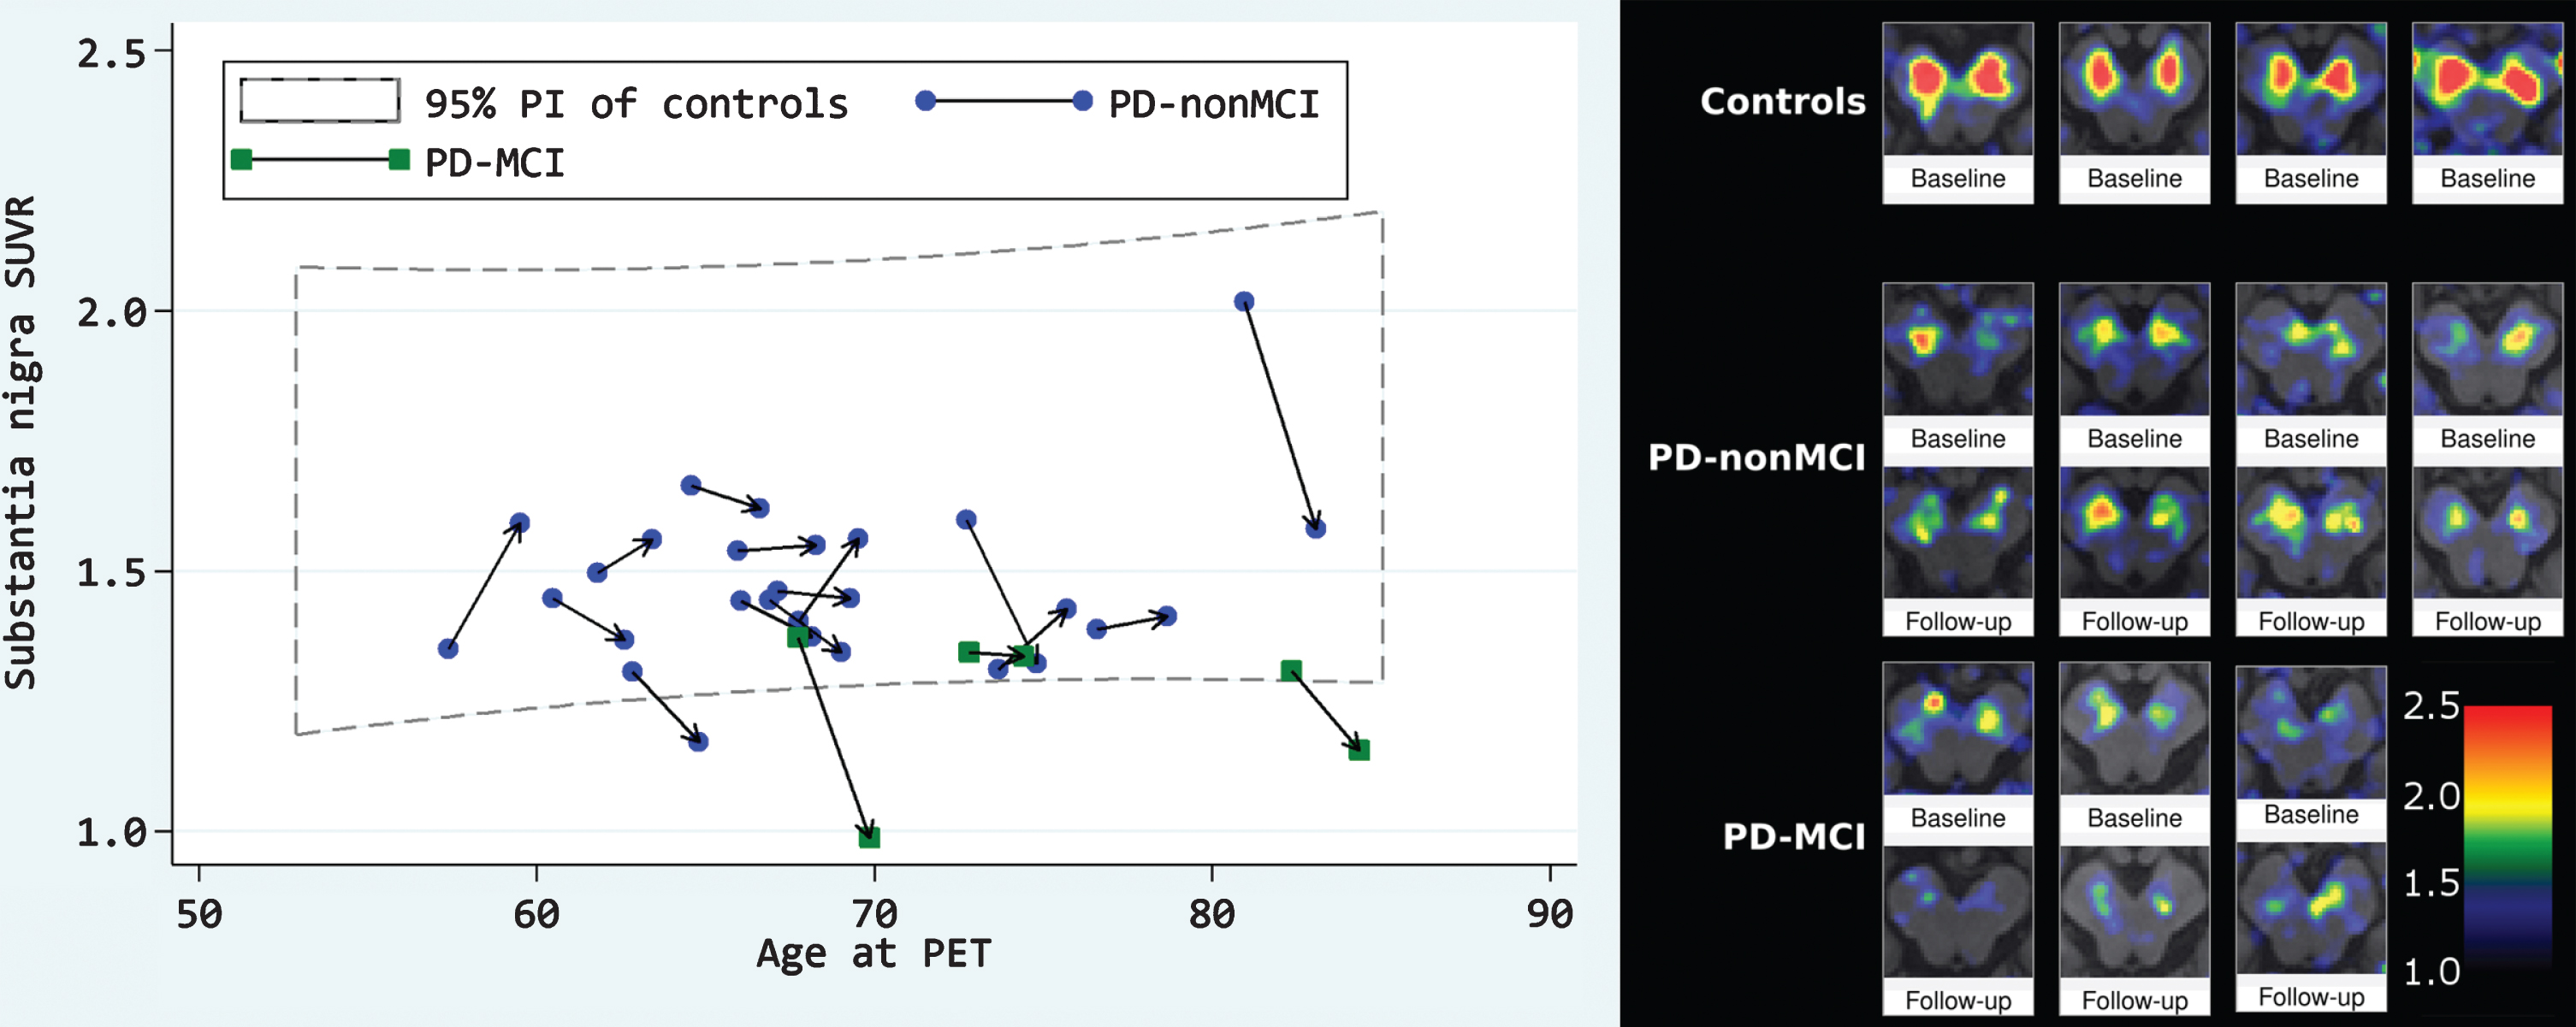
Individual changes in flortaucipir PET SUVR in substantia nigra over time. Left: 95% prediction interval (PI) of controls refers to all healthy controls at baseline. Connected symbols represent the same subject, arrow points to follow-up. Right: Randomly chosen individual samples. 3mm PET signal smoothing, template space. Lower right color scale applies to all images.
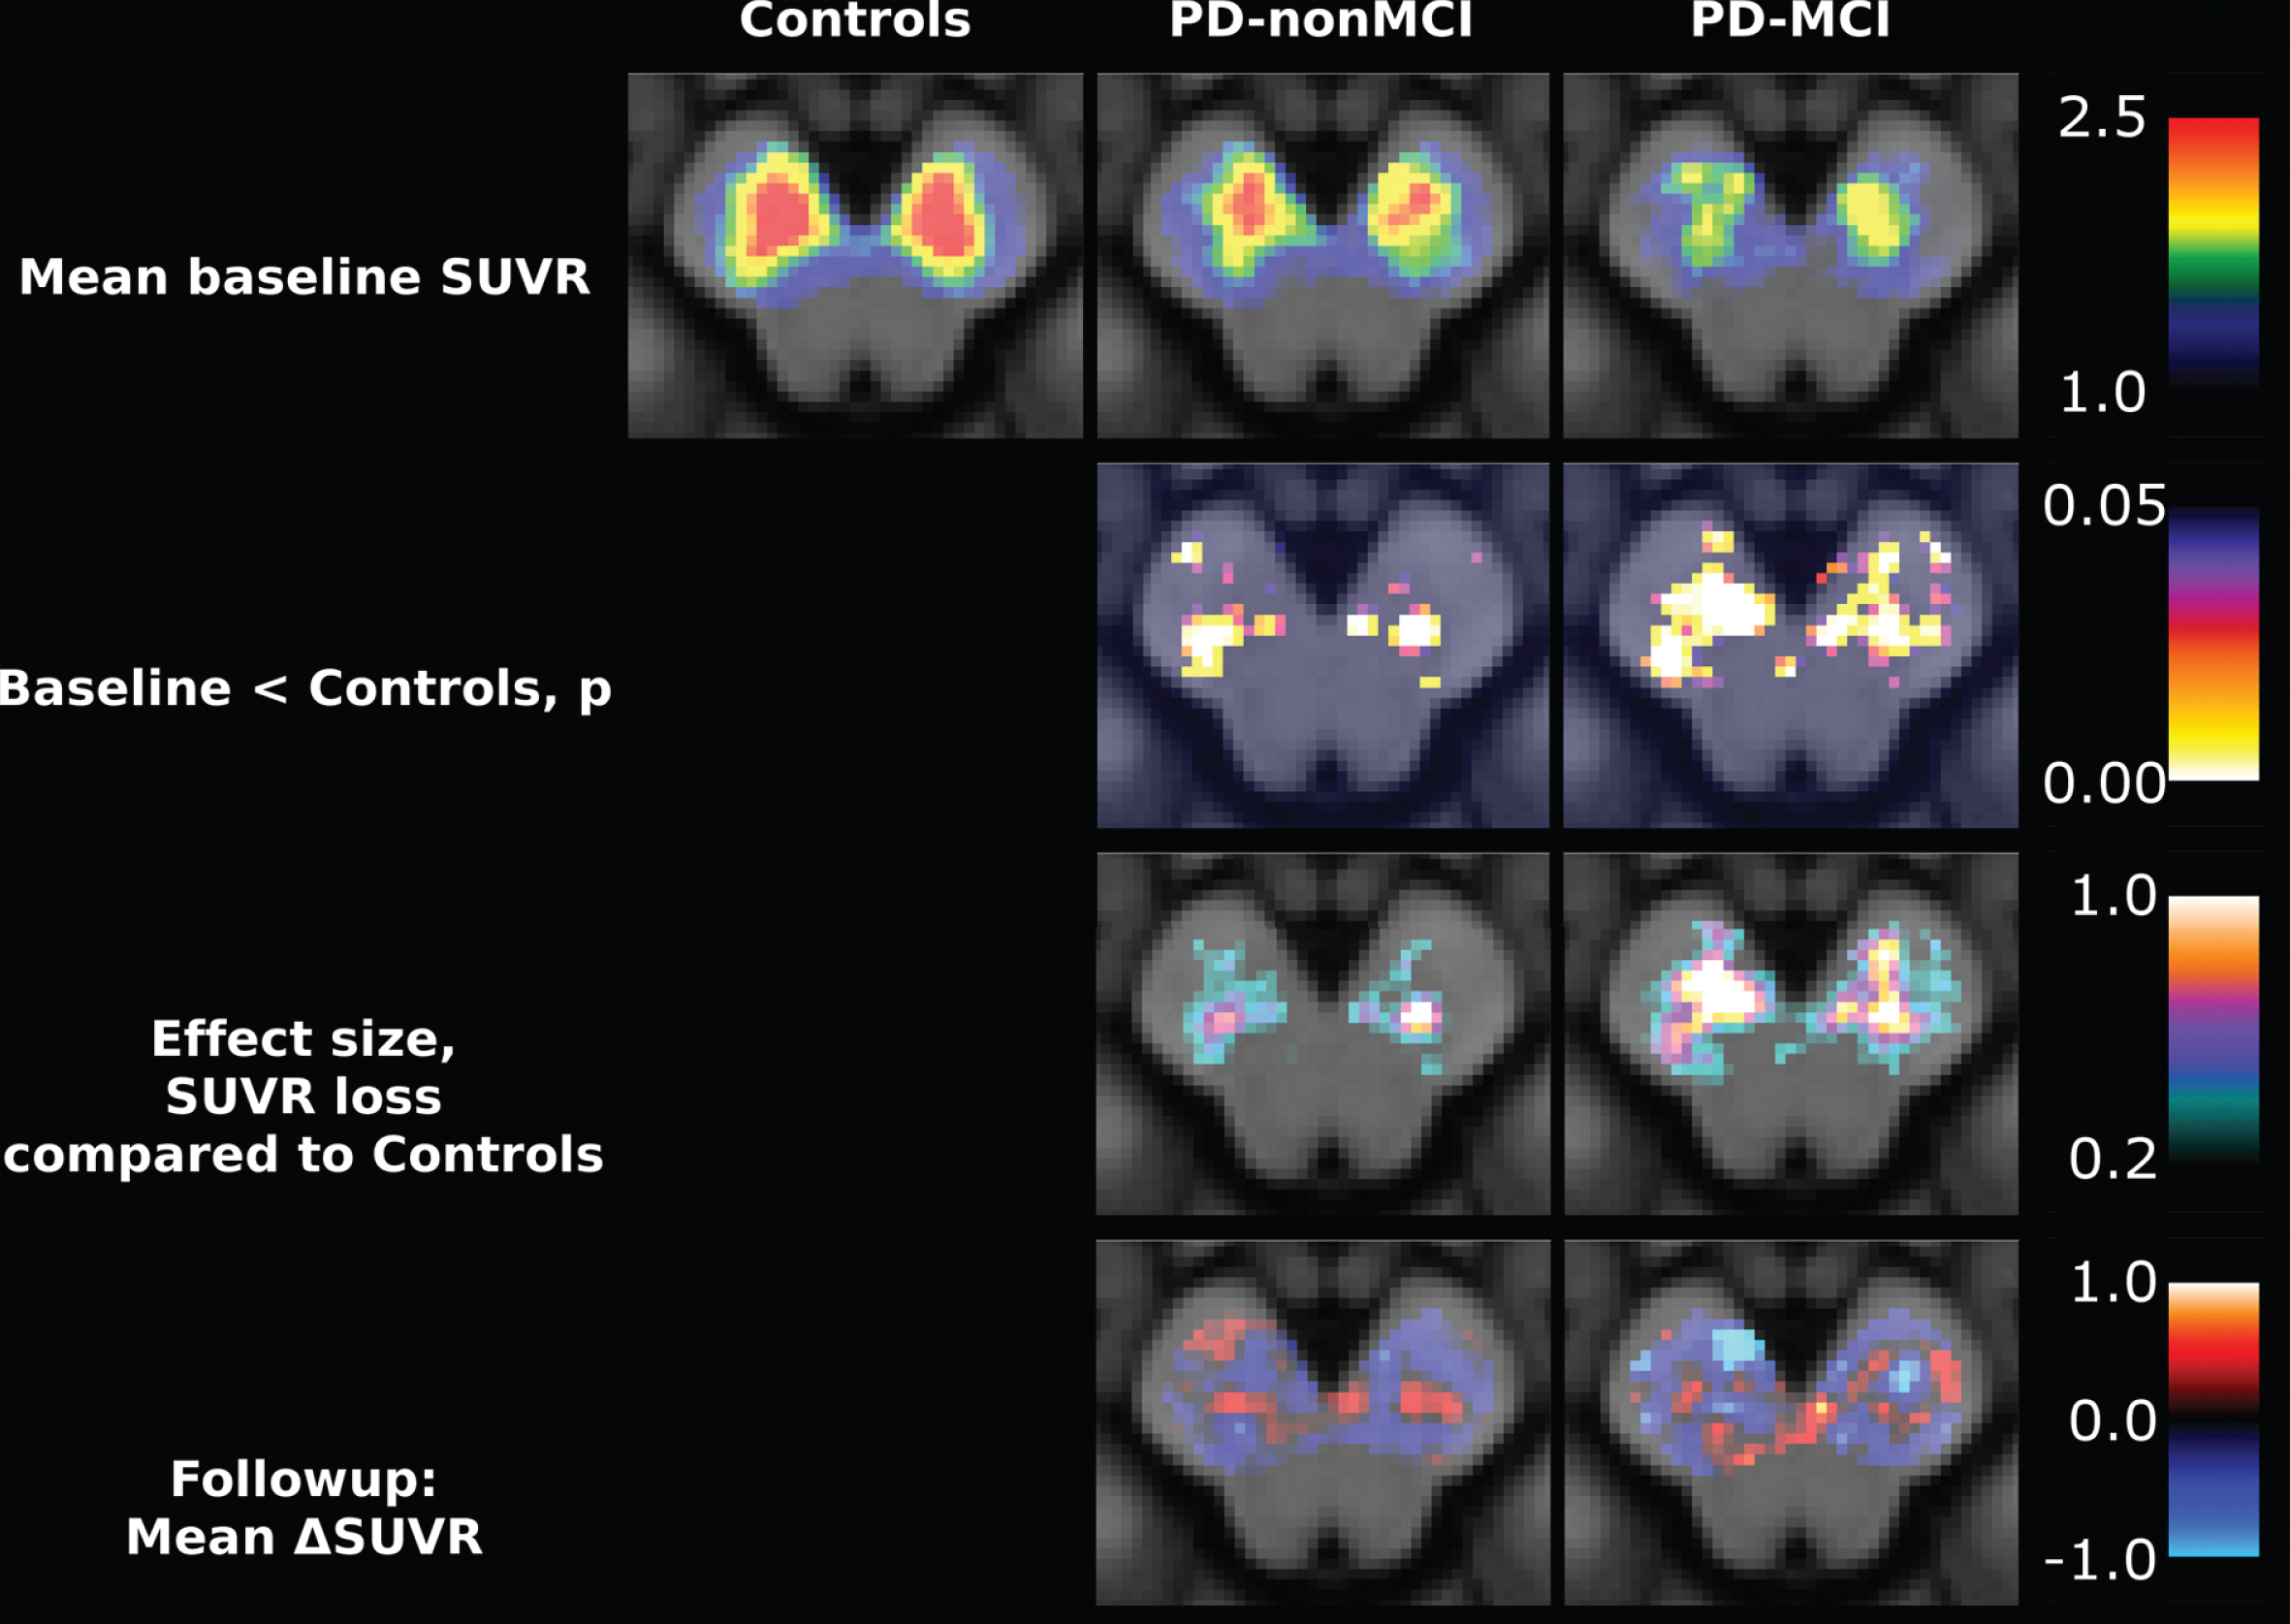
Voxel-wise analysis within substantia nigra. First row: Mean of all groups at baseline. Second row: Uncorrected p-values comparing at baseline the groups with healthy controls. Only six voxels survive multiple comparison correction, with search space limited to substantia nigra. Third row: Difference in SUVR when compared to healthy controls. Fourth row: Mean change from baseline in those with follow-up. No voxel demonstrated significant SUVR decrease after multiple comparison correction. Neurologic orientation, meaning left side of image is left side of patient. Color scales on the right apply to entire row.
A trend towards association was seen between change in UPDRS-III score and medial substantia nigra signal (linear regression, R2 = 0.20, p = 0.08, 95% CI [–34.6 1.9], N = 17, all PD patients). There was no significant association when looking at the total nigra (R2 = 0.08, p = 0.28), or restricted to the lateral halves (R2 = 0.00, p = 0.82). No associations were seen between ΔMoCA score and ΔSUVR in substantia nigra (N = 17; total nigra: R2 = 0.05, p = 0.40, 95% CI [–2.8 9.6]; lateral nigra: R2 = 0.05, p = 0.39; medial nigra: R2 = 0.03, p = 0.50).
Cortex
The VOI-based analysis revealed no significant group differences in ΔSUVR of any cortical region (Table 1). We saw two non-intuitive trends which did not survive correction for multiple comparisons: (1) decrease in the hippocampus SUVR in PD-MCI compared to PD-nonMCI (two sample t-test ΔSUVR, t = –2.38, uncorrected p = 0.031, 95% CI of ΔSUVR = [–0.014 –0.249]), and (2) decreased uptake in the primary visual cortex of PD-nonMCI (one sample t-test ΔSUVR versus zero, t = –2.52, uncorrected p = 0.026, 95% CI of ΔSUVR = [–0.005 –0.065]).
Among the pooled PD patients, we found no associations between ΔMoCA and ΔSUVR in Braak stage defining areas (N = 17, all uncorrected p > 0.05).
The vertex-based analysis revealed no significant clusters after correction for multiple comparisons, when comparing flortaucipir ΔSUVR in PD patients against zero change (Fig. 3), or when interrogating for negative associations between ΔSUVR and ΔMoCA, or positive associations between ΔSUVR and ΔUPDRS-III score.
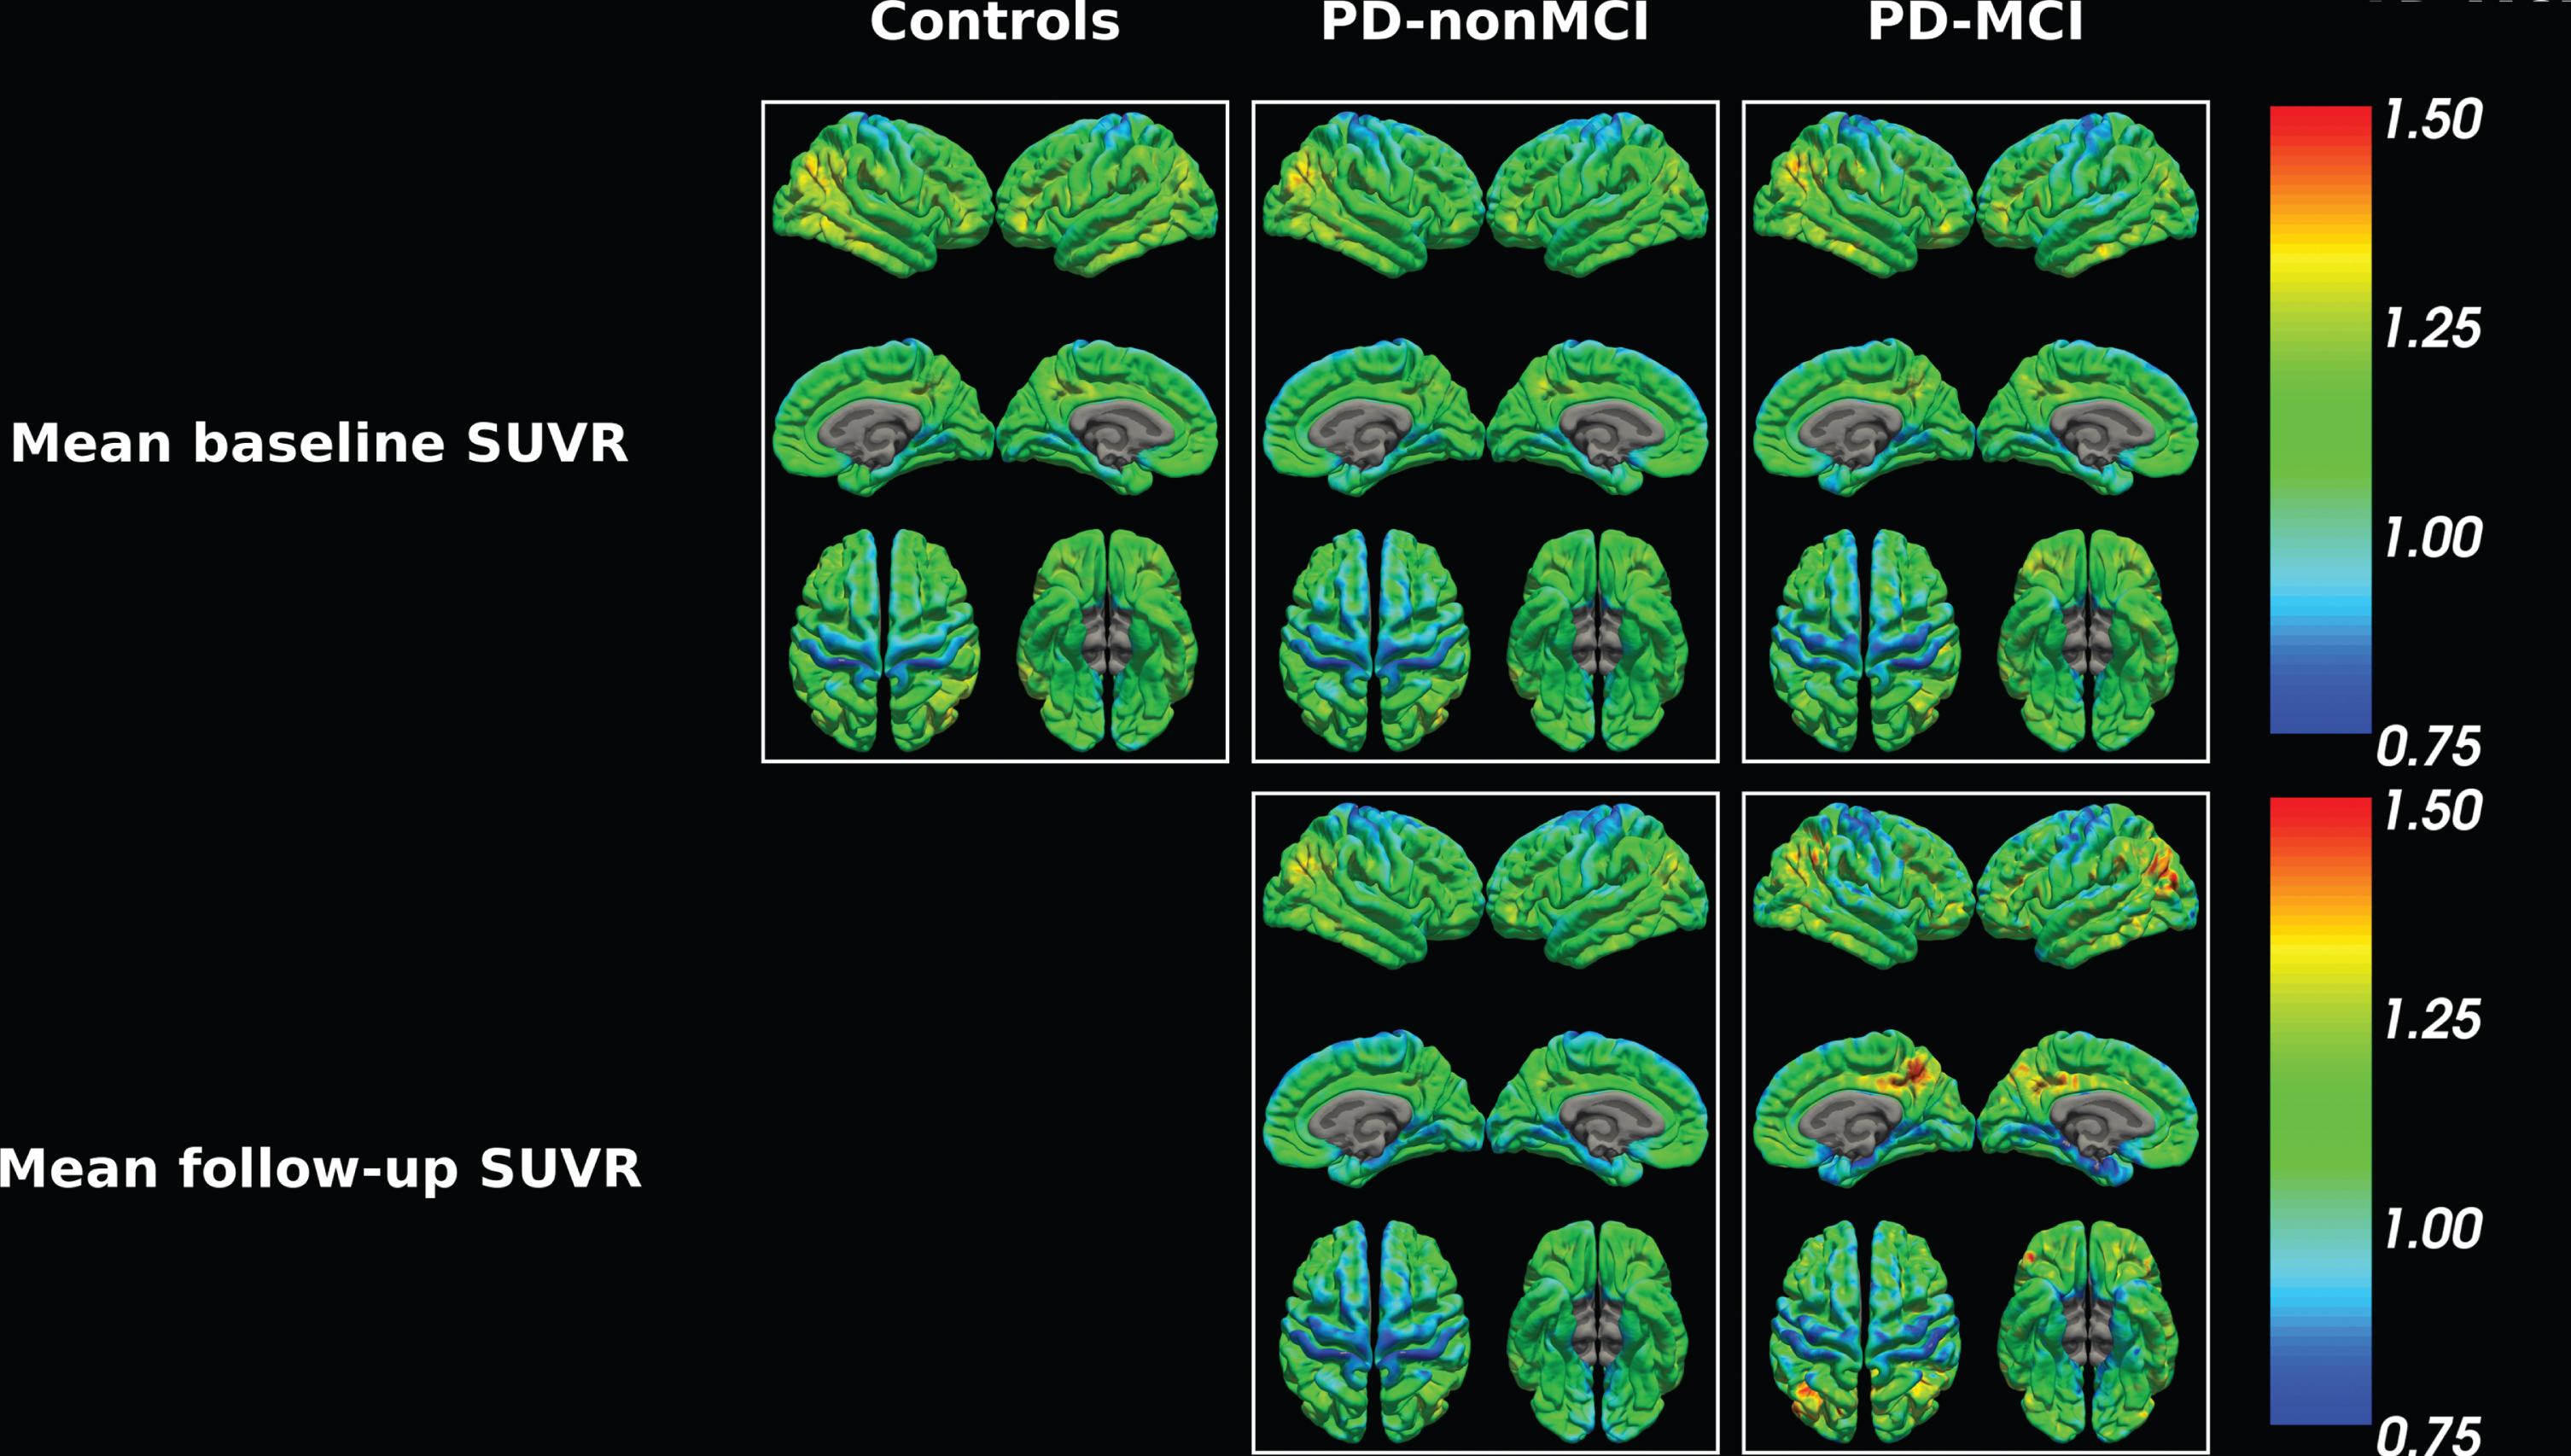
Vertex-wise cortical analysis. First row: Mean of all groups at baseline. Second row: Mean of groups at follow-up.
DISCUSSION
We have previously reported on the baseline loss of flortaucipir uptake in the substantia nigra of patients with PD [11], later reproduced by at least four other groups [2–4, 34]. We have also reported the low prevalence and low magnitude of tau pathology revealed by flortaucipir PET in PD patients with cognitive deficits pre-dementia [18]. These results compared well with a similar study by Winer et al. [2], and were in line with results including PD patients with dementia [1, 4].
Substantia nigra binding
In this follow-up study, we did not detect significant loss of flortaucipir signal in the substantia nigra of PD patients at two-year follow-up. Fearnley and Lees estimated an exponential 45 % loss of pigmented neurons over the first 10 years of PD [35]. With a mean disease duration at baseline of around 4.5 years [18], we had expected to see a 9% decrease of specific signal over two years. It has been suggested that a proportion of the specific flortaucipir signal may derive from MAO-A binding [12], though MAO-A concentration appears to remain stable in PD substantia nigra [36]. We did not observe any significant nigral SUVR reduction in the PD group (one sample t-test, ΔSUVR/BaselineSUVR versus zero, N = 17, p = 0.19, 95% CI [–10%; 2% ]). It is likely, however, that our study was underpowered to detect a significant loss of nigral flortaucipir binding due to the limited sample size and only 2 years of follow-up. No data on test-retest variation were available when the project was conceived, but for cortical flortaucipir uptake, Devous et al. have later reported a standard deviation of mean percent change between test and retest of up to 5% using cerebellum as reference [37], but this was for much larger VOIs describing entire lobes and therefore had better signal to noise ratio. On the other hand, our study was performed on a scanner with superior resolution. Assuming a SD of test-retest cerebellar SUVR’s of 0.08 (“Combination” VOI from Table 4 in Devous et al.), an expected drop in nigral SUVR of 0.04 (10% of specific signal at baseline) and an alpha of 5% (onesided), the full baseline PD sample (N = 26) yields a power of 80%. Without the dropouts (N = 17), power is reduced to 63%.
Of interest, we did observe a trend in association between worsening of motor symptoms and reduction in neuromelanin signal from the medial parts of substantia nigra. In a cross-sectional study, Smith et al. previously demonstrated a correlation between UPDRS-III and total nigral flortaucipir uptake among patients with PD, PDD or DLB [3]. Most loss of neuromelanin occurs in the lateral nigra [35, 38], making it somewhat surprising to observe this trend in the medial nigra. However, with much of the neuromelanin in the lateral nigra already lost at the time of diagnosis, it may be easier to demonstrate a loss in the medial area due to better signal to noise ratio.
Cortical binding
We saw no differences in cortical tau load across either of the PD groups. This is in line with previous studies of flortaucipir PET in late stage PD [1, 4]. Group-wise differences have been reported, but SUVRs are low compared to those seen in AD. This is demonstrated in Fig. 1J in Smith et al. [3], and also by comparing Johnson et al.’s paper on AD/MCI [20] with Gomperts et al.’s study in the Lewy body diseases [1], that appear to apply the same VOI analysis: Mean(±SD) SUVRs in inferior temporal gyrus are reported as healthy controls: 1.20(±0.05), PD-nonMCI: 1.23(±0.03), PD-MCI/PDD: 1.28(±0.08), MCI: 1.47(±0.40), AD: 2.19(±0.36) (the Gomperts study reports standard errors. SD of healthy controls and PD groups are therefore calculated as [standard error]/√N, which may cause minor rounding errors). In comparison, given a sample size of 17, a follow-up time of 2 years, a test-retest SD of 0.08 [37], an alpha of 5% and a power of 90%, we would be able to detect a yearly change in SUVR of 0.034.
Tau tangles are more evident in amyloid positive compared with amyloid negative PD [3, 4] at pre-dementia stages [2]. We did not perform amyloid imaging here due to radiation dose concerns. In the post mortem literature, sufficient tau depositions are seen in 30% of end-stage PD patients to allow a secondary diagnosis of AD [19]. It is unclear why flortaucipir PET seems unable to capture this aspect of PD, but possible explanations could be: (1) differences in pathologic tau density in earlier PD which may be less evident in PET scans than pathologic staging, which rely more on spatial distribution than density [39, 40]; (2) flortaucipir’s preference for neurofibrillary tangles over neurites and ghost tangles [41], the prevalence of which may be different between PD and AD, and not necessarily accounted for during neuropathologic Braak staging; (3) while the microscopically determined tau pathology in both diseases is described as neurofibrillary tangles, the phosphorylation fingerprints of AD and PD are different [42], which ultimately could affect tracer binding. To our knowledge, only one flortaucipir PET scanned PD case has had post-mortem confirmation and this subject was only Braak tau stage 2 [43]. As in the baseline study, we observed no association between MoCA or UPDRS scores and cortical flortaucipir signal at follow-up. Inferior temporal gyrus and precuneus flortaucipir uptake has previously been associated with the MMSE and CDR-sum of boxes cognitive scores by Gomperts et al. in a PD cohort also including DLB patients [1]; however, this could not be reproduced by Smith et al. in a similar flortaucipir PET study [3] and while hyperphosphorylated tau in the inferior and lateral temporal lobe of patients with PDD (N = 3) was reported in a neuropathologic study by Walker et al., they found higher amounts of tau in the occipital lobe and the hippocampus [40]. Rather similar to the Gomperts study, Lee et al. demonstrated a correlation between MMSE and a parietotemporal pattern in cognitively impaired PD patients (PDD and PD-MCI), however the correlation seems driven by one or two outliers [4]. For cortical flortaucipir uptake and UPDRS-III scores, Lee et al. reports no correlation in DLB, but do not explicitly mention analysis in their PD patients [4]. We have previously reported decreased noradrenergic innervation to the motor cortex in PD [44], which could in principle lead to deposition of tau as an unspecific marker of axonal degeneration.
Possible MAO-B binding
Since publication of the baseline studies, doubt has emerged towards the specificity of flortaucipir PET. Though several targets of flortaucipir were described using autoradiography, including neuromelanin and other iron-binding substances [9, 10], autoradiography has been unable to identify the cause of age-dependent signal increase seen in the basal ganglia [11, 45]. The related first generation tau-tracer, THK-5351, was shown to be blocked by MAO-B inhibitor selegiline by Ng et al., who demonstrated up to 50% SUV reduction after a single dose of selegiline [7]. This was later confirmed by Villemagne et al. demonstrating up to 82% decrease after five days of selegiline treatment [46]. The crucial aspects of MAO-B binding relate to questions of affinity and distribution. In our original baseline flortaucipir data set of PD patients, 59% were treated with MAO-B inhibitors, but these patients did not display lower SUV values when compared to the 41% of PD patients, who were not on MAO-B blockers (Thalamus: 95% CI [–11.2%; 24.0% ] SUV reduction in MAO-B inhibitor treatment group) [47]. Smith et al. also found no effect of MAO-B inhibitor rasagiline on seven PD patients compared to 22 without the medication [3]. In the present study, one patient had stopped MAO-B inhibitor treatment nine months prior to follow-up and two patients had stopped, but did not remember exactly when, with no seeming effect on SUV (not shown). Rasagiline and selegiline are irreversible MAO-B inhibitors and their blockade reverses with a half-time of 40 days [48, 49] as new MAO-B enzymes have to be synthesized. As a consequence, an awareness of the time interval between stopping MAO-B inhibitor treatment and PET could become vital. Brain homogenate binding assays by Vermeiren et al., demonstrated ∼75 % blocking of specific flortaucipir binding in the thalamus of healthy controls using selegiline. However, the Vermeiren study showed no blocking of flortaucipir by selegeline in the temporal lobe of patients with AD, an area known to contain increased amounts of MAO-B due to gliosis s [7, 49–51]. Discrepancies between in vivo and in vitro results have been described using other PET tracers [52]. If the age-dependent increase of flortaucipir signal in the basal ganglia is not caused by rising MAO-B, it must be caused by other factors. Choi et al. reported a significant association between the signal and age-related iron accumulation as estimated by R2* MRI [15]. This iron may be contained in pigment-like structures, known to increase with age [25]. The amount of MAO-B in PD, recently described by Tong and colleagues [36], is no different from healthy controls, except for a small increase in the frontal lobe – an area with no reports of increased flortaucipir signal in PD, to our knowledge [1–4]. Consequently, we do not believe MAO-B binding of flortaucipir poses a significant problem in our study.
Possible MAO-A binding
While flortaucipir’s affinity for MAO-B is rather low, it is higher for MAO-A [12]. Vermeiren et al. reported blocking 75% and 50% of specific activity in the temporal lobes of healthy controls and AD patients, respectively, using the MAO-A inhibitor clorgyline. To our knowledge, no similar in vivo blocking study has been performed. The consequences are several: (1) SUVR comparisons across groups assume similar MAO-A amounts in the reference and target regions. Tong and colleagues reported no difference in MAO-A in substantia nigra and frontal cortex in PD patients compared to healthy controls [36]. They did not report on group differences in the cerebellum [36], however, earlier they demonstrated a three times larger concentration of MAO-A in healthy control pars compacta of the nigra compared to cerebellar cortex [53]. Consequently, a relative change in “specific signal” does not translate into the same relative change in neuromelanin, but underestimates it. (2) Within subject variation over time may affect repeat measurements, but MAO-A concentrations are lower and relatively constant, compared to MAO-B [53]. (3) Though not relevant for the present study, it is critical for interpretation of interventional studies that effects demonstrated using flortaucipir must also be shown not to come from changes in MAO-A. While this may seem difficult, MAO-A is not a marker of gliosis, unlike MAO-B [14]. Thus, while the differences seen between healthy controls and AD patients with THK-5351 PET reflected MAO-B rises due to gliosis, it is unlikely that differences seen with flortaucipir PET reflect MAO-A or MAO-B.
Limitations
This study has several limitations: (1) The present study lacks a healthy control group with follow-up. Regrettably, follow-up scans in healthy controls were refused by our local ethics committee. (2) UPDRS-III was described in the ON-state, limiting the range of the scores. This was decided to avoid motor symptoms affecting cognitive scores performed the same day and limit the number of visits needed to take part in the study. (3) As with most PET studies, sample size is limited due to radiation dosimetry and cost considerations. The PD groups at baseline were of similar size as comparable studies, and dropouts cannot be avoided. Future studies with larger sample sizes and longer follow-up time are warranted. (4) We did not collect amyloid status of our patients. Other studies have successfully demonstrated the importance of amyloid on flortaucipir uptake in PD [1–4]. Adding amyloid imaging would have increased the total accumulated radioactive dose from the study to more than 20 mSV (from two times flortaucipir PET, one dopamine transporter imaging and an 11C Pittsburgh compound B PET). Our local ethical committee has previously refused similar studies we proposed with doses above 20 mSv, referring to insufficient potential benefit from the studies. We did not obtain cerebrospinal fluid due to the side effects from the procedure. (5) The specificity of flortaucipir is in question and interpretation may be confounded by MAO-A and possibly MAO-B binding though this would be more important if we had seen an increase in cortical uptake. MAO-A and MAO-B concentrations in the substantia nigra are probably no different in healthy controls and patients with PD [36]. Ideally, absence of significant MAO-A/B should be demonstrated scanning the same subjects twice, on and off MAO-inhibitor treatment. (6) With follow-up studies, there is a risk of bias in drop-outs. Physical and cognitive decline will increase risk of drop-out. This may be the reason why our PD-MCI cohort has lower UPDRS-III score at follow-up – those with highest scores at baseline reached levels where they were physically (and possibly cognitively) unable to take part.
Conclusion
We saw no significant changes in loss of melanin signal in the substantia nigra or tau load in cortex in PD patients using flortaucipir PET at two-year follow-up, and we saw no association with changes in cognitive symptoms. Signal reduction in the medial substantia nigra trended to associate with worsening of motor symptoms. Further studies to determine the specificity of flortaucipir binding are needed; in particular, in vivo blocking studies of flortaucipir PET using MAO-A and MAO-B inhibitors.
CONFLICTS OF INTEREST
The study was funded through a grant from the Lundbeck Foundation. DJB reports lecturing fees and non-financial support from GE Healthcare, Biogen, and Isotopia outside the submitted work. All other authors have nothing to disclose.