
Abstract
Background:
Patients with REM sleep behavior disorder (RBD) have a high risk of developing PD, and thus can be used to study prodromal biomarkers. RBD has been associated with changes in gait; quantifying these changes using wearable technology is promising; however, most data are obtained in clinical settings precluding pragmatic application.
Objective:
We aimed to investigate if wearable-based, real-world gait monitoring can detect early gait changes and discriminate individuals with RBD from controls, and explore relationships between real-world gait and clinical characteristics.
Methods:
63 individuals with RBD (66±10 years) and 34 controls recruited in the Oxford Parkinson’s Disease Centre Discovery Study were assessed. Data were collected using a wearable device positioned on the lower back for 7 days. Real-world gait was quantified in terms of its Macrostructure (volume, pattern and variability (S2)) and Microstructure (14 characteristics). The value of Macro and Micro gait in discriminating RBD from controls was explored using ANCOVA and ROC analysis, and correlation analysis was performed between gait and clinical characteristics.
Results:
Significant differences were found in discrete Micro characteristics in RBD with reduced gait velocity, variability and rhythm (p≤0.023). These characteristics significantly discriminated RBD (AUC≥0.620), with swing time as the single strongest discriminator (AUC=0.652). Longer walking bouts discriminated best between the groups for Macro and Micro outcomes (p≤0.036).
Conclusions:
Our results suggest that real-world gait monitoring may have utility as “risk” clinical marker in RBD participants. Real-world gait assessment is low-cost and could serve as a pragmatic screening tool to identify gait impairment in RBD.
INTRODUCTION
Parkinson’s disease (PD) is a progressive multisystem syndrome. There is no cure, and great efforts are under way to discover disease modifying therapies. It is estimated that by the time of diagnosis, striatal dopamine is depleted by approximately 70–80%, a figure that corresponds to cell death of 30–50% of dopaminergic neurons in the substantia nigra [1, 2]. Recent clinicopathological work has demonstrated that loss of dopaminergic markers in the putamen is complete by four years post-diagnosis, highlighting the importance of early targeted therapy if disease modification is to be prioritized [3].
Diagnosis is therefore preceded by a long prodromal period during which the disease process has started but definitive motor symptoms and signs to permit a diagnosis have not yet appeared [4]. This period has been estimated, by retrospective and prospective studies, to vary between three to more than 20 years [2, 6]. If we wish to address disease modification, early intervention during the prodromal period would be ideal to slow or halt ongoing degeneration of neurons. Identifying robust prodromal clinical and other biomarkers during this period is therefore an area of intense research interest.
Idiopathic rapid eye movement sleep behaviour disorder (RBD) is of particular interest as a prodromal marker. More than 80% of RBD patients convert to PD or another α-synucleinopathy with a median overall prodromal phase of 8 years [7], and a motor phase of 4.5 years [4, 9]. A very recent study estimated an overall conversion rate from RBD to an overt neurodegenerative syndrome of 6.3% per year, with 73.5% converting after 12-year follow-up [7], with an estimated prevalence of RBD in PD of 42.3% in PD [10]. Previous studies have also reported a male pre-dominance in typical RBD, with more than 80% of the patients being male [11, 12].
Postuma et al. demonstrated that, using simple motor assessments (Movement Disorders Unified Parkinson’s Disease Rating Scale (MDS-UPDRS) and Timed Up and Go test), abnormalities in gait can precede PD diagnosis by up to 4.4-6.3 years [4]. McDade et al. have shown that quantitative cross-sectional analysis of normal pace walking in RBD participants found subtle changes of velocity, cadence and variability of gait compared to controls [13]. A recent paper showed also differences in gait between RBD participants and controls during fast and dual task conditions in a laboratory environment[14].
Gait may therefore be a useful clinical biomarker to identify risk of conversion in RBD. Both studies, however, were performed under controlled conditions, with one study requiring specialized equipment (i.e. instrumented walkway) limiting its application. To address this shortcoming, wearable technology that measures discrete movements has been employed with promising findings.
Recently, selective gait characteristics measured with wearable technology have been shown to be potential prodromal markers for people at risk of PD [15] and also in LRRK2 mutation carriers [16]. People at risk of PD and carriers demonstrated increased gait variability and asymmetry [15], a less consistent and rhythmic gait pattern (lower amplitude of the dominant peak of the accelerometer signal) [16], although these studies again were conducted in laboratory-based settings during controlled conditions. Intriguingly, work in RBD using smartphone technology in free-living conditions and prompted, structured tasks found that postural tremor, rest tremor, and voice were the discriminatory domains between RBD and controls but not gait. However, signal features (e.g., frequency-based features, detrended fluctuation analysis, etc.) rather than more clinically relevant, specific gait characteristics were quantified [17].
For wider scale screening, a more pragmatic, low cost method without the need for specialized staff or equipment is needed. Continuous monitoring in the real-world using wearable technology offers a solution with the added advantage that it avoids potential confounding due to compensation under controlled testing conditions and variation due to one-off sporadic assessments. It also provides a more ecological representation of gait and walking activity in a natural environment often implying ‘real-world dual-task’ conditions. This technology may thus serve as a tool to accurately identify surrogate markers of incipient disease manifestation [16–19].
The aims of this study were therefore: (i) to investigate if it was possible to detect subtle prodromal gait disturbances using continuous real-world monitoring with a wearable device and if this could discriminate RBD from a control group; and (ii) to explore the relationship between discriminatory gait characteristics with clinical scales associated with RBD. We adopted a comprehensive approach to quantify gait using a combination of Macrostructural (Macro) and Microstructural (Micro) gait characteristics. Based upon the only other quantitative study of gait in RBD [13, 20] we hypothesized that people with RBD would have reduced volume of walking activity, and would demonstrate impairment in gait characteristics such as slower velocity, increased Micro gait variability and lower cadence compared to controls.
METHODS
Participants
RBD participants and controls (CL) were enrolled in the Oxford Parkinson’s Disease Centre (OPDC) Discovery study [21, 22]. The diagnosis of RBD was made on the basis of polysomnographic evidence according to the American Academy of Sleep Medicine International Classification of Sleep Disorders criteria [23]. Full details of the clinical protocol and inclusion and exclusion criteria are described in detail elsewhere [21, 24].
Ethics, consent and permissions
This study was conducted according to the declaration of Helsinki and had ethical approval from the local research committee (NRES Committee, South Central Oxford A Research Ethics Committee, Reference number 16/SC/0108). All participants gave written informed consent prior to testing.
Demographic and clinical measures
Age, gender and BMI were recorded for each participant. A comprehensive, structured medical history was taken from all participants including comorbidities and demographic information. Cognition was assessed using the Mini-Mental State Examination (MMSE [25]). EQ-5D was used as a standardized self-report measure of health status [26] and excessive daytime somnolence was measured by the Epworth Sleepiness Scale [27]. Motor features were assessed using: MDS-UPDRS part III (MDS-UPDRS-III) [28]; the Purdue Pegboard test [29]; the Flamingo test (the ability of the patient to balance on one leg for 30 s) and the Timed Up and Go Test [24, 30]. The probability of prodromal PD was calculated for each participant at their baseline assessment using the method described by Berg et al. [31] as detailed in [21]. The following risk markers were used: sex, pesticide exposure, solvent exposure, caffeine use, smoking history, family history of PD, and presence of gene mutation (GBA or LRRK2). The following prodromal markers were also included: presence of RBD confirmed by polysomnography, subthreshold parkinsonism (using UPDRS and Purdue Pegboard scores), olfactory loss, constipation, excessive daytime somnolence (measured by the Epworth Sleepiness Scale), postural hypotension, urinary dysfunction, and depression/anxiety [21]. Falls Rate was collected as the number of falls self-reported in the six months prior to the assessment.
Free-living data collection: protocol
Participants were asked to wear a tri-axial accelerometer (Axivity AX3, York, UK; dimensions: 23.0×32.5×7.6 mm; weight: 11 grams) for one week [32]. The device has been validated for its suitability in capturing high-resolution data akin to human movement [33]. It was located on the fifth lumbar vertebra with a hydrogel adhesive (PAL Technologies, Glasgow, UK) and covered with additional tape (Hypafix bandage) for extra support. The water-proof device was programmed to capture data for seven days at 100 Hz (range±8 g). Participants were asked to continue their daily activities as usual and not to change their routine. Upon completion of the recording, participants removed the device and posted it back to the researcher as detailed in previous work [34].
Data processing and analysis
Data processing and variable extraction
Once the wearable device was collected by the researcher, data were uploaded to a secure on-line platform for automatic data analysis. The pipeline has been developed using e-Science Central, a password-protected cloud based platform that allows the storage, analysis and sharing of data in the cloud. Analysis of data was carried out via the e-Science platform using an executable of validated MATLAB® scripts [35, 36] thereby generating a closed standalone analysis package. Data were segmented (per calendar day) and analyzed. For each day, a logical heuristics paradigm was embedded into walking bout identification and quantification algorithm which has shown to be accurate in detecting ambulatory bouts (ABs) and step count in free-living conditions [36]. Individual ABs were extracted via MATLAB®, where a ‘bout’ was defined as the continuous length of time spent walking with at least four consecutive steps [34, 36]. ABs were detected by applying selective thresholds on the magnitude and standard deviation (SD) of the triaxial acceleration data as described in detail elsewhere [36].
Outcome measures were described according to a broad framework of Macro and Micro characteristics [37] (Fig. 1).
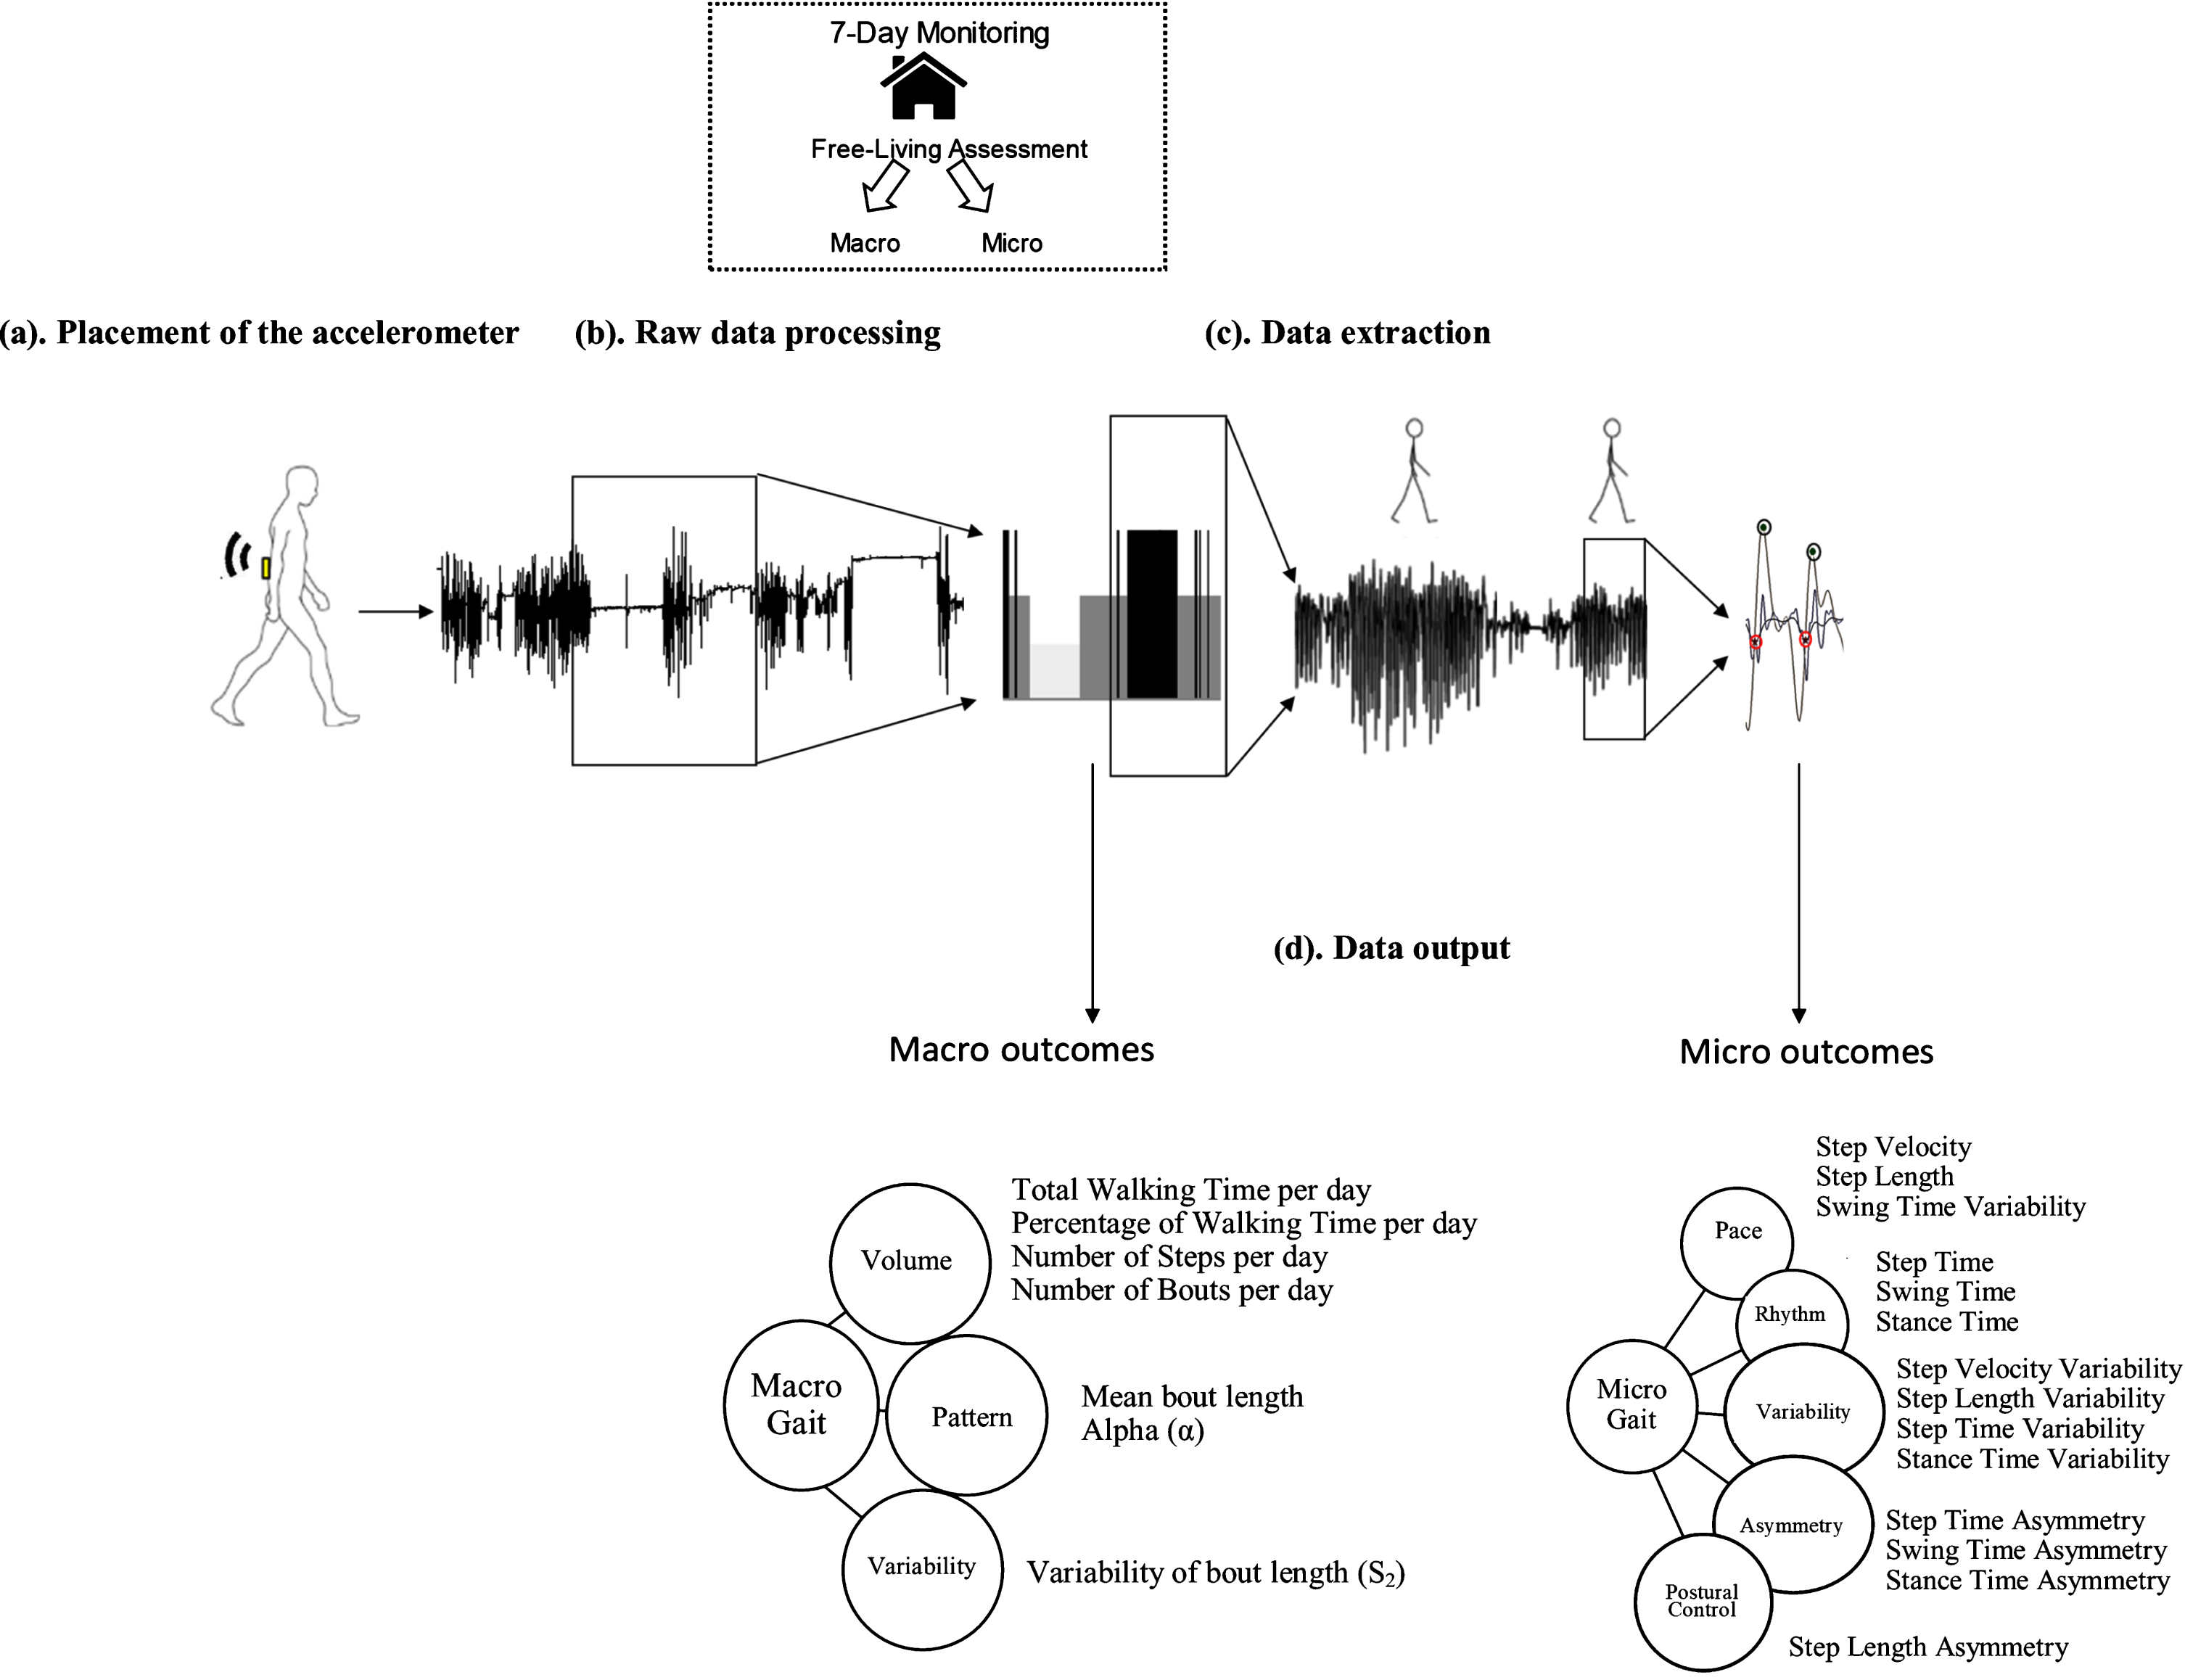
Real-world assessment – Macro and Micro gait characteristics: (a) Example of body worn monitor placement for the real-world (7-day) data collection. (b) Raw vertical acceleration processing (signal segments in black) from real-world data. (c) Example of walking bout extraction and Micro gait characteristic evaluation from walking bouts. (d) Data output: conceptual model of Macro gait representing three domains and seven Macro gait characteristics, and Micro gait representing five domains and 14 Micro gait characteristics.
Macro (behavioral) characteristics included the volume, pattern and variability (S2) of walking. Volumetric outcomes included total walking time per day, percentage (%) of walking time per day, number of bouts and steps per day. Pattern included mean bout length, generated based on the AB detected over the 7 days, and a non-linear descriptor (alpha (α)). Alpha describes ABs distribution, evaluating the ratio of short to long ABs (i.e., a high alpha means that the total walking time is made up of proportionally short ABs compared to long ABs). Macro gait variability (S2) was derived evaluating the ‘within subject’ variability of AB length, with a higher Macro gait variability (S2) indicating a more varied walking activity pattern, while a lower Macro gait variability (S2) would mean a less varied walking activity, so a reduced engagement in different activity and a tendency to repeat the same pattern of activity [34, 39].
Micro gait characteristics (n=14) were determined for each AB. Micro characteristics were selected based upon a model of gait comprising five domains (pace, variability, rhythm, asymmetry and postural control) validated both in older adults and in PD [33, 40]. Briefly, the initial contact and final contact events within the gait cycle were identified and allowed the estimation of step, stance and swing time. Initial contact events were also used to estimate step length using the inverted pendulum model [41]. Step velocity was calculated as the ratio between step length and time [33].To evaluate micro gait variability (e.g., step time variability), the standard deviation (SD) from all steps (left and right combined) was calculated. Asymmetry was determined as the absolute difference between left and right steps for each AB, averaged across all ABs [33, 42].
Data considerations
All ABs with more than three steps (minimum bout length) were taken into account for the analysis [43–46]. A threshold of 2.5 s was set for the maximum resting period between consecutive ABs [36]. Each AB was considered individually to ensure robustness for the evaluation of the gait characteristics, to avoid sources of error in step detection, and facilitate the calculation of variability and asymmetry characteristics [19]. Micro outcomes were evaluated for each single AB and then averaged over the seven days; pooled seven-day data were used for quantifying Macro outcomes. As exploratory analysis Macro and Micro outcomes were evaluated including all ABs greater than three steps, and also including only short-to-medium (10 s≤ABs < 30 s, corresponding to a range of 15-50 steps), medium to long (30 s≤ABs < 60 s, corresponding to a range of 50-100 steps) and long ambulatory bouts (ABs≥60 s, corresponding to≥100 steps) [19, 47].
Statistical analysis
Statistical analysis was carried out using SPSS v24 (IBM). Normality of data was tested with a Shapiro-Wilk test. Descriptive statistics were reported as means and SDs. To distinguish between RBD and control cohorts we used a two-stage approach. We identified between-group Macro and Micro gait differences in RBD vs. control participants with analysis of covariance (ANCOVA); age, sex, MMSE, MDS-UPDRS II and III and BMI were included as covariates. Further analysis of Micro and Macro outcomes was then repeated on walking bouts grouped by bout length (short-to-medium (10 s≤ABs < 30 s), medium to long (30 s≤ABs < 60 s) and long ambulatory bouts (ABs≥60 s)), to explore the impact of AB length on results. Secondary analysis explored the value of Micro and Macro gait characteristics for discriminating people with RBD from controls. Receiver Operating Characteristics (ROC) and stepwise, forward, logistic regression analyses controlling for age, sex and BMI were performed. All Micro gait characteristics were considered candidates and parameters were entered in the regression model. Discriminative models and Micro gait characteristics with the highest Area Under the Curve (AUC) for the ROC analysis are reported. Sensitivity for cut-off specificity at 90%, specificity for cut-off sensitivity at 90%, and best accuracy values of the variables and for the results of the regression models were also evaluated. Regression analysis was then repeated adding Sniffin’ Sticks total score to the Macro and Micro gait variables models, as olfactory loss has previously been shown to have a diagnostic specificity of > 80% [48]. Given the exploratory nature of this analysis, we used a threshold of p < 0.05 to guide statistical interpretation and did not make adjustments for multiple comparisons [13, 50]. However, we provide p-values and reported also p≤0.01 so that the reader may assess the statistical strength of our findings. Finally, we explored the relationship between discriminatory characteristics and clinical and risk factors of conversion to PD in RBD participants to explain and interpret findings. We used Partial correlations controlling for age to identify relationships between Micro and Macro gait characteristics and clinical scales.
RESULTS
Sixty-three people with RBD and thirty-four controls were assessed. Clinical, demographic and cognitive descriptors are shown in Table 1. People with RBD and CL groups were comparable for age, BMI and gender (although RBD included proportionally, but not significantly, more women). In keeping with previous reports [21], RBD participants had lower cognitive, EQ-5D scores and Sniffin’ Sticks test total scores, and greater motor impairment as seen by MDS-UPDRS III scores. According to the MDS criteria 48 RBD participants met the MDS criteria for probable prodromal PD (Probability > 80%).
Clinical and demographic characteristics for controls (CL) and participants with rapid eye movement sleep behavior disorder (RBD)
BMI, Body Mass Index; MMSE, Mini– Mental State Examination; EQ-5D VAS score: EuroQol-5 Dimension VAS score; MDS-UPDRS III: Movement Disorders Unified Parkinson’s Disease Rating Scale part III; Falls Rate: number of falls reported in the six months before the assessment. In bold significant p-values (p < 0.05).
We also repeated the analysis looking at RBD at high risk (with MDS Probability of Prodromal PD > 80%) and at low risk (MDS Probability of Prodromal PD < 80%) and we did not found any significant differences in Macro or Micro gait characteristics between the two groups (p≥0.137); these groups were therefore not reported separately.
Those with RBD also had a higher number of falls reported in the six months prior to the assessment (Table 1).
Differences in Macro gait characteristics between RBD and CL
Between-group differences were influenced by bout length. When considering the total number of ABs, no significant difference was found in Macro gait characteristics between people with RBD and CL. Volume of walking bouts did not differ between people with RBD and CL. There was a trend for people with RBD to walk in less variable (lower S2) ABs compared to CL, although this did not reach significance (Table 2, Fig. 2a).
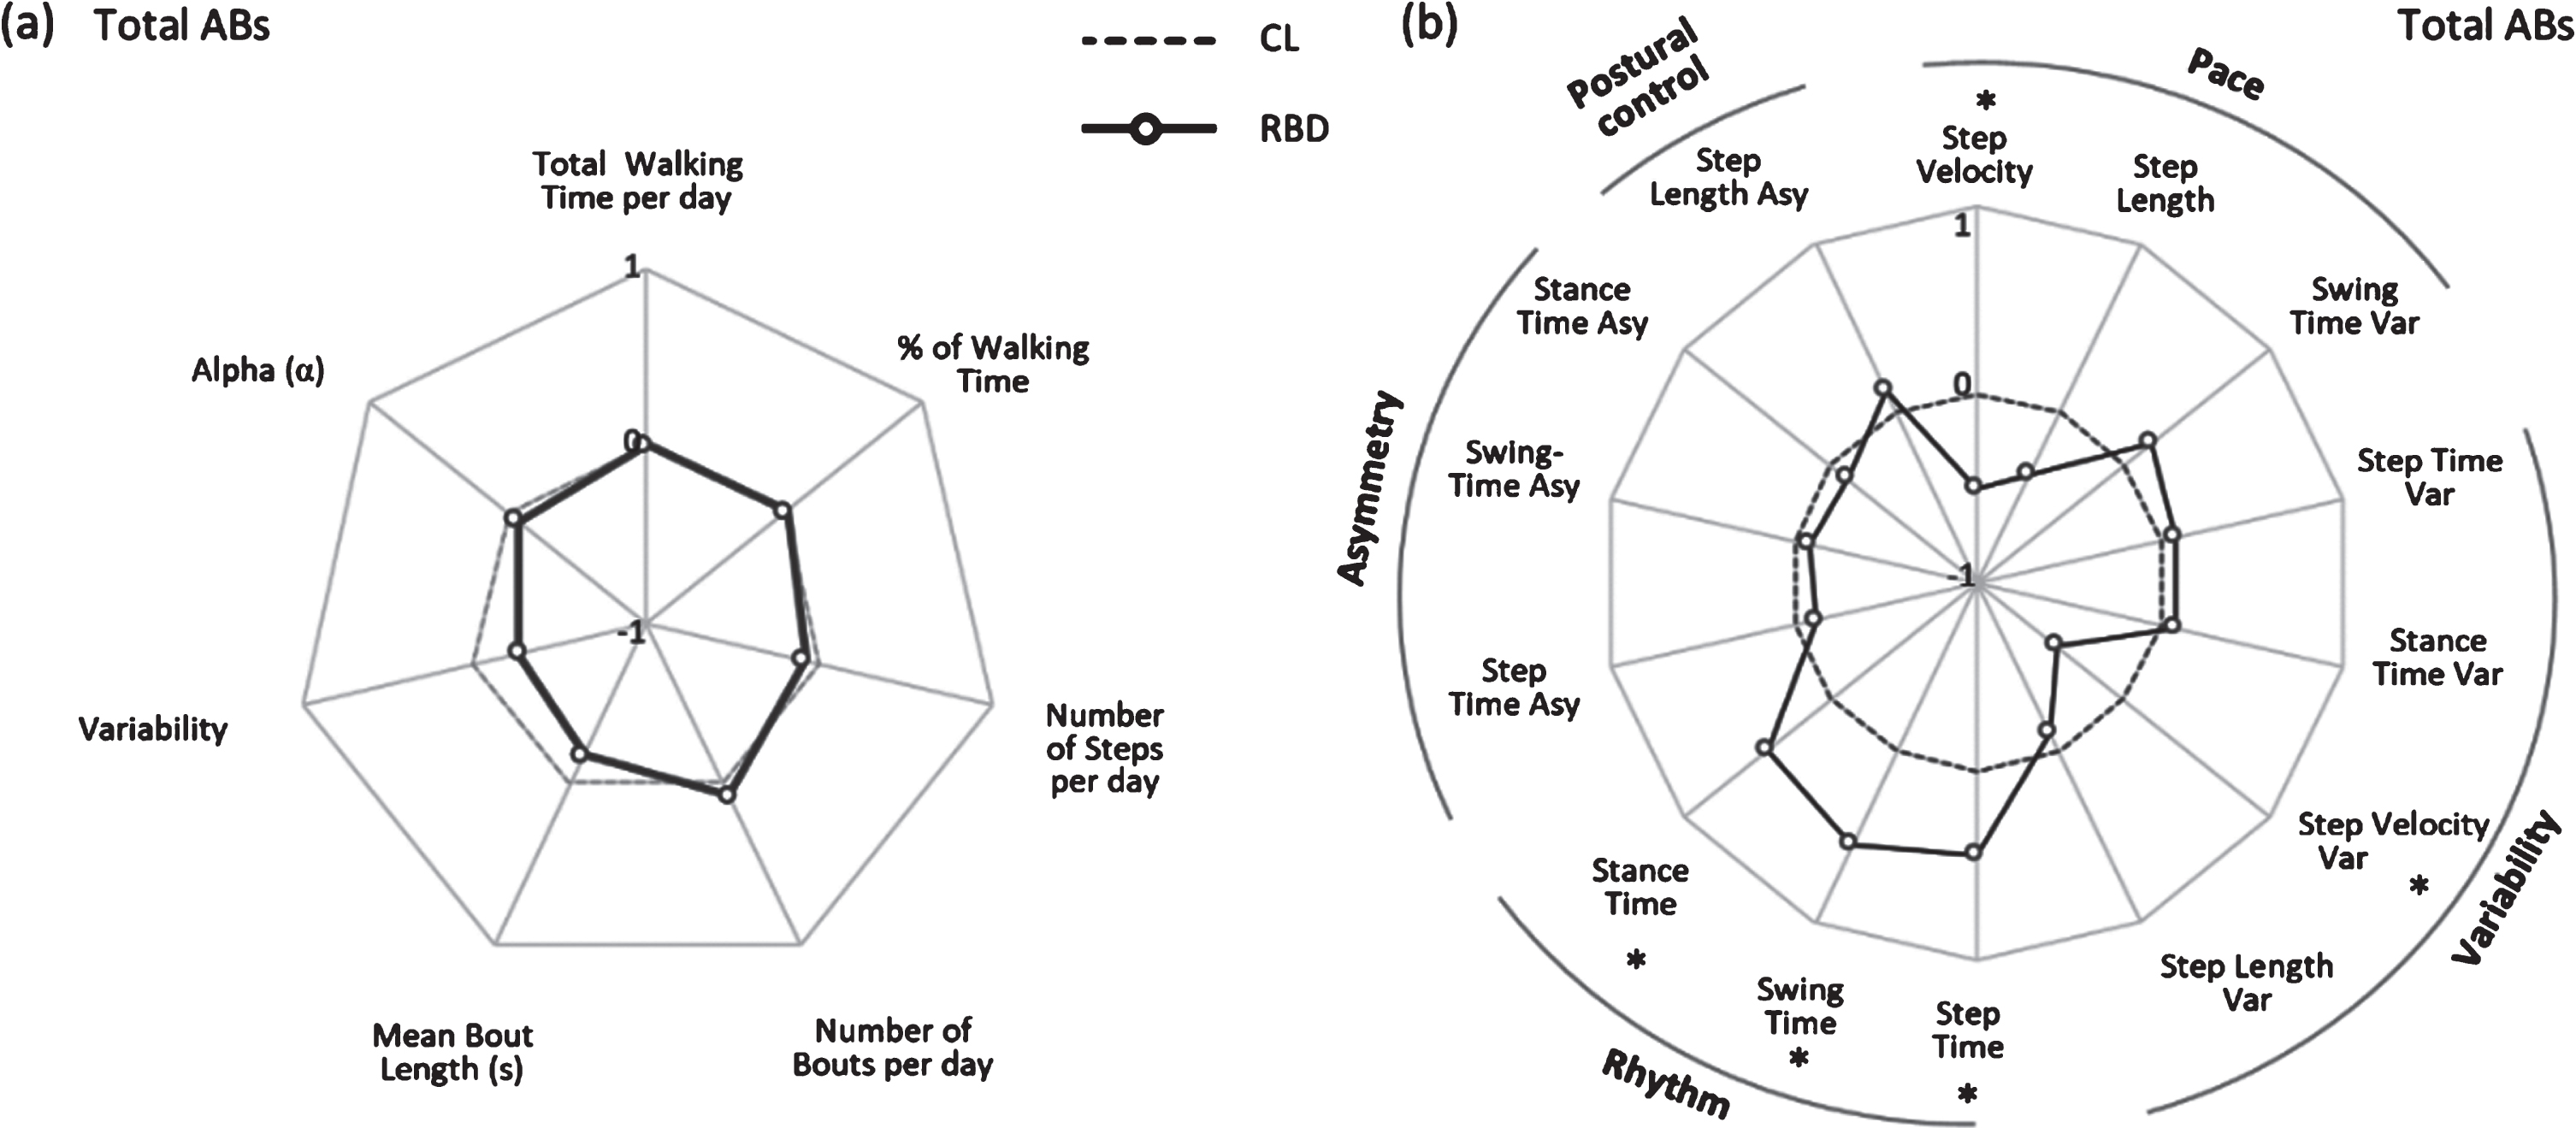
Radar plot illustrating the real-world Macro (panel a) and Micro (panel b) gait characteristics for controls (CL) and people with rapid eye movement sleep behavior disorder (RBD) evaluated in real-world conditions for total ambulatory bouts. The central dotted line represents CL data, deviation from zero along the axis radiating from the center of the plot represents how many standard deviations (range:±1 SD, z score based on CL means and standard deviations) the RBD differ from CL. * represents significant differences between RBD and CL (p values < 0.05). Var, variability; Asy, asymmetry.
Real-world Macro gait characteristics (volume, pattern and variability) for controls (CL) and people with rapid eye movement sleep behavior disorder (RBD). Data are presented for total ambulatory bouts (ABs > three steps). Values are presented as mean ± standard deviation (SD). Results of the ANCOVA analysis between people with RBD and CL are reported, in bold are shown p-values <0.05
When considering short-to-medium and medium-to-long bouts, again no differences were found between groups (Supplementary Table 1, Fig. 3a, b).
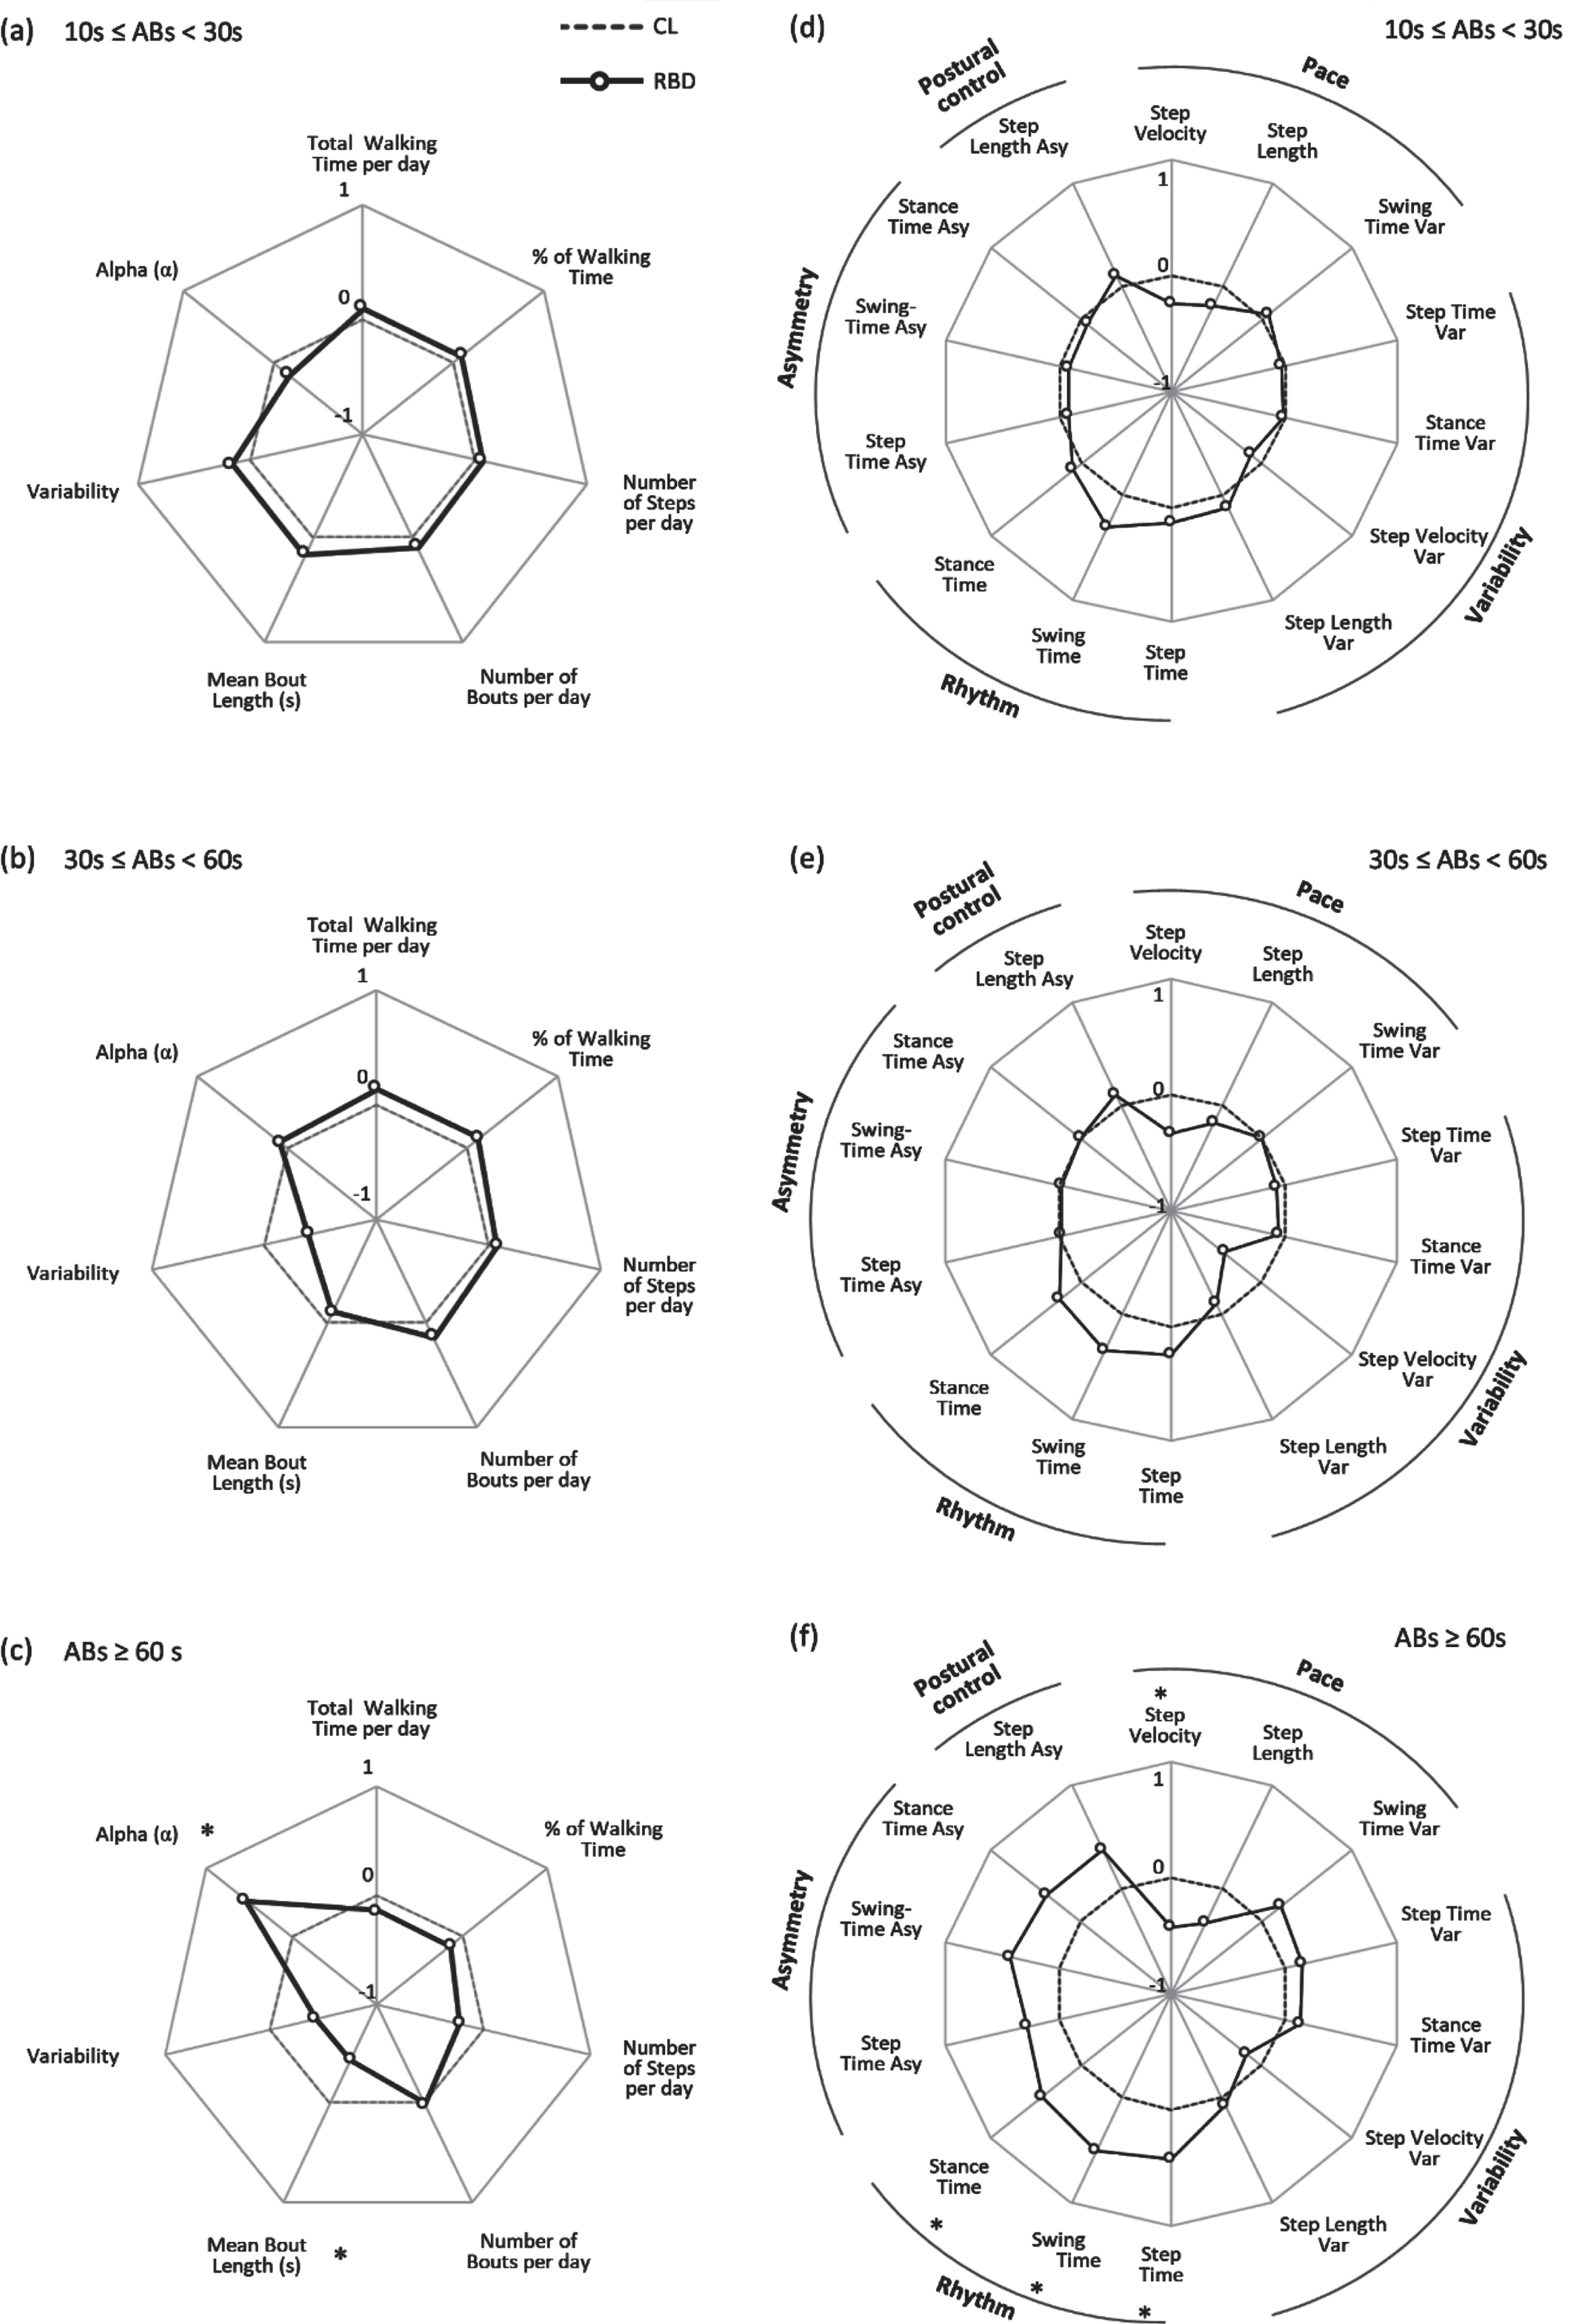
Radar plot illustrating the real-world Macro and Macro gait characteristics for controls (CL) and people with rapid eye movement sleep behavior disorder (RBD) evaluated in real-world conditions for short-to-medium (10 s≤ABs < 30 s, Macro – panel a, Micro – panel d), medium-to-long (30 s≤ABs < 60 s, Macro - panel b, Micro - panel e) and long ambulatory bouts (ABs≥60 s, Macro – panel c, Micro – panel f). The central dotted line represents CL data, deviation from zero along the axis radiating from the center of the plot represents how many standard deviations (range:±1 SD, z score based on CL means and standard deviations) the RBD differ from CL. * represents significant differences between RBD and CL (p values < 0.05). Var, variability; Asy, asymmetry.
However, when exploring differences based on long bouts (≥60 s), although they represented less than 5% of the total amount of ABs, we found that ambulatory pattern significantly differed between the groups (Supplementary Table 1). Mean bout length was significantly lower and alpha significantly higher (denoting that walking time was made up proportionally of shorter ABs) for people with RBD compared to CL (p < 0.040) (Fig. 3c).
Differences in Micro gait characteristics between RBD and CL
For total ABs, characteristics relating to pace (step velocity), variability (step velocity variability) and rhythm (step, stance and swing time) were significantly different between people with RBD and CL. People with RBD walked slower with less variable velocity. In addition, RBD had significantly slower cadence: higher step time, swing time and stance time compared to CL (Table 3, Fig. 2b). Interestingly, postural control, as measured by step length asymmetry, did not discriminate between groups.
Real-world Micro gait characteristics for controls (CL) and people with rapid eye movement sleep behavior disorder (RBD). Data are presented for total ambulatory bouts (ABs >three steps). Values are presented as mean ± standard deviation (SD). Results of the ANCOVA analysis between people with RBD and CL are reported, in bold are shown p-values <0.05
Var, variability; Asy, asymmetry. * p≤0.01.
For short-to-medium (10 s≤ABs < 30 s) and medium-to-long ABs (30 s≤ABs < 60 s) we did not find any significant differences between the groups (Supplementary Table 2, Fig. 3d, e). The picture remained similar to the one for total ABs. When considering long ABs (≥60 s), again pace and rhythm resulted significantly lower for people with RBD compared to CL, although step velocity variability was no longer significant between the groups (p=0.304) (Supplementary Table 2, Fig. 3f).
Discriminating prodromal gait disturbances within RBD with Macro and Micro gait characteristics
When looking at total ABs, none of the Macro characteristics discriminated RBD from CL.
For total ABs, step velocity and step velocity variability were the Micro gait characteristics that contributed to best discriminate individuals with RBD from CL with sensitivity of 88.9%, specificity of 31.4%, accuracy of 68.4% and AUC=0.698 (Table 4).
Receiver Operating Characteristics analysis with Area Under the Curve (AUC) and binary logistic regression significant results with values of sensitivity, specificity and accuracy for the Macro and Micro gait characteristics. Data are presented for total ambulatory bouts (ABs >three steps) and ABs ≥ 60s
Var, variability. In bold significant p-values for binary logistic regression analysis (p < 0.05).
When olfactory loss (Sniffin’ Sticks test total scores) was added to the regression models for total ABs, AUC increased to 0.842, with sensitivity of 78.9%, specificity of 64.5% and accuracy of 73.9% (Fig. 4).
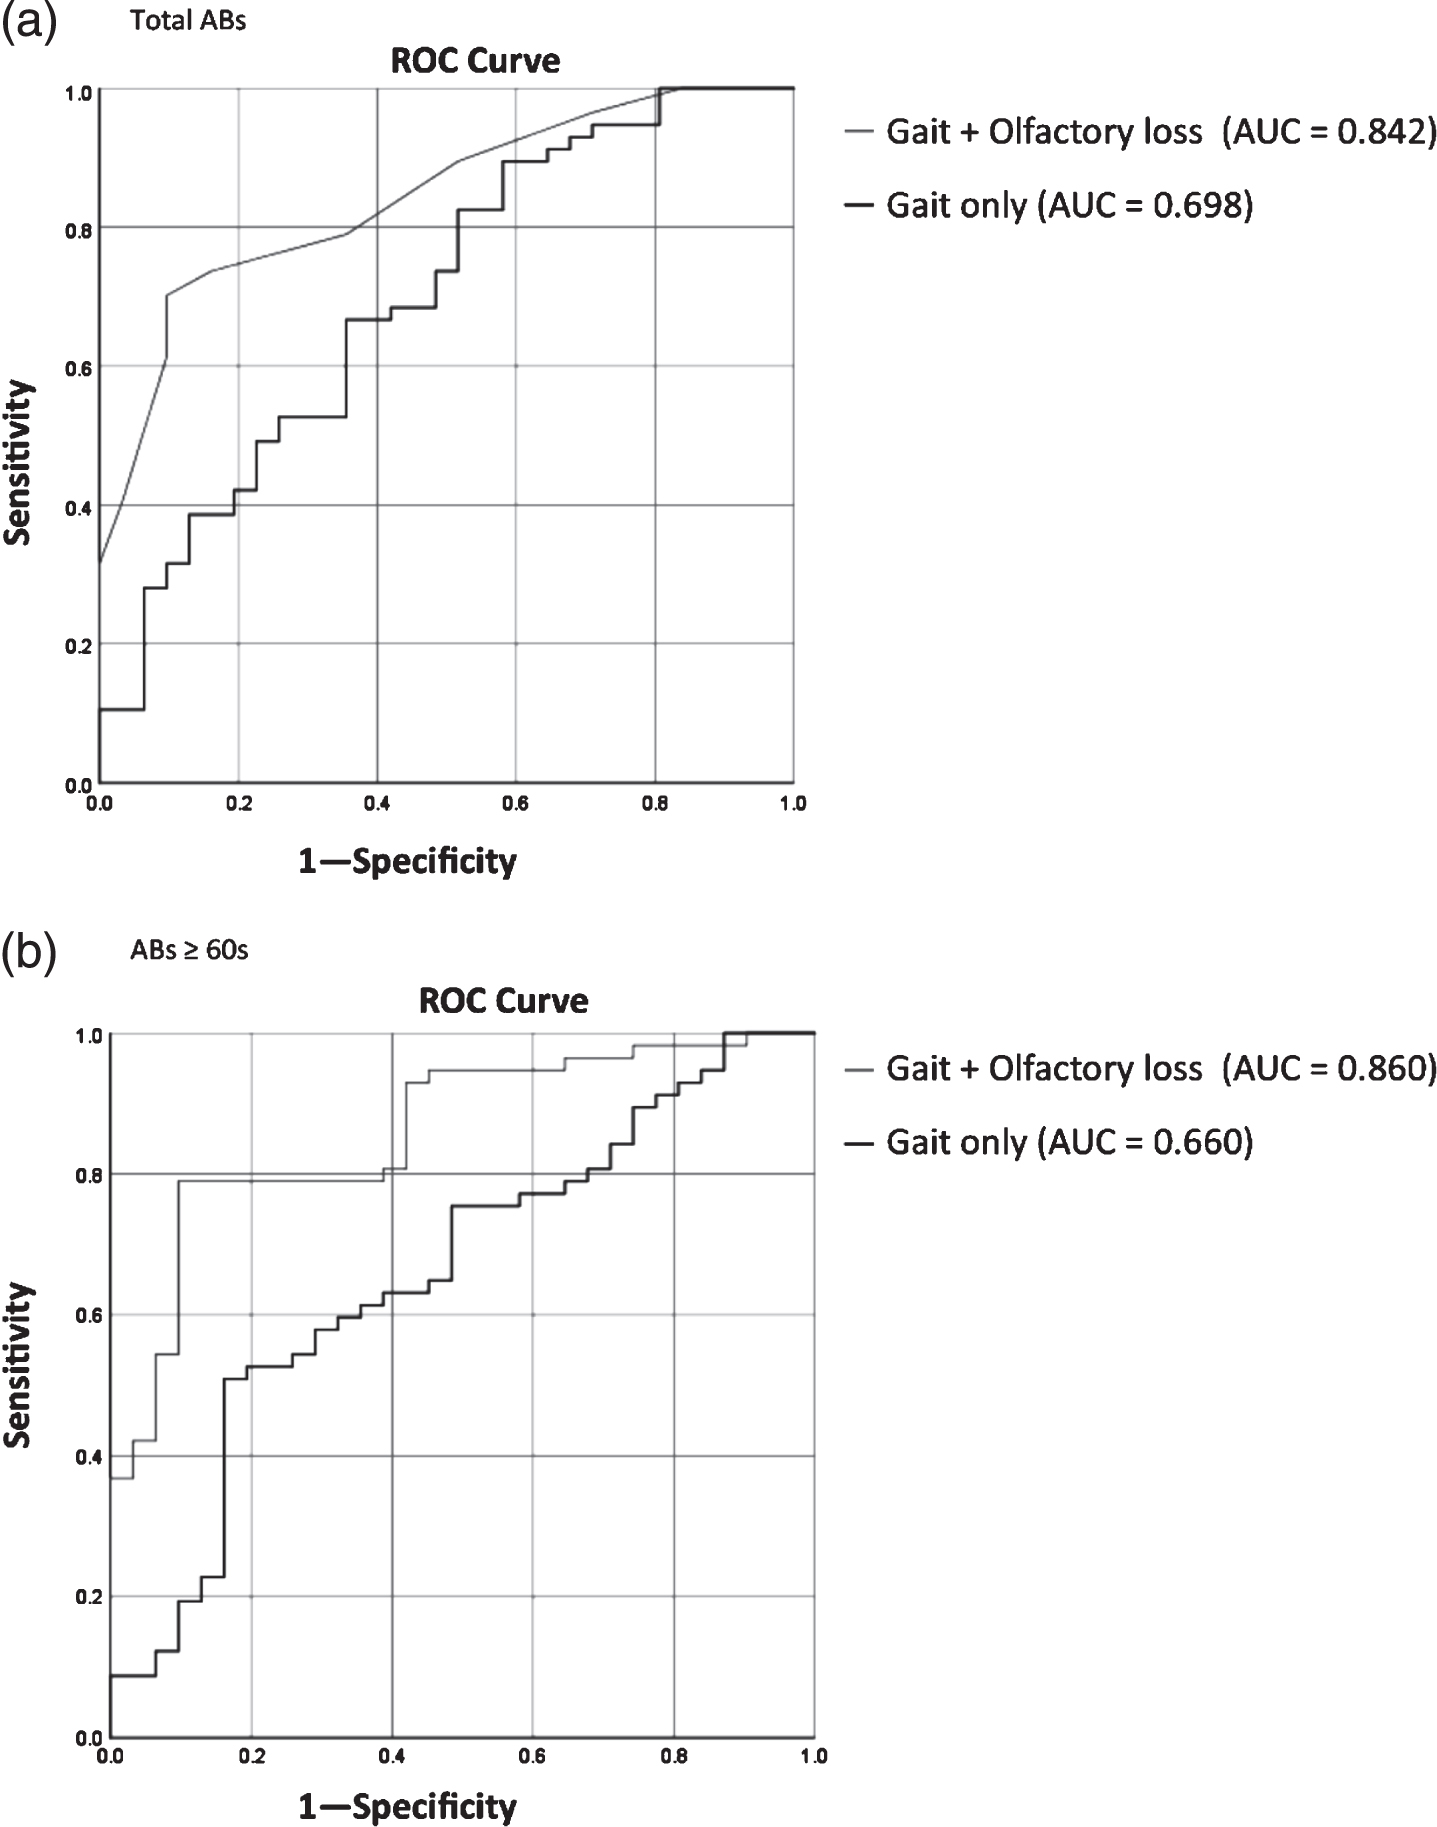
Receiver Operating Characteristics (ROC) results for regression models using gait only and olfactory loss information (Sniffin’ Sticks test total score) in addition to gait characteristics for total ambulatory bouts (Total ABs, panel a) and long ambulatory bouts (ABs≥60 s, panel b).
For long ABs (≥60 s), mean bout length, variability (S2) and alpha were the Macro gait characteristics which distinguished between the two groups. In addition, swing time was the characteristic which distinguished between individuals with RBD and CL with highest sensitivity of 93.70% (AUC=0.652 as single variable and AUC=0.660 for the regression model, Table 4).
When Sniffin’ Sticks test total scores was added to the regression models for long ABs, AUC increased to 0.860 (highest value), with sensitivity of 78.9%, specificity of 67.7% and accuracy of 75.0% (Fig. 4).
Relationship of Macro and Micro gait characteristics with clinical characteristics
Partial correlation analysis between Macro gait characteristics and clinical scales showed a negative low-to-moderate correlation between volume, pattern and variability of walking and MDS-UPDRS III, denoting that people with more severe motor scores tended to walk less, in shorter bouts and with lower variability. We found that cognitive (MMSE) and health status tests (EQ-5D Score) significantly positively correlated with volume characteristics, showing that people with poorer cognition and worse health status walked less. In terms of motor tests, the Flamingo test showed a significant positive correlation with volume and pattern of walking and the Timed Up and Go Test showed negative correlations with volume, pattern and variability, showing that participants with lower motor function walked less, in shorter and less variable bouts. Falls rate negatively correlated with volume and pattern of walking, suggesting that people with higher falls rate walked less and in shorter bouts (Table 5).
Partial correlations between Macro and Micro gait characteristics and clinical scales in RBD participants. Data displayed as (r (p value)). Data in bold refer to significant correlations (p <0.05)
MMSE, Mini– Mental State Examination; EQ-5D VAS score, EuroQol-5 Dimension VAS score; MDS-UPDRS III, Movement Disorders Unified Parkinson’s Disease Rating Scale part III; Var, variability; Asy, asymmetry. * p≤0.01.
Partial correlation analysis in RBD participants between Micro gait characteristics and clinical scales showed that MDS-UPDRS III scores significantly negatively correlated with pace (step velocity and step length) and positively with rhythm (step, swing and stance time), signifying that participants with higher score tended to walk slower and with shorter steps (Table 5). Cognitive tests (MMSE) showed a significant low to moderate positive correlation with pace and variability (step velocity variability), denoting that participants with poorer global cognitive scores walked slower and with lower variability. This finding is line with previous work demonstrating that global cognitive scores are associated with Micro gait pace (older adults) and variability characteristics (in PD) [51]. Our correlation findings, although exploratory, would corroborate the relationship between global cognition and gait (pace and step velocity variability characteristics) during the prodromal stage of PD, although requires validation in larger groups.
Motor tests showed a significant positive correlation with pace and variability for the Flamingo test, and a negative correlation with pace and variability and a positive correlation with rhythm for the Timed Up and Go Test; showing how participants with lower motor functions walked slower and with lower variability (Table 5).
The Epworth Sleepiness Scale Total Score and MDS Probability Score did not show any significant correlation with either Macro or Micro gait characteristics (Table 5).
DISCUSSION
We provide here evidence that continuous, real-world gait assessment with wearable devices may be a good paradigm to identify prodromal Parkinsonian gait disturbances and risk of PD conversion in people with RBD. Being aware that RBD may only reflect a subtype of (future) PD, our findings show discrete differences in gait informing a nuanced understanding of gait impairment during the prodromal PD stage. Macro gait characteristics demonstrated that pattern and walking bout length characteristics were associated with group only for long ABs. In contrast, we found that discrete Micro gait characteristics were able to discriminate between people with RBD and CL, highlighting differences in pace, variability and rhythm, with swing time being the best discriminating characteristic for people with RBD.
These findings highlight specific differences in Macro and Micro gait characteristics that may inform a pragmatic method for screening for risk of conversion to PD in RBD cohorts. Our study complements the existing evidence that there are subtle changes in gait prior to the onset of significant motor symptoms in an at-risk group [9].
A novel aspect of this study is the real-world wearable device-based assessment of walking behaviour and gait impairments associated with RBD prior to the onset of clinically significant motor deficits and diagnosis of PD or dementia. This is the first study where data were collected with continuous passive monitoring in entirely uncontrolled environments, during every-day life, in a totally unconstrained way. Compliance was high and homogenous in both groups: 83.5% of the participants wore the accelerometer for the whole 7 day period, while the remaining 16.5% of the participants wore it for either 6 or 6.5 days. Reasons for the temporary removal of the accelerometer were travel and, for one participant, undergoing a CT scan. This presented a unique opportunity to observe whether Macro and Micro gait could detect prodromal gait disturbances in RBD, that may be able to flag people at risk of PD conversion. Moreover the significant association of clinical characteristics with gait lends validity to the findings.
Walking activity (Macro gait) differs between RBD and CL only during long bouts
Our findings only partly support our hypothesis that people with RBD are less active than CL. When looking at all walking bouts, we found that people with RBD were as active as and similar to CL when considering the total amount, pattern and variability of walking activity. We found that only for long ABs (≥60 s) people with RBD walked with a higher proportion of short walking bouts (significantly higher alpha) and in shorter walking bouts compared to CL; also ROC analysis showed that only pattern (alpha) evaluated during long walking bouts played a role in discriminating RBD from CL, but did not give significant results during the regression analysis. This may reflect restricted engagement in sustained walking bouts for RBD. Comparison across studies however is difficult due to limited number of studies on RBD walking activity.
Interestingly, this walking activity/ behavior “picture” seems very similar to the typical PD pattern of activity [38], characterized by an inability to sustain high levels of walking and a walking pattern defined by shorter walking bouts compared to healthy controls. Our findings on Macro gait characteristics not only extend and partly corroborate previous work, but would underline already the risk and the tendency of people with RBD, in this prodromal “at high risk” phase, to align with and show a “PD-like” behavior, identifying an early risk in people with RBD.
The data, however, suggest that the relationship of people at risk of developing PD and activity is more complex and influenced by duration of walking bouts, particularly longer duration bouts. Differences observed in patterns of walking through a reduction in longer walking bouts may be due to compensatory change to reduce risk (e.g., falls risk), possibly by reducing duration of walking bouts either by limiting access to the community or exercise, or may be due to fatigue related to RBD. Our correlations results could corroborate this “risk reduction” hypothesis as we showed that people with higher falls rate tended to walk less and in shorter bouts, although this should be interpreted with caution as falls rate in this study was a self-reported measure related to the numbers of falls recalled in the six months prior to the assessment.
An open question is whether people with RBD would walk less and in shorter bouts due to fatigue as a result of sleep disturbance or rather because they are developing parkinsonism and therefore “PD-like” behavior. Our results support the latter, as we have shown that a clinical marker of PD (MDS-UPDRS III) was significantly correlated with lower volume of walking and shorter bouts length, while the Epworth Sleepiness Scale did not show any correlation with either Macro or Micro gait characteristics. Reduction in walking bout length in people with RBD may also be due to changes in patterns of walking behaviors indicating reduced confidence and a less varied walking “routine”. Compensatory strategies or higher attentional load (e.g., dual task) required for walking during real-world conditions may also play a role in modifying Macro level outcomes. Indeed, our correlation results showed that poorer cognition was significantly associated with poorer performance (lower volume of walking), although this is still unclear and further work is required to understand this relationship more fully.
Macro characteristics such as the overall amount of walking is important as inactivity increases the risk of other age associated health care conditions— which increase the overall burden of disease— which acts almost as a double hit. This becomes very relevant especially because RBD participants have been shown to have increased burden of cardiovascular risk factors compared to both controls and PD patients [21] and in fact our results showed that health status (EQ-5D VAS Score) was positively correlated with volume of walking, so participants with “better” health status walked more. By maintaining/increasing habitual levels of activity, more generic benefits, protective to a population at high risk of PD may be conferred.
Micro gait differs between RBD and CL
Our results confirmed the hypothesis that people with RBD would show impaired gait compared to controls characterized by slower gait velocity, lower variability and lower cadence. Previous work in laboratory settings showed an association between RBD and gait variability as well as measures of rhythm [13]. In partial support of previous studies showing that slower step velocity (pace) and cadence (slower rhythm) appear to be prodromal marker for PD, we found rhythm, step velocity and its variability to be lower in RBD participants [13]. This could be explained by the fact that people with RBD appear to be walking slower and with shorter steps, so with a more cautious walking pattern and therefore reduced step velocity variability. Conversely, people with PD show higher gait variability, so our results could suggest that there may be a change in the variability construct going from the prodromal stage to manifest disease: from lower gait variability in the prodromal phase to higher gait variability later when PD manifests. Higher variability in Micro gait characteristics may be advantageous or deleterious representing either compensatory adaptions to minimize risk, or impaired control and inability to minimize risk, respectively. Conversely lower variability in Macro gait characteristics (‘behavior’) may be deleterious - representing inability to engage and adapt in a wider variety of walking activities and presenting a cautious gait pattern [47]. Results from our correlations analysis corroborate this hypothesis; we showed that participants with poorer global cognition (lower MMSE scores) walked with higher step velocity variability and slower pace (lower step velocity and step length), and that participants with higher motor disease severity and lower motor functions (MDS-UPDRS III, Flamingo Test and Timed Up and Go Test) walked slower, with shorter steps and with lower variability (swing time variability, step length variability and step velocity variability).
In contrast to a previous study conducted in a high-risk cohort, we did not find increased gait asymmetry [18]. This could be due to the different protocol (study was conducted in a lab-based environment and not real-world conditions) and the different cohort (non-manifesting LRRK2-G2019 S mutation carrier vs. RBD). We speculate that when following up people with RBD and testing them longitudinally the tendency of higher variability and asymmetry may emerge, leading to a more “PD like” gait.
In line with our hypothesis, we found that Micro gait characteristics played an important role in discriminating RBD from CL. We showed that pace, variability and rhythm characteristics were impaired in RBD and rhythm (swing time) was the best single discriminative domain in the regression model for Micro gait characteristics. This is interesting as the ability to regulate pace and rhythm (swing time) is notably impaired in PD and both domains have been shown to be dopa-resistant sensitive measures of disease progression [52]. The lower pace and rhythm (poorer performance) of RBD compared to CL and the fact that swing time strongly discriminated RBD from CL would corroborate the theory that subtle changes in rhythm could reflect not only prodromal and early manifestation motor impairment, but also a potential powerful progressive marker of alterations to the central gait network in RBD [16, 52].
As a general comment, we did not achieve high sensitivity and specificity values; this in line with the high heterogeneity characterizing RBD populations. Indeed, within RBD participants some are on the verge of converting to PD, others may convert in > 10 years’ time, and others may never convert. Recent work has described how olfactory dysfunction is an important clinical biomarker for PD [53]. We found that adding olfactory loss information (Sniffin’ Sticks test total scores) to gait characteristics increased discriminative power of the regression models, achieving highest AUC for long ABs (AUC=0.860). This suggests that a multimodal assessment could be a useful tool for discrimination of RBD from controls. Future work is needed to address this point by looking at larger cohorts and longitudinal data including converters to DLB, MSA, etc. which may have a different gait signature.
Clinical implications
We found that more Micro gait characteristics than Macro ones seem to discriminate people with RBD from CL; specifically Micro gait pace, rhythm and variability measures seem to be best discriminative domains for presence of RBD. Real-world walking behavior and gait assessment could therefore play an important role, together with other prodromal biomarkers, as a diagnostic tool to identify at an early stage people with similar “PD-like” walking behaviors and gait profiles, so at risk of developing PD.
Limitations
This study informs understanding of the association between walking activity quantified via a range of Macro and Micro gait characteristics and RBD, however further work is required to identify the merits of these exploratory analyses, especially in a larger and balanced sample of people with RBD and in longitudinal studies looking at conversion to PD if and when available. We acknowledge that, due to male predominance of the presented cohort, generalizability of the results may not extend to females. Moreover, accounting for multiple correction may also strengthen and confirm results. Utilizing larger populations of RBD assessed longitudinally to enable separation of participants with high risk of converting to PD to those with lower risk may help improving discriminatory analysis and in ultimately predicting prodromal PD. We acknowledge that the inclusion of only one model of gait including specific Macro and Micro gait characteristics may limit generalizability; in the future other reported models and outcomes should be considered to identify the best measure (or combination of measures) for the detection of early prodromal markers of PD.
Conclusion
We found that Macro gait outcomes, assessing overall walking behavior, do not seem to play a significant role in identifying or discriminating RBD, apart when considering longer walking bouts. In general longer bouts (≥60 s) seem to differentiate groups better than medium or medium-to-long bouts. Micro gait characteristics are sensitive to identify RBD; pace, variability and rhythm characteristics significantly differentiated RBD from controls, with swing time being the best discriminator for the definition of persons with RBD, so at risk of developing PD. Our results are promising and would suggest quantitative sensor-based real-world gait assessment as an important part of an assessment battery for definition of prodromal markers of PD.
ACKNOWLEDGMENTS
The authors would like to thank the Monument discovery study group, all the participants and Dr Alan Godfrey.
This study was funded by the Monument Trust Discovery Award from Parkinson’s United Kingdom and supported by the National Institute for Health Research (NIHR) Oxford Biomedical Research Centre based at Oxford University Hospitals NHS Trust and University of Oxford, and the Dementias and Neurodegenerative Diseases Research Network (DeNDRoN). SDD is supported by the Newcastle Biomedical Research Centre (BRC) based at Newcastle upon Tyne and Newcastle University. The work was also supported by the NIHR/Wellcome Trust Clinical Research Facility (CRF) infrastructure at Newcastle upon Tyne Hospitals NHS Foundation Trust. MTH has acted as advisor to Biogen and Roche. All opinions are those of the authors and not the funders.
CONFLICT OF INTEREST
The authors have no conflict of interest to report.
Financial Disclosures of all authors (for the preceding 12 months):
SDD, TRB, MC, MR, FB have nothing to disclose.
AY reports other from UCB, other from Teva, other from Genus, other from Abbvie, other from Britannia, outside the submitted work.
CL reports grants from Parkinson’s UK during the conduct of the study.
MTH reports personal fees from Biogen Pharmaceutical Company, personal fees from Roche Pharmaceutical Company, outside the submitted work.
LR reports grants from Medical Research Council, grants from EU, grants from NIHR, grants from Wellcome, grants from EPSRC, grants from Parkinson’s UK, grants from Stroke Association, outside the submitted work.