
Abstract
Background:
Parkinson’s disease (PD) shares pathological and clinical features with progressive supranuclear palsy (PSP) patients making the diagnosis challenging. Distinguishing PD from PSP is crucial given differences in disease course, treatment and clinical management.
Objective:
Although some progress has been made in the discovery of biomarkers for PD and PSP, there is an urgent need to identify additional biomarkers capable of distinguishing between these diseases.
Methods:
In this study, we tested the phosphatases DUSP8 and PTPRC for their diagnostic potential using quantitative PCR assays, in blood of 138 samples from participants nested in the Parkinson’s Disease Biomarkers Program.
Results:
Relative abundance of PTPRC mRNA was downregulated in PSP patients compared to PD and healthy controls, whereas there was no significant difference in the expression of DUSP8. Interestingly, PTPRC mRNA correlated with the Movement Disorder Society Unified Parkinson’s Disease Rating Scale (MDS-UPDRS) total score and MDS-UPDRS- part III, thus indicating it might be useful as part of a biosignature to stratify patients according to disease severity and progression.
Conclusions:
Collectively, these results suggest that PTPRC expression may be useful for distinguishing PD from PSP patients as part of a biosignature. Evaluation of PTPRC along with additional biomarkers in a larger and well-characterized longitudinal study is warranted.
INTRODUCTION
Parkinson’s disease (PD) is a chronic debilitating disease characterized by the selective and progressive loss of dopaminergic neurons in the substantia nigra pars compact. The prevalence of PD is estimated to be 1–5% in individuals older than 50 years and rises steadily with a peak occurring between ages of 70 and 79 years [1]. Although the mechanisms underlying the disease pathogenesis remain elusive, a complex interaction between environmental stressors and genetic factors is believed to play a causative role in the disease. Current treatments improve symptoms associated with dopaminergic deficit, but advanced features of the disease are not adequately controlled [2].
Diagnosis of PD is currently based on clinical assessment of motor symptoms and this often leads to a high rate of misdiagnosis due to the similarities between PD and atypical parkinsonian disorders (APD). Indeed, there is a high misdiagnosis rate reaching 30% between PD and APD [3, 4], in particular with progressive supranuclear palsy (PSP). PSP is the second most common parkinsonian syndrome and patients shares several characteristics with PD patients including postural instability, axial rigidity, and bradykinesia. In addition, PSP patients show early cognitive dysfunction and complex eye movements including vertical supranuclear gaze palsy, fixation instability, lid retraction, blepharospasm and apraxia of eyelid opening and closing [5]. Abnormal accumulation of Tau protein in different brain regions is a hallmark of the disease but the mechanism underlying the disease etiology remains unknown. PSP diagnosis relies mostly on clinical observation and levodopa unresponsiveness.
In an effort to improve the clinical diagnosis of PSP, several potential biomarkers have been identified. For example, imaging-based classification, including magnetic resonance imaging and fluorodeoxyglucose (FDG)-positron emission tomography, has been shown to distinguish PD from PSP with high predictive capacity [6]. However, automated imaging technologies require expensive equipment and more invasive methods. Therefore, a minimally invasive molecular biomarker specific for PSP and capable to distinguish it from PD would substantially improve the clinical management of PSP patients. Some progress toward this goal has been made. For example, the neurofilament light chain (NFL) protein significantly increases in the cerebrospinal fluids of PSP patients and can differentiate PD versus APD patients [7, 8]. Consistent with these results, levels of NFL were increased in blood samples of PSP compared to PD patients and were useful for distinguishing PD from APD patients with 91% specificity and 82% sensitivity [9]. In addition to protein markers, several RNA blood biomarkers were capable of distinguishing PD from APD [10]. Specifically, 13 splice variants were useful to distinguish PD from APD and healthy controls (HC) with 90% sensitivity and 94% specificity [10].
In our previous study, we performed an integrative transcriptomic and network analysis to identify genes and biological pathways associated with PSP [11]. Briefly, a group of genetic variants associated with PSP identified by genome-wide association study (GWAS) were mapped into the human functional linkage network to identify neighboring genes linked to known PSP genes. A random walk algorithm with restart was performed on the functional linkage network to rank each of the neighboring genes [11]. This analysis identified a gene network enriched in genes related to phosphatase activity. Among these genes, the protein tyrosine phosphatase, receptor type 1 (PTPN1) was identified as a potential biomarker capable of distinguishing PSP from PD patients with 86% diagnostic accuracy [11, 12]. More recently, we replicated our previous results on blood samples obtained from the Parkinson’s Disease Biomarkers Program (PDBP). We found that five biomarkers PTPN1, coatomer protein complex subunit zeta 1 (COPZ1), fatty acid hydroxylase domain containing 2 (FAXDC2), solute carrier family 14 member 1 (SLC14A1s), and nicotinamide phosphoribosyltransferase (NAMPT) allowed the discrimination of PSP patients from controls, whereas COPZ1 and PTPN1 distinguished PD from PSP patients [13].
Despite the urgent need for a readily accessible biomarker for PSP patients, very few studies have analyzed the blood transcriptome in PSP patients. Recently, a transcriptomic study using blood from PD, APD and HC participants identified a signature of 87 genes capable of distinguishing PD from HC, but not from APD [14]. Here, we investigated the genetic overlap between our earlier study and the newer transcriptomic study to identify novel biomarkers for PSP [11, 14]. Four shared genes were identified including vascular endothelial growth factor A (VEGFA), mitogen-activated protein kinase 8 (MAPK8), dual specificity phophatase 8 (DUSP8) and protein tyrosine phosphatase, receptor type C (PTPRC) [11, 14]. Given the involvement of phosphatases in PSP [11], here we focused on the analysis of phosphatases as potential biomarkers for PD and PSP.
MATERIALS AND METHODS
Blood transcriptomic studies in PSP
We searched Nextbio Research and the Gene Expression Omnibus (GEO) for human microarray studies that included PSP patients. The following search terms were used: “progressive supranuclear palsy”, “blood”, “RNA”. Two datasets were identified as meeting the criteria. One microarray study was identified in NextBio Research, GSE99039 [11]. The second study was identified in GEO, GSE34287 was used previously in a study that integrated blood transcriptomic data, genes identified by GWAS and network analysis to identify biomarkers and pathways for PSP [11]. This study provided a list of 200 candidate genes associated with PSP. Dataset GSE99039 was analyzed using NextBio Research (Illumina, USA). Only genes with a p-value≤0.05 and an absolute fold-change≥1.2 were regarded as significant.
PDBP study participants
Samples used in this study were obtained from PDBP, a consortium of clinical sites funded by the National Institute of Neurological Diseases and Stroke (NINDS, National Institutes of Health (NIH), United States). The Institutional Review Boards (IRB) of each PDBP center and the Rosalind Franklin University of Medicine and Sciences approved the study protocol. Written informed consent was obtained from all participants before inclusion in the study. PD patients were recruited and evaluated by movement disorder specialists using established criteria [15]. Disease severity was assessed using the Movement Disorder Society Unified Parkinson’s Disease Rating Scale (MDS-UPDRS) part III and Hoehn and Yahr scale. Inclusion and exclusion criteria were the following: PD patients responded to dopaminergic therapy and exhibited asymmetrical symptom onset; HC had no history of neurological disorder; PSP patients were over 40 years old with vertical gaze palsy and/or slow vertical gaze/postural instability during the first year of diagnosis. Additional inclusion and exclusion criteria have been published elsewhere [15]. More details about the demographic and clinical characteristics of the study participants selected for this study are listed in Table 1.
Overview of demographic and clinical characteristics of participants in the PDBP cohort
CI, 95% confidence interval; HC, healthy controls; MoCA, Montreal Cognitive Assessment; MDS-UPDRS, Unified Parkinson’s Disease Rating Scale; PD, Parkinson’s disease; PSP, progressive supranuclear palsy; SD, standard deviation; y, years. aBased on a Student t-test. bBased on chi-square test (χ2).
Linear discriminant analysis for RNA PD biomarkers tested in PDBP
A forward step-wise linear discriminant analysis was performed to identify the best group of variables for discriminating between groups. HC, healthy controls; PSP, progressive supranuclear palsy; PD, Parkinson’s disease.
Collection and processing of RNA samples
We obtained a total of 138 RNA samples at baseline from age and sex-matched early stage PD, PSP patients and HC from PDBP. Standardized clinical and biospecimen collection procedures were used for all participants. Each biospecimen collection followed the PDBP protocol and mirrors the Alzheimer’s Disease Neuroimaging Initiative (ADNI), BioFIND and PPMI protocols. Collected biosamples were sent to the NINDS Repository (BioSEND), where they underwent quality control and were cataloged. Coded RNA samples were shipped in dry ice to Rosalind Franklin University of Medicine and Sciences for the studies described herein. The investigators were blinded to the status of the participants until after the data was collected.
Quantitative reverse transcription polymerase chain reaction assays
Samples with RNA integrity values ≥6.0 and absorbance 260/280 between 1.8 and 2.4 were used in this study. RNA (0.4 μg) was reverse transcribed into cDNA using a mix of random hexamer primers (High Capacity cDNA Synthesis Kit, Life Technologies, USA). Quantitative reverse transcription polymerase chain reaction assays (qRT-PCR) were performed using ViiA7 real-time PCR system (Thermo Fisher Scientific, Waltham, MA). Each 25 microliters reaction contained Bullseye EvaGreen qPCR 2X Mastermix (MIDSCI, St. Louis, USA) and primers at a concentration of 0.05 mM. Primer sequences used in qRT-PCR assays are as follows: DUSP8 forward: 5’-GTCCCCATCAACGACAACTAC-3’; reverse: 5’-CAGTGGACGATGACTTGGCAG-3’; PTPRC forward: 5’-TTGAGCGACAGGAGGATGAG-3’; reverse: 5’-GACGCCTCTCCACATTGCT-3’; GA PDH forward: 5’-CAACGGATTTGGTCGTATTGG-3’; reverse: 5’-TGATGGCAACAATATCCACTTTACC-3’; ACTB forward: 5’-TCACCCACACTGTGCCATCTACGA-3’; reverse: 5’-CAGCGGAACCGCTCATTGCCAATGG-3’. Amplification steps used were as follows: denature at 95°C for 10 min, annealing at 95°C for 15 sec, extension at 60°C for 45 cycles of amplification and 95°C extension for 15 sec. Melting curve was performed following the following conditions: 60°C for 1 min following by 5°C/sec and 95°C for 15 sec. qRT-PCR assays were performed in triplicates. The geometric mean of the two reference genes, glyceraldehyde-3-phosphate dehydrogenase (GAPDH) and actin beta (ACTB), were used to normalize for input RNA. Expression data was analyzed using the comparative ΔΔCt method as shown previously [11, 16–19].
Statistical analysis
Statistical analyses were performed using STATISTICA 12 (StatSoft, OK, USA) and GraphPad Prism version 5 (GraphPad Software, Inc., CA, USA). A Student-t-test (unpaired, two tailed) was used to assess the differences between two groups and a chi-square test was used to analyze categorical data. Correlation analysis was performed using the Pearson method. Biomarker performance was assessed using a receiver operating characteristic curve (ROC) analysis. Network and pathway analysis was performed using Genemania in Cytoscape 3.2.1. A p-value of 0.05 or less was regarded as significant. All the data used in preparation of this manuscript is publicly available at: https://pdbp.ninds.nih.gov/.
RESULTS
Demographic and clinical characteristics of PDBP study participants
Analysis of demographic characteristics of the study participants used in this study showed no significant differences in mean age and sex distribution between PD, PSP and HC (Table 1). The mean age of study participants was 70 years. PD patients exhibited approximately a 4 years longer disease duration compared to PSP patients. However, PD patients had a lower age of onset compared to PSP patients by 4 years. There were some differences in clinical measures of disease severity. For example, PSP patients exhibited higher MDS-UPDRS scores [CI, 41.0–52.8] than PD patients [CI, 27.1–40.1]. In addition, PSP patients had lower MoCA scores [CI, 18.6–21.9] than PD patients [CI, 22–24.2]. There were no significant differences in Hoehn and Yahr and MDS-UPDRS total scores between PD and PSP patients.
Analysis of blood transcriptomic studies in PSP
In order to identify additional biomarkers for PSP, we investigated the genetic overlap between two PSP studies [11, 14]. Our previous study employed an integrative transcriptomic and network analysis to identify genes and pathways associated with PSP [11]. Candidates genes identified in the network were scored and ranked according to their closeness to well established genetic risk factors for PSP [11]. The list of the top 200 ranked candidate genes associated with PSP is presented in Supplementary Table 1. The second study included a total of 162 transcripts that were identified as differentially expressed in PSP patients compared to healthy controls (GSE99039) (Supplementary Table 2) [14].
We searched for the overlap between genes identified in these studies and found VEGFA, MAPK8, DUSP8 and PTPRC (Fig. 1A).
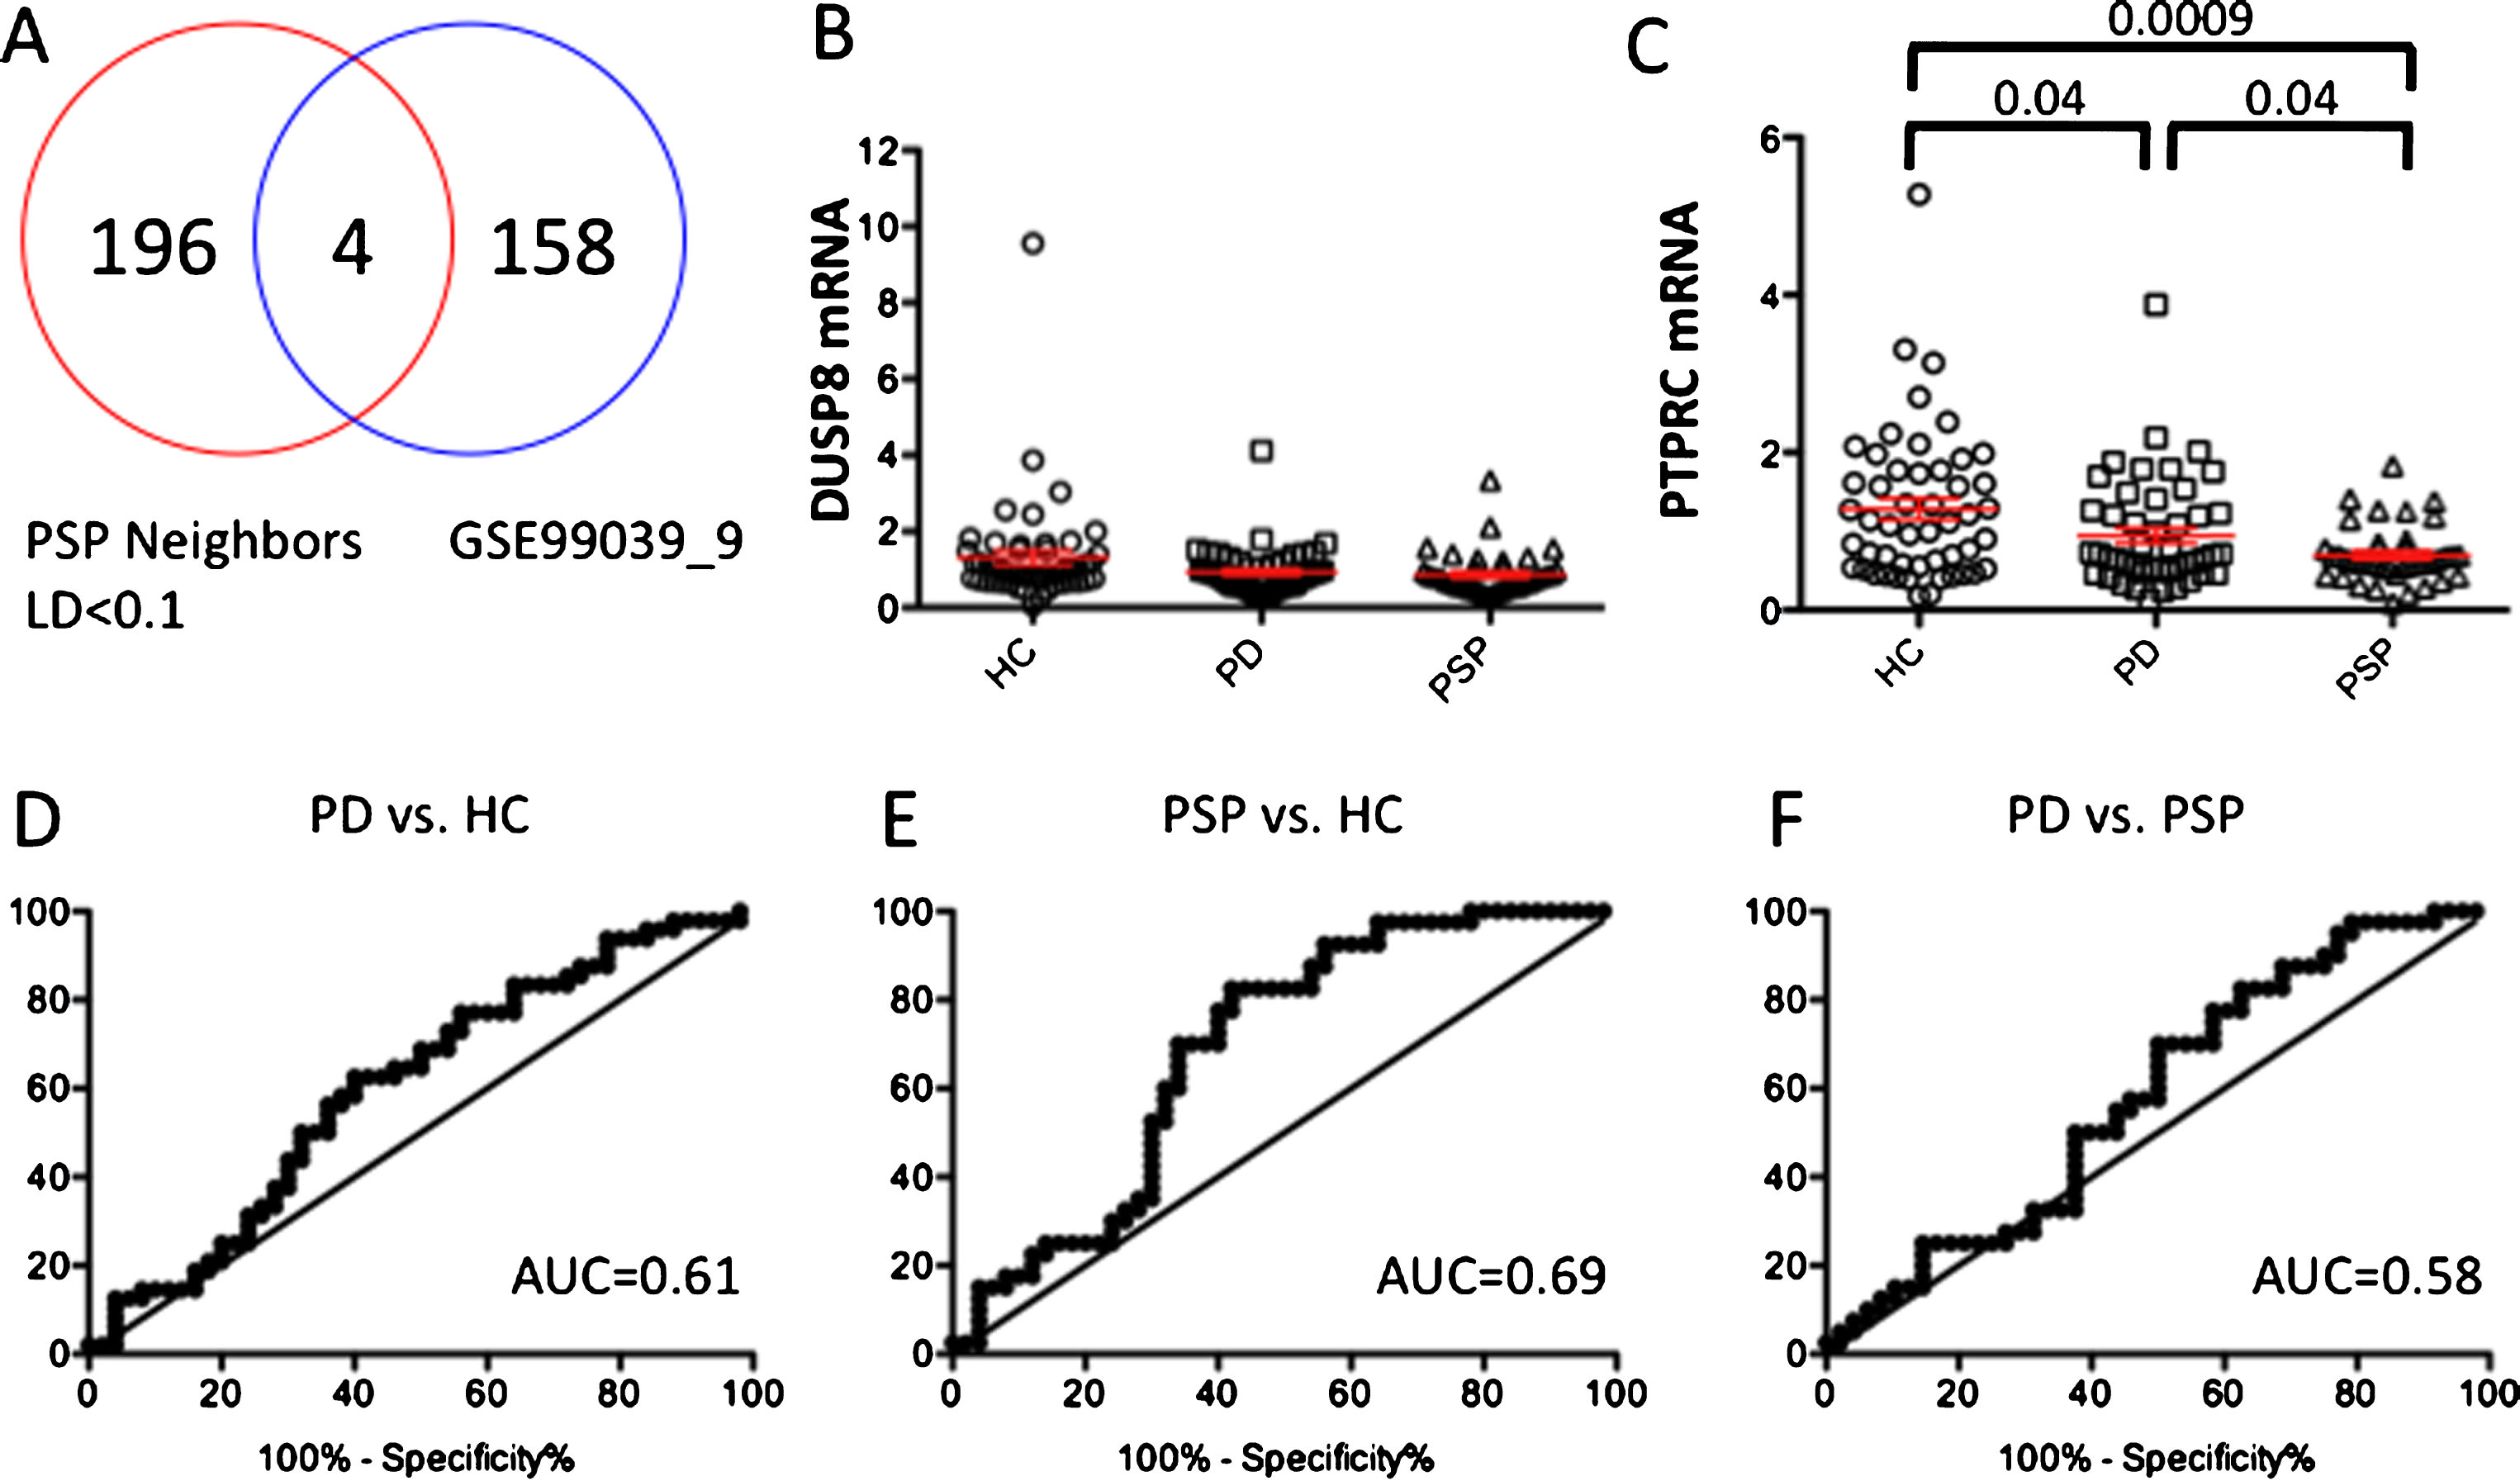
Evaluation of DUSP8 and PTPRC in the PDBP cohort. (A) Venn diagram analysis of candidate PSP genes and expression data from the microarray study (GSE99039). (B) Relative abundance of DUSP8 in blood of PD and PSP patients compared to HC. (C) Relative abundance of PTPRC in blood of PD and PSP patients compared to HC. (D-F) ROC analysis to evaluate the capacity of PTPRC for distinguishing PD patients from HC, (E) PSP patients from HC and (F) PD from PSP patients. The geometric mean of two reference genes, GAPDH and ACTB, were used to normalize for input RNA. Error bars represent standard error. A p-value of less than 0.05 was regarded as significant based on a Student t-test (two-tailed).
Evaluation of DUSP8 and PTPRC as biomarkers for PSP
Our previous study using a network-based approach identified a gene network associated with PSP enriched in biological pathways related to phosphatase activity and protein dephosphorylation [11]. Further, the phosphatase PTPN1 was identified as a diagnostic biomarker capable of distinguishing PD from PSP patients. Because of the involvement of phosphatases activity in PSP, we next evaluated by qRT-PCR assays the diagnostic potential of the two phosphatases shared between the studies [11, 14], DUSP8 and PTPRC, in RNA samples extracted from whole blood of 48 PD, 40 PSP and 50 HC nested in the PDBP cohort. Relative abundance of DUSP8 was not differentially expressed in any of the group comparisons (Fig. 1B). Interestingly, relative expression of PTPRC was significantly downregulated in PD and PSP patients compared to HC (P < 0.04 and P < 0.0009, respectively, Fig. 1C). In addition, we observed a significant downregulation of PTPRC in PSP compared to PD patients (P < 0.004).
Assessment of biomarker performance by a ROC revealed that the expression of PTPRC could distinguish PD patients from HC with 44% sensitivity and 70% specificity with an area under the curve (AUC) of 0.61 (Fig. 1D). Likewise, PTPRC could distinguish PSP from HC with 70% sensitivity and 66% specificity with an AUC value of 0.69 (Fig. 1E). Finally, PTPRC could distinguish PSP from PD patients with 40% sensitivity and 63% specificity using a cutoff value of 0.58 with an AUC of 0.58 (Fig. 1F).
Pearson correlation analysis showed that relative abundance of PTPRC was independent of age and sex. Interestingly, relative abundance of PTPRC correlated with measures of disease severity including UPDRS total score (r = 0.20, p = 0.01) and UPDRS part III (r = 0.27, 0 = 0.001) (Fig. 2). No significant correlations were found for other clinical variables including MoCA and disease duration.
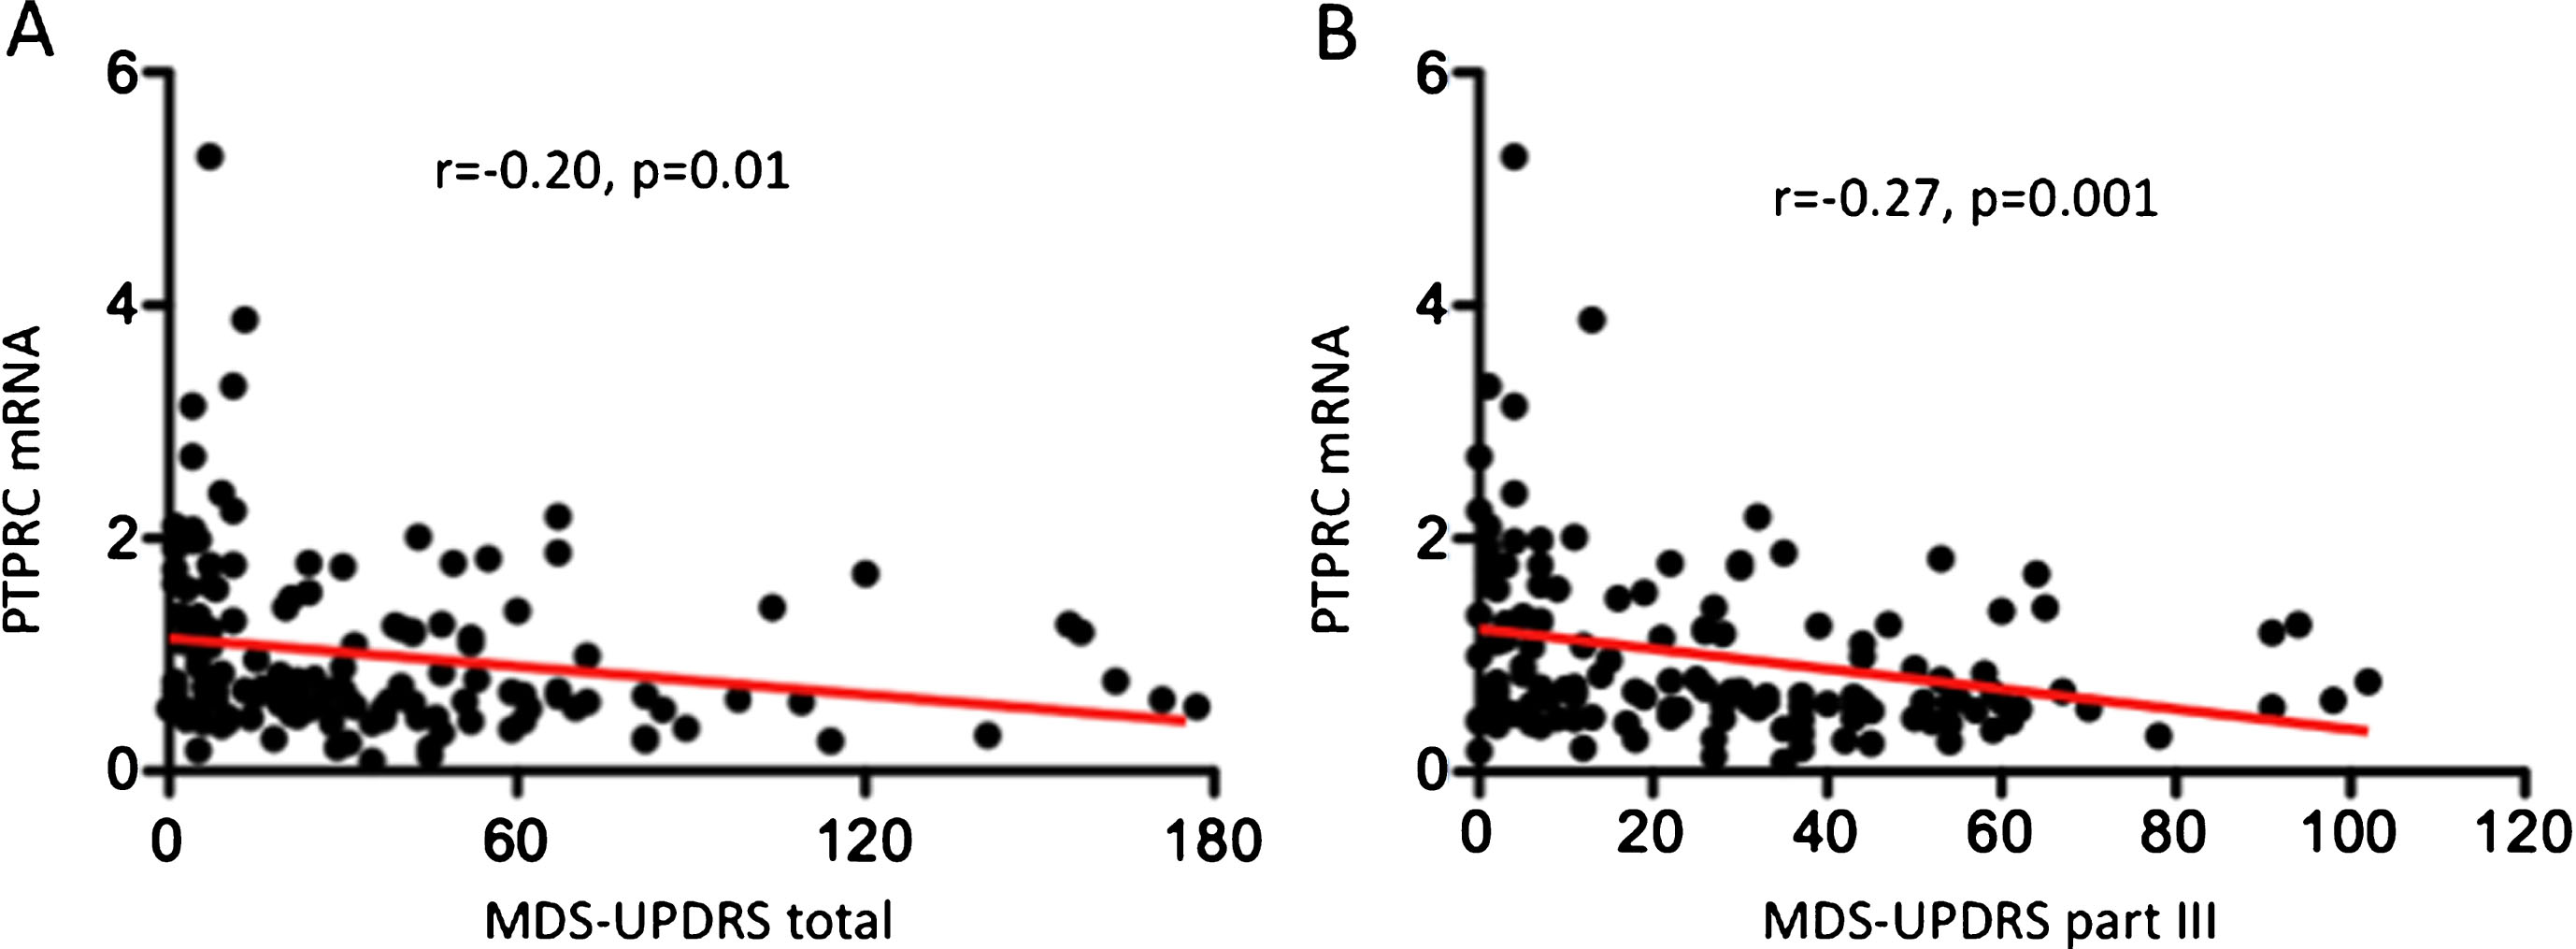
Correlation analysis of PTPRC mRNA expression with clinical characteristics. Pearson correlation (r) and the associated p-value are shown for each analysis. (A) Correlation analysis between PTPRC mRNA expression and MDS-UPDRS total. (B) Correlation analysis between PTPRC mRNA expression and MDS-UPDRS part III. Pearson correlation was calculated using all the samples analyzed (n = 138). Linear regression line is depicted in red. A p-value < 0.05 was considered significant.
Linear discriminant analysis
In our previous study, we showed by linear discriminant analysis that COPZ1 and PTPN1 were capable of distinguishing PD from PSP patients in samples obtained from PDBP [13]. To determine whether a new combination of biomarkers could be used to discriminate between healthy individuals and PD and PSP patients, we performed linear discriminant analysis with PTPRC and biomarkers we identified previously. The analysis showed that PTPRC and COPZ1 were retained in the model and capable of discriminating between PD from HC with 61% overall diagnostic accuracy. A biosignature comprising PTPRC, COPS7A, PTPN1, and COPZ1, was capable of discriminating between PSP from PD patients with 62.5% diagnostic accuracy. The resulting canonical discriminant equation is D = –2.2 X(PTPRC) + 1.7 X(COPS7A) + –0.61 X(PTPN1) + 0.33 X(COPZ1) + 0.46, where D is the discriminant score and X is the mRNA expression level of each biomarker. According to the standardized equation coefficients, PTPRC was the biomarker with the highest discriminant capacity followed by COPS7A, PTPN1 and COPZ1.
Network and pathway analysis revealed a network associated with COPI coating of Golgi vesicle, Golgi transport vesicle coating, T cell receptor complex, positive regulation of tyrosine phosphorylation of STAT3, and JAK-STAT cascade involved in growth hormone signaling (Fig. 3).
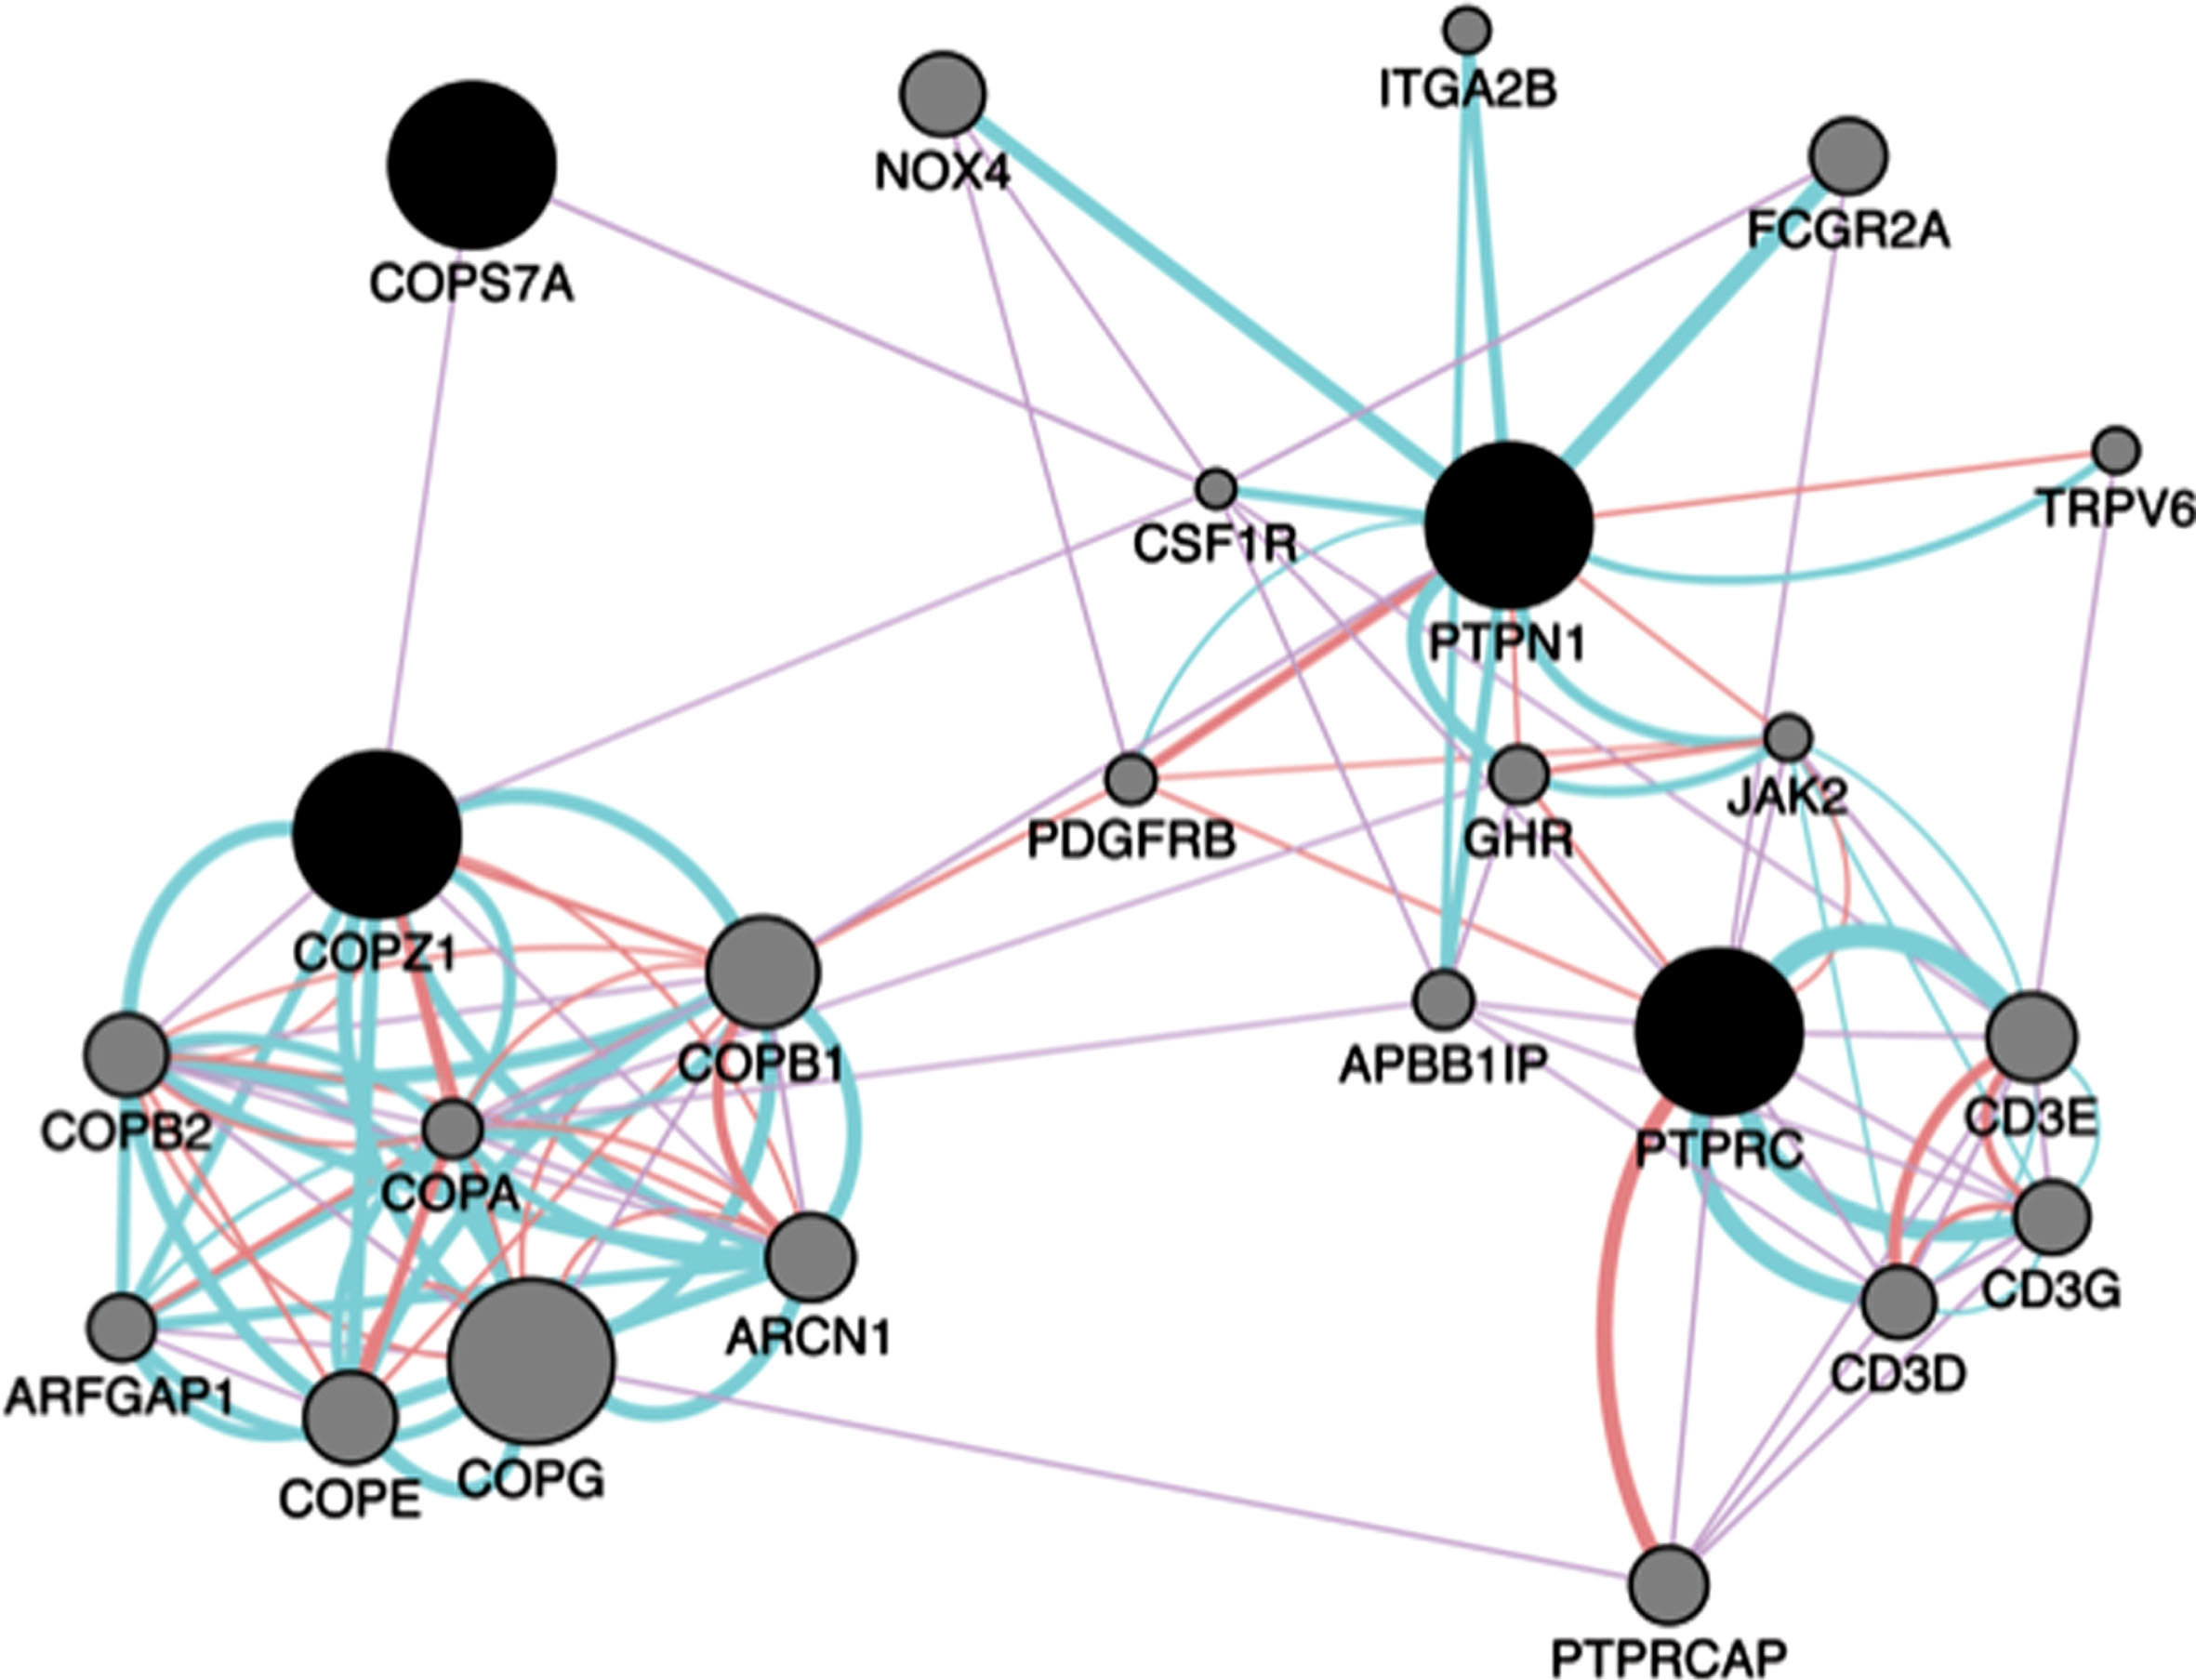
Network analysis. Gene network analysis was performed using Genemania in Cytoscape V3.2.1. Input genes are shown in black circles and other genes with the greater number of interactions are displayed in gray circles. The sizes of the gray nodes represent the degree of association with the input genes (i.e., smaller size represents low connectivity). Purple, blue and pink lines represent coexpression, pathways, and physical interactions, respectively.
DISCUSSION
There is a pressing need to find readily accessible biomarkers capable of distinguishing PD from PSP patients. Unfortunately, very few studies have addressed the high misdiagnosis rate between PD and PSP patients. To date, there are no fully validated biomarkers for PD and PSP thereby limiting substantially the outcome of clinical trials testing potential therapeutics.
In order to identify new potential biomarkers for PSP, we interrogated the genetic overlap between two studies using PSP patients [11, 14]. Four genes including VEGFA, MAPK8, DUSP8 and PTPRC were shared between the studies. Interestingly, these genes have been implicated in processes related to neurodegeneration. For example, genetic variants in VEGFA have been documented to increase the risk for sporadic PD [20]. Of note, VEGF has been associated with neuroprotection of dopaminergic neurons [21, 22]. MAPK8, also called C-Jun N-Terminal Kinase 1 (JNK1), is a serine/threonine-protein kinase involved in various processes such as cell proliferation, differentiation, and cell death [23]. DUSP8 and PTPRC are both part of the phosphatase superfamily. DUSP8 inactivates its target kinases by dephosphorylating both the phosphoserine/threonine and phosphotyrosine residues [24]. PTPRC, also called CD45, specifically dephopshorylates tyrosine residues. PTPRC has been implicated in microglial activation associated with Alzheimer’s disease (AD) [25]. Furthermore, deficiency in PTPRC activity has been shown to trigger the accumulation of neurotoxic Aβ oligomers in a rodent model of AD thus suggesting it may be a potential therapeutic target [26].
Our previous study identified a gene network related to phosphatase activity and numerous phosphatases associated with PSP [11]. Among these phosphatases, PTPN1 was identified as a diagnostic biomarker for PSP [11]. Given these results, we tested 2 phosphatases DUSP8 and PTPRC in RNA samples from PD, PSP and HC nested in PDBP. DUSP8 was not differentially expressed in any of the group comparisons. PTPRC was downregulated in PD and PSP patients compared to HC. These results are consistent with previous studies. For instance, dysregulation of PTPRC expression in blood of PD patients has been shown previously [27]. In addition, PTPRC was downregulated in cerebrospinal fluid of PD patients compared to HC [28].
Interestingly, the relative abundance of PTPRC correlated with clinical features in PD patients including MDS-UPDRS total score and MDS-UPDRS- part III thus suggesting it may be useful as part of a biosignature for stratifying patients according to disease severity. Analysis of biomarker performance revealed that PTPRC alone could only distinguish PSP from PD patients with 40% sensitivity and 63% specificity. These results indicate that PTPRC does not possess the optimal characteristics to be a useful diagnostic biomarker for distinguishing PD from PSP patients by itself. A biosignature comprising PTPRC, COSP7A, PTPN1, and COPZ1, improved the diagnostic potential to 62.5% accuracy. A multimodal biosignature including biochemical, imaging biomarkers and clinical tests will most likely be needed to more accurately diagnose PSP patients.
The results from this study indicated that expression of PTPRC is associated with PSP and disease severity in PD patients. In addition, other phosphatases identified in the network from our previous study may be useful biomarkers for PSP [11]. Evaluation of PTPRC and other biomarkers in a larger and well-characterized longitudinal study will be crucial to assess the validity of these findings. In addition, studies on drug-naïve patients would be useful in revealing whether medications effect expression of PTPRC and other biomarkers in future studies. As more high-throughput data become available, future network analyses integrating multiple gene expression datasets from PSP patients will be key to identify new biomarkers, potential therapeutic targets and mechanisms of disease.
CONFLICT OF INTEREST
The authors have no conflict of interest to report.
Footnotes
ACKNOWLEDGMENTS
We are grateful to the participants and clinicians who participated in the PDBP study. This study was funded by the National Institute of Neurological Disorders and Stroke (NINDS) grant number U01NS097037 to JAP. Data and biospecimens used in preparation of this manuscript were obtained from the Parkinson’s Disease Biomarkers Program (PDBP) Consortium, part of the National Institute of Neurological Disorders and Stroke at the National Institutes of Health. Investigators include: Roger Albin, Roy Alcalay, Alberto Ascherio, DuBois Bowman, Alice Chen-Plotkin, Ted Dawson, Richard Dewey, Dwight German, Xuemei Huang, Judith Potashkin, Rachel Saunders-Pullman, Liana Rosenthal, Clemens Scherzer, David Vaillancourt, Vladislav Petyuk, David Walt, Andy West and Jing Zhang. The PDBP Investigators have not participated in reviewing the data analysis or content of the manuscript.