
Abstract
Background:
Reduced glucose tolerance has been long recognized as a potential risk factor for Parkinson’s disease (PD), and increasing scrutiny is currently being placed on insulin resistance (IR) as a pathologic driver of neurodegeneration. However, the prevalence of IR in PD is unknown.
Objective:
To determine IR prevalence in non-diabetic patients with PD and to correlate IR with other metabolic indicators, motor and non-motor symptoms (NMS) of PD, and quality of life (QoL).
Methods:
Non-diabetic patients with a diagnosis of PD were identified and tested for fasting insulin, fasting glucose, and HbA1c. Patients were also offered to take a battery of clinical tests (MoCA, NMSQ, and PDQ-39) and had their PD medications, height, weight, and other demographic features recorded. IR was defined as HOMA-IR≥2.0 and/or HbA1c≥5.7. IR abnormalities were correlated with BMI and demographic features, in addition to motor and NMS.
Results:
154 subjects (109 M, 45F, mean age 67.7±10.5) were included in this study. Mean HOMA-IR was 2.3±1.8. Ninety out of 154 (58.4%) subjects had abnormal IR. IR was more frequent in overweight and obese subjects (61.1% and 82.8% respectively) than normal weight subjects (41.5%). Multivariate analysis showed that BMI was the only significant predictor of IR (p < 0.0001). There was no significant correlation between HOMA-IR and MoCA, PDQ-39, and NMSQ scores.
Conclusions:
IR is prevalent in PD and it correlates with BMI. A correlation between IR with cognitive and QoL measures cannot be determined on the basis of this sample.
INTRODUCTION
A relationship between Parkinson’s disease (PD) and diabetes mellitus type II (DM2) has been described for several decades, predating the introduction of levodopa therapy [1]. Multiple studies have indicated a high rate of abnormal glucose tolerance in PD patients, ranging between 50 to 80% depending on the source [2–4]. DM2 is associated with more severe motor and non-motor features of PD [5] and appears to increase the risk of developing PD [6, 7], although evidence is controversial [8].
The key link between DM2 and PD appears to be insulin resistance (IR), a condition defined by a reduced biological effect for any given concentration of insulin, which is common in aging [9]. Peripheral IR can be measured using the glucose clamp technique or by a less cumbersome method provided by the Homeostatic Model Assessment (HOMA) equation [10]. Peripheral IR is a reversible condition that not only predisposes to DM2 but is associated with central IR [11]. Importantly, central IR can be a either a cause [12] or a consequence [13] of neurodegeneration.
While peripheral IR is a reversible condition and may be a target for pharmacologic and lifestyle management therapies, the prevalence of peripheral IR in PD is currently unknown, hampering interventions in this area. Complicating matters is that there is little consensus as to what constitutes normal and abnormal insulin sensitivity with significant variation in reported measures of peripheral IR in different populations [14, 15]. We conducted a study to determine the prevalence of peripheral IR in a population of non-diabetic PD patients and its correlation to quality of life, cognitive decline and other non-motor features.
METHODS
One hundred and sixty idiopathic PD people attending the movement disorders clinic at Cedars-Sinai Medical Center in Los Angeles were offered testing for fasting plasma insulin (FPI), fasting plasma glucose (FPG) and glycated hemoglobin (HbA1c). HOMA index was calculated by the formula: HOMA-IR = (FPI x FPG)/405 [10, 16]. The study obtained local Institutional Review Board (IRB) approval.
To meet inclusion criteria, individuals had to be age 18 and above with a clinical diagnosis of PD according to the UK Brain Bank criteria. Exclusion criteria included a diagnosis of DM2, as well as an inability to undergo blood draws. Results were obtained and recorded with the date of the sample noted. Demographic information collected included age, gender, ethnicity, PD subtype (i.e. tremor-predominant, akinetic-rigid, mixed), age at PD symptom onset, duration of PD symptoms, height and weight. Motor severity and progression were assessed using the Movement Disorder Society Unified Parkinson’s Disease Rating Scale (MDS-UPDRS) and Hoehn and Yahr Scale (H&Y) collected as part of routine clinic visits. Body mass index (BMI) was calculated according to the formula weight (Kg)/height2 (m) and subjects were subdivided in obese (BMI>30), non-obese overweight (BMI>25) and lean (BMI<25) [17]. Additional testing of non-motor symptoms was performed in a subgroup of 71 subjects for later analysis. This included Montreal Cognitive Assessment (MOCA), Non-Motor Symptoms Scale (NMSQ), and Parkinson’s Disease Questionnaire – 39 (PDQ-39) to assess health related quality of life. Dopaminergic medications were recorded including type and dose, to enable levodopa-equivalent dose (LED) calculation [18].
Impaired fasting glucose (IFG), the intermediate state of abnormal blood sugar between normal and diabetes was defined by FPG concentration ≥100 and <126 mg/dl [19]. A cutoff HOMA index of 2.0, equivalent to <50% sensitivity, was used to define IR. Subjects were considered to have IR if they either had a HOMA≥2.0 and/or HbA1c≥5.7. We classified participants as overweight if their BMI was 25 or greater, and obese if BMI was 30 or greater [20]. MoCA≤22 was considered consistent with dementia.
Pearson R coefficient was used to determine the strength of observed correlations between HOMA-IR index, demographic (age, BMI) and clinical data including LED, MoCA, NMSQ, PDQ-39, and HbA1c. Student t-test analysis was used for group comparisons. Multivariate linear regression analysis was performed to identify variables that independently contributed to IR. A probability value of p < 0.05 was considered statistically significant.
RESULTS
One hundred and sixty people were initially recruited. Six subjects were excluded from further analysis as they were found to have fasting plasma glucose (FPG) concentration (≥126 mg/dl) or HbA1c levels (>6.5 mmol/mol) in the diabetic range. The remaining 154 subjects (109M, 45F) were included in the final analysis. Mean age was 67.7±10.5, with a mean PD duration of 6.5±5.5 years at time of study, and a mean H&Y of 2.2±0.7. Mean BMI was 26.8±4.8 and mean LED was 491.5±537.2. 17/154 subjects (11.0%) had undergone deep brain stimulation (DBS). For additional demographic data please see Table 1.
Demographic data
LED: Levodopa equivalent dose, LED/Weight: body weight (kg) adjusted LED, BMI: Body Mass Index, HOMA-IR: Homeostatic model assessment, FPG: fasting plasma glucose, FPI: fasting plasma insulin, H&Y: Hoehn & Yahr Disease severity scale, MDS-UPDRS: Movement Disorder Society Unified PD Disease Rating Scale in ON and OFF medication states (11 subjects had both ON and OFF scores available from the same date for analysis), HbA1c: glycated hemoglobin, MoCA: Montreal Cognitive Assessment, NMSQ: Non-Motor Symptoms Scale, PDQ-39 Parkinson’s Disease Questionnaire–39.
Mean fasting glucose levels for this population was 95.8±10.2. Fifty-two subjects (33.7%) had IFG, of which 32 (61.5%) also had abnormal HOMA-IR. Mean HOMA-IR was 2.3±1.8 and mean HbA1c was 5.5±0.4 (n = 118). 70 subjects (45.5%) had an abnormal HOMA index, consistent with IR. In addition, 39 (33.1%) subjects had HbA1c data in the pre-diabetic range (≥5.7). Of these 39, 20 had a normal HOMA-IR, bringing the total subjects with undiagnosed IR to 90, or 58.4% of the study population. BMI distribution was skewed toward overweight values, with 65.8% overall overweight subjects and 19% in obesity range. HOMA or HbA1c values consistent with IR were found in 24/29 (82.8%) obese, 44/72 (61.1%) overweight, and 22/53 (41.5%) normal weight subjects (Fig. 1).
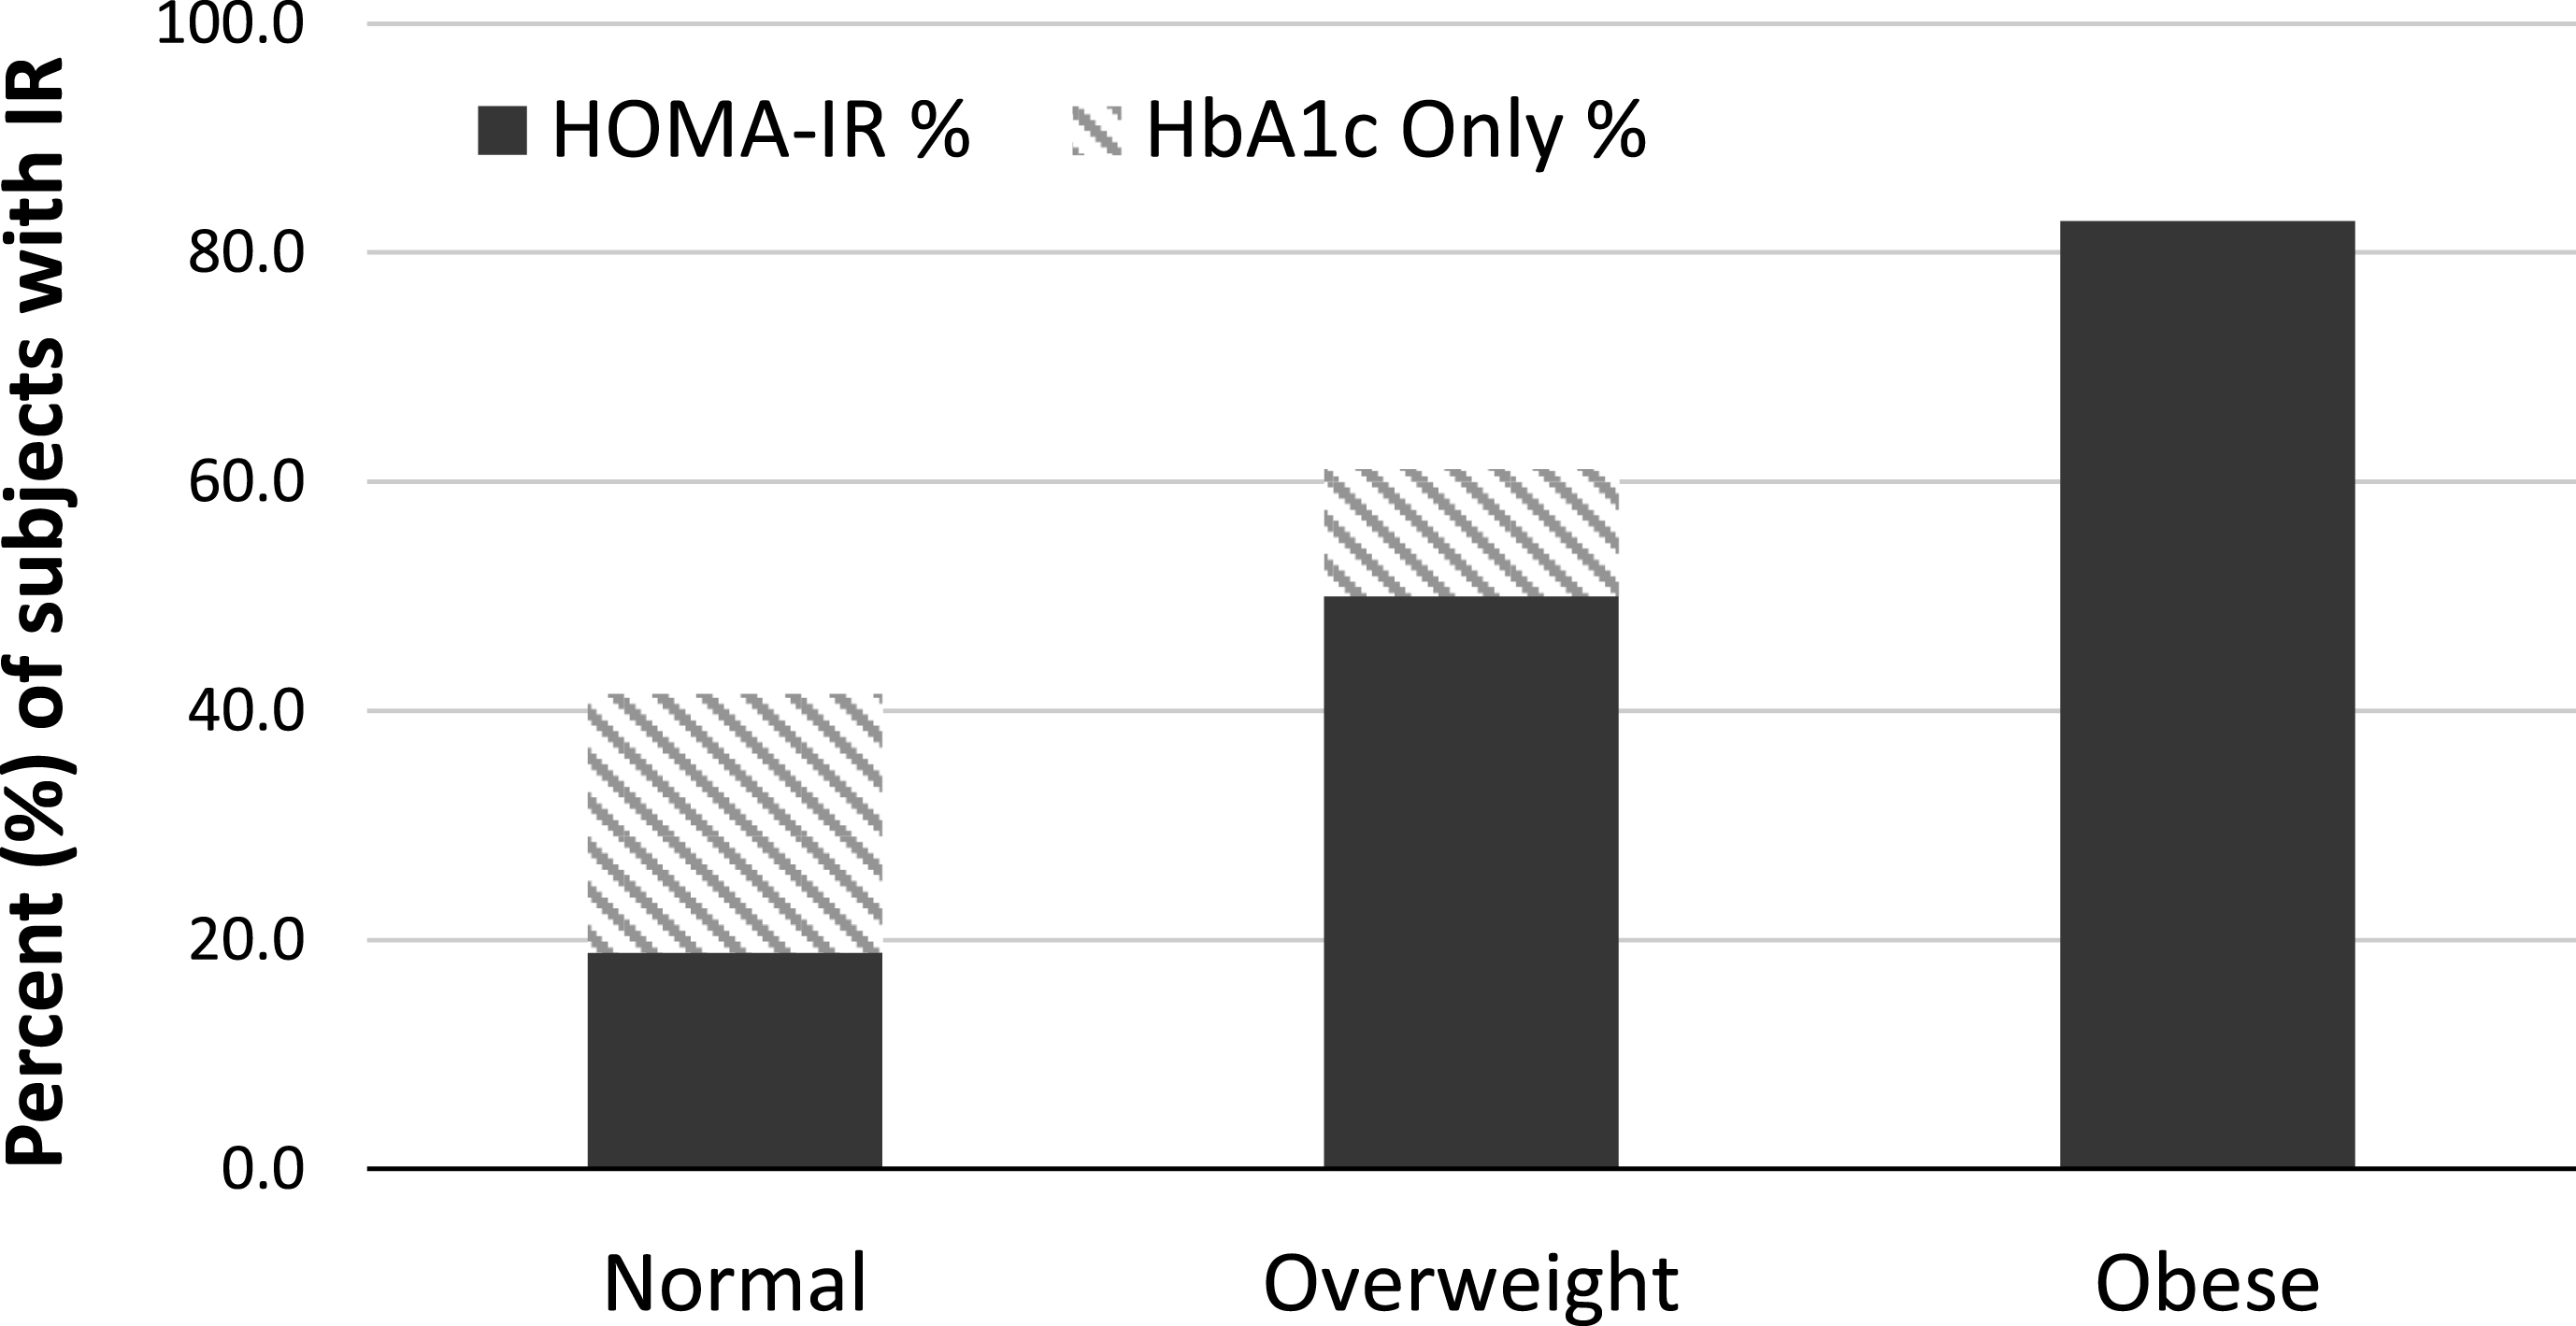
Insulin Resistance distribution by body-type. Stacked bar chart describing the relationship between insulin resistance (IR) and body type. Percentage of subjects who met criteria for IR (see text for definition) is represented on the vertical axis, and it is grouped by body-type, as determined by body mass index (BMI, kg/m2). Normal weight was defined as BMI less than 25, non-obese overweight as BMI greater than 25 but less than 30, and obese as BMI greater than 30.
In the full study cohort, HOMA-IR positively correlated with BMI (Pearson R = 0.42, p < 0.0001) and HbA1c (Pearson R = 0.19, p < 0.05), while it showed a negative correlation with age (Pearson R = –0.19, p = 0.01). There was no significant difference in HOMA-IR between male and female subjects. Obese subjects had significantly higher mean HOMA-IR (3.3±1.7 vs. 2.03±1.7, p < 0.0005) and were significantly younger (63.6±11.5 years old vs. 68.7±10.1, p < 0.05) than non-obese subjects. Similarly, non-obese overweight subjects (BMI >25 and <30) had significantly higher mean HOMA-IR (2.5±2.0 vs. 1.4±0.6, p < 0.001) and were significantly younger (67.3±11.1 years old vs. 71.4±7.9, p < 0.05) than lean subjects. Mean weight-adjusted LED was 7.9±6.8 mg/kg. HOMA-IR did not significantly correlate with weight-adjusted LED, as well as with PD duration, LED, MDS-UPDRS and HY scores. Multivariate analysis showed that BMI was the only resulting independent variable correlated with IR (p < 0.0001).
Mean H&Y scores were virtually identical between IR and non-IR subjects (Table 2) and there was no significant trend in HOMA-IR by disease severity between stages of the H&Y (data not shown). Similarly, mean MDS-UPDRS measured either in ON or OFF state did not differ between IR and non-IR subjects (Table 2). The prevalence of chronic renal disease was quite low overall and did not differ between IR (4.4%) and non-IR subjects (3.1%). Chronic cardiac disease, including coronary artery disease, atrial fibrillation, chronic heart failure and cardiomyopathy, was also relatively infrequent both in IR (18.9%) and non-IR subjects (10.9%), while the prevalence of hypertension was higher, affecting 35.6% of subjects with IR and 25% of subjects without IR. All these differences failed to reach statistical significance.
Motor, cognitive, other non-motor symptoms, and health related quality of life scores in PD subjects with and without Insulin Resistance
MDS-UPDRS III: Movement Disorder Society Unified Parkinson’s Disease Rating Scale part III, H&Y: Hoehn and Yahr scale. MoCA: Montreal Cognitive Assessment, NMSQ: Non-Motor Symptoms Scale, PDQ-39 Parkinson’s Disease Questionnaire –39, IR: Insulin Resistant based on HOMA≥2.0 and/or HbA1c≥5.7, NS: non-significant.
In the subgroup undergoing more detailed clinical testing (n = 71), mean MoCA score was 26.4±3.0, with 23/71 (32.4%) abnormal values (25 or less) and 5/71 (7.0%) values consistent with dementia. HOMA-IR, BMI, PD duration, LED, Hb1ac, PDQ-39, NMSQ, and age were not significantly different between demented and non-demented subjects. MoCA showed a significant inverse correlation with age (Pearson R = –0.38, p < 0.001) but did not correlate with PD duration, or HoMA-IR. Mean NMSQ score was 11.3±5.1. Mean study PDQ-39 was 157.2±103.5. There was no significant difference between IR and non-IR subjects in sub-section scores of either PDQ-39 or NMSQ (Table 3). Likewise, there was no significant correlation between BMI subgroups and HbA1c, PD duration, LED, MoCA, PDQ-39, and NMSQ. Multivariate analysis including HOMA IR and age, disease duration, MoCA scores, HY stage and weight-adjusted LED in this subgroup failed to reveal significant predictors of cognitive decline.
Non-motor symptoms and health related quality of life sub-categorical scores in 71 PD subjects with and without insulin resistance
NMSQ: Non-Motor Symptoms Questionnaire; PDQ-39: Parkinson’s Disease Questionnaire – 39, IR: Insulin Resistant based on HOMA≥2.0 and/or HbA1c≥5.7, NS: non-significant.
The DBS subgroup (n = 17) had a significantly higher mean PD duration (11.9±5.3 years versus 5.8±5.1 in non-DBS subjects, p < 0.0005) and a significantly higher NMSQ than non-DBS subjects (16±4.5 vs. 10.3±4.7, p < 0.005). Weight distribution in the DBS subgroup was similar to the general study population, with 5/17(29.4%) DBS subjects in the normal weight range, 7/17(41.2%) non-obese overweight, and 5/17(29.4%) obese. Age, BMI, HOMA-IR, Hb1ac, MoCA, and PDQ-39 were not significantly different between DBS and non-DBS subjects.
DISCUSSION
Despite the growing interest in the use of incretin mimetics in the treatment of PD [21, 22], there is little information regarding the prevalence of IR in PD, with available data limited to a small study showing significantly elevated HOMA index scores in PD patients as compared to healthy controls [23]. Our study indicates that almost two thirds of non-diabetic people with PD may be insulin resistant, despite normal fasting glucose and, in many cases, normal HbA1c. These figures suggest that IR in PD is a prevalent and largely undetected problem, especially in those patients who are overweight or obese, a feature reported in the early stages of PD [24]. While our data confirms previous studies showing that HOMA-IR is more than double in obese than in lean subjects [25], we also found a substantially higher percentage (41%) of lean PD patients with IR than reported in healthy adults [26]. This finding may be related to the abnormal fat distribution in subjects with PD, which show, on average, a higher visceral to subcutaneous fat ratio [27], a feature that correlates with IR [28]. We were unable to characterize fat distribution in this study, and therefore the role of abnormal fat distribution in the high prevalence of IR in PD will need further evaluation. Nevertheless, we propose that HOMA-IR may be a more relevant marker of metabolic health than BMI in patients with PD, as BMI does not capture weight distribution. Interestingly, the subgroup of PD patients who underwent DBS, a treatment frequently associated with weight gain [29], had metabolic measures largely similar to the rest of our PD cohort.
While other dementing neurodegenerative diseases, including Alzheimer’s disease [30], dementia with subcortical features [31], and Huntington’s disease [32] have been associated with IR, we found no correlation between HOMA-IR and cognitive decline. Mean MoCA scores were virtually identical in subjects with and without IR. This is in contrast to prior reports describing elevated HOMA-IR in subjects with PD-Dementia [33], but in line with other investigations showing an inverse correlation between IR and incidence of dementia [34]. As expected, advancing age predicted lower MoCA scores, however PD duration or severity did not. The unanticipated demographic composition of our study population affected the relationship between IR and MoCA, as BMI – the most powerful predictor of IR – inversely correlated with age – a predictor of cognitive decline. Furthermore, the low incidence of dementia in our study cohort and the use of a screening test, as opposed to a formal neurocognitive battery, may have limited the sensitivity of our sample. In the end, the lack of longitudinal sampling prevents any firm conclusion in regard to a possible link between IR and cognitive decline.
IR did not appear to affect the prevalence of any non-motor symptom, as mean NMSQ scores in our study were comparable to NMSQ data in similar populations of PD patients [35]. Likewise, mean PDQ-39 scores in our cohort were consistent with other studies [36]. IR was not associated with changes in health-related QoL sub-categories (Table 3). Finally, no correlation was found between IR and LED, even when adjusted for weight, in line with prior research showing that levodopa does not affect glucose tolerance in PD [37].
Despite some controversy [38], HOMA-IR appears to be a reliable indicator of IR [39] and a more sensitive and responsive measurement to changes in body metabolism than other traditional measures, such as fasting glucose [40]. An optimal cutoff for HOMA-IR has yet to be determined and may vary regionally [14, 41] and by age [42]. We used a cut-off HOMA of 2.0 given that this represents 50% beta cell function, but a lower set point may increase sensitivity. IR is an important predictor of metabolically linked conditions such as DM2 [43] and cardiovascular disease [44]. The risk of IR is known to increase with obesity, aging, physical inactivity, and genetic predisposition [45], risk factors also associated with the diagnosis of PD [46]. Interestingly, IR did not positively correlate with age or disease duration in our study population, suggesting that IR may be an independent process in PD. While insulin resistance in aging has been associated to abdominal obesity in the general population [47], other authors have suggested that changes in adiposity may not fully explain age related increases in insulin resistance [48]. While we did find a strong positive correlation between obesity and IR, age negatively correlated with obesity in our population. PD patients tend to initially gain weight [24] and then lose weight over time, although they may actually increase caloric intake as weight decreases, suggesting a complex metabolic picture [49]. Longitudinal data are therefore needed to understand how weight changes in PD may impact IR status over time [50].
The generalizability of these results may be limited, as this study was performed at a single center, with a largely affluent population who generally has access to good medical insurance coverage. Two-thirds of our study population was overweight, a bias that might have resulted in higher incidence of IR. In addition, both insulin sensitivity and HOMA may vary by ethnicity [51], with our cohort including a caucasian majority. We cannot rule out self-selection bias of patient at greater risk for IR due to diet, weight, or other lifestyle factors. Additionally, given the high prevalence of pre-diabetes or undiagnosed diabetes in the general population of California [52], the relevance of our findings has to be assessed against a backdrop of pervasive metabolic disease present in our region. We did not find a particularly high prevalence of diseases characterized by association with IR in non-PD adults, such as chronic cardiovascular disease and chronic renal failure [53], with the possible exception of hypertension. However, the distribution of hypertension was not significantly different between IR and non-IR subjects. Finally, although this study was not intended to address metabolic syndrome in PD, it is worth noting that we did not collect lipid and cholesterol data for this population.
We conclude that peripheral IR is prevalent in PD and may be an under-diagnosed problem in a large proportion of PD patients, especially in those who are overweight or obese. Given the early occurrence of weight gain in PD and the putative role of IR in accelerating the progression of motor and non-motor features of PD, we believe that these data will deserve further attention and research.
CONFLICT OF INTEREST
The authors have no conflict of interest to report.
Footnotes
ACKNOWLEDGMENTS
Financial support for this research was solely through internal departmental funding, including the Caron and Steven D. Broidy Chair in Movement Disorders.