
Abstract
Background:
Duchenne Muscular Dystrophy (DMD) is a genetic disease in which lack of the dystrophin protein causes progressive muscular weakness, cardiomyopathy and respiratory insufficiency. DMD is often associated with other cognitive and behavioral impairments, however the correlation of abnormal dystrophin expression in the central nervous system with brain structure and functioning remains still unclear.
Objective:
To investigate brain involvement in patients with DMD through a multimodal and multivariate approach accounting for potential comorbidities.
Methods:
We acquired T1-weighted and Diffusion Tensor Imaging data from 18 patients with DMD and 18 age- and sex-matched controls with similar cognitive and behavioral profiles. Cortical thickness, structure volume, fractional anisotropy and mean diffusivity measures were used in a multivariate analysis performed using a Support Vector Machine classifier accounting for potential comorbidities in patients and controls.
Results:
The classification experiment significantly discriminates between the two populations (97.2% accuracy) and the forward model weights showed that DMD mostly affects the microstructural integrity of long fiber bundles, in particular in the cerebellar peduncles (bilaterally), in the posterior thalamic radiation (bilaterally), in the fornix and in the medial lemniscus (bilaterally). We also reported a reduced cortical thickness, mainly in the motor cortex, cingulate cortex, hippocampal area and insula.
Conclusions:
Our study identified a small pattern of alterations in the CNS likely associated with the DMD diagnosis.
Keywords
INTRODUCTION
DMD is an X-linked genetic multifactorial condition in which the lack of the protein dystrophin causes progressive muscular weakness, cardiomyopathy and respiratory insufficiency.
DMD is caused by mutations in the dystrophin gene, which is the largest gene in the human genome and it is composed of 79 exons; its expression is regulated by different promoters with distinct tissue specificity. It contains 3 promoter regions encoding full-length isoforms (Dp427) and at least 4 internal promoter regions encoding the shorter isoforms (Dp260, Dp140, Dp116 and Dp71/Dp40). Outside of the muscular tissue, full length Dp427 isoforms are primarily expressed in the cortical/cerebral structures (Dp427c) and in the cerebellar Purkinje cells (Dp427p). By contrast, shorter isoforms are transcribed in the central nervous system (CNS) but not in muscle [1]. More precisely, the Dp260 is mainly expressed in the retina, the Dp140 and Dp71 are widely expressed in the CNS, the Dp116 is expressed in the peripheral-nerve Schwann cells and the Dp40 has been detected in central neuronal synapses [2–5].
DMD individuals typically present with intragenic loss of function mutations of the dystrophin [6, 7]. Several studies identified a greater vulnerability to brain comorbidities in DMD patients with mutations in the 3’ end of the dystrophin gene, affecting specifically the Dp140 and Dp71 isoforms [8–12].
A cognitive and behavioral phenotype characterized by Autism Spectrum Disorder (ASD), Attention Deficit Hyperactivity Disorders (ADHD) and obsessive-compulsive behavior [9, 14], has been widely described even with different frequency in DMD patients. Slight cerebral atrophy, mild ventricular dilatation and cortical atrophy in a sample of 30 subjects with DMD (10/30 with Intelligence Quotient (IQ)<70) have been described since early reports and confirmed in more recent studies [15], with a reduction in the total brain and gray matter (GM) volumes as well as an alteration in the white matter (WM) microstructure [16]. Further studies with Positron Emission Tomography (PET) showed a reduced glucose metabolism in both cerebellar hemispheres with a consistent pattern of hypometabolism in the left frontal and parietal associative cortices and, bilaterally, in the temporal and occipital cortex [17, 18]. More recently, a reduced brain perfusion was observed in DMD patients using the Arterial Spin Labeling technique [19], as well as functional alterations associated with DMD through resting-state functional MRI [20].
Abnormal dendrite development, myelin damage or altered structural/functional connectivity are assumed to play a role in altered brain development in subjects with DMD [21]. To the best of our knowledge, most studies on brain alterations in DMD focus on the correlation between brain abnormalities and clinical phenotype [22] and compare subgroups of patients based on mutation site and expression of Dp140 isoforms [16, 23]. However, genotype-phenotype correlations only partially explain cognitive and behavioral differences in DMD, as they are observed more frequently in male subjects with DMD carrying deletions in the distal portion of the dystrophin gene (downstream to exon 44) [9, 10, 24, 25].
So far, a number of clinical/neurological/behavioral alterations have been associated with DMD diagnosis. Preethish-Kumar and colleagues compared Diffusion Tensor Imaging (DTI) data to investigate differences in WM between 60 patients with DMD and 40 healthy controls [23]. They found a widespread reduction in Fractional Anisotropy (FA) and increase in Mean Diffusivity (MD) and Radial Diffusivity (RD). A reduction in FA was observed in the splenium of the corpus callosum in another study using DTI and comparing 12 subjects with DMD with 14 age-matched healthy controls [26]. In another study, DTI data were combined with structural T1-weighted (T1 W) images to compare 29 subjects with DMD and 22 age-matched healthy controls: a reduction in GM volume in the left insula and in the occipital cortex, as well as a widespread alteration in WM with reduced FA and increased MD and RD, were observed in the DMD group [16]. Most previous studies focused on the brain of DMD patients compared to healthy controls and did not account for possible comorbidities such as cognitive impairment and/or neurodevelopmental disorders.
Our aim is to apply a multivariate approach to investigate DMD-related effects in the CNS potentially accounting for comorbidities in order to identify a pattern of brain structural alterations uniquely associated with DMD. A whole-brain multimodal analysis implemented through a machine learning approach was adopted to identify a set of brain abnormalities which could enable us to differentiate between DMD patients and controls with comparable demographic and clinical profiles. While conventional univariate statistical analysis targets single regions and measures which are significantly affected by the condition, the multivariate approach allows for a comprehensive brain analysis without any a-priori assumptions regarding the role of key brain regions or measures. We assume that this will enable us to identify a sparse set of brain alterations in which dystrophin could play a relevant role.
MATERIALS AND METHODS
Participants
A clinical population of more than 130 males with DMD (aged from 2.8 to 32 years) is referred each year to the Rare Disease Unit of the Scientific Institute IRCCS Eugenio Medea for periodic clinical evaluation, as indicated by international guidelines [27]. Among these, 20 boys were recruited for the present study as they met the following inclusion criteria:
diagnosis of DMD according to international standard criteria such as progressive muscular weakness, increased muscle plasma enzymes, muscular biopsy and/or a defined mutation in the dystrophin gene [27]; age range 4-17 years; no contraindication to MR, such as claustrophobia, MR incompatible implants or severe musculoskeletal deformities and contractures not compatible with the MR session.
We included the following evaluations according to specific guidelines [27]:
Motor Function: ambulant patients were tested using the 6-Minute Walk Test (6MWT), following standardized procedures [28]; non-ambulant patients were tested using the Motor Function Measure (MFM) scale [29]; Respiratory Function: the wakeful respiratory function was measured through the spirometer in sitting position (FVC % expected). Respiratory dysfunction was considered mild when forced vital capacity was ranging between 60% and 70% of predicted and moderate when FVC is lower than 60%; Cardiac function: measures of Left Ventricular Ejection Fraction (LVEF) were derived from cardiac ultrasound. LVEF is considered normal when greater than 60%, mildly impaired in the range 50% –60%.
Eighteen male subjects enrolled in other research protocols aimed to assess structural and functional brain correlates in other clinical populations (e.g., ASD, developmental dyslexia) were included as a control group. The control group was matched for age, sex, cognitive and behavioral data, therefore it included healthy subjects (N = 7), subjects with an ASD diagnosis (N = 5) and subjects with an Intelligence Quotient (IQ) lower than 75 (N = 10). The similarity between the DMD patient and the control groups were tested including all subjects, using the T-test for the continuous variables (i.e., Age, IQ) and the Pearson Chi-square test for the categorical ones (i.e., ASD diagnosis). Moreover, patients with an ASD diagnosis underwent a genetic panel testing for ASD and no alterations in the DMD gene were observed. Finally, the control group included only subjects with a normal appearing brain morphology and no cardiac or respiratory issues.
The study was approved by the Scientific Review Board and the Ethical Committee of Scientific Institute IRCCS Eugenio Medea. Signed informed consent/assent was collected from parents/legal guardians and patients.
IQ level was determined using the appropriate Wechsler Intelligence Scale (WPPSI-III, or WISC-IV) [30, 31] or Griffiths scale [32]. A full IQ (IQ) lower than 70 was defined as intellectual disability.
All the recruited subjects received a thorough psychiatric and neurologic assessment to exclude major neurological and psychiatric diagnoses other than DMD and ASD. The Autism Diagnostic Observation Schedule–Second Edition (ADOS-2) [33] assessment was administered, if needed, to confirm ASD diagnosis. The ADOS-2 is a standardized, semi-structured observational rating scale used to evaluate communication, reciprocal social interaction, imagination/creativity, and stereotyped behaviors and restricted interests to inform the diagnosis of ASD; it consists of five modules based on the individual’s chronological age and expressive language level, ranging from preverbal to verbally fluent.
All the evaluations were performed by the same team at the Scientific Institute Eugenio Medea: neurologists and child neurologists, psychologists, physiotherapists, pulmonologists and cardiologists.
MRI acquisition protocol
MRI data were acquired on a 3T Philips Achieva d-Stream scanner (Best, The Netherlands) with a 32-channel head coil.
The MRI protocol included two anatomical T1 W and T2 W sequences and a DTI sequence.
T1 W data were acquired with a 3D Turbo Field Echo sequence with Field Of View (FOV)=256x256x175 mm3, voxel size = 1x1x1 mm3, Time of Repetition (TR)=shortest ( 8.1 ms), Time of Echo (TE)=shortest ( 3.7 ms) and Flip Angle = 8.
T2 W data were acquired with a 2D fast spin echo sequence with FOV = 240x240 mm2, voxel size = 1.5x1.5 mm2, slice thickness = 1.5 mm (no gap), 100 slices, TR = 3000 ms and TE = 100 ms.
DWI data were acquired with a two-shell sequence with 4 b0 volumes, 8 directions at b = 300 s/mm2, 32 directions at b = 1100 s/mm2 (voxel size = 2×2 mm2, slice thickness = 2 mm (no gap), TR = 12 s, TE = 80 ms).
The whole acquisition protocol lasted about 35 minutes and was successfully completed by all participants. Acquired images were visually inspected by a trained radiologist technician and sequences with excessive motion artifacts were repeated. Non-collaborative subjects (N = 16) were sedated during the MRI acquisition.
Image data analysis
T1 W images were corrected for bias field intensity artifacts using the N4 algorithm [34] and subsequently processed using the FreeSurfer image analysis suite following the recon-all processing pipeline (http://surfer.nmr.mgh.harvard.edu/, version 7.0). The only change to the default implementation of the FreeSurfer processing pipeline is the introduction of the HCP-MMP1 atlas [35] parcellation of the fsaverage template. The HCP-MMP1 atlas [35] partitions both cortex hemispheres into 180 regions on the basis of multi-modal MRI data acquired on 210 healthy subjects, thus providing a more precise definition of structurally and functionally homogeneous regions of the cortical gray matter. After the processing, deep gray matter and subcortical structures, such as hippocampus, amygdala, caudate, putamen, ventricles, brain stem [36] were characterized by their volume, while cortical thickness was derived for the cortical gray matter regions [37].
DTI data were processed using TORTOISE software V3.0 [38, 39] to obtain MD and FA maps. Raw data were corrected for motion and distortion artifacts (e.g. eddy current, B0 susceptibility, echo-planar imaging distortion) using the T2 W structural image as reference [40]. Subsequently, data were visually inspected to detect any remaining artifacts and discard corrupted volumes (less than 1 volume was discarded per subject on average, with a maximum amount of 6 in one case). Finally, the DTI tensor was computed using a non-linear least square estimator [39] and the final parametric maps were derived. Subject tensors were registered [41] to a DWI population atlas built from 971 subjects of the HCP dataset included in TORTOISE [42]. The DWI population atlas included JHU-inspired Regions Of Interest (ROIs) placed in the center of the main fiber bundles that were used to sample the FA and MD maps.
In summary, the following measures were extracted for each subject from MR images to characterize the whole brain: thickness of 360 cortical regions, volume of 40 brain structures, FA and MD values of 48 regions in the middle of the main fiber bundles.
Multivariate analysis
The large number of features we extracted from the MRI data is essentially multivariate as all the different brain structures are structurally and/or functionally connected. As a consequence, in a classic univariate approach a stringent correction for multiple comparisons must be employed to account for the intrinsic correlation among the different measures, resulting in a reduction of the statistical power [43], most of all in the scenario of a weak diffuse impact of the pathology [44]. We decided to implement a multivariate analysis to overcome this problem and performed a machine learning-based analysis to investigate whether DMD patients and controls can be distinguished based on their MRI-derived measures. This enabled us to verify if DMD is uniquely associated with a pattern of altered brain integrity which is independent of potential comorbidities.
MRI-derived features were corrected for age, IQ and ASD diagnosis using a linear regression model to reduce the within group error variance, thus improving the statistical power [45]. Subsequently, candidate features were selected using a two-tail T-test with a selection threshold of p < 0.05 [46]. Since the T-test was performed only to select the most relevant features, the significance threshold was not corrected for multiple comparisons. Finally, the selected features were concatenated to be used as input in the classification experiment.
The classification experiment was performed using a Support Vector Machine (SVM) with a linear kernel [47] and a penalty parameter C set to 1. SVM methods map samples into a high dimensional space where the two groups are linearly separable and identify the hyperplane that maximizes the margin between the training set samples and the classification hyperplane. We used a balanced leave-one-out cross validation procedure in the feature preparation/training/testing stages, i.e. in each cross-validation round two subjects, one DMD patient and one control subject, were randomly and independently selected and used as testing set to avoid the anticorrelation effect with the training set [48]. Classifier performances were evaluated using classification accuracy, sensitivity, specificity and the Area Under the ROC Curve (AUC). The p-value associated to each performance index was computed using a permutation test with 10,000 permutations of subject labels.
We also performed a feature analysis to investigate which MRI-derived measures are mostly involved in DMD. In linear kernel SVM classifiers, the classification hyperplane coefficients can be interpreted as feature weights, thus assessing the importance of each feature for the classification task [49]. However, classifier weights do not have a direct neurophysiological interpretation and do not indicate a direct relationship with DMD. Therefore, we transformed the linear classifier “backward model” (i.e., the trained SVM classifier) into the corresponding “forward model” (i.e. a generative model), where the weight associated with each feature could be interpreted as a measure of the impact of DMD [49].
Correlation analysis
We tested the Pearson linear correlation between the features selected in the multivariate analysis and several clinical scores (i.e., the 6MWT score, the MFM scores D1, D2, D3 and total) to investigate the possible relationship between the brain alterations and one of the main clinical outcomes of DMD. Each correlation analysis was performed independently from the others and we set the significant threshold to p < 0.05.
RESULTS
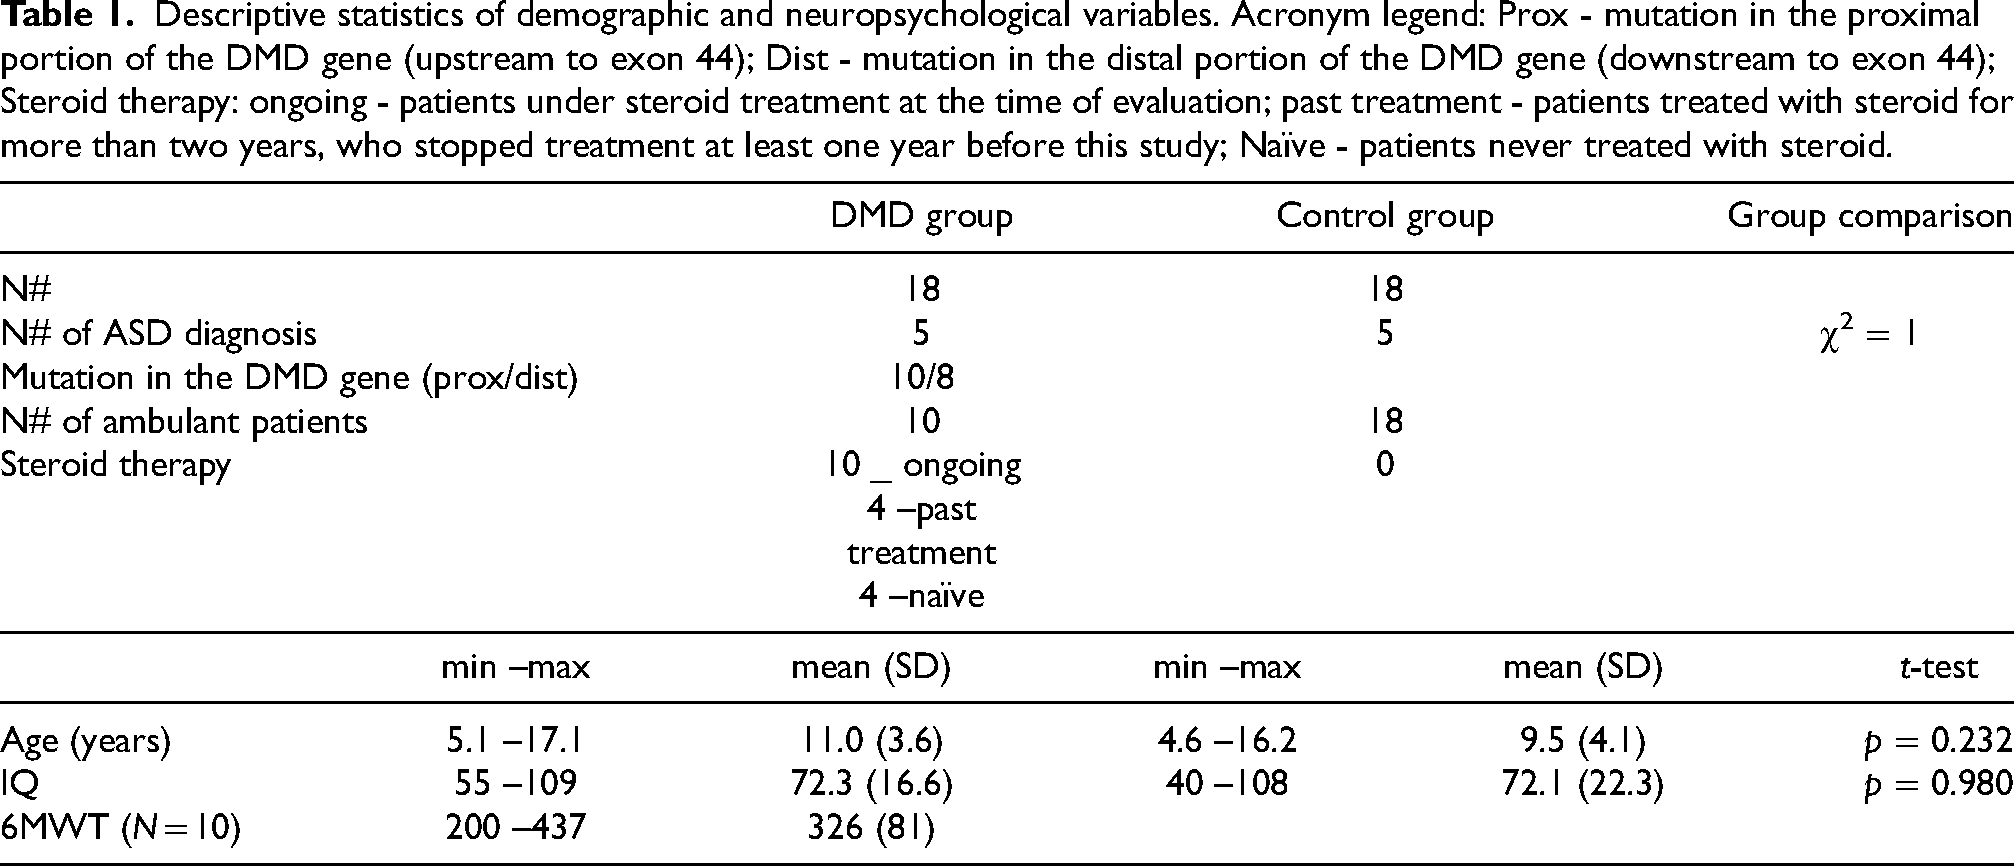
Twenty male subjects with a diagnosis of DMD were recruited, but 2 of them were excluded after the MR session owing to excessive motion artifacts. Clinical and demographic data are reported in Table 1. The clinical sample and the control did not significantly differ in terms of age, IQ and frequency of ASD diagnosis (N = 5 in both groups). In the DMD population, 5 subjects had a comorbid ASD diagnosis (4 out of 5 with IQ < 70), 7 subjects an IQ score ranging from 59 to 67 and 6 subjects an IQ score ranging from 82 to 109. Seven out of the eleven patients with an IQ score < 70 carried a mutation in the distal portion of the DMD gene. Ten out of 18 DMD patients were ambulant when the MR was performed, their “6MWT” scores are reported in Table 1. Four out of the 18 patients showed moderate respiratory dysfunction (i.e., a FVC lower than 60%), while 2 patients showed cardiac dysfunctions (i.e. a LVEF lower than 60%). The whole description of the cardiac and respiratory indexes for the patients with DMD are reported in the supplementary materials. As for therapies, 10 patients, defined as “on going”, were under steroid treatment at the time of evaluation (either prednisone 0,75 mg/kg/a day or deflazacort 09 mg/kg/a day); 4 patients, defined as “past”, had been previously treated with steroids for two or more years, but had been off therapy for at least one year at the time of evaluation; 4 patients, defined as “naïve”, never took steroids. All the DMD patients were supplemented with vitamin D.
Descriptive statistics of demographic and neuropsychological variables. Acronym legend: Prox - mutation in the proximal portion of the DMD gene (upstream to exon 44); Dist - mutation in the distal portion of the DMD gene (downstream to exon 44); Steroid therapy: ongoing - patients under steroid treatment at the time of evaluation; past treatment - patients treated with steroid for more than two years, who stopped treatment at least one year before this study; Naïve - patients never treated with steroid.
Descriptive statistics of demographic and neuropsychological variables. Acronym legend: Prox - mutation in the proximal portion of the DMD gene (upstream to exon 44); Dist - mutation in the distal portion of the DMD gene (downstream to exon 44); Steroid therapy: ongoing - patients under steroid treatment at the time of evaluation; past treatment - patients treated with steroid for more than two years, who stopped treatment at least one year before this study; Naïve - patients never treated with steroid.
In the multivariate analysis 56 out of the 448 features were selected in the preliminary selection procedure. In particular, 22 T1W-derived measures (one volume and 21 thickness measures) and 34 DTI-derived measures (29 FA and 5 MD measures) were used in the classification experiment.
In the classification experiment, the linear classifier discriminates between DMD patients and control subjects with good performance indices (accuracy = 97.2%, p = 0.0001; AUC = 99.1%, p < 0.001; sensitivity = 94.4%, p = 0.0004; specificity = 100.0%, p < 0.0001). For each index, the permutation test showed that the scores thus obtained are significantly better than those obtained from a random classifier. Overall, these results suggest that the selected features were able to discriminate between subjects with DMD and controls significantly (Table 2).
Classifier performance indices.
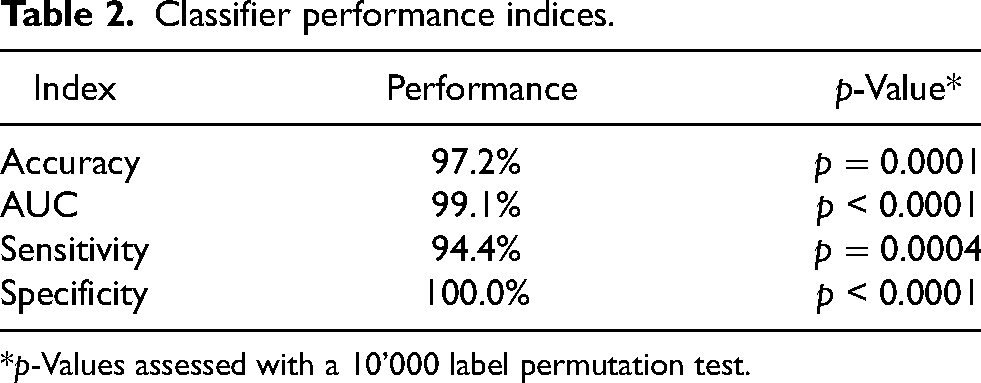
*p-Values assessed with a 10’000 label permutation test.
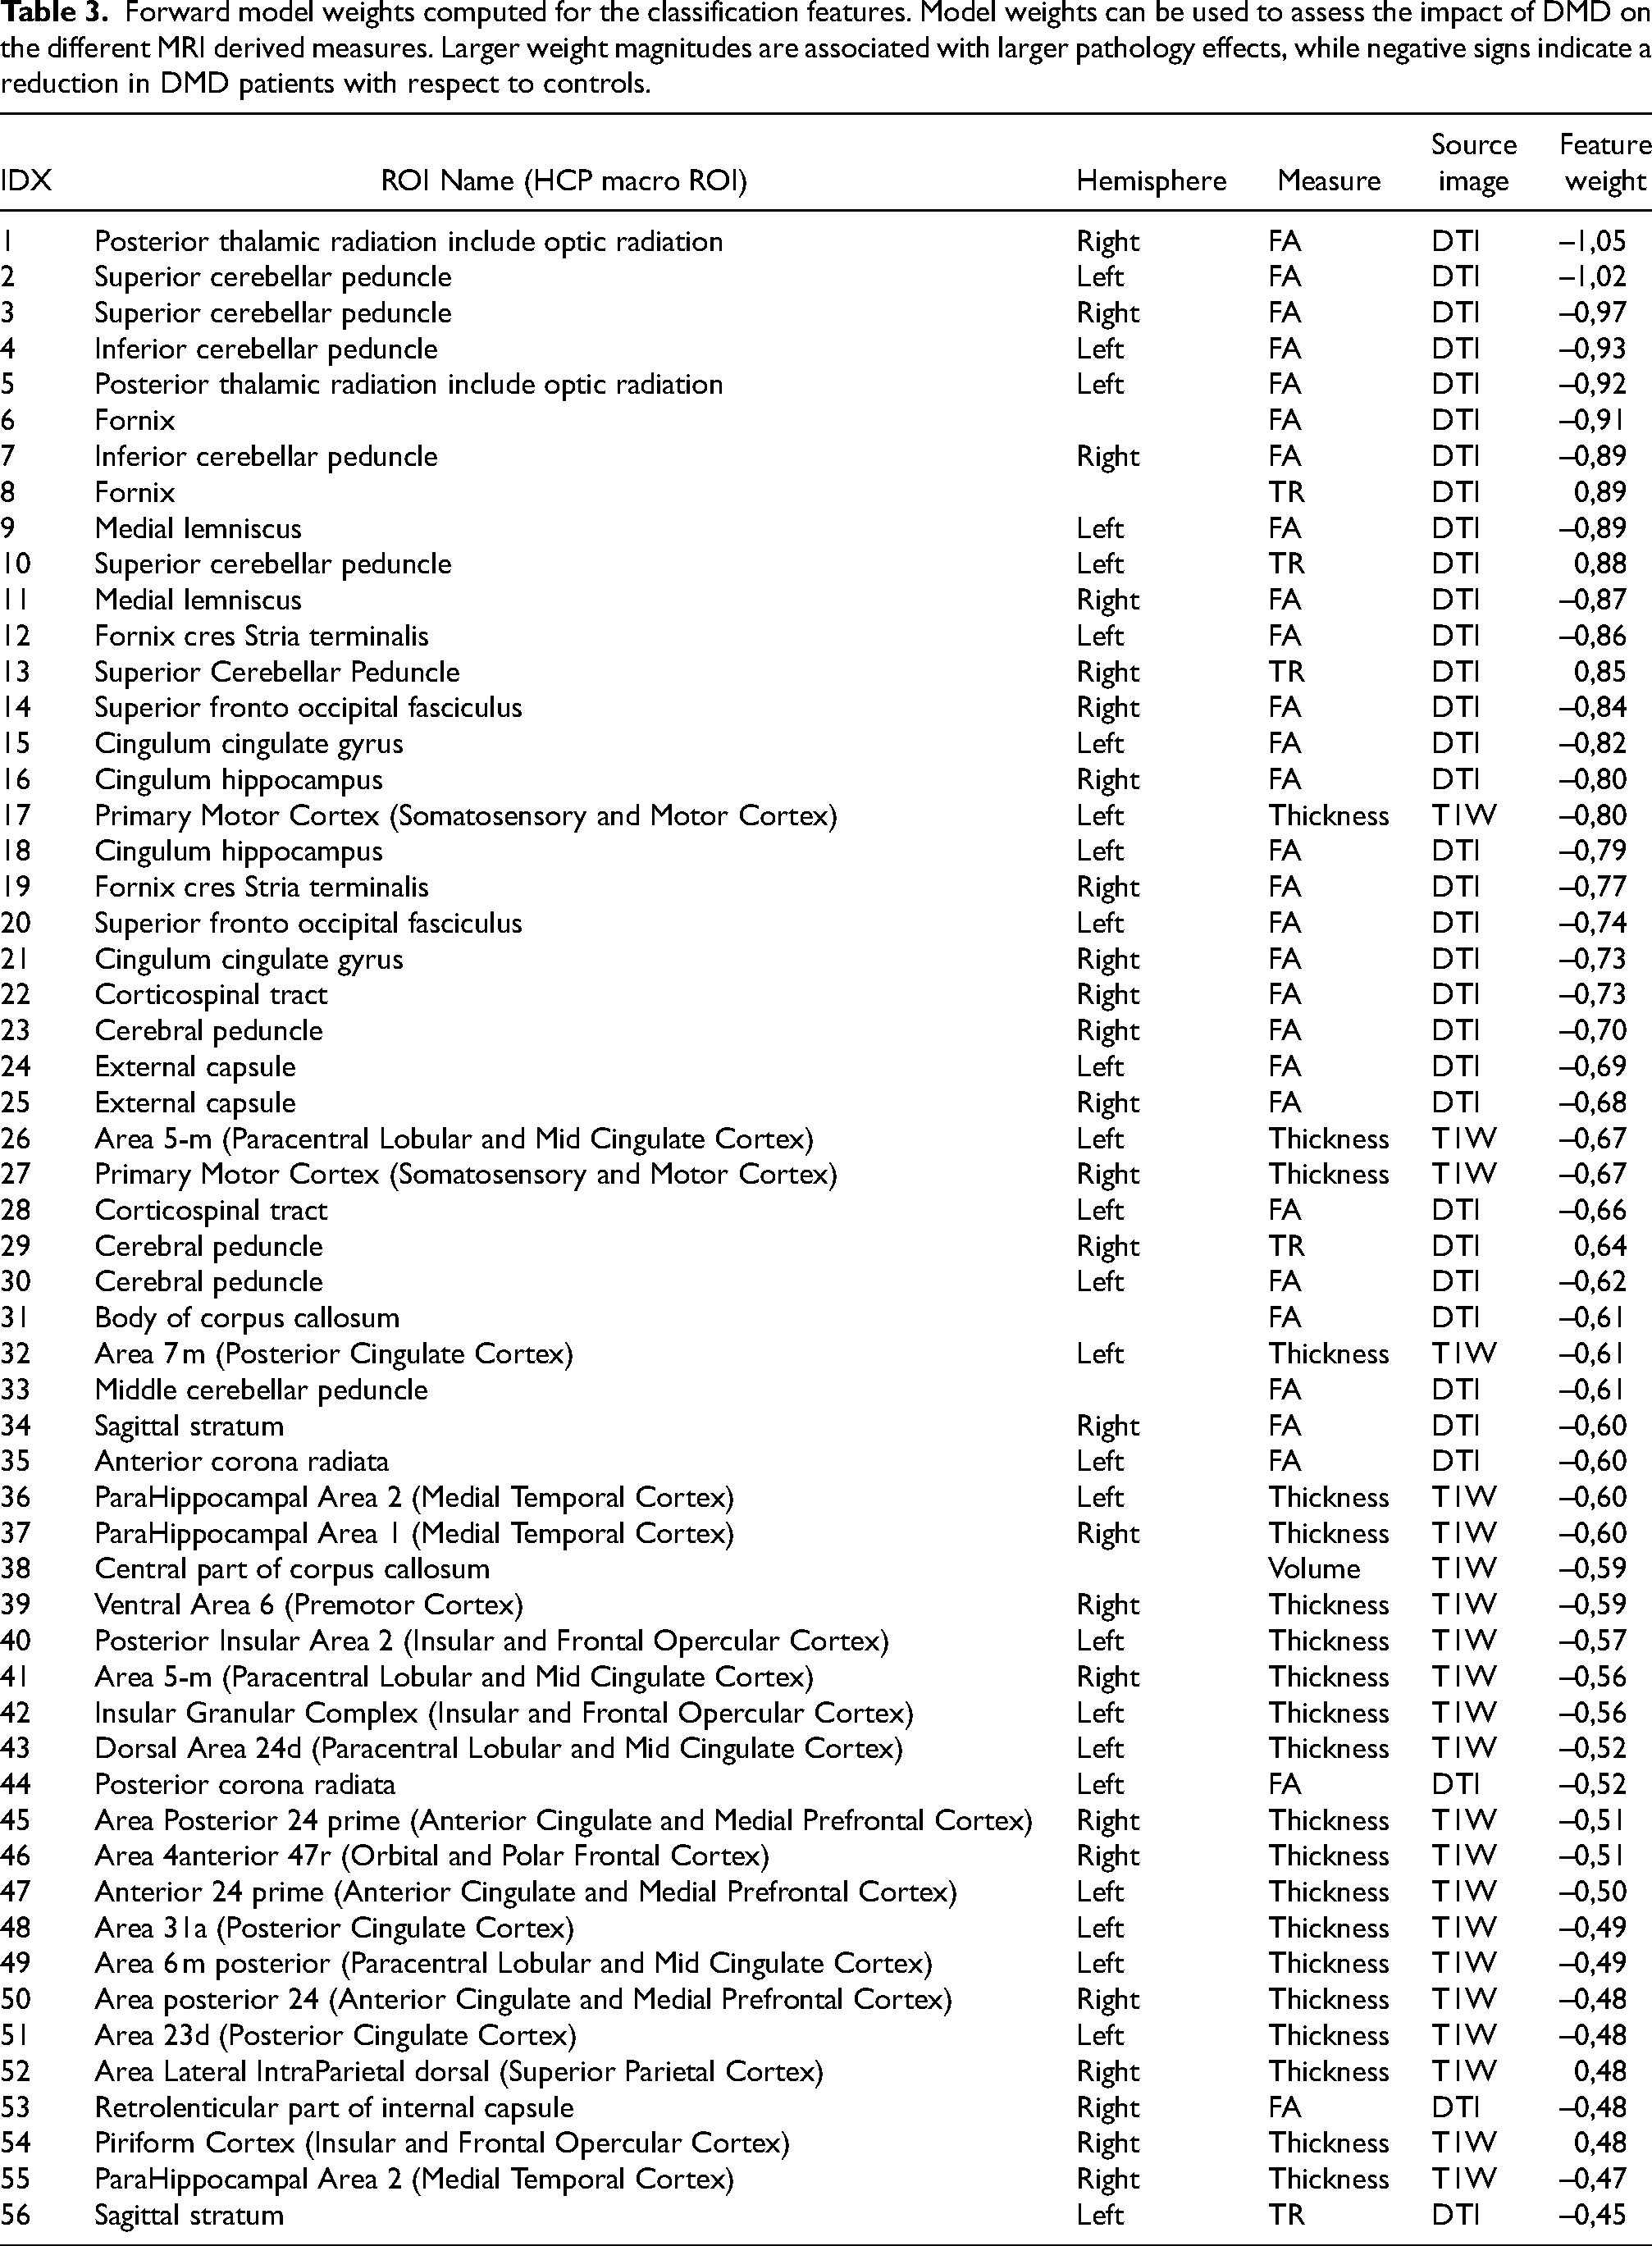
“Forward model” weights were computed to assess the impact of DMD diagnosis of on each single feature. Feature weights can be examined both comparing the magnitude and checking the sign. Larger absolute magnitudes are associated with more spoiled features, while negative weights indicate a reduction in feature values in subjects with DMD vs controls (Table 3). The ROI associated with the ten largest magnitude weights are all DTI-derived features characterizing the structural integrity of the WM. In particular, these features are located in the posterior thalamic radiation (bilaterally), in the cerebellar peduncle (bilaterally superior and inferior), in the fornix and in the medial lemniscus (bilaterally) (Figure 1). Moreover, DTI-derived features showed larger weights than T1W-derived ones, indicating that DMD diagnosis has a larger impact upon DTI-derived measures compared to T1W-derived features. Furthermore, all FA measures are characterized by negative weights and MD measures are characterized by positive weights (all but one), indicating that effects of DMD diagnosis upon WM result in reduced FA and increased MD and, therefore, in axonal damage. Focusing on the T1W-derived features, 19 out of 21 thickness measures are associated with negative weights, indicating a cortical thickness reduction in DMD patients vs controls.
Forward model weights computed for the classification features. Model weights can be used to assess the impact of DMD on the different MRI derived measures. Larger weight magnitudes are associated with larger pathology effects, while negative signs indicate a reduction in DMD patients with respect to controls.
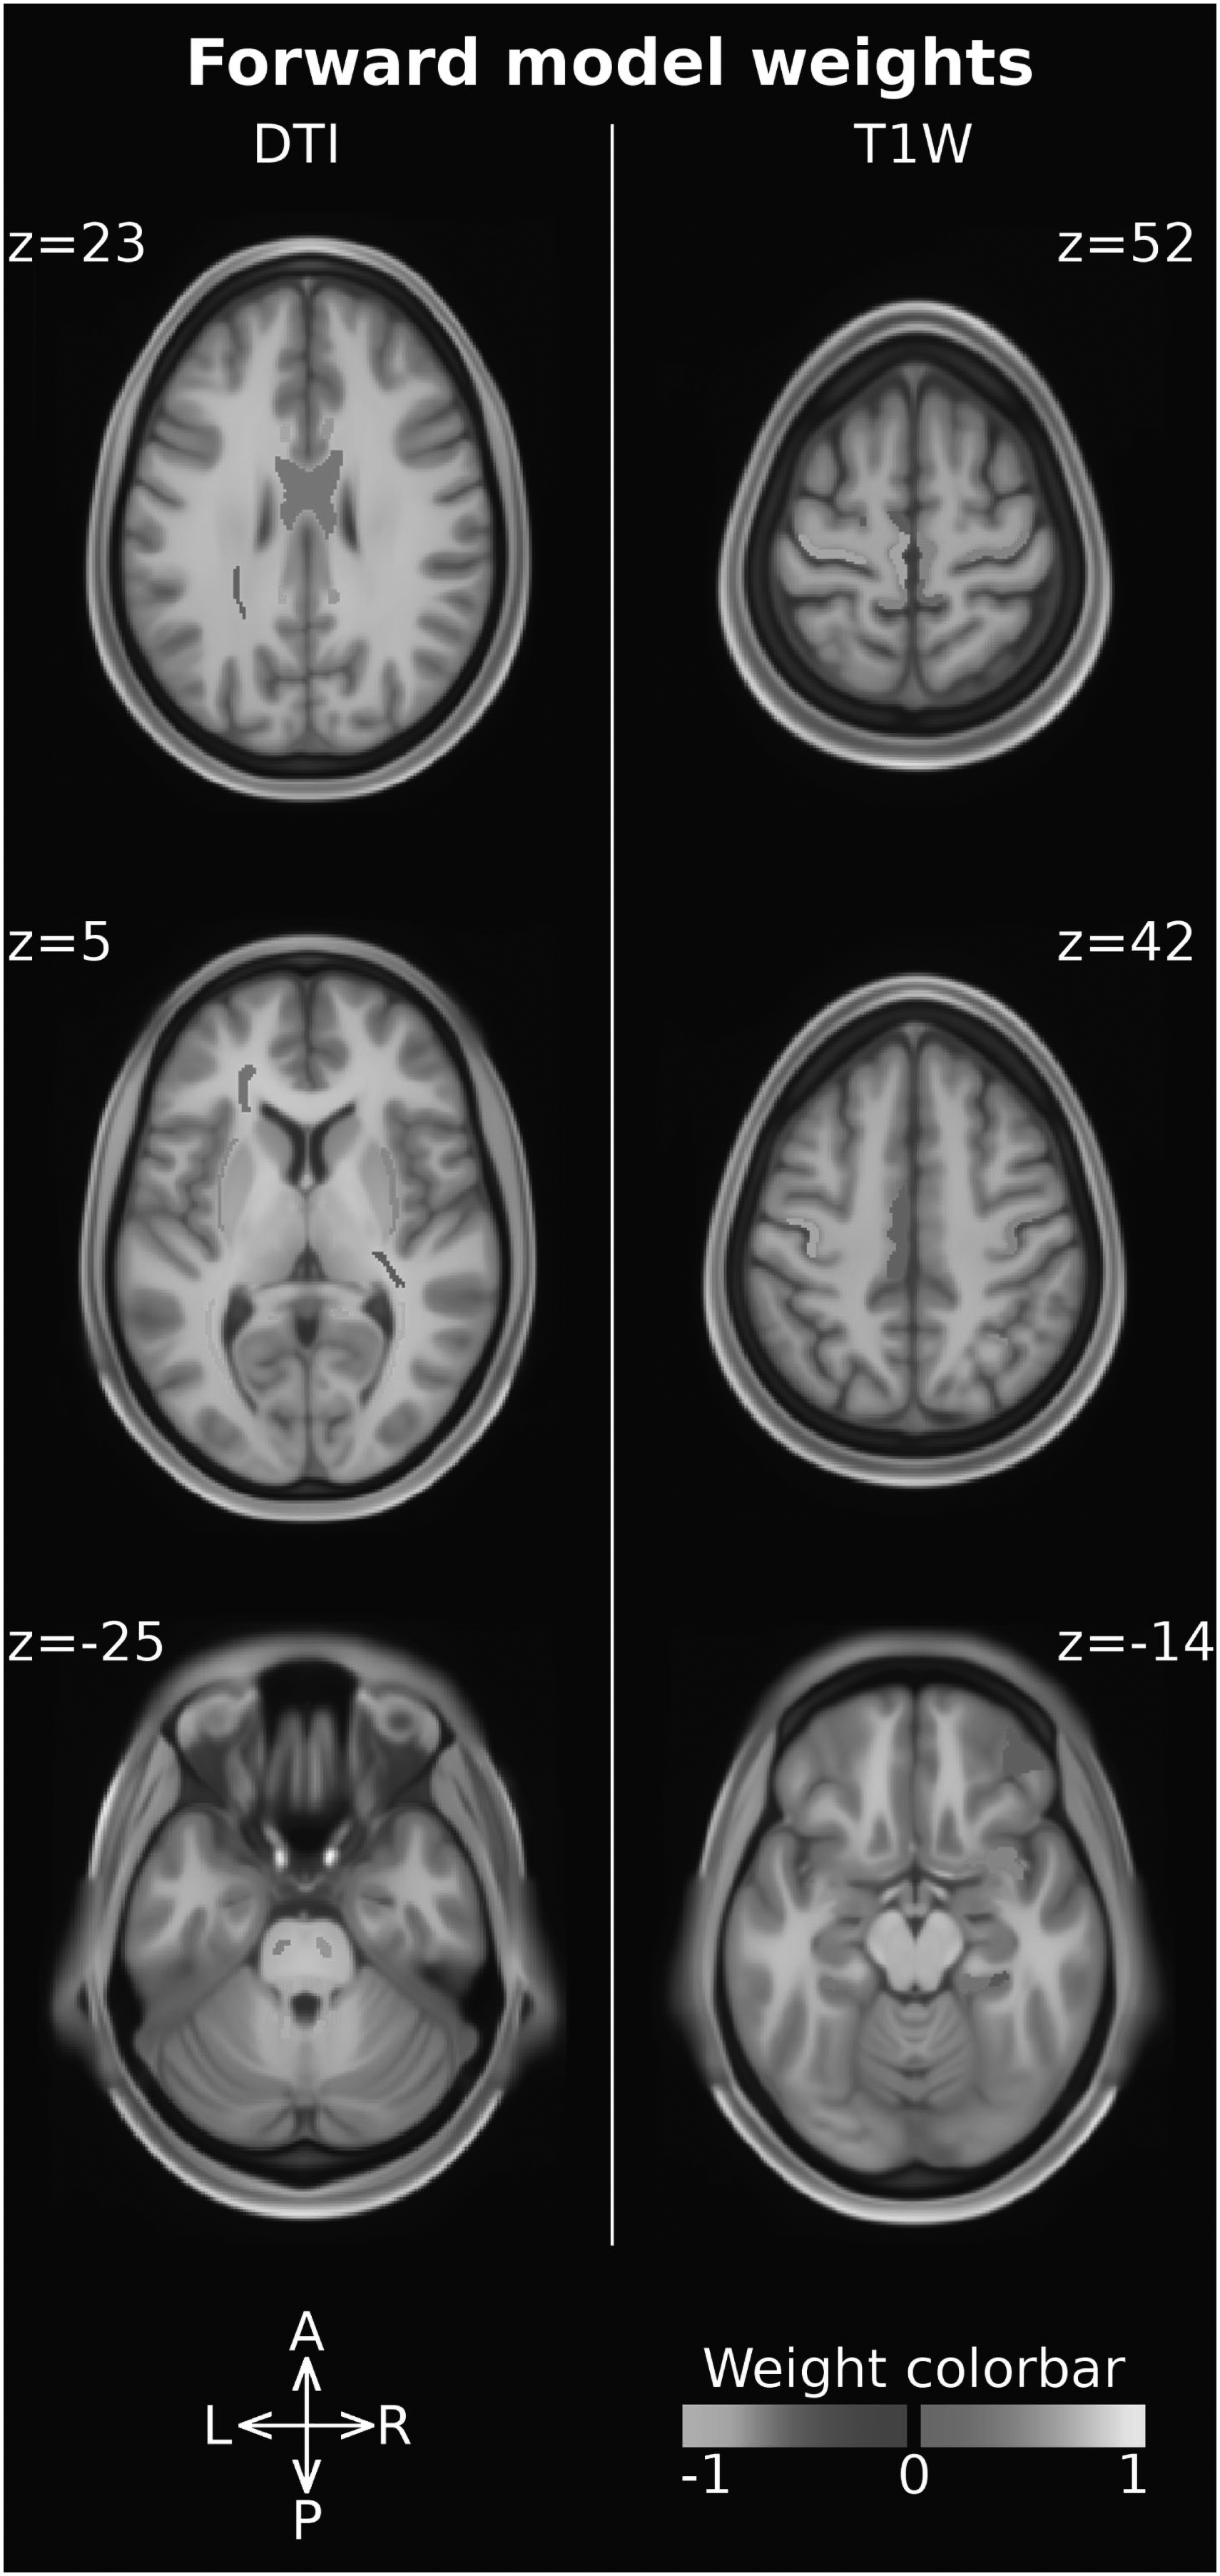
Forward model weights associated with the ROI measures. DTI-derived features (i.e. FA, MD) are reported on the left, while T1W-derived ones (i.e. cortical thickness, volume) are reported on the right. The ROI intensity and color-code are used to report the weight magnitude and sign, respectively.
Five out of the 56 features used in the classification experiment showed a significant correlation with the 6MWT score and are reported in Figure 2. All of them report a negative correlation between the 6MWT score and the FA measured in the superior fronto-occipital fasciculus (bilaterally), in the cerebral peduncle (bilaterally), and in the right sagittal stratum. The strongest correlations are observed in the cerebral peduncle, with a R2 of 0.9 and 0.6 in the left and in the right regions, respectively. The other correlation analyses with the clinical variables were not significant.
To the best of our knowledge, this is the first study applying a machine learning-based method to perform an integrated multimodal analysis of the impact of DMD on the CNS. We explored the possible presence of brain abnormalities specifically associated with DMD, accounting for the presence of comorbid conditions, such as intellectual disability or ASD diagnosis.
Our study population is composed by male subjects with DMD, cognitive and behavioral difficulties (mean IQ level 72.3±16.6, 5 subjects with ASD) and is comparable to DMD groups described by several authors in terms of number of DMD subjects and heterogeneous clinical profile [9, 50]. Most previous studies focused on genotype and cognitive/behavioral phenotype relationship, underlying the correlation between deletion in the distal portion (downstream to exon 45) of the dystrophin gene and cognitive impairment [8, 24]. Attempts to clarify the role played by dystrophin in the brain have so far started from the evaluation of patients with cognitive or behavioral difficulties, or from comparisons between patients with vs without cognitive impairment, but these approaches did not allow (us) to understand its direct role in the brain. Our control population does not only include healthy subjects but also patients with cognitive impairments and/or diagnosis of ASD (mean IQ level 72.1±22.3; 5 patients with ASD). Thus, the clinical and control groups are comparable in terms of cognitive and behavioral profiles. Our approach was not limited to a comparison of cognitive and behavioral profiles, but also included comorbidities as confounding factors in the analysis to better isolate differences directly related to the DMD diagnosis.
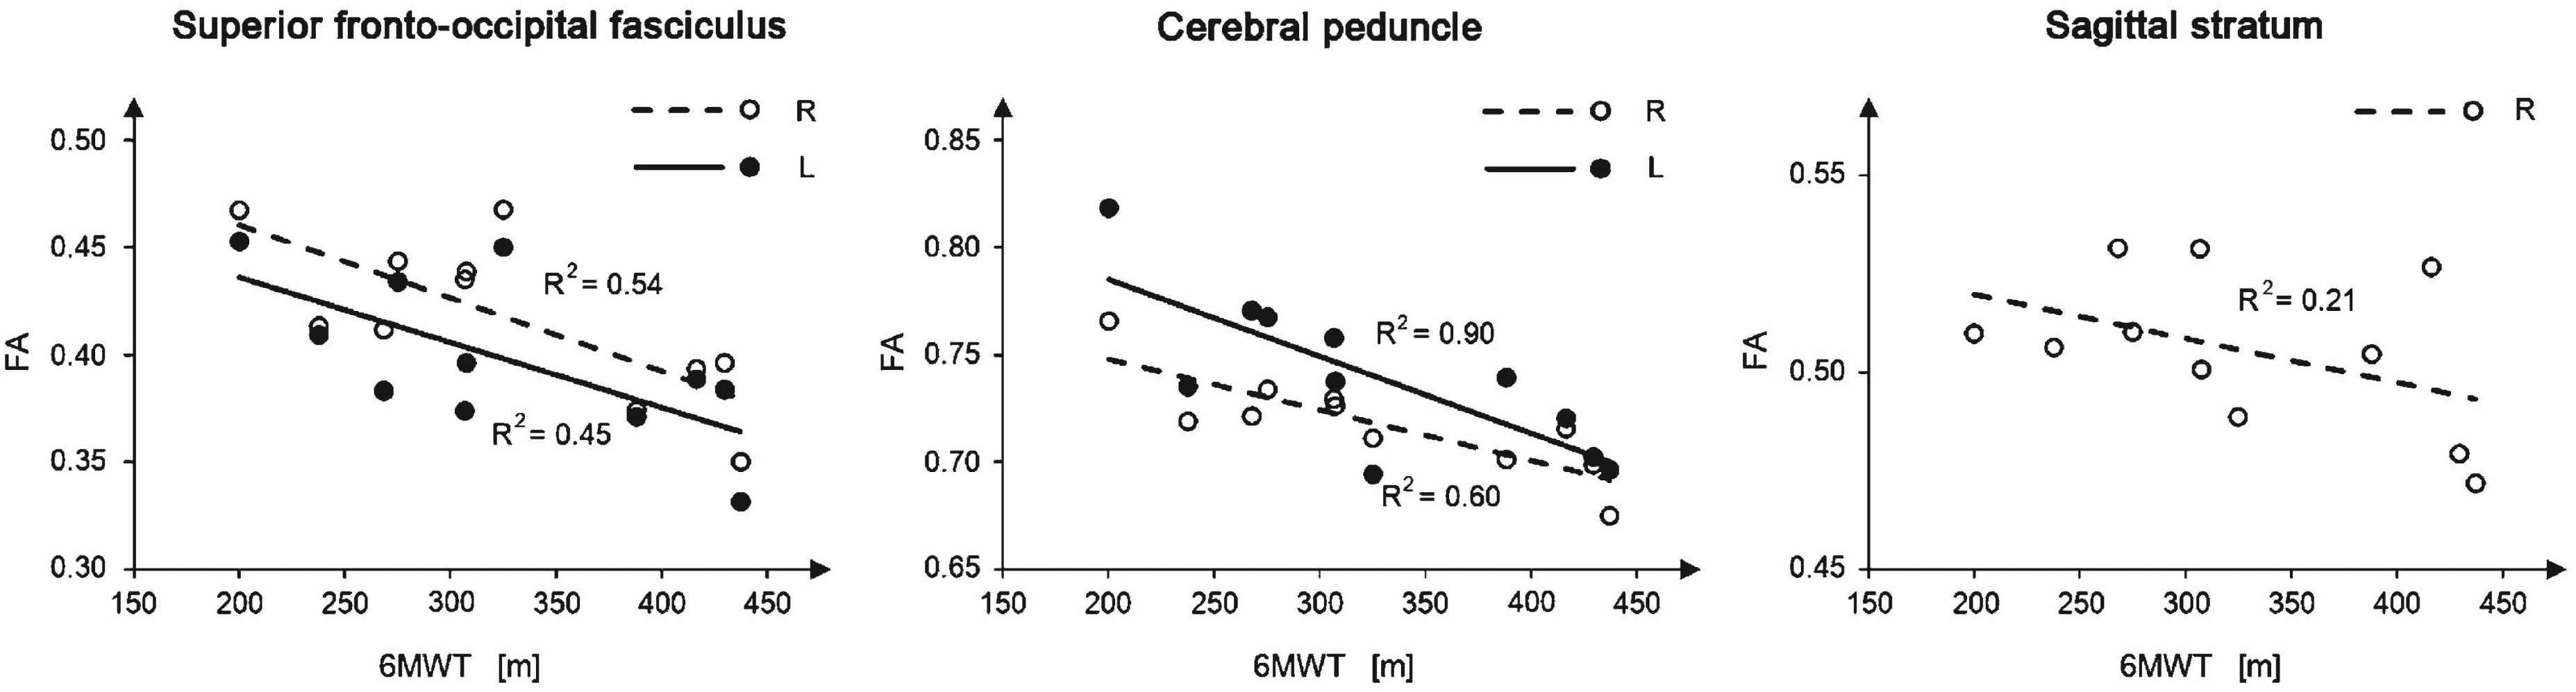
Linear regression of the ROI measures that significantly correlate with the 6MWT score. White/black circles represent the single subject samples, while the continuous/dashed lines represent the linear regression line. Only ambulant patients with DMD were used in this analysis. Significant bilateral correlations were reported in the same panel for visualization purposes, even if they were computed independently from each other.
The classification accuracy in our experiment was significantly larger than those associated from a random classifier, which suggests a direct relationship between the DMD diagnosis, thus the lack of dystrophin, and the pattern of altered measures identified in the patients’ CNS. As similar confounding factors and comorbidities are present in both groups (i.e., DMD vs controls), we can speculate that the identified alterations are specifically associated to DMD diagnosis.
Similarly to our study, [16] combined both structural T1 W and DTI images and reported significant alterations in the GM and WM of subjects with DMD vs controls. Differently from our study, Doorenweed and colleagues performed independent analyses and did not investigate any relationship between DTI and T1 W images. Our single integrated analysis and post-hoc weight analysis suggests a greater involvement of WM vs cortical GM in the lack of dystrophin.
Our analysis of the feature weights highlighted a significant axonal damage in several WM fiber bundles (posterior thalamic radiation, cerebellar peduncles, fornix, medial lemniscus), characterized mainly by reduced FA and increased MD. Other studies reported similar results [15, 22], even though they showed a more widespread impact of the condition on the WM. This may be due to differences in the control groups and analysis methods. Inclusion of ASD and lower IQ subjects in the control group increases measure variability and their overlap with those derived from DMD patients, thus reducing the probability of finding significant differences. Moreover, the machine learning approach aimed to identify few alterations representing a signature of DMD rather than a comprehensive inventory of all differences between the two groups. Among the WM fibers identified in our analysis, those related to the cerebellum (i.e., the peduncles) showed high weights, suggesting a large DMD-related alteration. Cerebellum involvement in DMD was suggested also in previous studies based on clinical phenotype rather than on imaging techniques [51–53], even when only DMD patients without cognitive impairment were considered [53].
Consistently with other studies, we also reported reduced cortical thickness, mainly in the motor cortex, cingulate cortex, hippocampal area and insula. In the first studies with TC, imaging data revealed slight cerebral and cortical atrophy in subjects with DMD and low IQ and in the subjects with DMD and normal IQ [15, 54]. Lower total brain and gray matter volumes in subjects with DMD compared to age-matched healthy controls were also reported in [16].
We only focused on structural alterations associated with DMD, however previous studies demonstrated an involvement of metabolic and/or functional alterations, too [17–19]. These studies show an interesting overlap with our results, suggesting that regions involved in the DMD cerebral phenotype are characterized not only by structural, but also by metabolic and/or functional alterations. Behavioral disturbances have been also identified among the side effects of daily treatment either with prednisone or with deflazacort [55]; several researches underline the risk of cognitive and behavioral disturbances [56–58], also associated with structural alterations in children and teenagers treated with steroids [59, 60]. A detailed analysis of 196 of the young DMD steroid naive patients (mean age 5.8 years), just before the recruitment in the study from Guglieri [55] showed the presence of speech delay, learning difficulties, inattentive overactive and oppositional defiant behavior, autism spectrum disorders and psychosocial adjustment challenges [61]. In consideration of the neurodevelopment problems emerging from our study (ASD and MR), these should not be influenced from the steroid therapy that is anyhow equally distributed between patients treated with steroid at the time of evaluation (10 patients) and those treated in the past or steroid-naive (8 patients). Furthermore, we performed a post-hoc analysis on the relevant features selected for the classification experiment finding no significant impact of the steroid therapy on our data (see supplementary material).
Our study presents with some limitations. Despite it being similar to other studies [9, 50], our sample size is still relatively small and may have affected classification performances and model generalizability [62]. To mitigate this and avoid overfitting, we used a simple classification model, i.e. a linear kernel SVM without tuning the penalty parameter C. The feature selection procedure can also affect both classification performances and the subsequent forward model weight analysis, as some features may have been excluded even if somehow affected. Our database and analysis methods were however good enough to identify some MRI-derived markers of structural brain abnormalities associated with DMD, even if replication studies are necessary to confirm our findings. Finally, we considered only a small set of DMD comorbidity factors, i.e., mental retardation and ASD, with a small number of subjects. Both mental retardation and ASD are heterogeneous conditions that cannot be fully characterized with such small numbers. However, it is worth mentioning that we did not claim to investigate mental retardation and/or ASD, our aim was to provide a tool to account for their presence while investigating the main effect of DMD. It is reasonable to expect that a larger sample size would allow describing further comorbidities and/or significant clinical factors, as well as increasing the sensitivity and specificity of the analysis.
In conclusion, we suggest that the multivariate analysis and inclusion of comorbidities both in the control group and in the analysis allow the identification of a small pattern of alterations in the CNS likely associated with the DMD diagnosis. In particular, dystrophin deficiency seems to directly affect the microstructural integrity of long fiber bundles that can be caused by an abnormal expression of dystrophin. In our opinion, our findings support the advantages of the proposed approach in identifying DMD outcomes and providing a shortlist of regions and measures for deeper consideration to further investigate the role of dystrophin in the brain.
Footnotes
Acknowledgments
This work was partially supported by grants from the Italian Ministry of Health to Denis Peruzzo (“Ricerca corrente” grant)
ORCID iDs
Conflict of interest
The authors have no conflict of interest to report.
Data availability
The data supporting the findings of this study are available on request to the corresponding author.