
Abstract
Background:
Myotonic Dystrophies type 1 and type 2 are hereditary myopathies with dystrophic muscle degeneration in varying degrees. Differences in muscle diffusion between both diseases have not been evaluated yet.
Objective:
To evaluate the ability of muscle diffusion tensor imaging (mDTI) and Dixon fat-quantification to distinguish between Myotonic Dystrophy (DM) type 1 and type 2 and if both diseases show distinct muscle involvement patterns.
Methods:
We evaluated 6 thigh and 7 calf muscles (both legs) of 10 DM 1, 13 DM 2 and 28 healthy controls (HC) with diffusion tensor imaging, T1w and mDixonquant sequences in a 3T MRI scanner. The quantitative mDTI-values axial diffusivity (λ1), mean diffusivity (MD), radial diffusivity (RD) and fractional anisotropy (FA) as well as fat-fraction were analysed. CTG-triplet repeat-length of DM 1 patients was correlated with diffusion metrics and fat-fraction.
Results:
mDTI showed significant differences between DM 1 and DM 2 vs. healthy controls in diffusion parameters of the thigh (all p < 0.001) except for FA (p = 0.0521 / 0.8337). In calf muscles mDTI showed significant differences between DM 1 and DM 2 patients (all p < 0.0001) as well as between DM 1 patients and controls (all p = 0.0001). Thigh muscles had a significant higher fat-fraction in both groups vs. controls (p < 0.05). There was no correlation of CTG triplet length with mDTI values and fat-fraction.
Discussion:
mDTI reveals specific changes of the diffusion parameters and fat-fraction in muscles of DM 1 and DM 2 patients. Thus, the quantitative MRI methods presented in this study provide a powerful tool in differential diagnosis and follow-up of DM 1 and DM 2, however, the data must be validated in larger studies.
Keywords
INTRODUCTION
Myotonic Dystrophies (DM) are multisystem disorders that affect the skeletal muscles, the cardiac system and visual system and lead to cognitive dysfunction. Currently there are two distinct forms of Myotonic Dystrophies - type 1 and type 2. Type 1 (DM 1) is caused by a CTG triplet repeat expansion in the DMPK (dystrophia myotonica protein kinase) gene, with a correlation of the repetition of triplets and clinical pathology. This type is characterized by predominant distal muscle weakness, facies myopathica, cardiac arrhythmias, early bilateral cataract and myotonic discharges in electromyographic studies [1]. The cause of type 2 (DM 2) is a CCTG repeat expansion in the ZNF9 gene that encodes for the zinc finger nucleic acid binding protein. The phenotype is milder than in DM 1 and usually develops later in life with proximal muscle weakness, bilateral cataract and without cognitive dysfunction [2].
The clinical management of both diseases is symptomatic with focus on physiotherapy, oral medication (Mexiletin) for myotonic muscle symptoms and screening for cardiac arrythmias and visual decline due to cataracts.
Recently, some new therapeutic strategies are emerging, such as small molecule therapies to modulate RNA expression, inhibition of triplet-repeat transcription or genome editing [1].
To monitor individual disease progression and to allow a quantitative assessment of muscle degeneration in clinical trials, objective outcome parameters are essential.
Recently a study by Heskamp et al. on quantitative muscle MRI imaging in DM 1 patients could show, that patient muscles have a higher fat-fraction, a lower muscle volume and an increased T2w signal indicating muscle edema [3].
They could also show that triplet repeat length positively correlated with fat-fraction.
Muscle diffusion tensor imaging (mDTI) can quantify the directional diffusion properties of water molecules in muscle tissue and provide information about muscular microstructure and integrity [4–6]. It is assumed, that mDTI unravels differences prior to fatty infiltration and may therefore be used as a predictive marker and might be more sensitive to subtle preclinical changes than the fat-fraction alone.
mDTI has already shown disease specific patterns of altered muscle architecture (for various myopathies) and identifies changes of subtle (subclinical) progression e.g. in hamstring muscles after long-distance running or in Pompe disease [5, 7–9]. mDTI is thought to be of complementary value to T2 mapping and Dixon fat quantification [7, 10–12].
In Myotonic Dystrophies mDTI has not yet been evaluated regarding its ability to show disease-specific muscle diffusion alterations. Thus, the aim of this pilot- study was: To evaluate the ability of quantitative MRI to show differences in diffusion metrics and fat fraction in the upper and lower leg muscles of Myotonic Dystrophy patients between DM 1, DM 2 and controls. To evaluate if differences in mDTI values between DM 1 and DM 2 allow to identify a disease specific pattern of muscle diffusion alteration. To compare CTG triplet expansion of DM 1 patients with mDTI values To compare muscle fat-fraction of DM 1 and DM 2 to healthy controls
MATERIAL AND METHODS
Study design
This prospective study had been approved by the local ethics committee of the Ruhr-University Bochum (No. 15-5281) and written informed consent was obtained from all participants prior to enrollment.
Ten patients with Myotonic Dystrophy type 1 (DM 1), thirteen patients with Myotonic Dystrophy type 2 (DM 2), and 28 healthy controls participated in this study.
Inclusion criteria for DM 1 and DM 2 cohort was a genetically proven Myotonic Dystrophy. Exclusion criteria were defined as contraindications for MR-examination and other neuromuscular diseases (e.g., polyneuropathies, myasthenia gravis, other dystrophic myopathies) as observed by patient history and clinical examination.
Clinical evaluation
Each extremity was tested for strength based on the Medical Research Council (MRC) grading scale by a clinical neurologist. The following movements were tested for each leg individually: hip flexion, hip extension, knee flexion, knee extension, ankle dorsiflexion and ankle plantar flexion. The MRC mean value for both legs combined is presented as “muscle strength” in Table 2.
MRI protocol
MRI was performed using a 3T MRI (Achieva 3T X, Philips Medical Systems) and a 16-channel large Torso coil (Philips TorsoXL). The thigh region from hip to knee was split into three fields of view (FOV) of 480×264×150 mm3 along the z-axis (stacks) to avoid shimming artifacts occurring due to large FOV. The stacks had a 10 mm overlap to allow accurate merging. The MRI acquisition protocol for each FOV comprised T1-weighted (T1w), T2-weighted (T2w), diffusion weighted imaging (DWI, Δ / δ=27.3 / 7.7 ms) including one noise measurement (by turning off the RF and imaging gradients), with a total acquisition time of approximately 27 minutes for both thighs (9 min per FOV) [9, 14]. In all patients and 14 healthy controls, an additional Dixon fat-quantification sequence [15] (mDixonquant by Philips) was acquired. After the image acquisition of the thigh-regions the data acquisition was paused, and the coil was wrapped around the lower leg region; scanning continued afterwards. The lower leg region was split into two FOVs with the same imaging protocol as used for thighs with a total acquisition time of approximately 18 minutes for both lower legs (9 min per FOV). See Table 1 for acquisition details.
Acquisition details for the acquisition in each stack. TSE: Turbo Spin Echo, SE-EPI: Spin Echo-EPI
Data processing
Data was pre-processed using QMRITools (github.com/mfroeling/QMRITools running under Mathematica 11). Data preprocessing was performed akin to Schlaffke et al. [14]. In short, the T1w and T2w data of the individual stacks were corrected for motion between the stacks using rigid registration of the overlapping slices. Diffusion data were denoised using a principal component analysis method [16].
Next, the diffusion data was corrected for subject motion and eddy current distortions using affine registration and aligned to T2-data using non-rigid registration. Finally, the aligned and corrected T1w, T2w and DWI data were fused by weighted averaging of the overlapping slices, yielding one volume covering the entire thighs and one volume covering the calves.
The diffusion tensor was estimated from the corrected and merged diffusion data using an iWLLS tensor estimation with outlier detection [17]. From the tensor the three eigenvectors ν1–3 and their scalar, the eigenvalues λ1-λ3 were calculated for each voxel. FA and MD were calculated based on the three eigenvalues.
The mDixonquant sequence allows the online reconstruction of fat-fraction maps directly on the MR Host Computer. The signal-to-noise SNR was calculated as mean DWI / Noise SD [18]. The SNR values for every muscle are reported in Supplemental Table S1.
Muscle segmentation
In total six thigh and seven calf muscles were manually segmented over the entire scanned volume. Thigh: vastus lateralis muscle (VL), vastus medialis muscle (VM), rectus femoris muscle (RF), biceps femoris muscle (long and short head) (BF), semimembranosus muscle (SM), semitendinosus muscle (ST); calf: extensor digitorum longus (EDL), gastrocnemius lateralis (LGM) and medialis (MGM), soleus muscle (SOL), peroneus muscles (peroneus longus and brevis) (PER), tibialis anterior (AT) and posterior (PT).
Manual segmentation of all muscles was done based on the T1w images by drawing ROIs (regions of interest) on every slice of the T1 weighted data set to generate muscle specific masks according to Schlaffke et al. [19]. This was done by a single examiner. The resulting masks were subsequently eroded by one voxel to avoid including fascia tissue and minimizing partial volume effect with neighboring muscles. The masks derived, were superimposed on mDixonquant fat-fraction maps (if available) to obtain muscle specific fat-fractions. The masks were also superimposed on the DTI dataset to obtain muscle specific DTI parameters. Whole thigh fat-fraction data were calculated as the mean of the average fat-fraction of the individual muscles.
The quality of fat-suppression of the DWI data was graded with a visual inspection and semiquantitative grading system. The visual grading system was applied as follows:
0 = no artifacts in fat-suppression;
1 = signal changes in fat suppression affecting the subcutaneous fat but not the adjacent muscles with homogenous appearance in both legs;
2 = same as 1 but additionally inhomogeneous fat-suppression in both legs;
3 = same as 2 but additionally fat-suppression artifacts that affect the calf and thigh muscles;
The mean quality of fat-suppression was very good and between an average of 0.2–0.7 according to our rating scale. Please see Table S2 for detailed data.
Statistical analyses
Available fat-fractions were compared between Myotonic Dystrophy (1 + 2) patients and healthy controls in a general linear model with patient/control and muscle (both sides left/right combined) as fixed factors for thigh muscles.
The mDTI parameters λ1, MD, RD and FA were analyzed in a multivariate general linear model with patient/control and muscle as fixed factors. Group comparison was done with two-way ANOVA analysis with Tukey method for multiple comparisons and single-muscle comparison was done with multiple t-test and Holm-Sidak method for multiple comparison. Statistical analysis was performed using GraphPad Prism 6.
RESULTS
Study participants
In the DM 1 group 4 females, 6 males, mean age 45.7 yrs, range: 28–64 yrs participated. In the DM 2 group 9 females, 4 males, mean age 54.4 yrs, range: 26–73 yrs participated.
In the control cohort 14 females, 14 males, mean age 31.1 yrs, range: 21–53 yrs participated in this study. The healthy control cohort served as a control for other recent studies of our group [9, 13].
For demographic data of the Myotonic Dystrophy patients, body measures, disease duration and genetic mutation see Table 2.
Demographic data of the patient cohort. N.a.=data not assessed, f = female, m = male
Information of genetic data was not complete in DM 1 patients, since the triplet-repeat length could not be obtained for one patient. In DM 2 group genetic testing mostly described a detection of a mutation in the ZNF 9 gene with CCTG repeat expansion at the CL3N58 locus without providing the number of repeats. When repeat length was available it is reported in Table 2.
The muscle strength analysis revealed unrestrained muscle strength for all healthy controls (5/5) and an average of 4.46 for DM 1 and 4.75 for DM 2 patients (see Table 2 for details). The dixon fat-quantification (mDixonquant) was successfully acquired for the thigh muscles in 10 controls, 10 DM 1 and 12 DM 2 patients. Dixon fat quantification for the calves was unsuccessful. Due to water fat-swaps (errors in the reconstruction on the MR console) we had to exclude nearly all the calf data sets from healthy controls and Myotonic Dystrophy patients [9]. The control group showed an average fat-fraction of all thigh muscles of 5.16% (±0.8%), the DM 1 group an average fat-fraction of 14.8% (±4.9%) and the DM 2 group of 16,88% (±2.6%). See Table 3 for detailed fat-fraction data. A T1w image, as well as a fat-fraction map, an FA map and an MD map of representative DM 1 and DM 2 patients and a matched control are shown in Fig. 1.
Number of acquired fat-fraction data (N). Mean and standard deviation of fat-fraction for upper leg muscles in controls and DM 1 + DM 2 group. Muscle abbreviations: VL = vastus lateralis; VM = vastus medialis; RF = rectus femoris; SM = semimembranosus, ST = semitendinosus; BF = biceps femoris
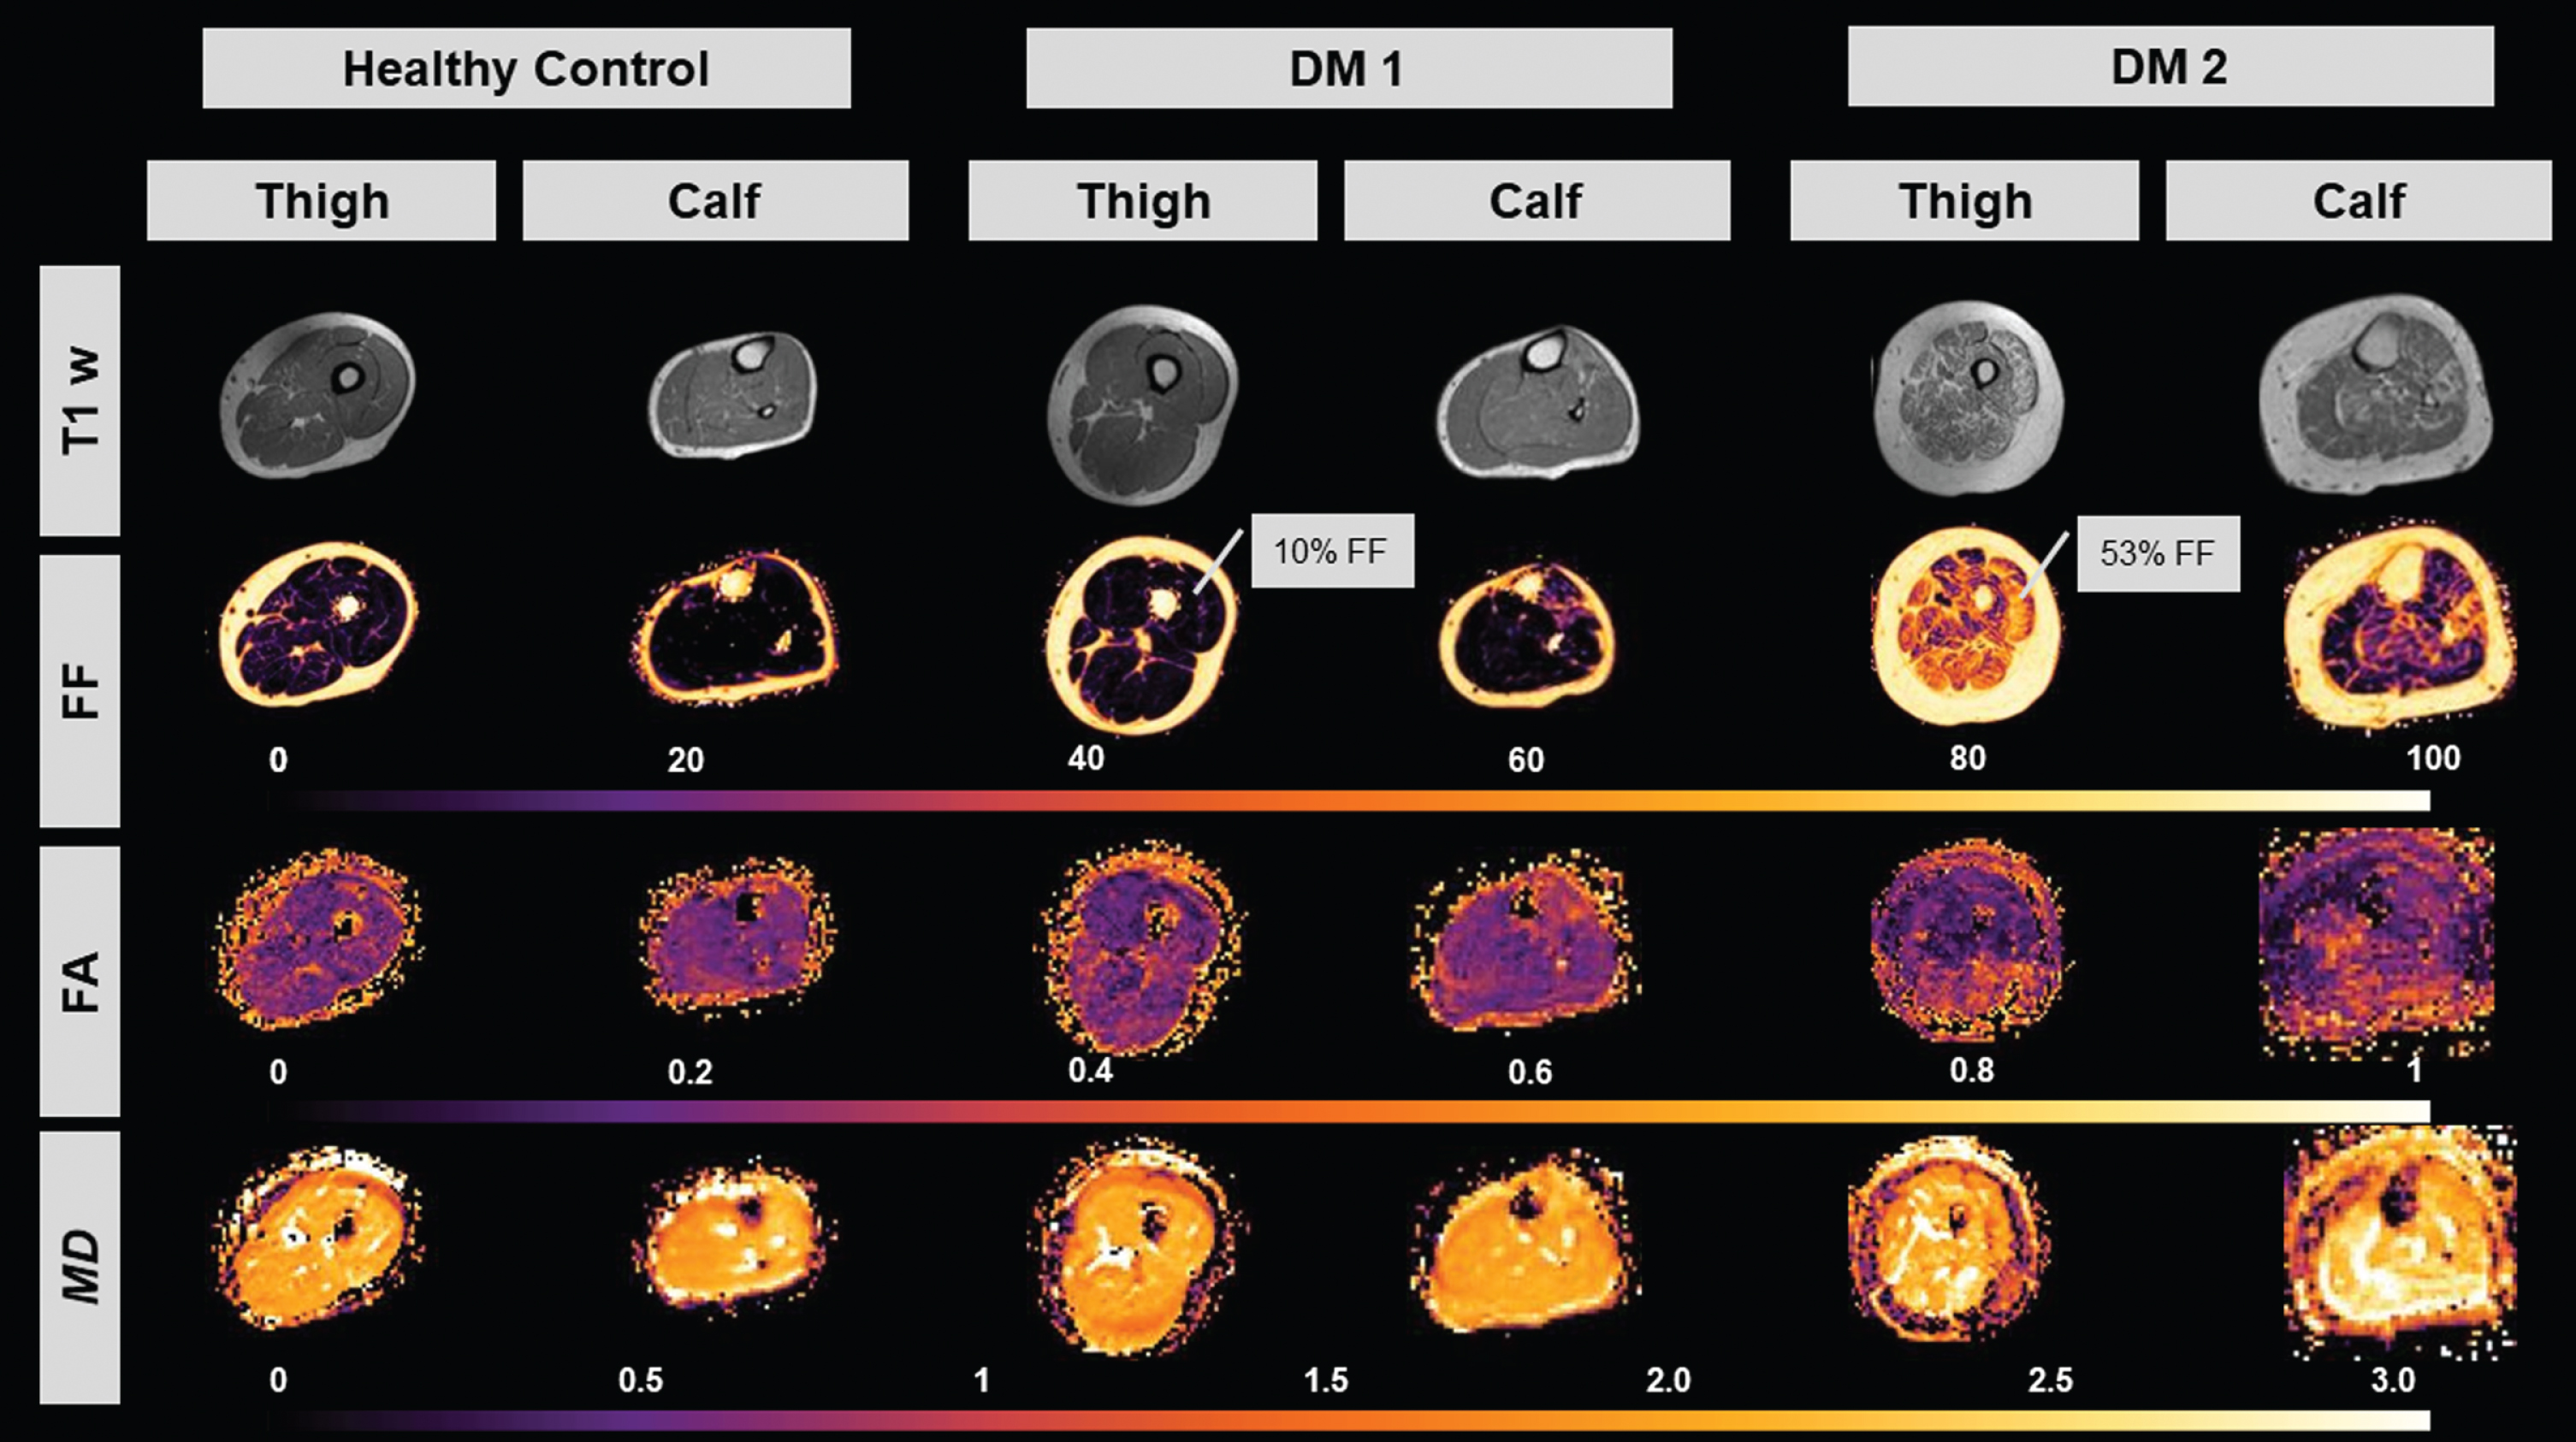
Image series of a representative healthy control, DM 1 and DM 2 patient. Top to bottom: T1w image, fat-fraction image (highlighted FF for vastus lateralis muscle), fractional anisotropy (FA) map, mean diffusivity (MD) map. Month since diagnosis were 72 for DM 1 patient and 168 for DM 2 patient.
Diffusion parameters
Thigh muscles
The results can be seen in Fig. 2 and Table 4. The Signal-to-noise ratio (SNR) was sufficiently high (>20 as suggested by Froeling et al., 2017): control 21–73, mean 40.6±12.2, MD I 31–62, mean 46.2±14.2, MD II 25–68, mean 41.5±13.8. The SNR was significantly higher in Type 1 group compared to controls (p < 0.0001) and compared to Type 2 group (p = 0.0052) There was a significant main effect of the group on all diffusion parameters between both DM groups and the control group in the thigh muscles. FA in thigh muscles was significantly different between DM 1 and DM 2 (p = 0.033). There was no significant difference neither between DM 2 and controls nor between DM 1 and controls. MD, RD and λ1 in thigh muscles were significantly different between DM 1 as well as DM 2 and controls (all p < 0.0001). There was no significant difference between DM 1 and DM 2 for MD (p = 0.844), RD (p = 0.429) or λ1 (p = 0.638) (see Fig. 2, see Table 4).
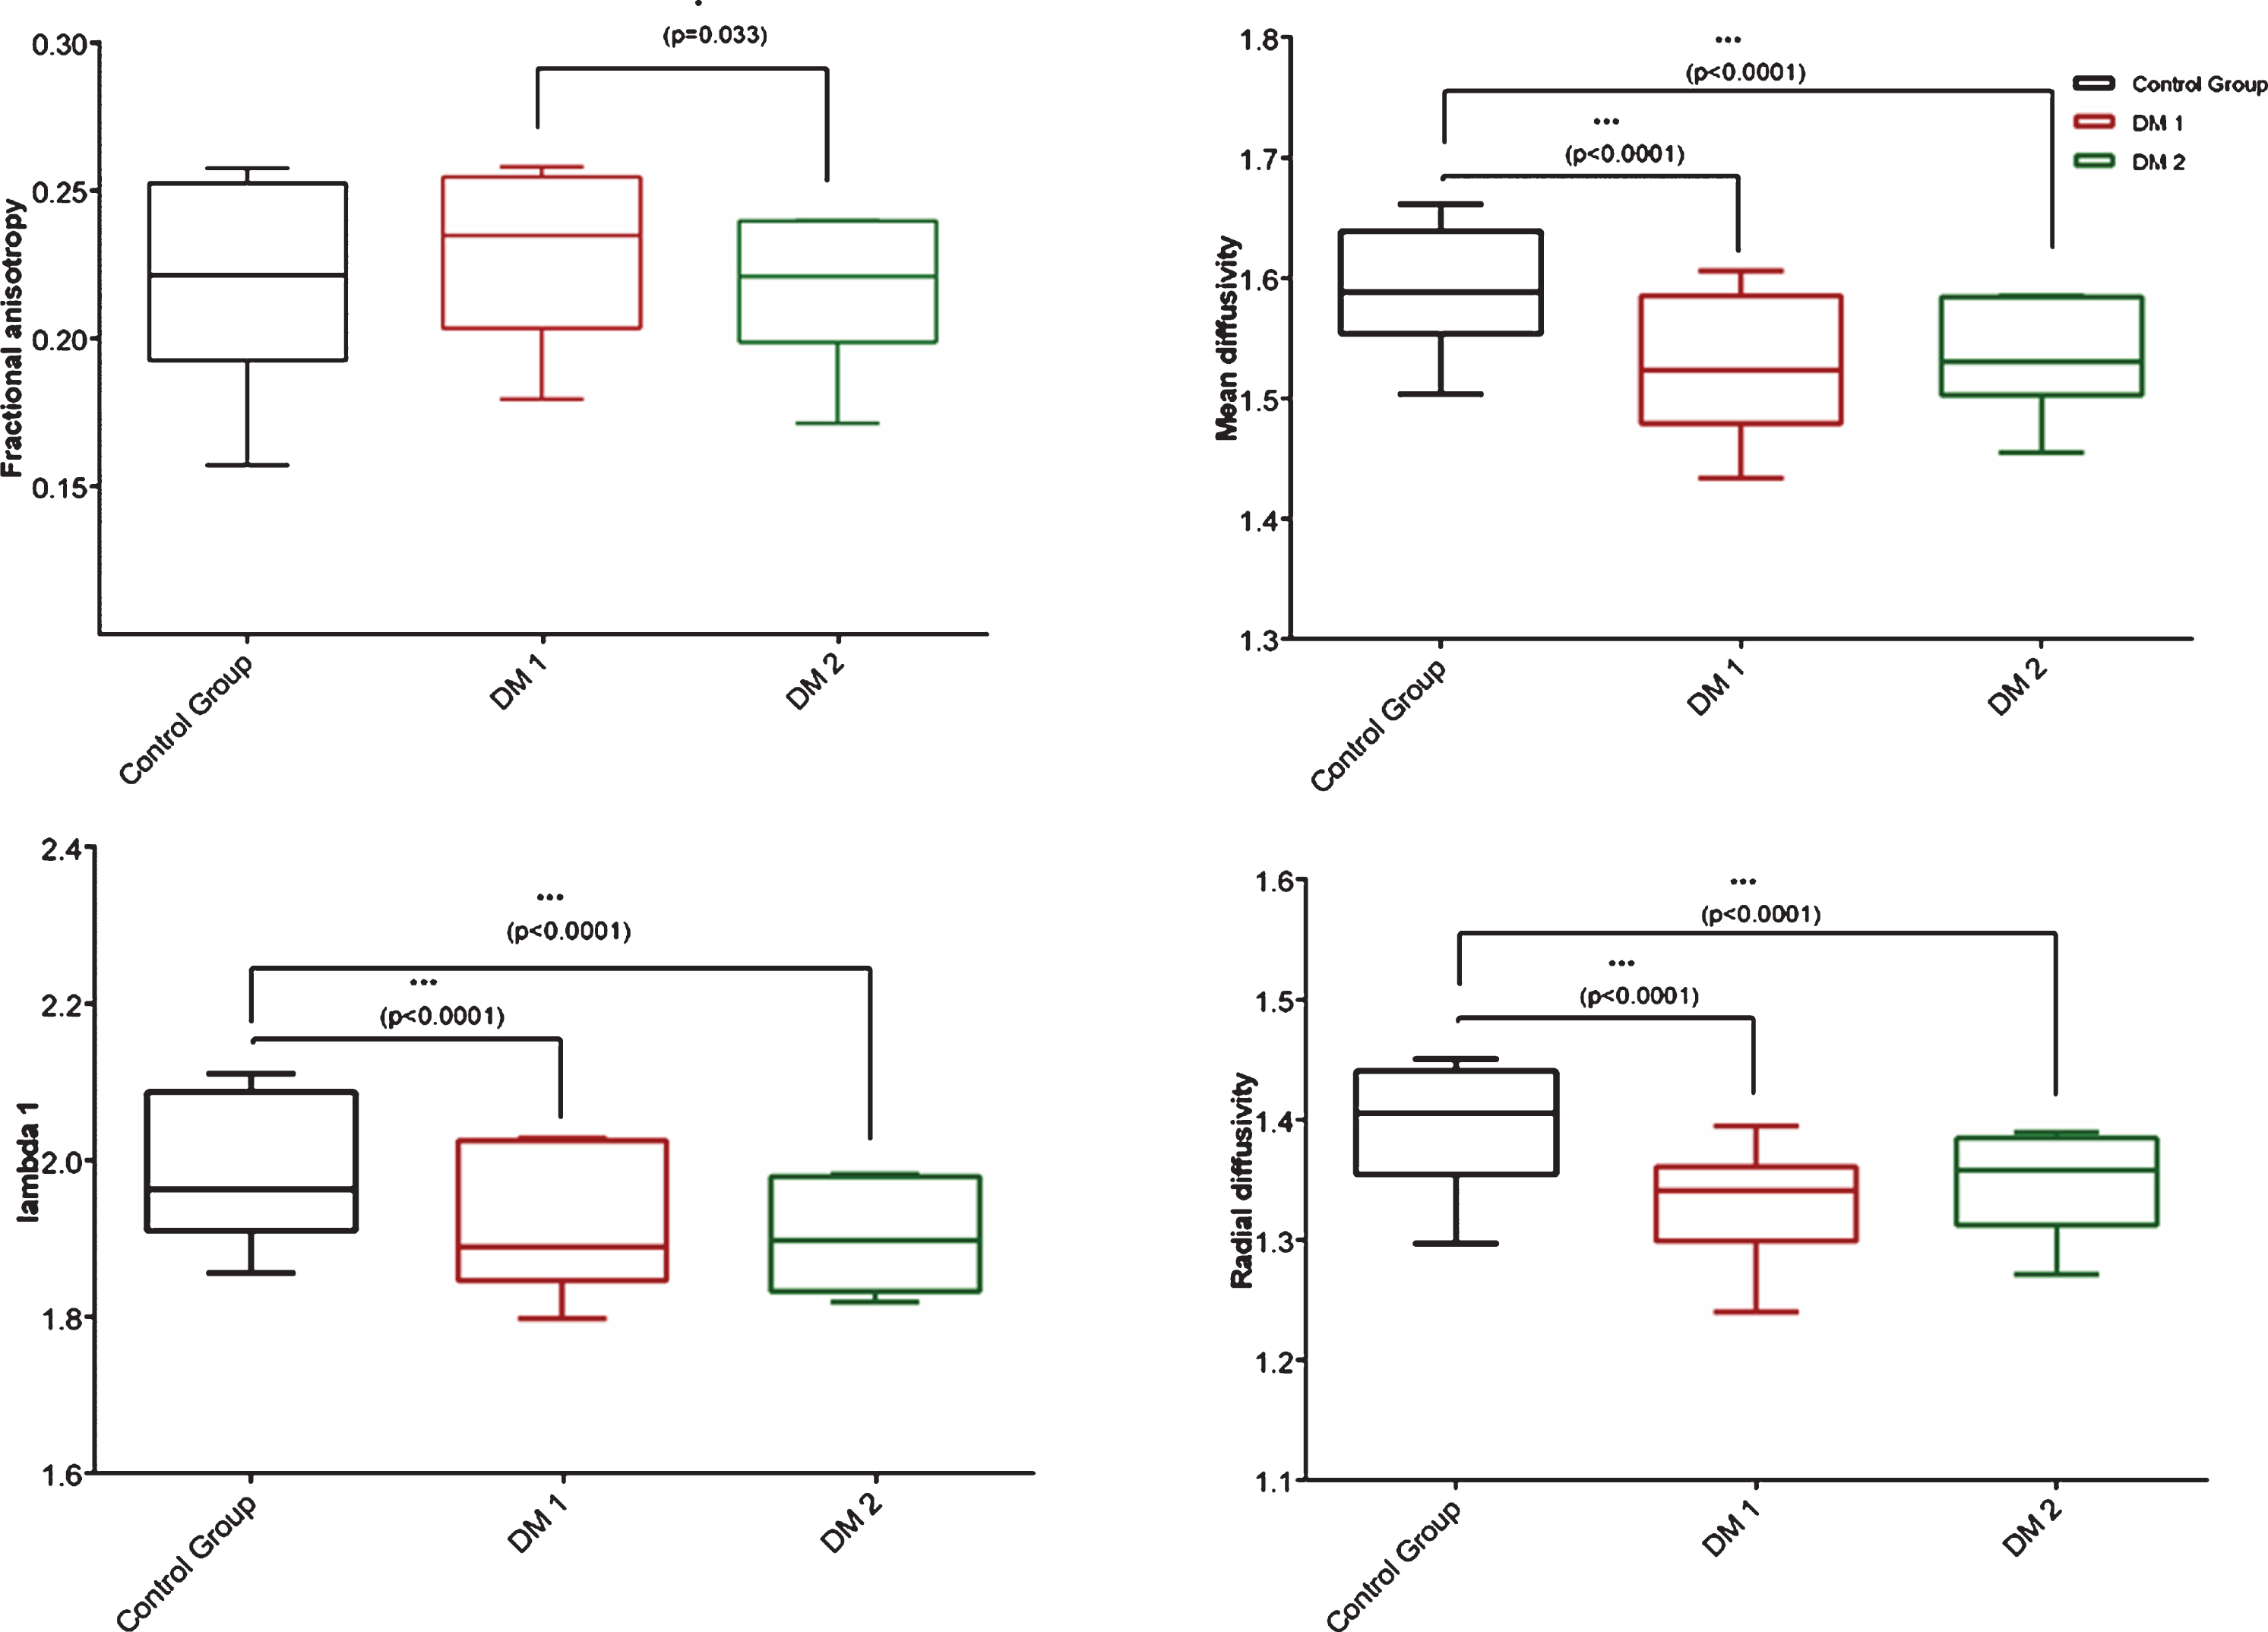
Two-way ANOVA of diffusion parameters fractional anisotropy (FA), mean diffusivity (MD), radial diffusivity (RD) and lambda 1 (λ1) in all thigh muscles combined. Significance with p < 0.05 =*, p < 0.001 =***; Error bar shows Min to Max values.
Diffusion metrics for controls and patients – all upper and lower leg muscles combined. λ1: lambda 1, RD: radial diffusivity, MD: mean diffusivity, FA: fractional anisotropy; p-value<0.05 highlighted with *
When analyzed on an individual muscle level the thigh muscles of DM 1 and DM 2 showed differences in comparison to controls but not among each other.
Whereas Fig. 2 and Table 4 show effects in mDTI parameters on a group level (upper leg and lower leg muscles combined for every group), post-hoc multiple t-test showed also significant differences on individual muscle level. See Table 5 for details and Fig. 3 for muscle scatter plots.
Multiple t-tests with Holm-Sidak method for multiple comparison. FA = fractional anisotropy, MD = mean diffusivity, RD = radial diffusivity, λ1 = lambda 1; Displayed are p-values and individual muscle comparison between controls and DM 1 and DM 2, as well as between DM 1 and DM 2. Muscle abbreviations: VL = vastus lateralis; VM = vastus medialis; RF = rectus femoris; SM = semimembranosus, ST = semitendinosus; BF = biceps femoris; MGM = medial gastrocnemius; LGM = lateral gastrocnemius; SOL = soleus; AT = tibialis anterior; PER = peroneal; EDL = extensor digitorum longus; PT = tibialis posterior; MGM = medial gastrocnemius muscle, LGM = lateral gastrocnemius muscle, SOL = soleus muscle; AT = anterior tibialis muscle, PER = peroneus muscle; EDL = extensor digitorum longus muscle, PT = posterior tibialis muscle
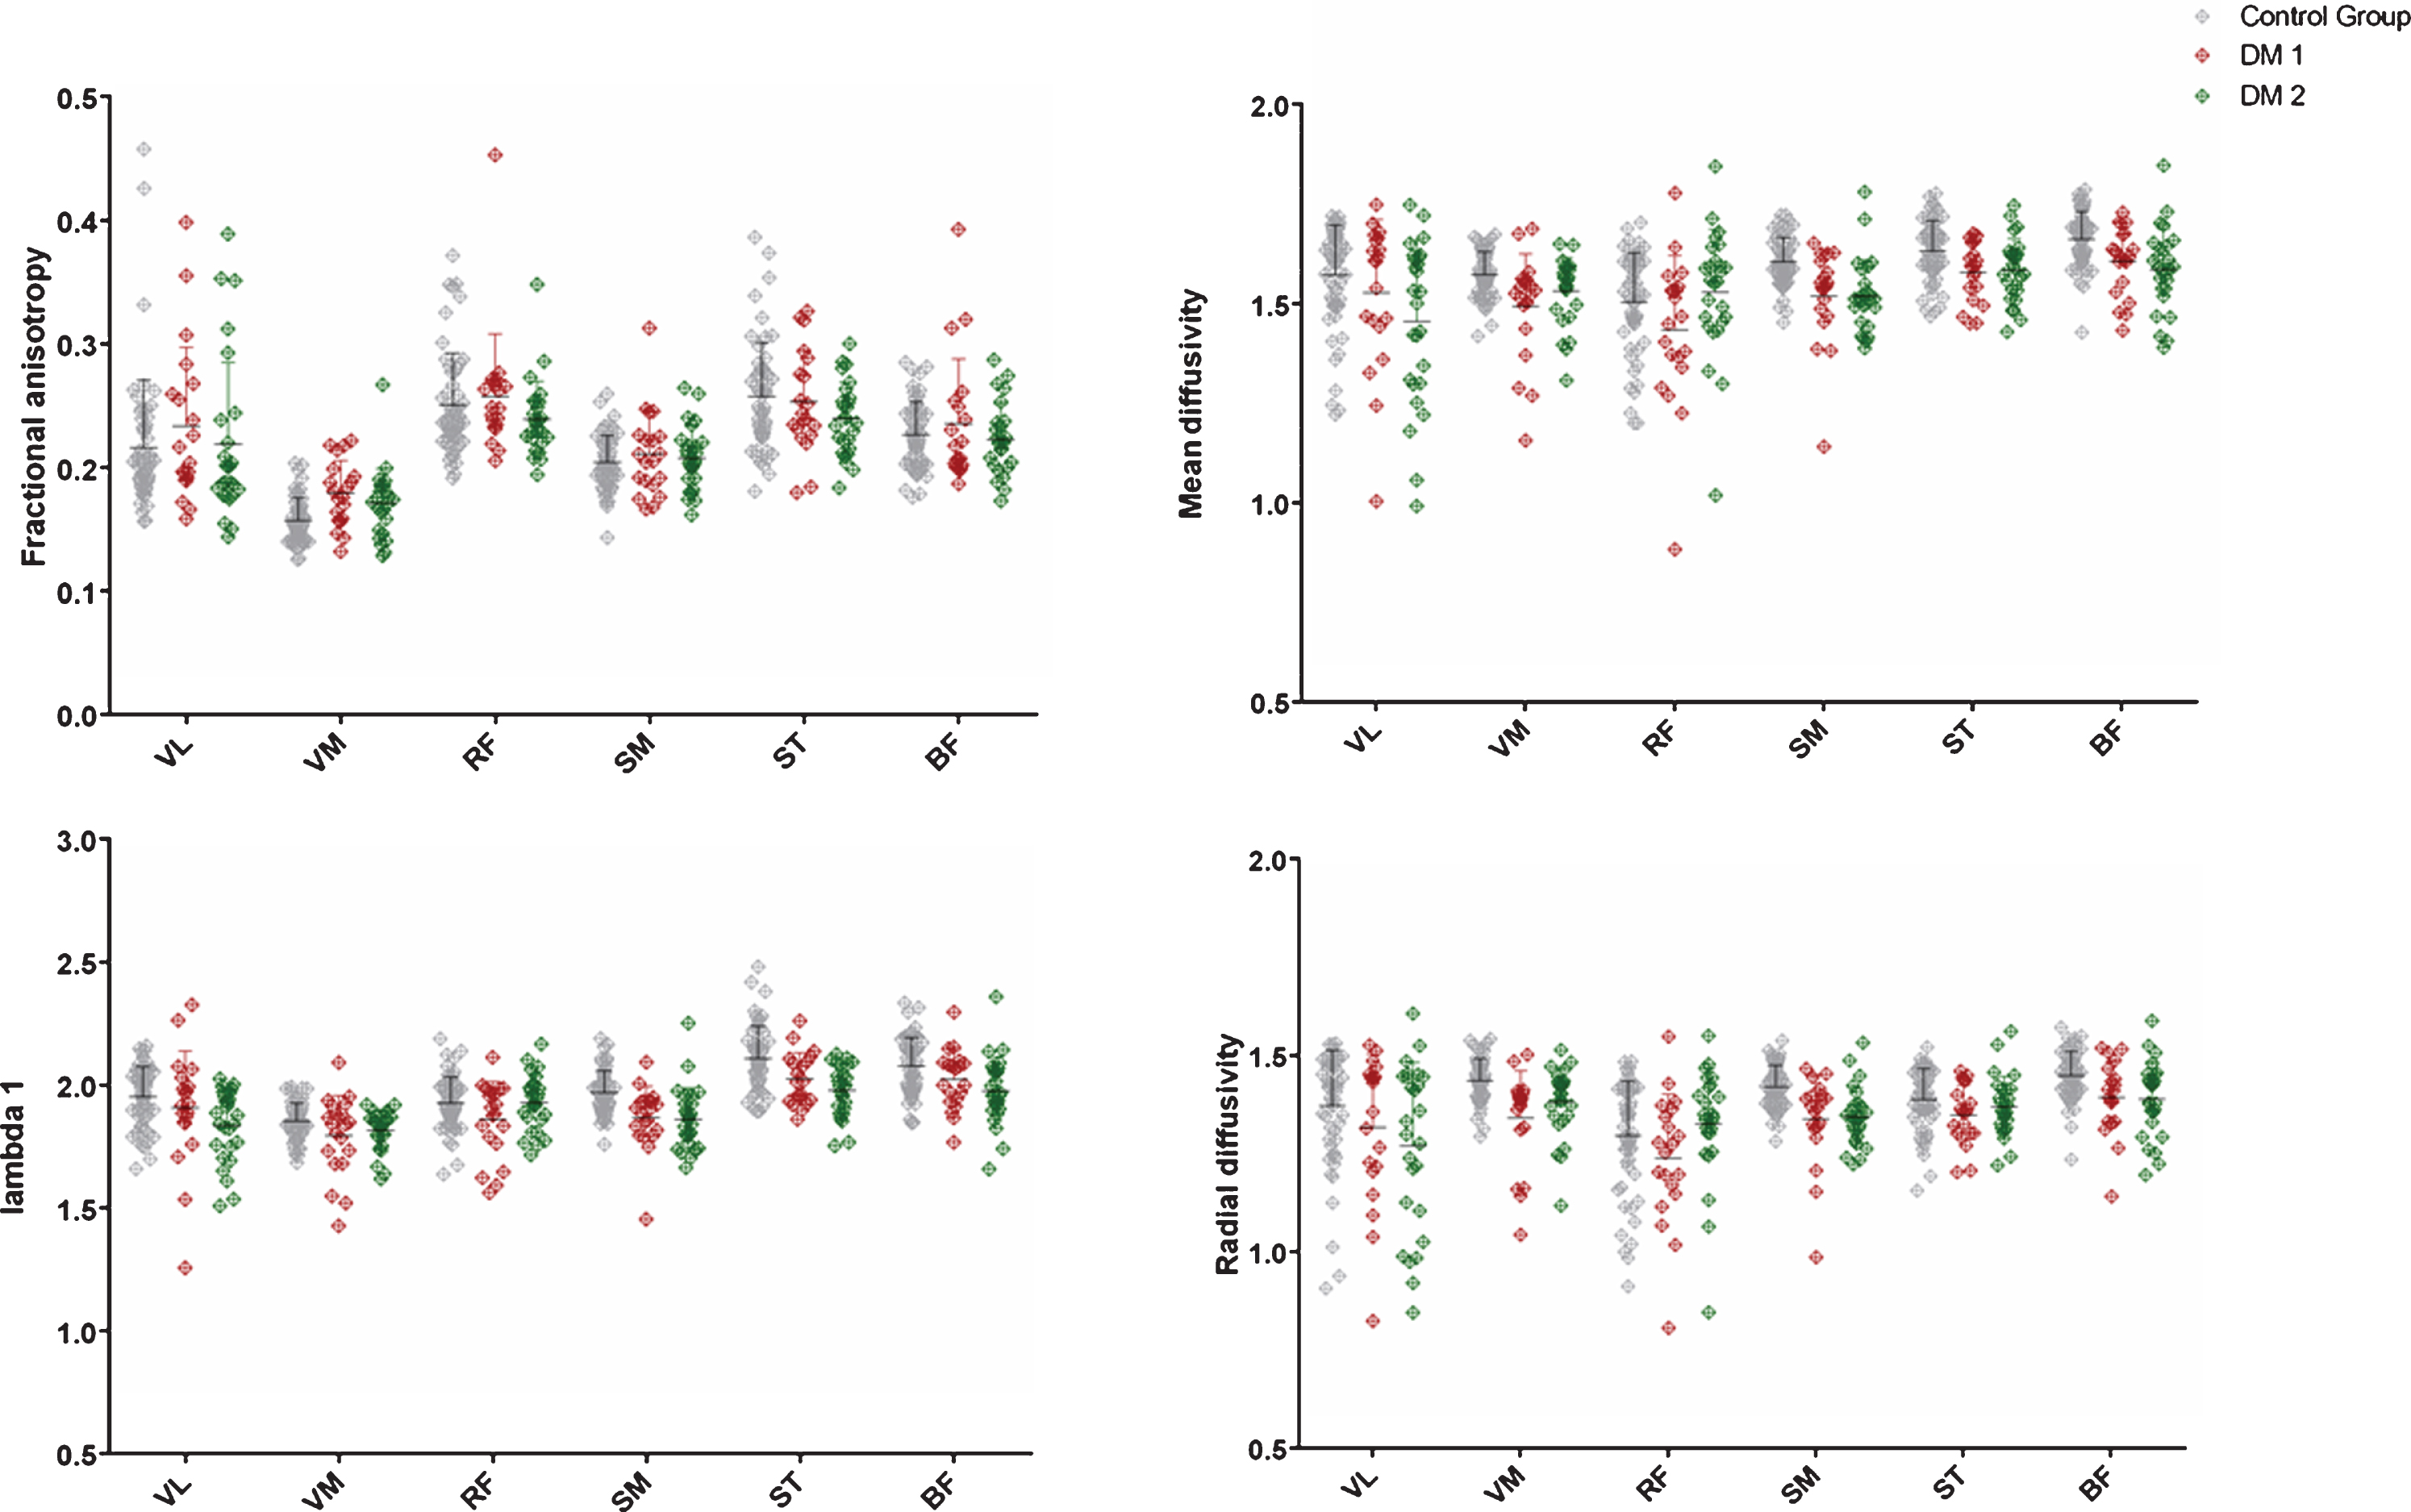
Single-muscle scatter plots of fractional anisotropy (FA), mean diffusivity (MD), radial diffusivity (RD) and lambda 1 (λ1) in thigh muscles. Significant differences with t-test and multiple comparison using Holm-Sidak method – See table 5 for p-values. Muscle abbreviations: VL = vastus lateralis; VM = vastus medialis; RF = rectus femoris; SM = semimembranosus, ST = semitendinosus; BF = biceps femoris; Please note, that the lower outliers in MD, RD and λ1 reflect a single DM 1 and DM 2 patient, respectivly.
Calf muscles
In the calf, all parameters showed a significant difference between DM 1 and DM 2 as well as between DM 2 and the controls.
FA in calf muscles was significantly different between DM 1 and controls (p = 0.001) and between DM 1 and DM 2 (p = 0.0026). There was no significant difference between DM 2 and controls.
MD was significantly different between DM 1 and controls as well as DM 1 and DM 2 (both p < 0.0001). There was no significant difference between DM 2 and controls.
RD was significantly different between DM 1 and controls (p < 0.0001) as well as DM 1 and DM 2 (p < 0.0001). RD was also significantly different between DM 2 and controls (p = 0.0359).
λ1 was significantly different between DM 1 and controls as well as between DM 1 and DM 2(both p <0.0001). There was no significant difference between DM 2 and controls. See Fig. 4 for details.
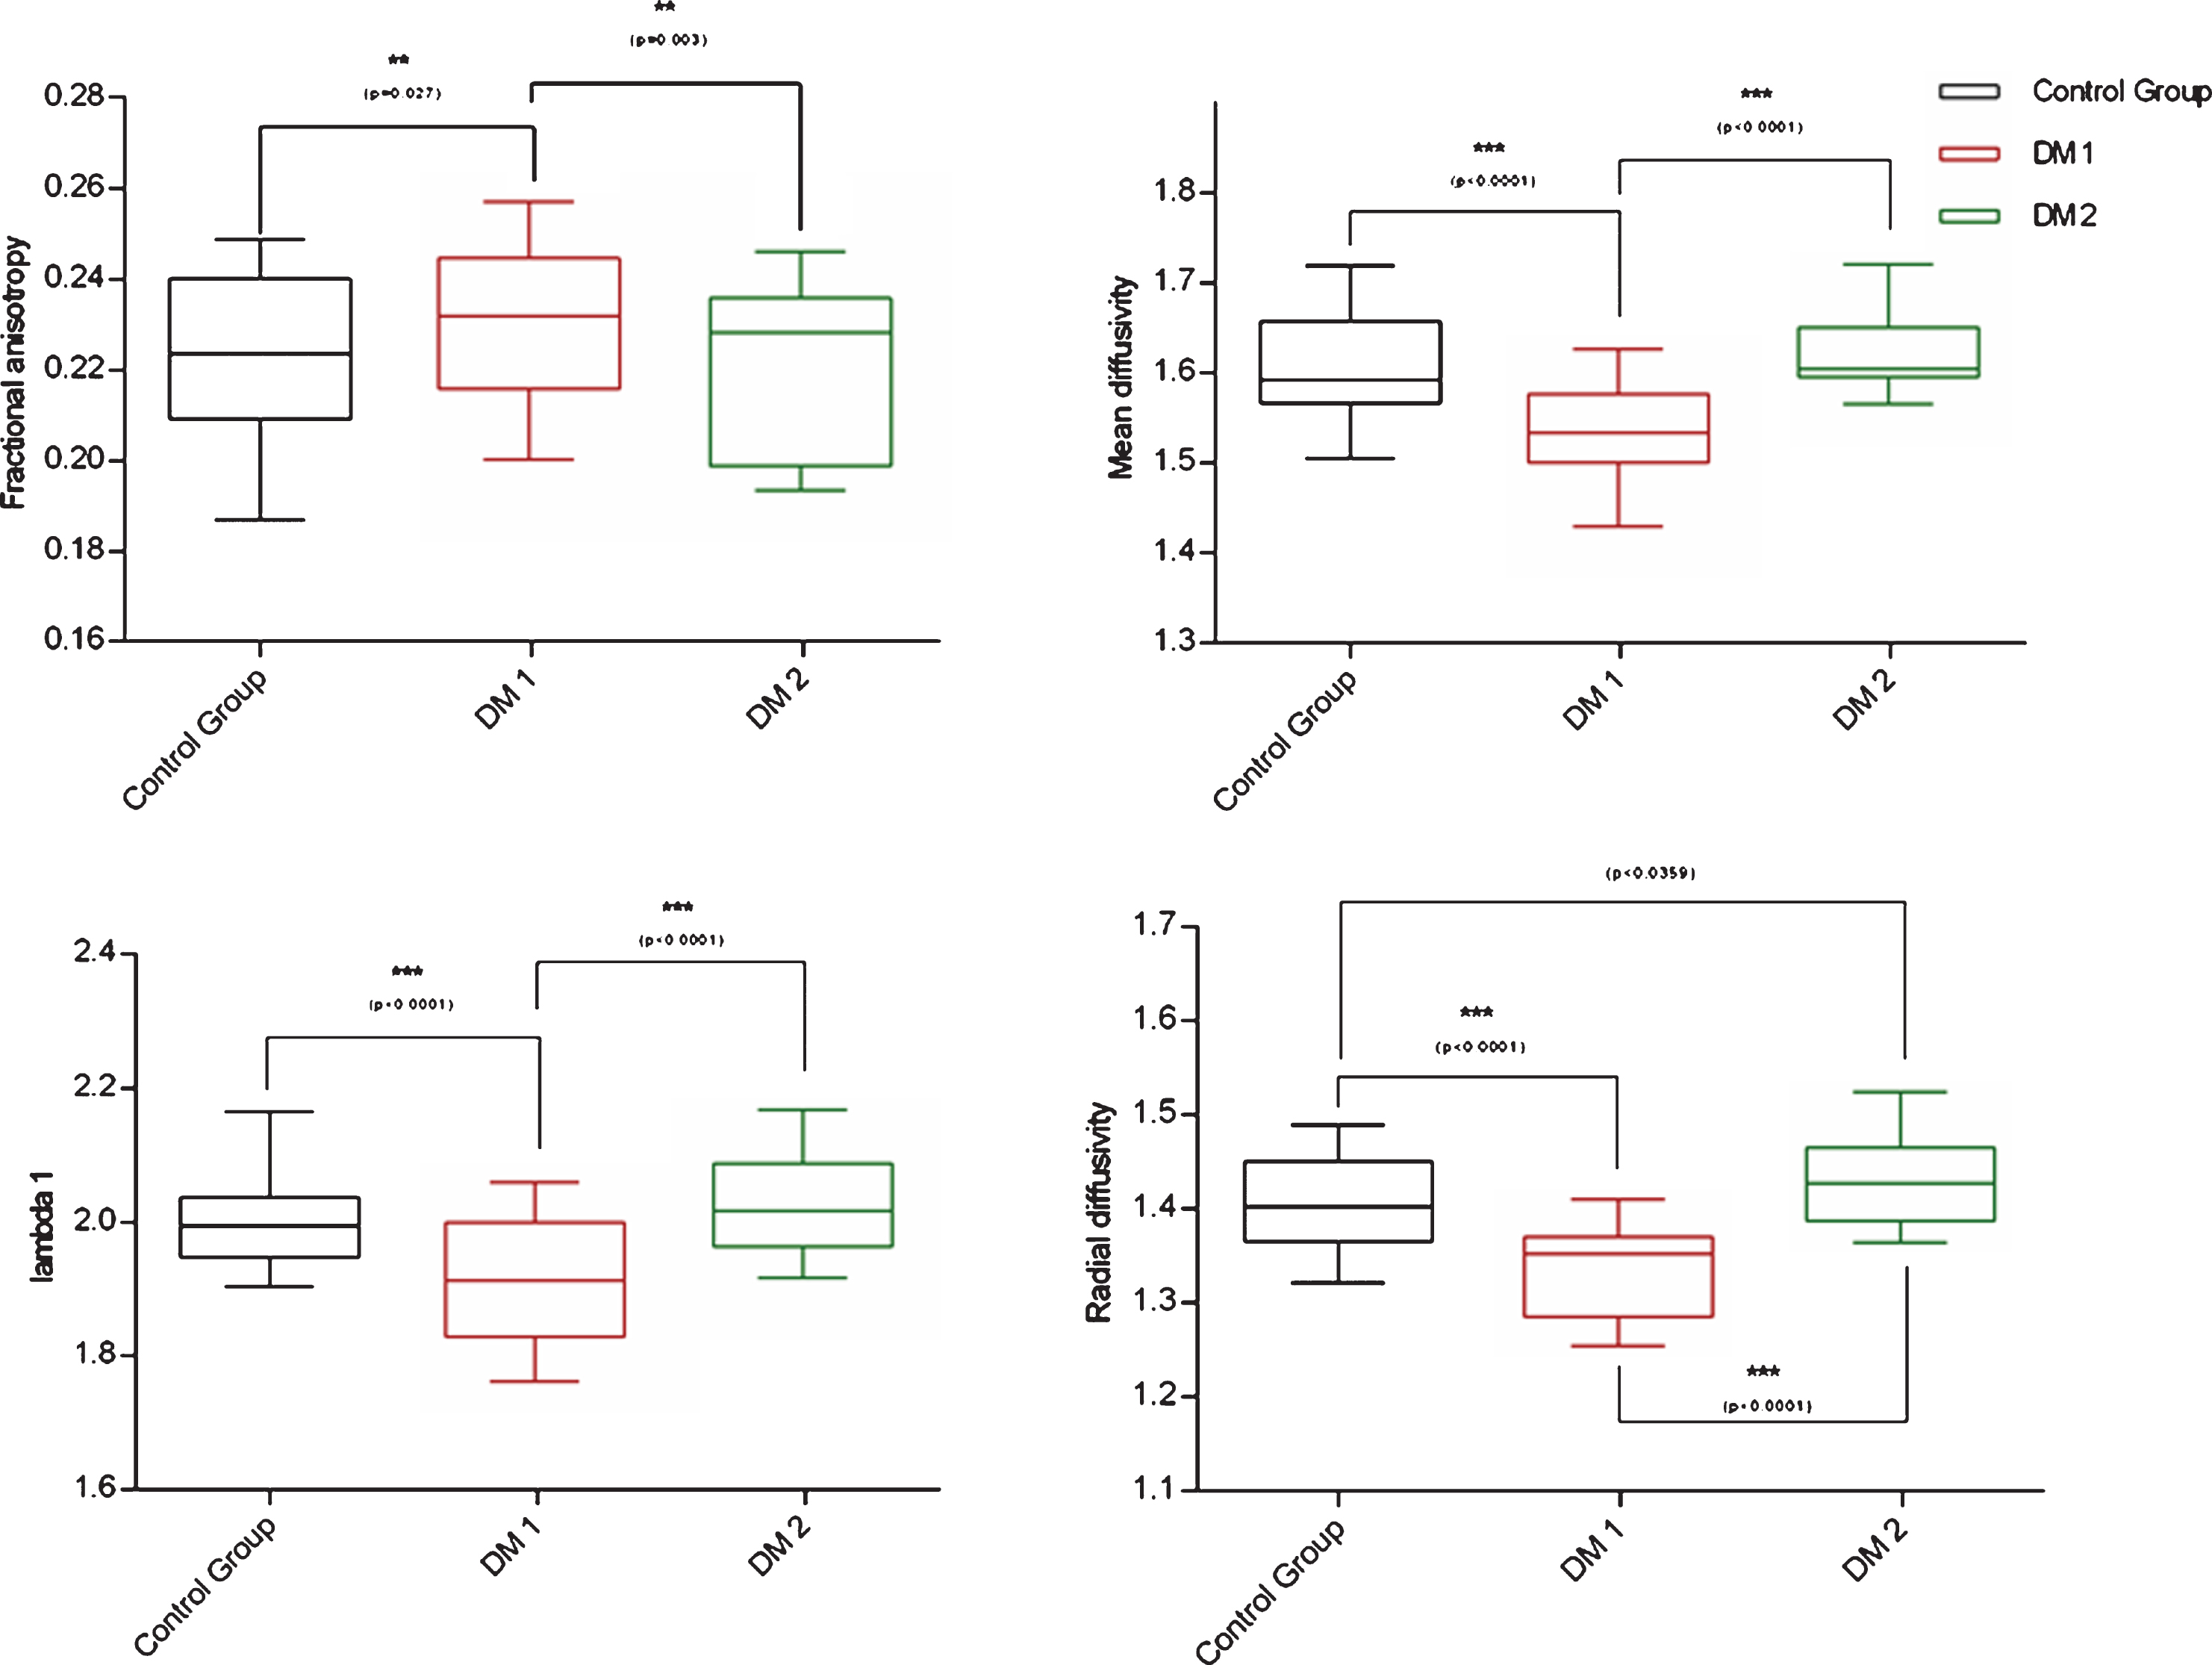
Two-way ANOVA of diffusion parameters fractional anisotropy (FA), mean diffusivity (MD), radial diffusivity (RD) and lambda 1 (λ1) in all calf muscles combined. Significance with p < 0.05 =**, p < 0.001 =***; Error bars show min to max values; Control group = black, DM 1 = red; DM 2 = green.
The Signal-to-noise ratio (SNR), which was estimated based on the noise measures, was comparable between groups: control 44–99, mean 61.8±16.1, DM 1 54–94, mean 69.3±19.7, DM 2 37–107, mean 64.5±20.4.
Post-hoc multiple t-tests did show significant differences on individual calf muscle level.
See Fig. 5 for muscle scatter plots and Table 5 for further details.
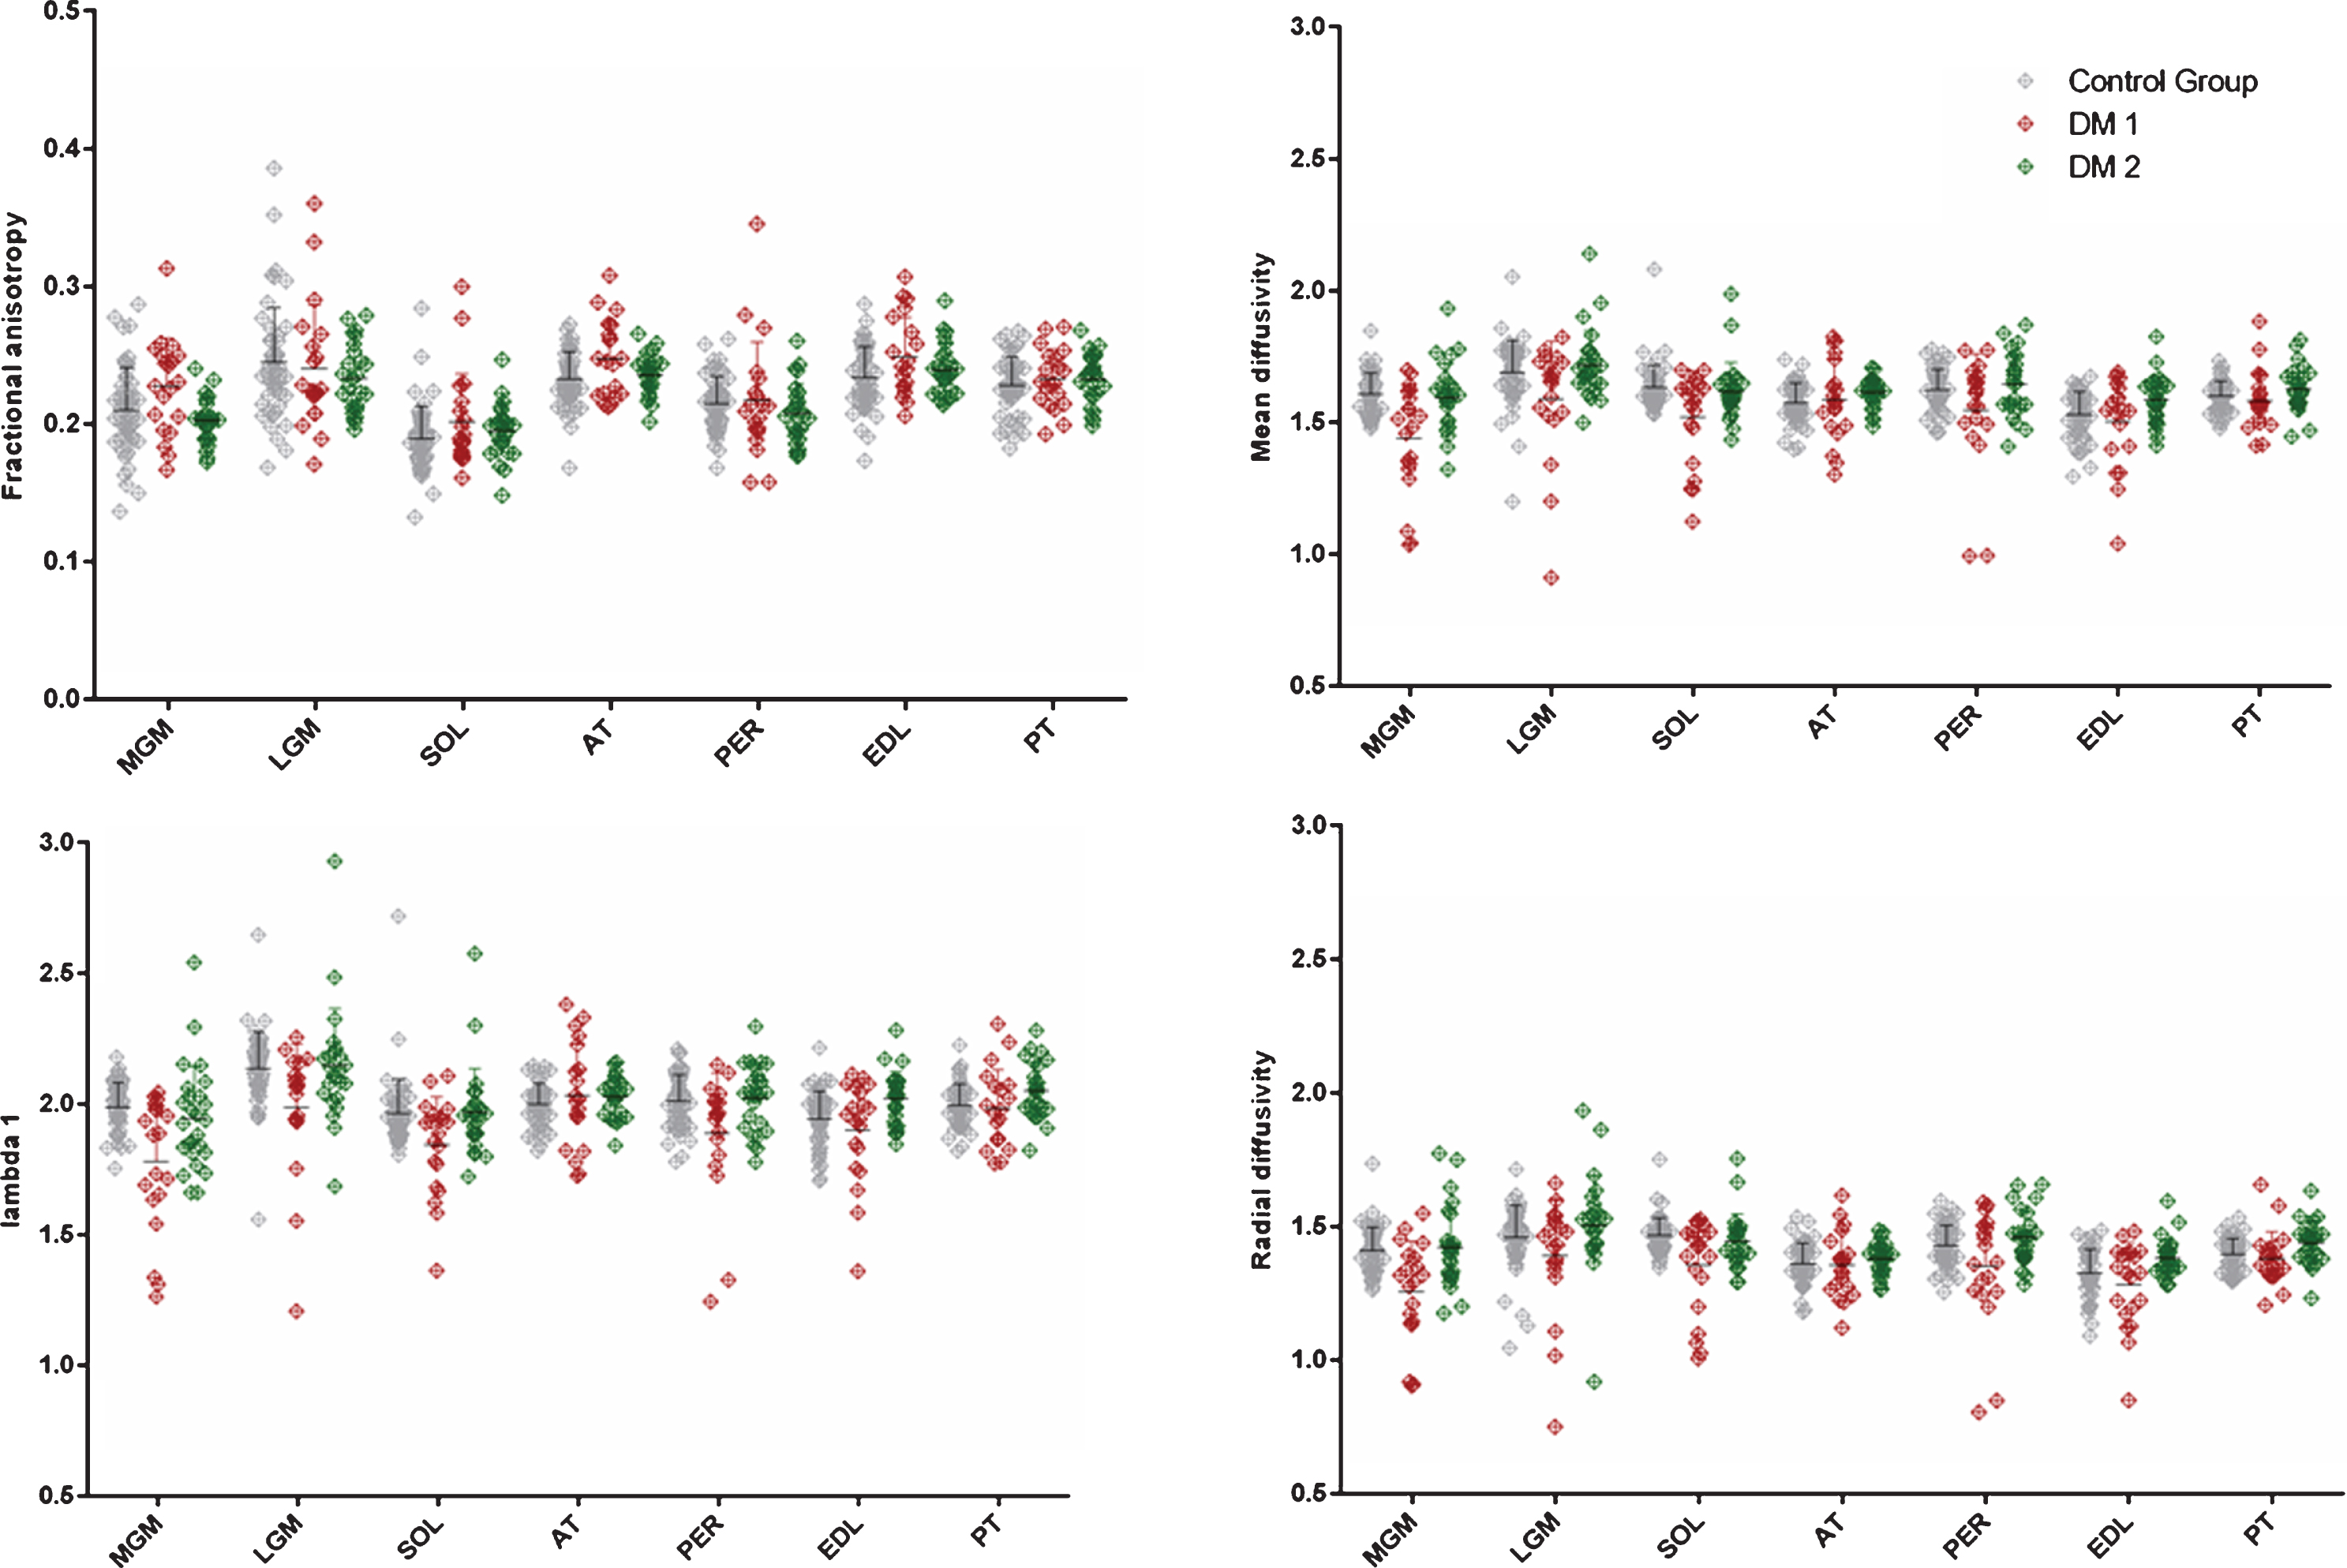
Scatter plot of fractional anisotropy (FA), mean diffusivity (MD), radial diffusivity (RD) and lambda 1 (λ1) in separated calf muscles. Significant differences with t-test and multiple comparison using Holm-Sidak method. See Table 5 for p-values and significance level. Muscle abbreviations: MGM = medial gastrocnemius muscle, LGM = lateral gastrocnemius muscle, SOL = soleus muscle; AT = anterior tibialis muscle, PER = peroneus muscle; EDL = extensor digitorum longus muscle, PT = posterior tibialis muscle. Please note, that the lower outliers in MD, RD and λ1 reflect a single DM 1 and DM 2 patient, respectivly.
Fat quantification
Thigh
In the thigh muscles fat-quantification was done for 10 controls, 10 DM 1 patients and 12 DM 2 patients.
The DM 1 as well as the DM 2 group had a significant higher fat-fraction for the whole thigh region compared to the control group (both p < 0.0001).
The fat-fraction of the individual thigh muscles shows a high standard deviation in the DM 1 and DM 2 group (see Fig. 6).
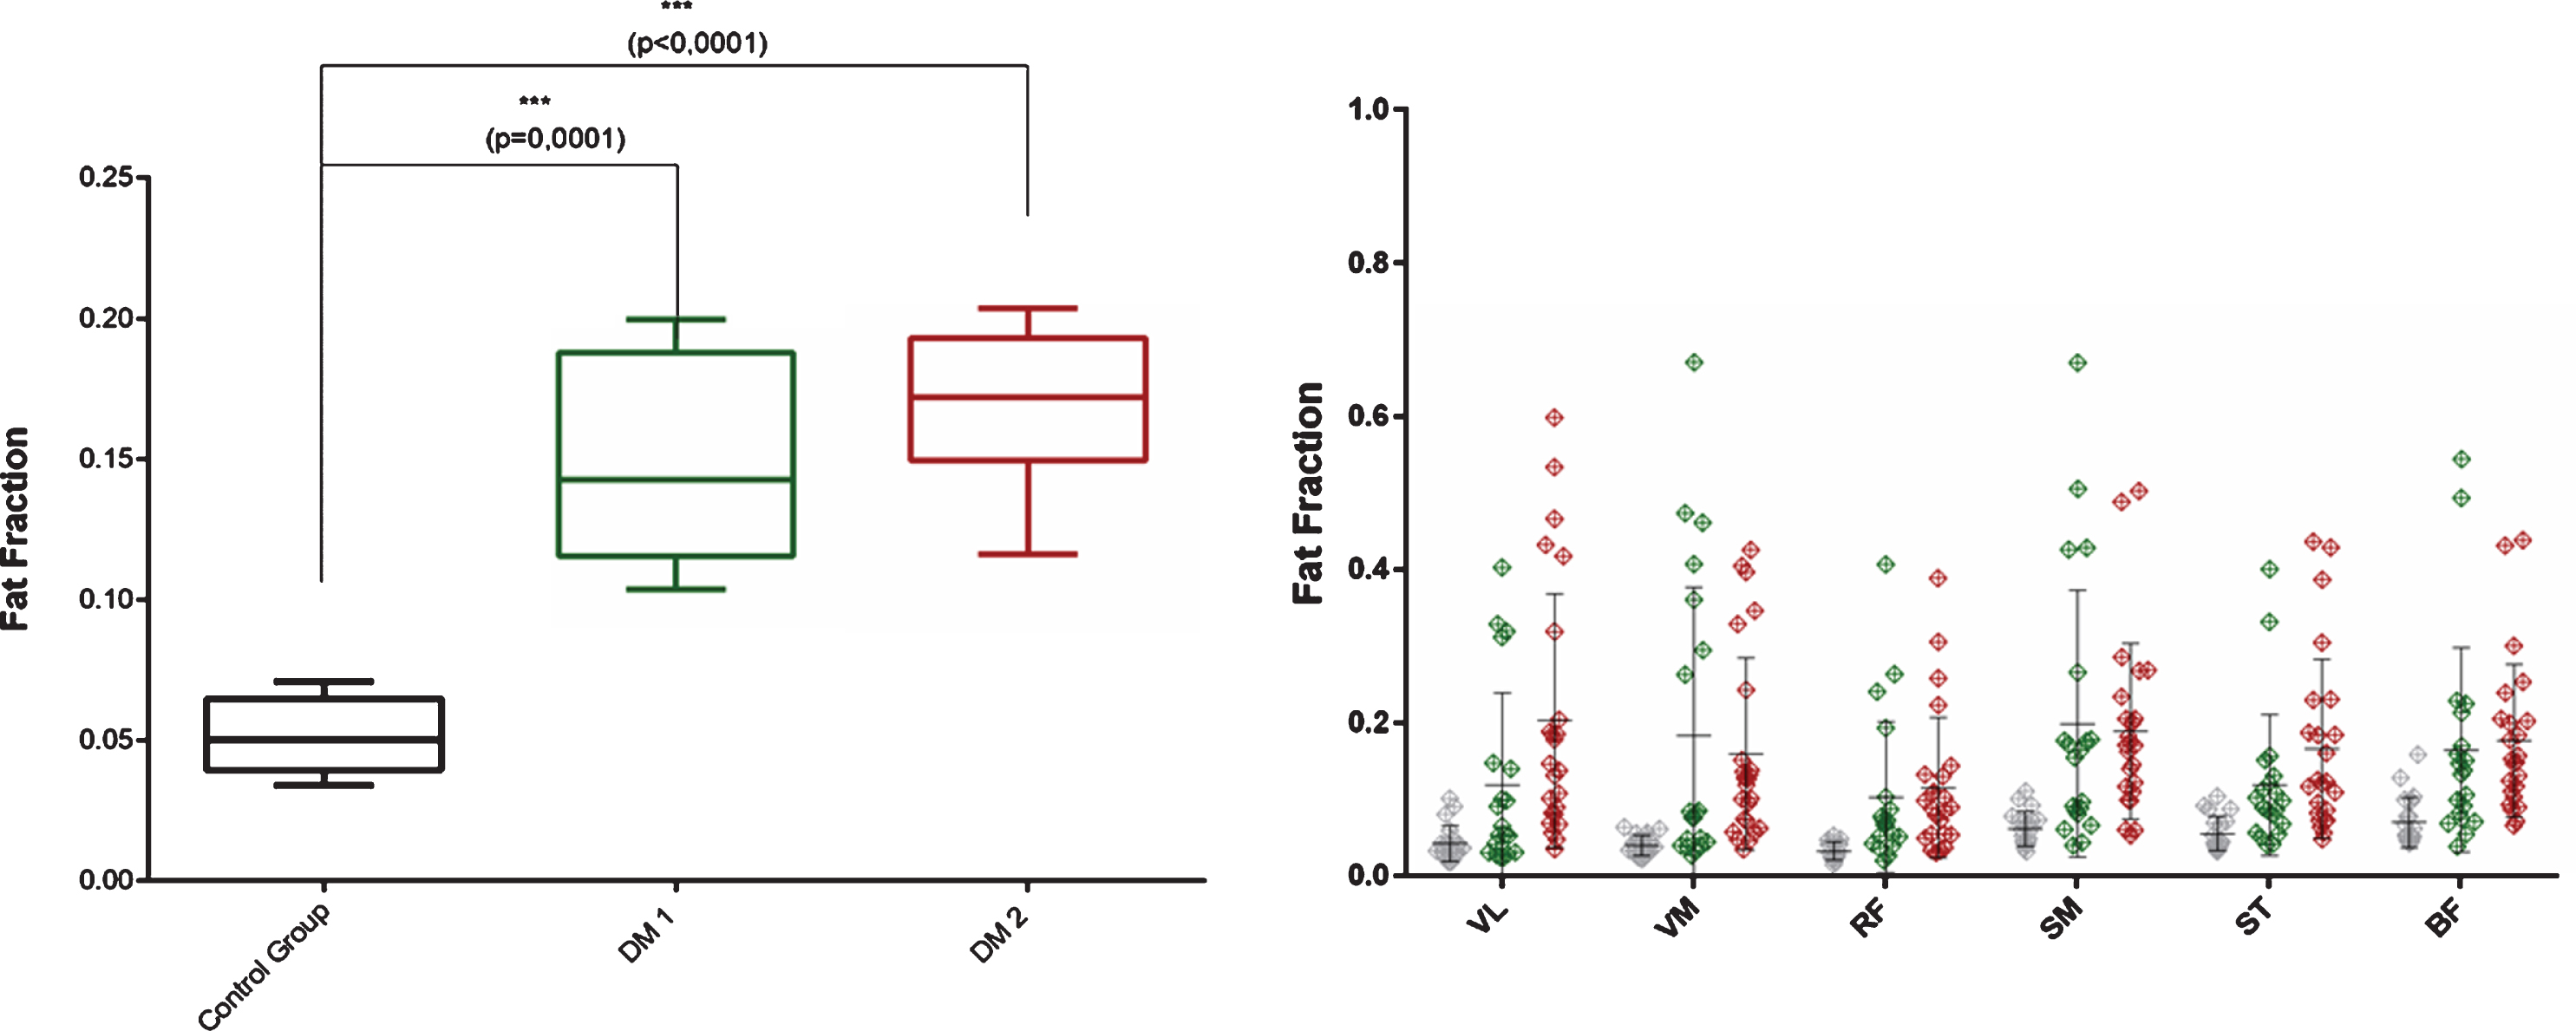
Left: Two-way ANOVA of fat-fraction in thigh muscles. Significance level with p < 0.05 =*; Error bar shows min to max values; Right: Scatter plot of individual fat-fraction values with SD in thigh muscles.
Calf
Due to water-fat swap artifacts fat quantification was not successful for controls and DM 1 and DM 2 patients.
Correlation analysis with triplet repeat length in DM 1 patients
The triplet repeat length of the DMPK gene mutation in the DM 1 group was correlated to the DTI parameters FA, MD, RD, λ1 as well as with the fat-fraction of the thigh muscles. None of the analyses revealed a significant correlation.
Correlation analysis with MRC sum score and mDTI parameters
There was no positive or negative correlation with muscle strength (MRC score) and mDTI parameters.
DISCUSSION
The present study was performed to evaluate the ability of quantitative MRI-parameters and to assess disease-specific changes in DM 1 and DM 2.
mDTI imaging revealed reduced muscle diffusion parameters in the thigh and calf muscles of all DM 1 patients. In patients with DM 2, diffusion parameters were also altered in the thigh and some of the calf muscles compared to healthy controls. Moreover, we observed a different muscle involvement pattern in the calf muscles of DM 1 and DM 2 patients.
Due to different findings in the upper and lower leg muscles, we would like to focus on the pathological findings in the thigh muscles in the first part of the discussion.
A previous non-quantitative MRI study in DM 1 patients revealed a predominant involvement of the anterior compartment of the thigh muscles, sparing the rectus femoris muscles [20]. A recent quantitative MRI study by Heskamp et al. showed that leg muscles of DM 1 patients have an increased fat-fraction and prolonged T2 relaxation time reflecting muscle edema and disease activity [3]. The changes are best described in DM 1 - in DM 2, the data are limited and not consistent [20–23].
Our data are in line with the previous findings, and moreover, mDTI parameters in our study further confirmed myopathic muscle degeneration. Of the mDTI-parameters, MD reflects the mean self-diffusion of water in muscle, whereas λ1 and RD additionally reflect the amount of longitudinal and transversal diffusion [12]. All these parameters are usually elevated in active inflammatory or degenerating myopathies as well as muscle hypertrophy [4, 24]. MD, λ1 and RD are in contrast decreased in muscles with structural damage, scar tissue, fatty infiltration and atrophy [9, 24]. They reflect restricted water diffusion due to muscle fiber atrophy, degeneration, and various subcellular muscle fiber alterations. Muscle fiber atrophy can additionally be captured with changes in FA value. A high FA value indicates a more anisotropic water diffusion. Berry et al. could show in a mDTI-model-analysis that MD and RD decreases (reduced myofiber diameter) and FA increases (relative higher anisotropic diffusion) in muscle fiber atrophy [12]. Our mDTI results thus indicate muscle fiber degeneration and possible fiber atrophy in the thigh muscles.
Indeed, histopathology of DM 1 shows predominant type I fiber atrophy and DM 2 shows predominant type II fiber atrophy - apart from myopathic changes and muscle degeneration with fatty infiltration in both diseases [25, 26].
In the thighs, the alteration of mDTI metrics we observed in DM 1 and DM 2 patients most likely support disease-inherent advanced structural myopathic degeneration rather than muscle fiber atrophy alone, as described in several previous studies [4, 12]. Muscle fat-fraction was also significantly higher in the thigh muscles of our DM 1 cohort compared to controls and it was most prominent in VM, SM and BF muscles, which was again consistent with previous studies [3, 23]. Our data cannot fully exclude an effect of fatty-infiltration on mDTI parameters despite using fat-suppression for DWI data. Changes of mDTI parameters due to fatty infiltration usually involve an increase in FA and a low SNR. Since we could not see an increase in FA and could report a high SNR for all the examined muscles in both diseases, we consider it unlikely that the reduction of mDTI parameters is the effect of fatty infiltration alone [24, 27]. In our DM 1 group we did not observe mDTI alterations that would be comparable with muscle edema as shown by Heskamp et al. with water T2 imaging. Water T2 imaging could be more sensitive towards muscle edema than mDTI [3].
In contrast to the previously described unspecific muscle involvement pattern in DM 2 we found higher fat-fractions in certain thigh muscles, especially VL, BF, SM and ST in DM 2 patients [20, 28]. Regarding the calves, we found a different pattern of muscle involvement in DM 1 and DM 2 patients (see Fig. 7). The muscles of DM 1 patients showed altered mDTI metrics in muscles that were not affected in DM 2.
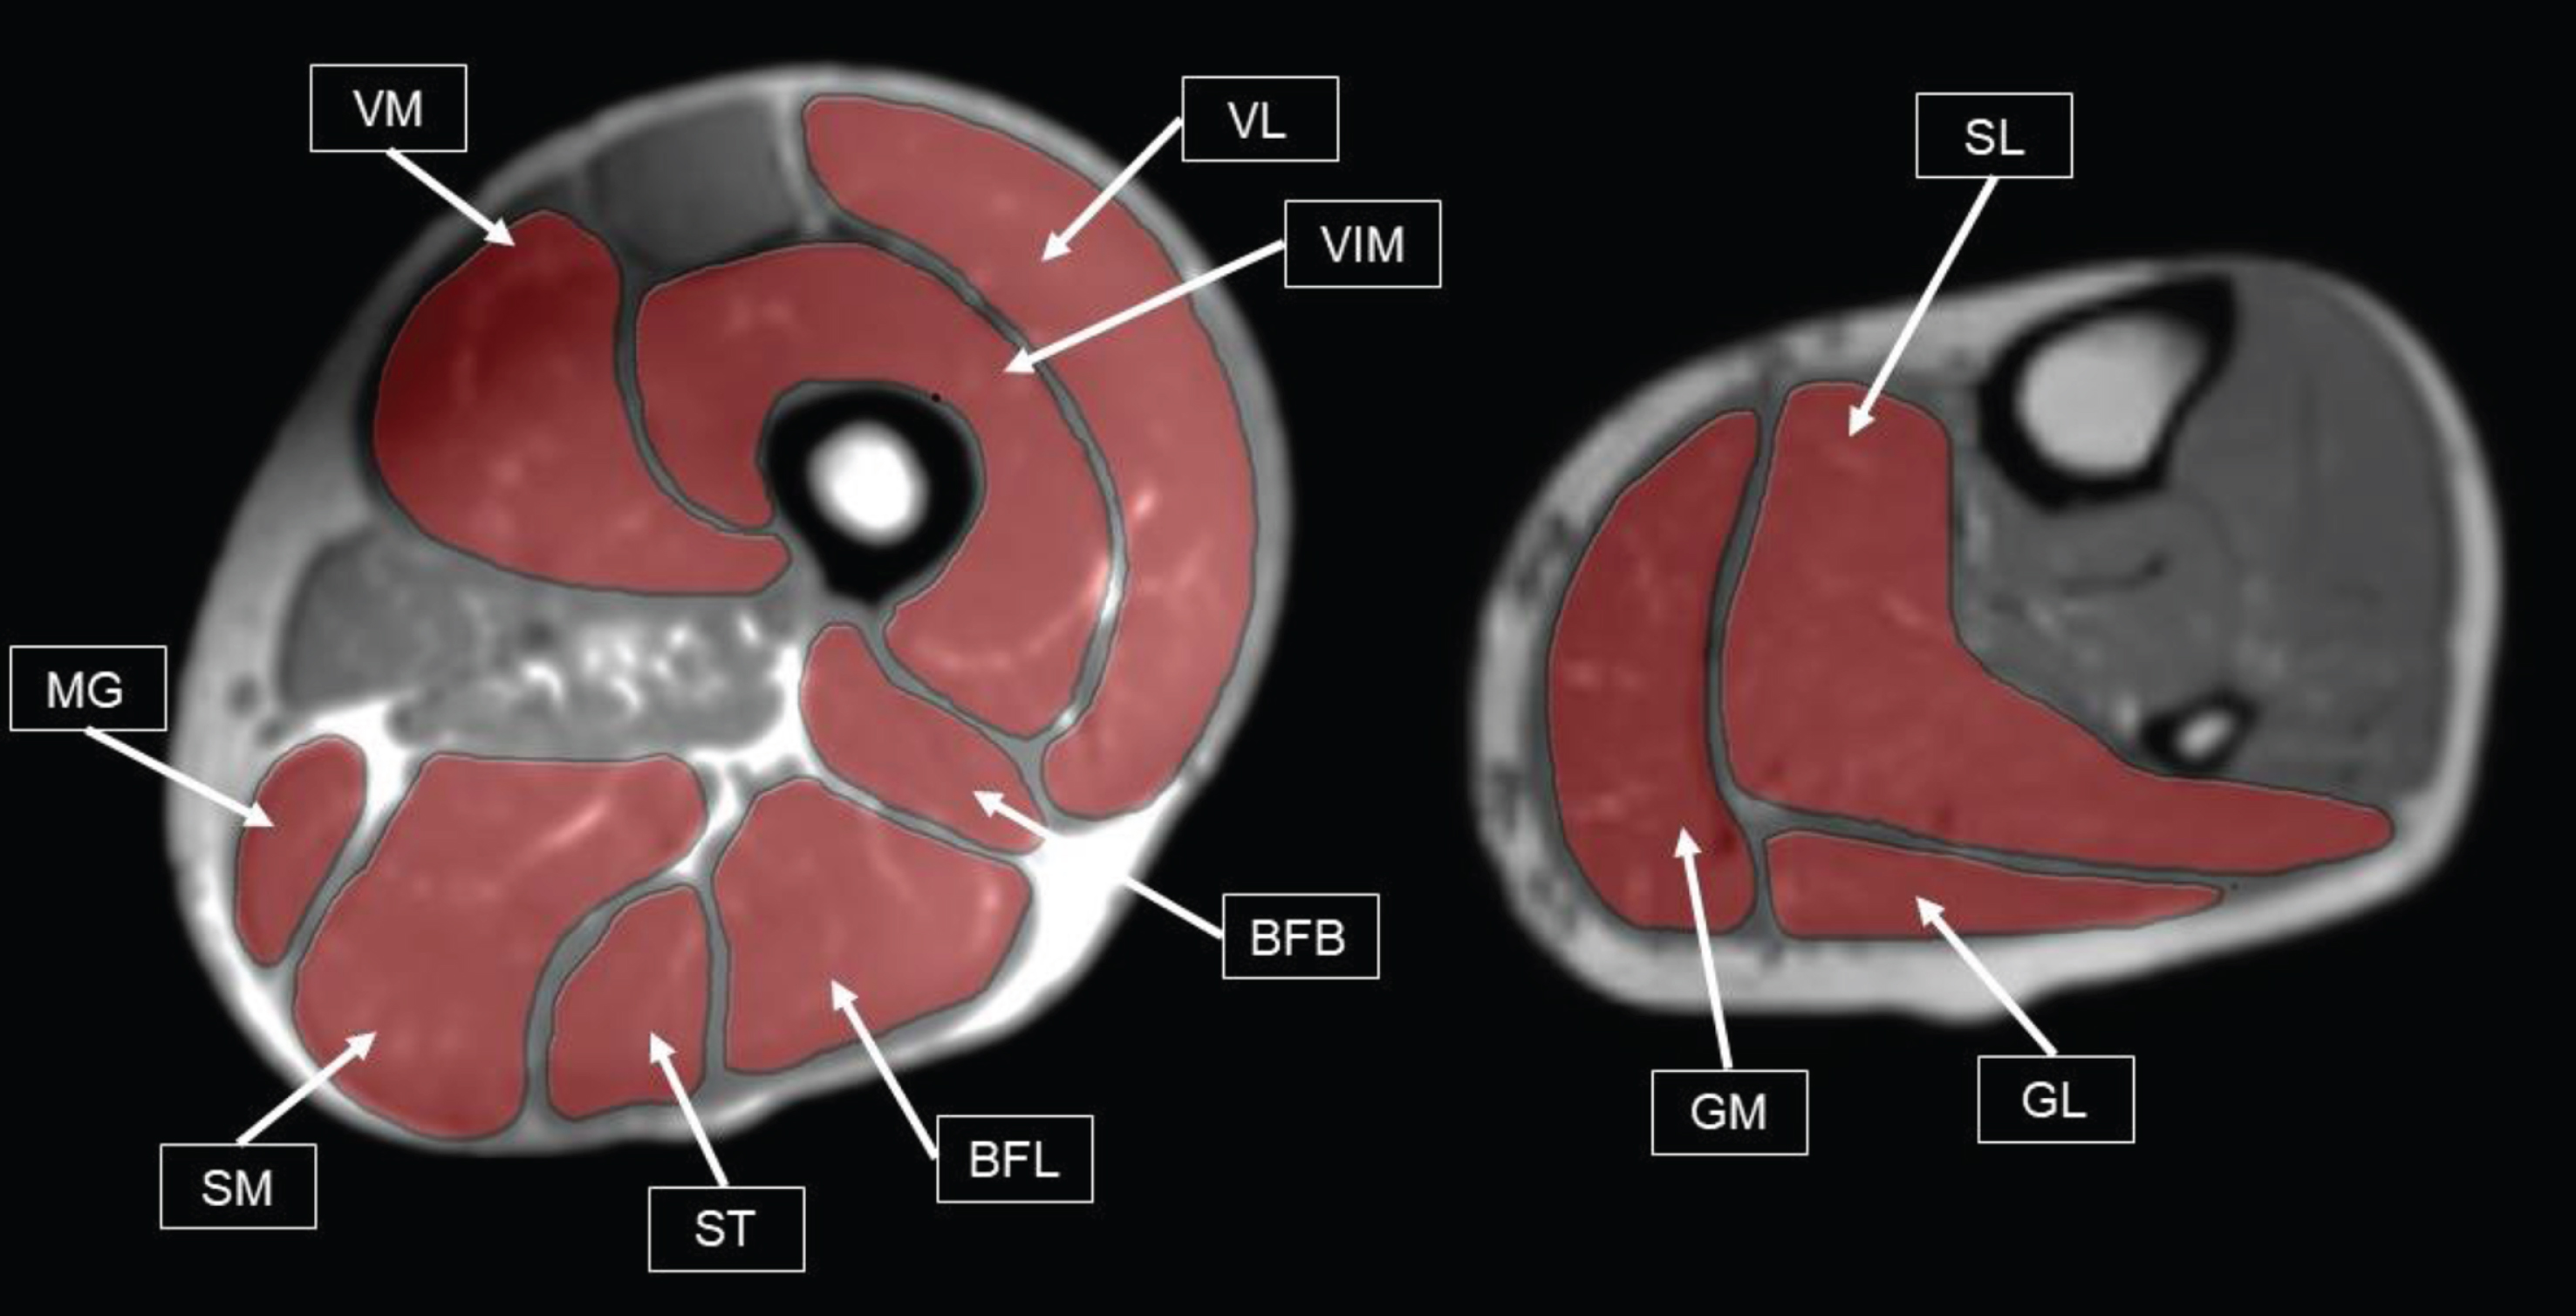
Illustration of typical involvement pattern in muscle degenerations of DM 1 patients (according to Peric et al., 2017) (19). Left: Thigh muscles that show abnormalities on Mercuri Scale in > 30% of DM1 patients. VM = Vastus Medialis, VIM = Vastus Intermedius, VL = Vastus Lateralis, MG = Musculus Gracilis, SM = Semimembranosus, ST = Semitendinosus, BFL = Biceps Femoris Caput Longum, BFB = Biceps Femoris Caput Breve. Right: Calf muscles, that score a 3 + on a Mercuri Scale in > 40% of DM 1 patients. GM = Gastrocnemius Medialis, GL = Gastrocnemius Lateralis, SL = Soleus. Muscle labels and T1 MRI data were acquired during this study.
These differences could be explained by differences in disease histopathology. Although there are no studies on muscle fiber type mapping of the whole body, type 1 and type 2 muscle fibers are not equally distributed among skeletal muscles [29]. Especially the calf muscles (tibialis anterior muscle, gastrocnemius muscle, soleus muscle) contain higher amounts of type 1 than type 2 muscle fibers [26]. The different mDTI pattern in the calf muscles in DM 1 and DM 2 could thus be explained by the fact that degeneration is fiber-type specific. For MGM, AT and EDL in the DM 1 cohort mDTI changes indicated muscle fiber atrophy, mainly based on high FA values [12].
Apart from the mDTI findings compatible with muscle fiber atrophy in the above-mentioned muscles, all calf muscles in DM 1 showed an alteration in mDTI metrics known to be associated with myopathic muscle degeneration. The mDTI pattern in the calves of DM 1 even showed a predominance in the LGM, MGM and SOL muscles and was thus in line with previous MRI studies regarding muscle involvement [3, 20]. As described before the tibialis posterior (PT) muscle is also not affected in our DM 1 cohort [3, 30]. In contrast to the results in the DM 1 cohort, those of the DM 2 patients are different from former studies [20, 23]: we observed higher diffusion values regarding MD, RD and λ1 in EDL and PT muscles in patients with DM 2 compared to healthy controls. These higher diffusion values could reflect muscle edema and active muscle involvement prior to fatty degeneration or calf muscle hypertrophy.
Our data suggest that a differentiation between DM 1 and DM 2 might be possible on an intraindividual level. A combination of one thigh muscle and two calf muscles could be sufficient to differentiate between DM 1 and DM 2: VM (thigh) is affected in both diseases, PT is not affected in DM 1 and MGM is not affected in DM 2. Thus, altered muscle diffusion in PT and VM could suggest DM 2 and altered muscle diffusion in MGM and VM could suggest DM 1. Nonetheless, more elaborate MR protocols including T2-mapping, might provide additional and complimentary options for the differentiation between DM 1 and DM 2. For the definition of a disease specific alteration more data is necessary – this result should be verified in prospective larger studies.
Limitations
This is a preliminary, monocentric cross-sectional study; thus, the sample size is rather small. Moreover, fat-fractions of the calf muscles could not be analyzed due to water-fat artifacts that appeared after image reconstruction. In contrast to previous studies there was no correlation between CTG-triplet repeat length and mDTI parameters or muscle fat-fraction in our DM 1 cohort, probably due to the small sample in our DM 1 group. Furthermore, we did not include sequences to analyze the water T2 times (e.g., T2 mapping) and could therefore not evaluate the absence or presence of edema. We also did not obtain biopsy data from the subjects to confirm the possible fiber atrophy.
CONCLUSION
This is the first study in which mDTI was used to investigate differences between DM 1 and DM 2. From these study results it can be postulated that the changes in muscle tissue measured by mDTI are of some relevance for the monitoring of disease progression as well as for the evaluation of therapeutic approaches.
ETHICAL STATEMENT
We confirm that we have read the Journal’s position on issues involved in ethical publication and affirm that this report is consistent with those guidelines.
CONFLICTS OF INTEREST
None of the authors has any conflict of interest to disclose.
Footnotes
ACKNOWLEDGMENTS
We thank Philips Germany, especially Burkhard Maedler for continuous scientific support. JF and LS received funding from the Deutsche Forschungsgemeinschaft, Grant/Award Number: 122679504 (TP1 to JF and TP5 to LS). MV received funding by the Heimer foundation.