
Abstract
Background:
Skeletal muscle biopsy is one of the gold standards in the diagnostic workup of muscle disorders. By histopathologic analysis, characteristic features like inflammatory cellular infiltrations, fat and collagen replacement of muscle tissue or structural defects of the myofibers can be detected. In the past years, novel quantitative MRI (qMRI) techniques have been developed to quantify tissue parameters, thus providing a non-invasive diagnostic tool in several myopathies.
Objective:
This proof-of-principle study was performed to validate the qMRI-techniques to skeletal muscle biopsy results.
Methods:
Ten patients who underwent skeletal muscle biopsy for diagnostic purposes were examined by qMRI. Fat fraction, water T2-time and diffusion parameters were measured in the muscle from which the biopsy was taken. The proportion of fat tissue, the severity of degenerative and inflammatory parameters and the amount of type 1- and type 2- muscle fibers were determined in all biopsy samples. The qMRI-data were then correlated to the histopathological findings.
Results:
The amount of fat tissue in skeletal muscle biopsy correlated significantly with the fat fraction derived from the Dixon sequence. The water T2-time, a parameter for tissue edema, correlated with the amount of vacuolar changes of myofibers and endomysial macrophages in the histopathologic analysis. No significant correlations were found for diffusion parameters.
Conclusion:
In this proof-of-principle study, qMRI techniques were related to characteristic histopathologic features in neuromuscular disorders. The study provides the basis for further development of qMRI methods in the follow-up of patients with neuromuscular disorders, especially in the context of emerging treatment strategies.
INTRODUCTION
Skeletal muscle biopsy with histopathological ana-lysis is the gold-standard in the diagnosis of muscle disorders, especially for the differentiation of inflam-matory and hereditary myopathies [1–3]. In addition to the detection of structural abnormalities like lipofibromatosis, necrosis of muscle fibers or disturbances in oxidative enzyme reaction, specific histopatholo-gical features like B- or T- lymphocyte-subtypes, macrophages or autophagy markers like p62 can be made visible to differentiate between inflammatory and degenerative myopathies. Moreover, muscular dystrophies or congenital myopathies are characterized by reduction or absence of proteins of the sarcolemma or the cytoplasm, for example dystrophin in Duchenne muscular dystrophy [2, 4]. The skeletal muscle biopsy usually requires an open surgical procedure in adult patients, as an intact sample of approximately 1 cm3 of muscle tissue is needed for proper further analysis. Due to this elaborate procedure, skeletal muscle biopsies are used for diagnostic purposes, but are not suited for clinical follow-up or to monitor treatment outcome. Therefore, non-invasive biomarkers are needed to monitor the emerging novel strategies of treatment in neuromuscular disorders.
Muscle MRI plays an increasingly important role in the diagnosis and follow-up of muscle disorders. For diagnostic purposes, conventional T1-weighted MRI scans are performed to localize fatty degeneration of muscle tissue, and T2-scans display tissue edema [5] qualitatively. T1- and T2-weighted images are thus helpful to identify a proper location for ske-letal muscle biopsy [6], and the pattern of muscle involvement can hint at certain subtypes of myopa-thies, for example limb girdle muscular dystrophies [7–9].
In the past years, novel MRI techniques were developed to quantify fatty infiltrations (Dixon), infl-ammatory changes (T2-mapping) and indirect microstructural characteristics by the analysis of water diffusion properties in muscle fibers (diffusion tensor imaging) [5, 9]. In this context, Dixon quantification of fat tissue has been shown to be more sensitive in the detection of slight or even subclinical changes in fatty muscle alterations [9–12].
As a marker for muscle edema, increased water T2 times were found in inflammatory myopathies, reflecting the degree of inflammation [13]. In Duc-henne muscular dystrophy, water T2 was increased as a marker of early disease activity even prior to fat replacement. Apart from that, T2 and proton density (PD) are potential parameters to track response to therapy [14].
In the recent years, many studies were performed to correlate Dixon, T2-mapping or other quantitative MRI methods to hereditary or inflammatory myopa-thies. However, up to now, there is no study that compared the qMRI-outcome measures in humans to histopathological findings, which are still referred to as standard in the diagnostic procedure of muscle disorders. Recent animal studies gave first hints at a correlation between qMRI- and histological parameters [15].
Thus, the aim of this study was to validate novel and complimentary quantitative MRI (qMRI) techni-ques (Dixon, T2-mapping, diffusion tensor imaging) with well-established histopathologic parameters used in the diagnostic workup of muscle disorders (Fig. 1).
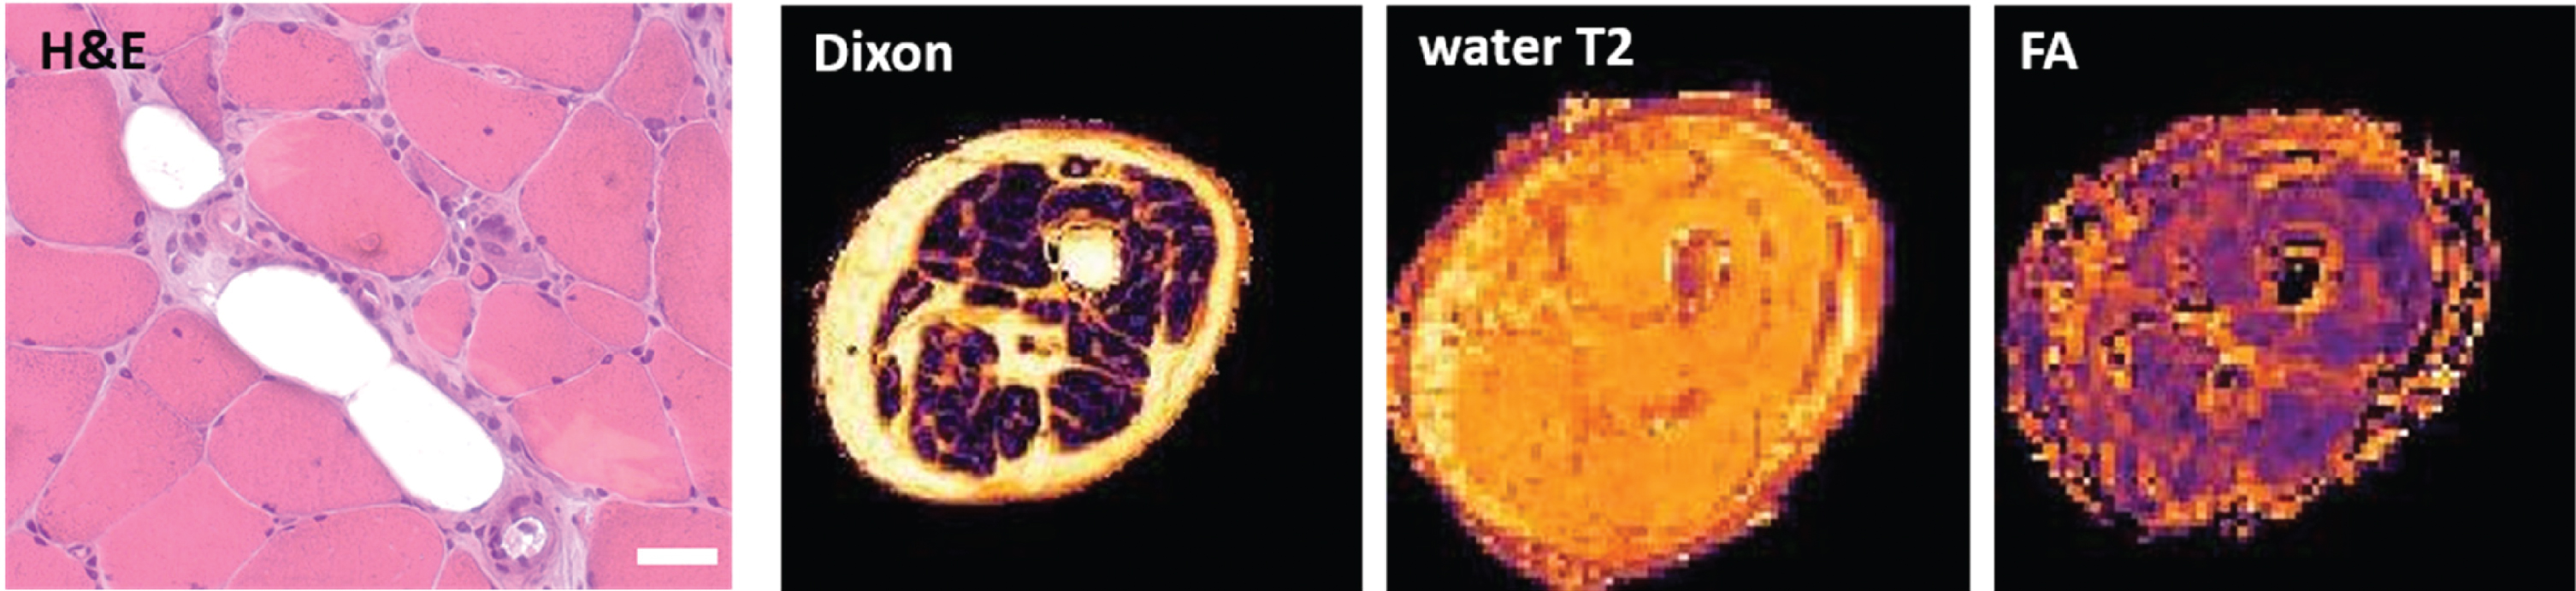
Skeletal muscle biopsy and corresponding qMRI scans of the right vastus lateralis muscle (patient 5). Histopathologic analysis (left, here showing an H&E staining) was compared and correlated to qMRI scans, including Dixon, water T2-time (water T2) and fractioned anisotropy (FA). Scale bar = 50μm
MATERIALS AND METHODS
Patients and muscle biopsies
All patients included in this study underwent open skeletal muscle biopsy for diagnostic purposes in the clinical routine and were inpatients. Clinical features of all participants as well as the investigated muscles are listed in Table 1. Final clinical diagnosis was made according to [3, 17]. The age of the patients ranged from 24–69 years, with 6 male and 4 female patients. The patients were informed about the qMRI method and could optionally agree to undergo the MR examination one day prior to the biopsy (during their hospital stay). The study was approved by the Ethics Committee of the Ruhr University Bochum (reg. no: 15-5281). Written informed consent was obtained from all participants.
Clinical features of the patients included in the study
M: male, F: female. I: inflammatory infiltrations, V: vacuolar alterations of myofibers, F: FYCO 1-aggregates, M: Myotilin-positive intracellular protein aggregates. CK: creatin kinase, sIBM: sporadic inclusion body myositis.
Quantitative Muscle MRI and processing
The MR exam was performed on a Philips Achieva 3 T X-Series Scanner (Philips Healthcare, Best, The Netherlands) using a 16 CH Torso XL Coil. All pat-ients were positioned in the MR scanner in a supine feet first position, with cushions and sandbags sup-porting their knee and feet in a comfortable position. Depending on the localization for the planned bio-psy, a 15 cm (in z-direction) Field of view (FOV 480×276×150 mm3) was placed 60 mm distal of the tibial plateau or 90 mm proximal of the medial condyle, perpendicular to the bone. The scanning protocol included a multi-echo spin echo (MESE) sequence with 17 echoes for quantitative water mapping with a voxel size of 3×3×6 mm3, a 6 mm slice gap, TR: 7650 ms, TE 17×Δ7.6 ms; a spin-echo EPI diffusion-weighted sequence with 42 gradient orientations and 8 different b-values ranging from 0–600 with a voxel size of 3×3×6 mm3, TR/TE: 5000/57 ms; and a 4-point Dixon sequence with a voxel size of 1.5×1.5×6 mm3, TR: 210 ms, TE: 2.6/3.36/4.12/4.88 ms, yielding a total acquisition time of approximately 12 minute [18]. All data pro-cessing was performed using QMRITools (github.com/mfroeling/QMRITools) running under Mathematica 11 and was fully automated (i. e. no user interaction was needed other than manual muscle segmentation) akin to Schlaffke et al. [18]. In short, all data were motion corrected, the water T2 estimation was performed using an extended phase graph fitting approach [19]. For the estimation of the diffusion metrics, the intravoxel incoherent motion was taken into account [20, 21] and the tensor was calculated using an iterative weighted linear least-square algorithm (WLLS) [21]). The Dixon data were processed using an iterative decomposition of water and fat with echo asymmetry and least squares estimation (IDEAL) [22] using eight reference fat peaks [23]. Subsequently, the muscle in which the biopsy was performed was manually delineated slice by slice. Using this mask, the mean value of the estimated water T2, the fat fraction as well as the diffusion metrics (including fractional anisotropy-FA and mean diffusivity –MD) were derived. Figure 2 shows axial slices of the leg muscles of the derived quantitative parameter maps for all 10 patients.
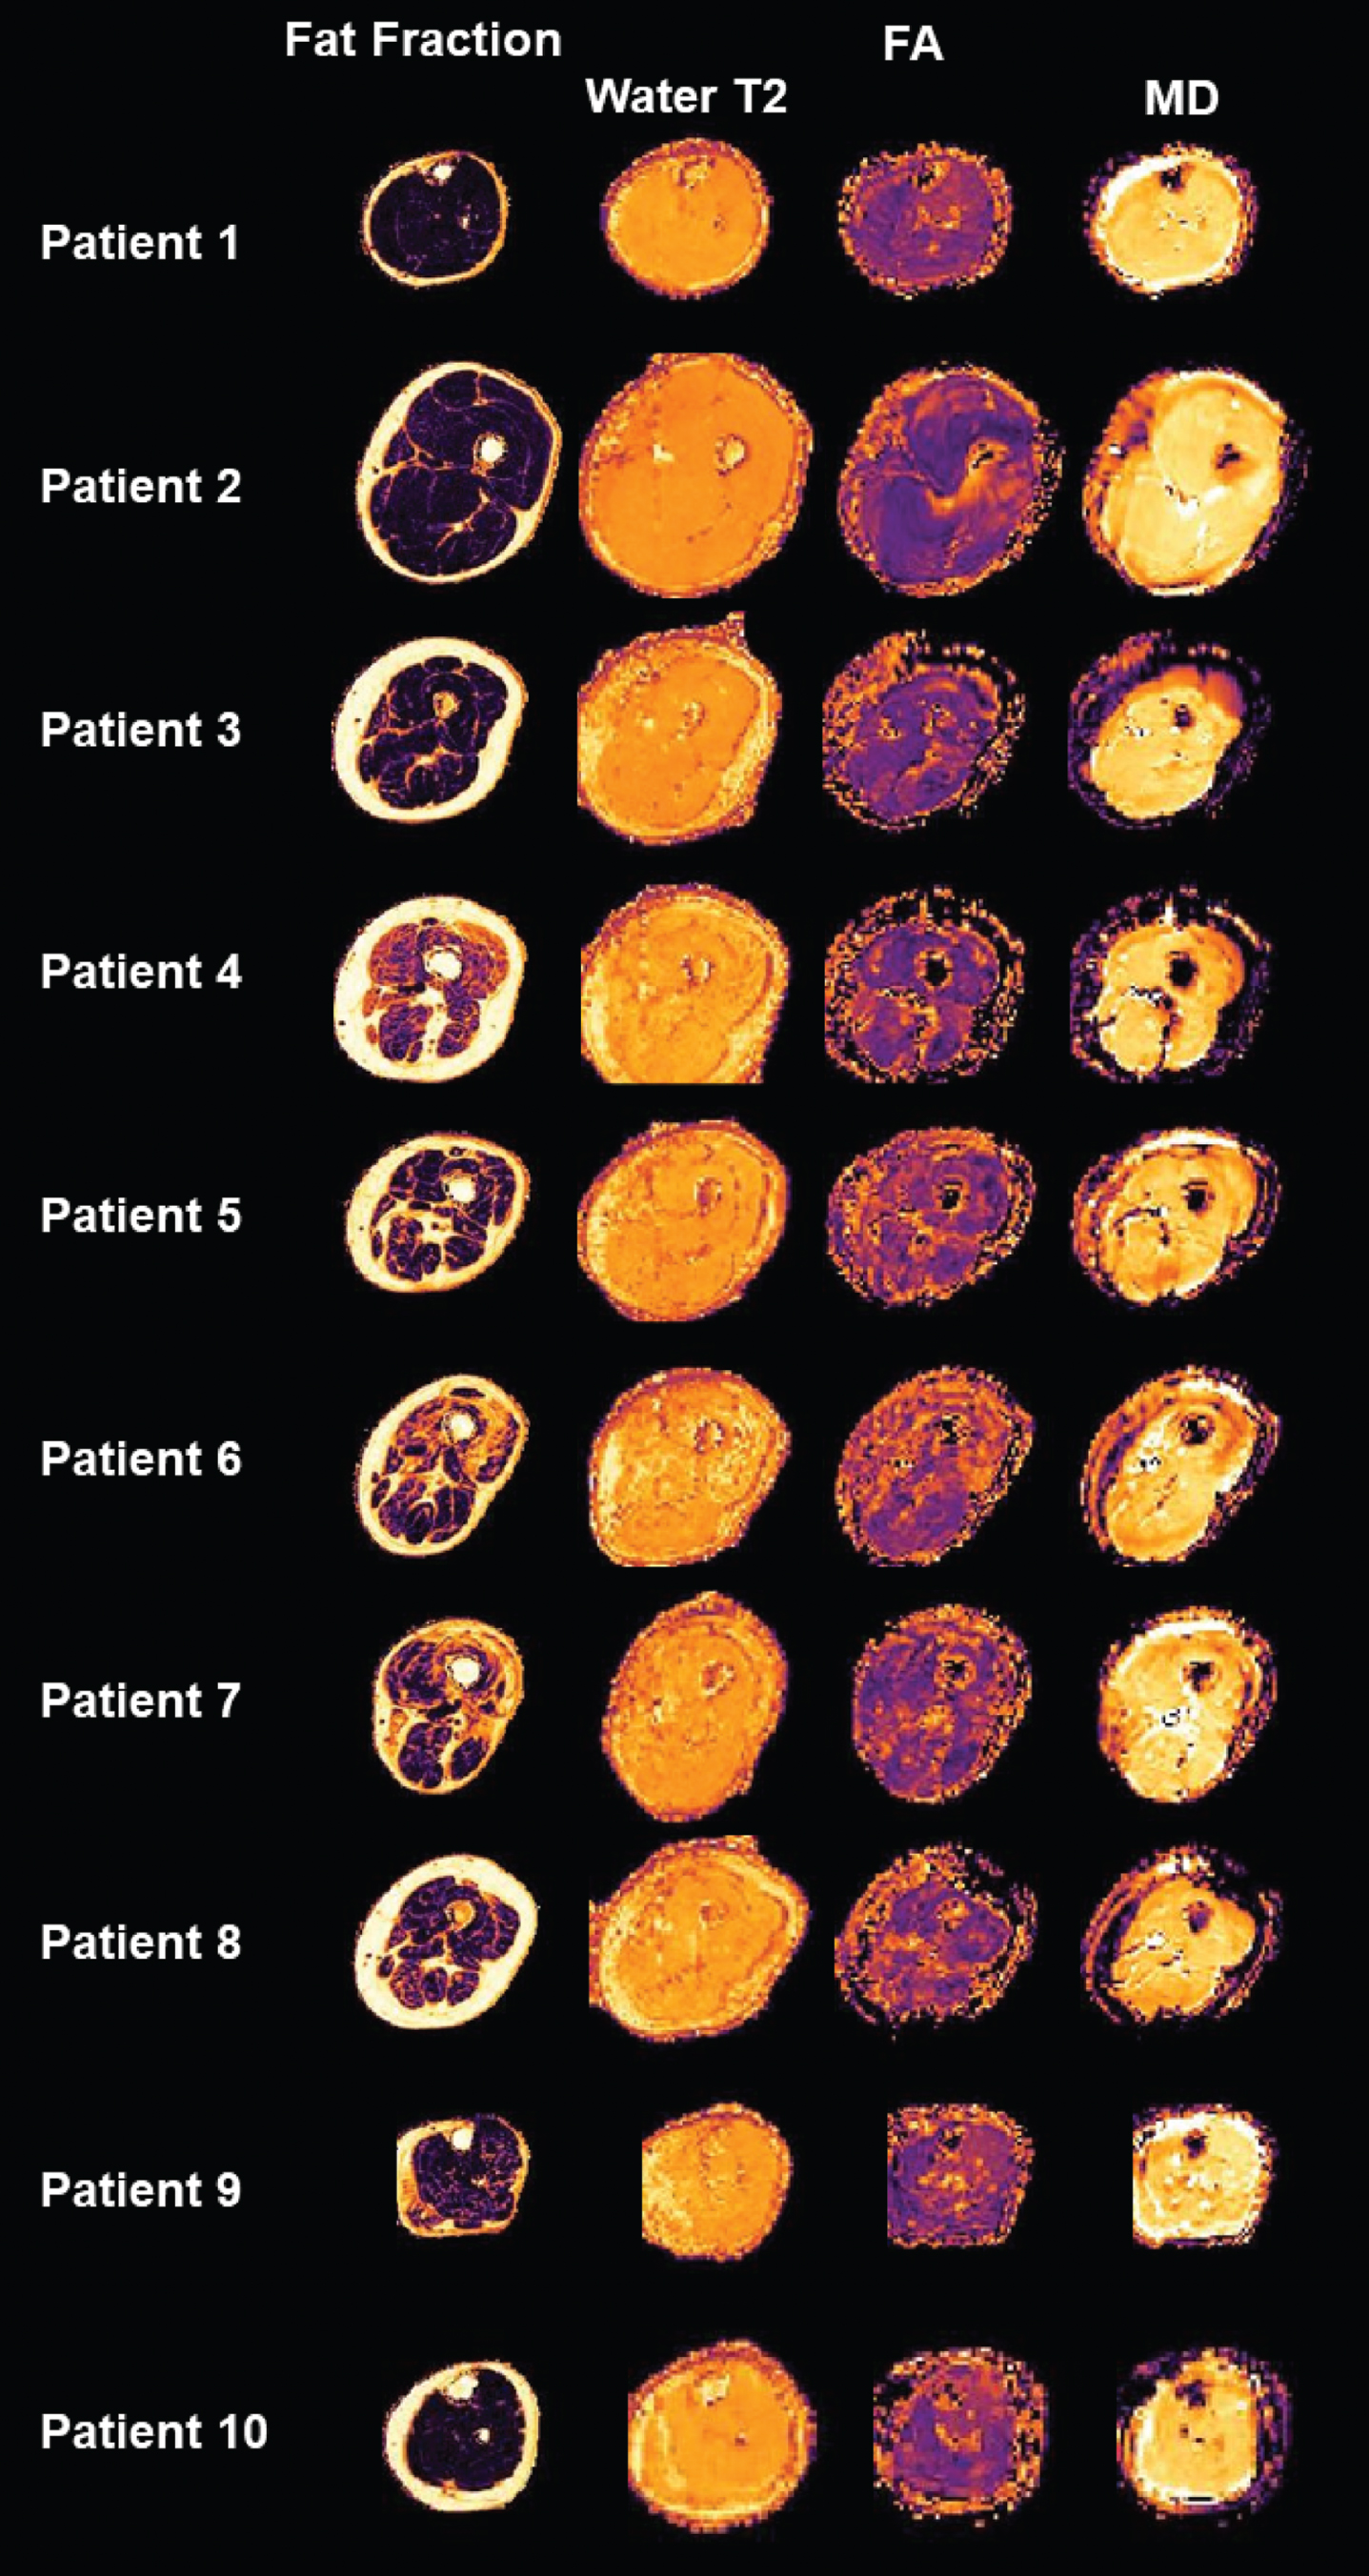
Overview of the quantitative maps of all patients. Axial slices of the leg muscles displaying fat fraction, water T2-time, fractioned anisotropy (FA) and mean diffusivity (MD).
Histological and immunofluorescence studies
A schematic overview of the qMRI and the corresponding histopathological investigations is given in Fig. 1.
After surgical procedure, skeletal muscle biopsies were divided into 0.5 cm3 samples, embedded into tissue freezing Medium (Leica Microsystems, Wetzlar, Germany), and snap frozen in liquid nitrogen-cooled isopentane.
Hematoxylin and eosin (H&E) stainings were performed according to standard procedures [24].
Immunofluorescence studies were performed on muscle samples as described [25, 26]. Serial skeletal muscle cryosections of 10μm thickness were fixed, permeabilized, blocked, and incubated overnight at 4°C with the primary antibodies listed in supple-mentary Table 1. All primary antibodies were diluted in 2%bovine serum albumin (BSA) in phosphate- bu-ffered saline (PBS) for immunofluorescence. Alexa Fluor 488-conjugated goat anti-mouse IgG (dilution 1:1,000, #115-545-146) and goat anti-rabbit IgG (dilution 1:1,000, #111-545-144), goat anti-mouse IgG2b human ads-Alexa Fluor 488 (dilution 1:1,000, #SBA-1090-30) and goat anti-mouse IgG1 TRITC (dilution 1:1,000, #ABIN 37652) were used as secondary antibodies. In Fig. 3, samples of a repr-esentative patient were chosen to display the histo-pathological stainings performed in this study. Stainings for type 1- and type 2- muscle fibers are shown for two patients in Fig. 4.
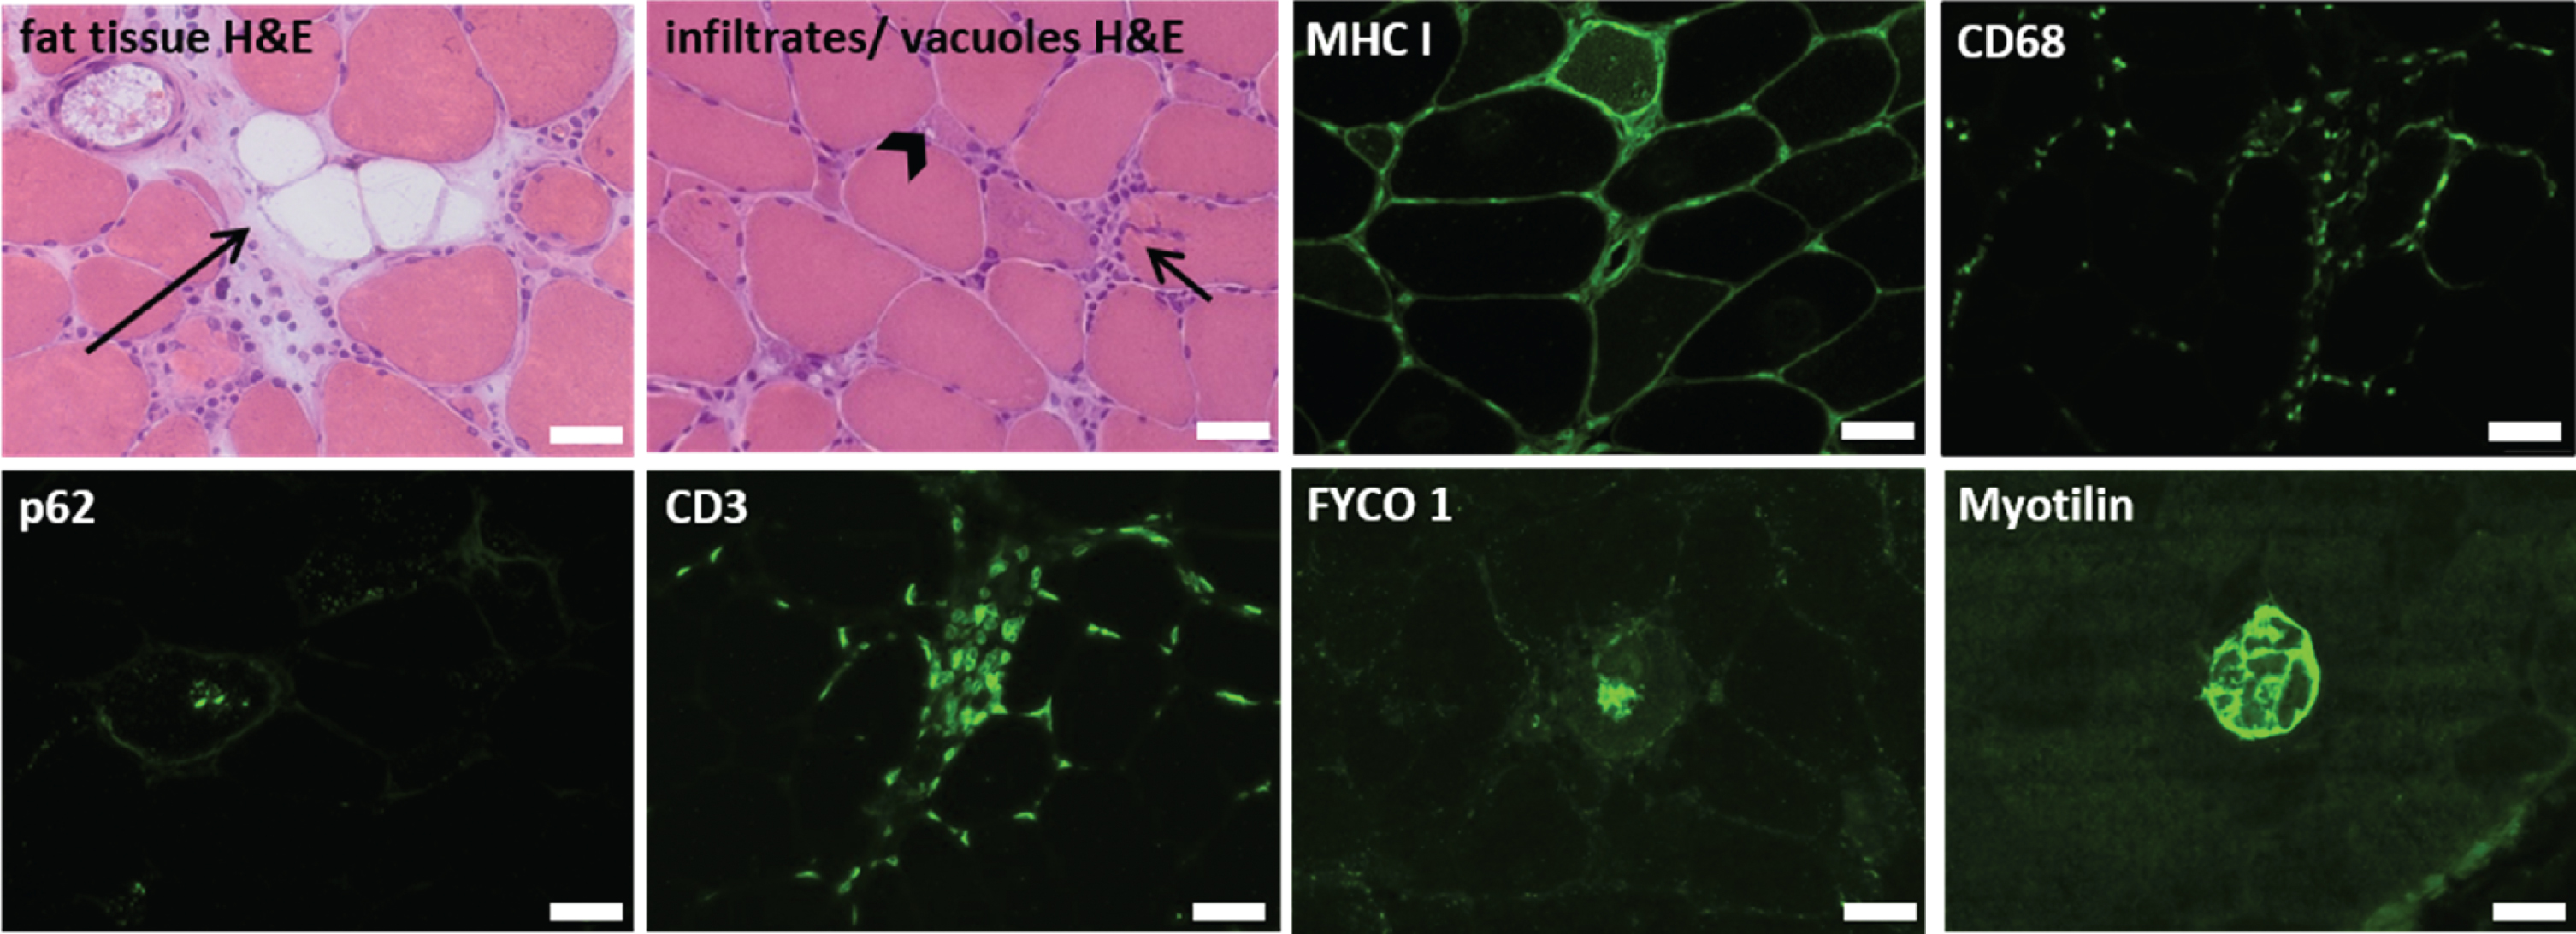
Overview of the histopathologic stainings, from a representative patient (patient 5 in Table 1). Fat tissue (long arrow), cellular infiltrations (short arrow) and vacuoles (arrowhead) were displayed in H&E-stainings. MHCI, CD3, CD68, p62, FYCO 1 and Myotilin were visualized by specific immunofluorescence antibodies. Scale bars = 50μm
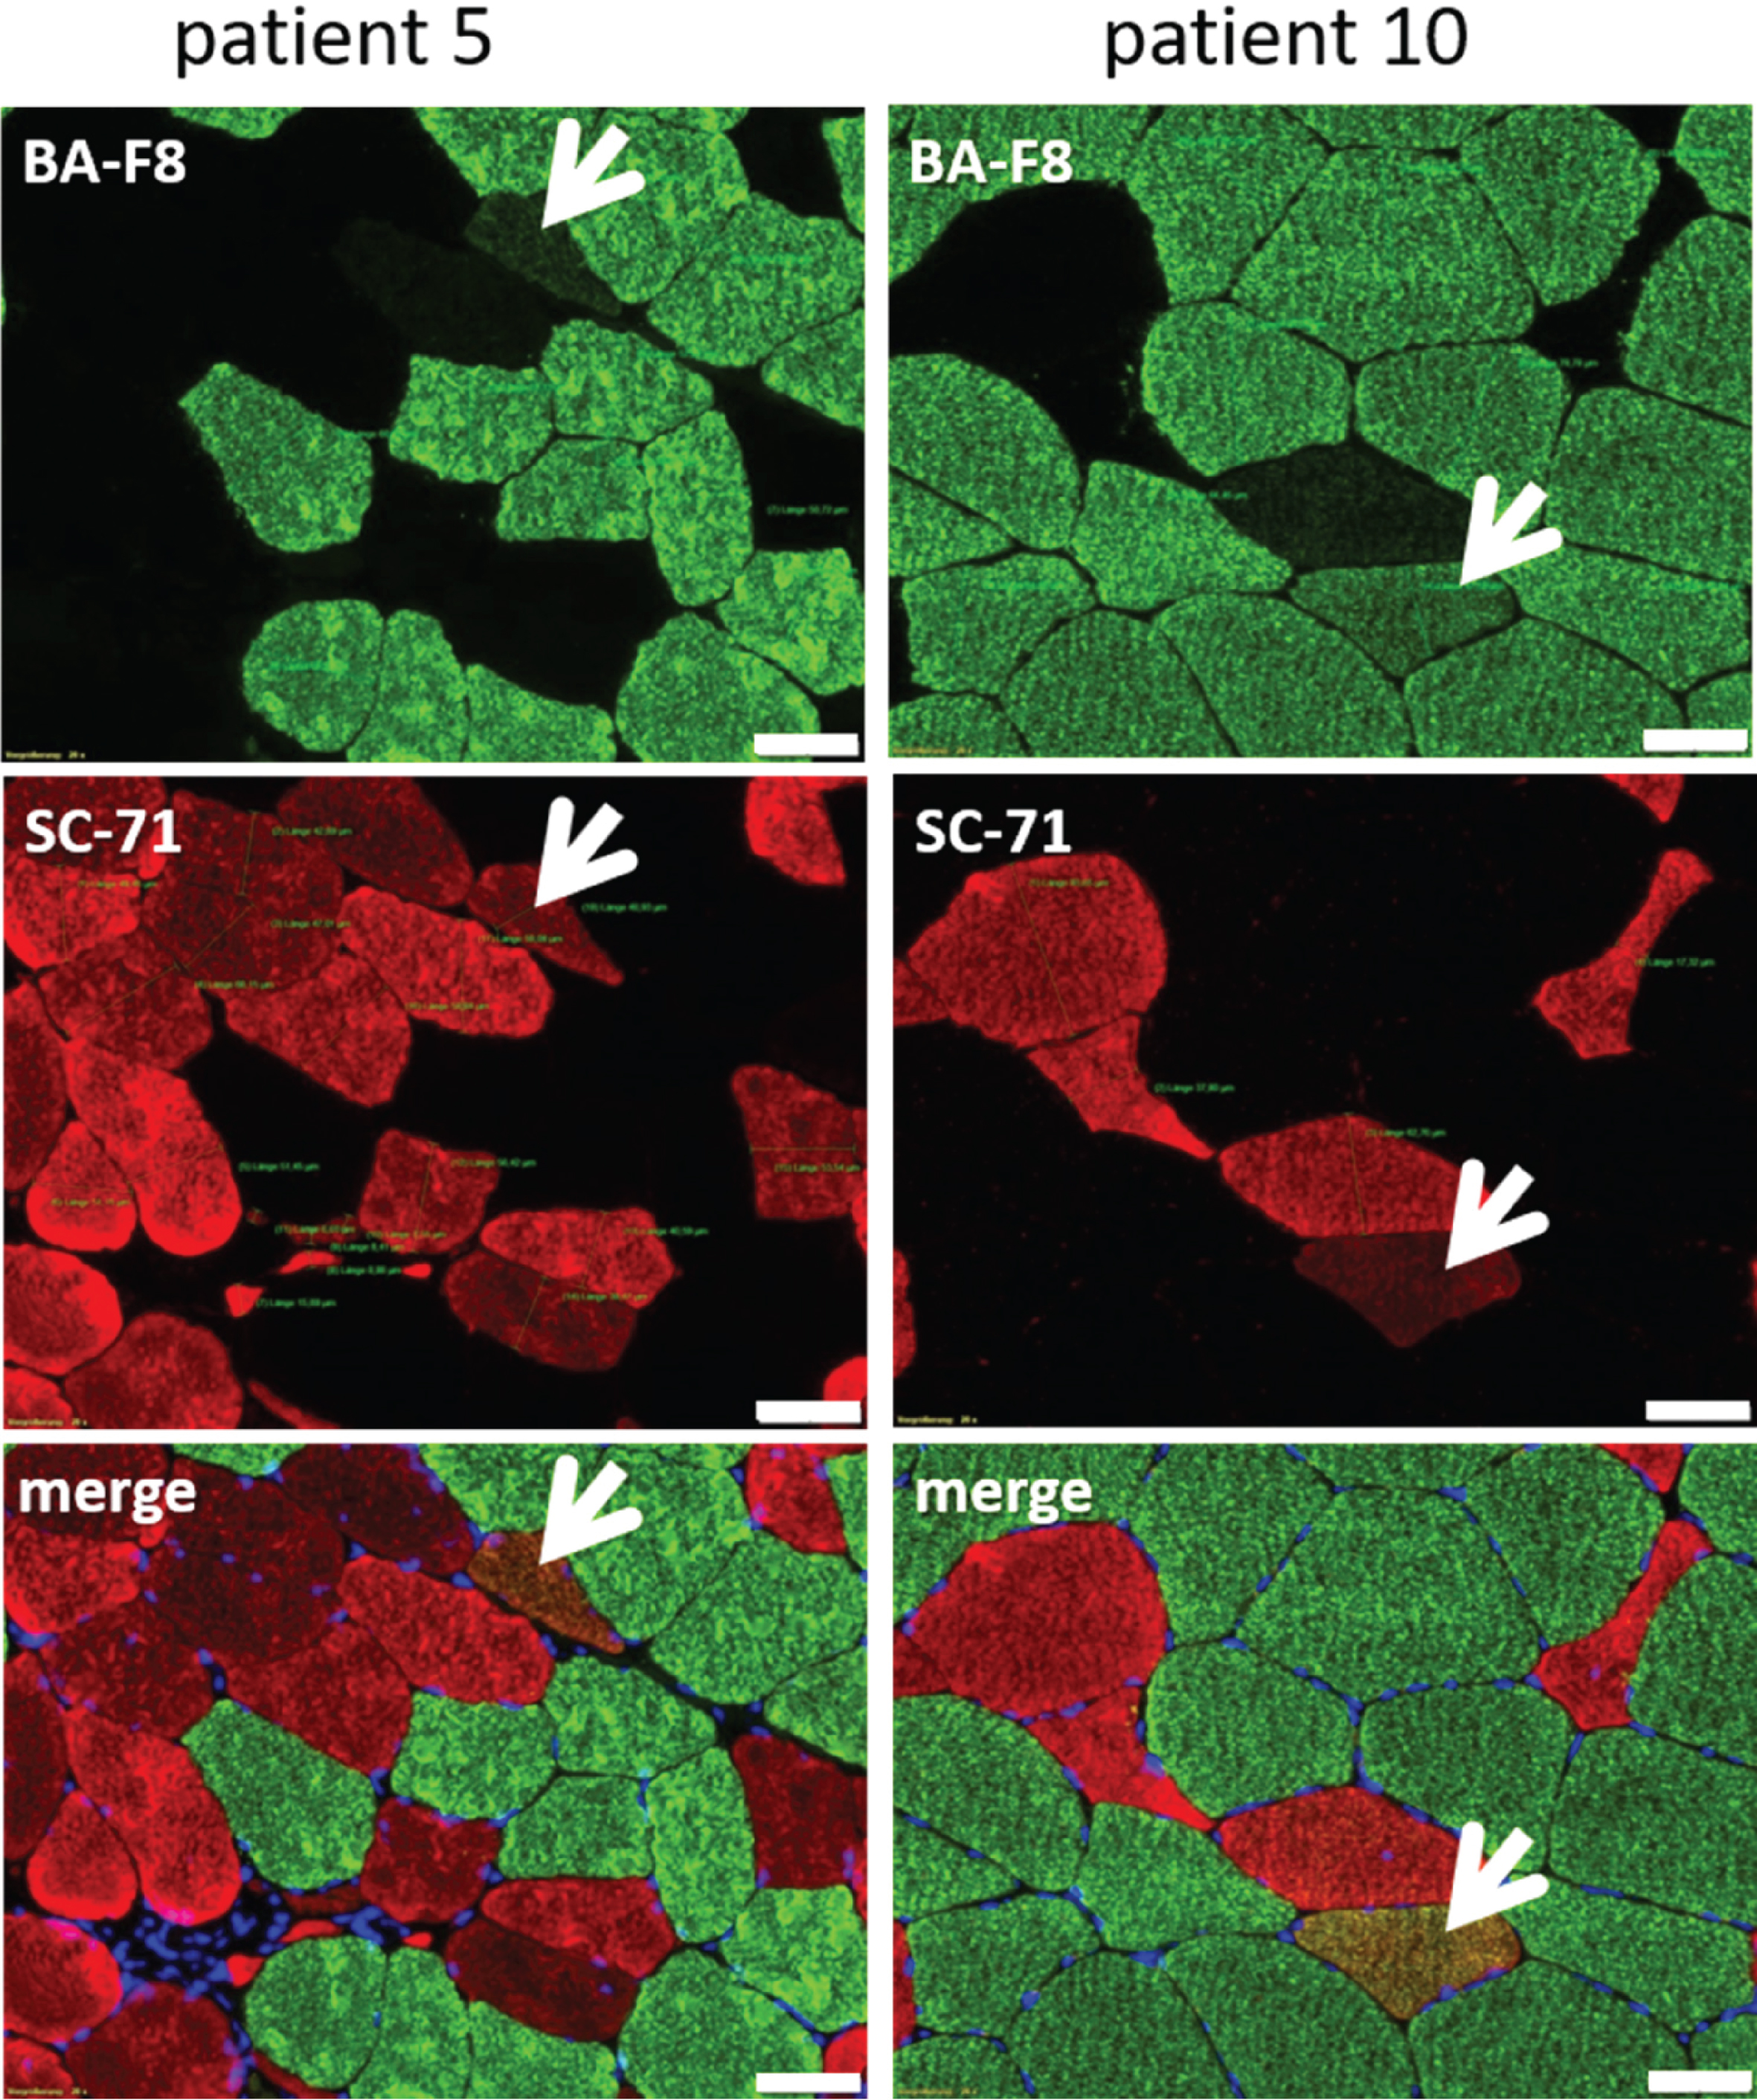
Differentiation of type 1- and type 2- muscle fibers. Specific antibodies against type 1- (BA-F8, green) and type 2- (SC-71, red) muscle fibers differentiate between fiber types. Patients with myopathic changes (myositis, muscular dystrophy) also have BA-F8/SC-71 + /+muscle fibers (hereafter called “hybrid muscle fibers”, indicated by white arrows). Type 1- and type 2- muscle fiber diameter was measured from BA-F8 and SC-71 stainings. The numbers of the selected patients correspond to those in table 1. Scale bar = 50μm
Quantification of histological parameters
For measurements of fat tissue in the muscle biopsy, two cross sections stained with H&E were scanned using a Leica microscope with the provided software (LMD6500, Leica Microsystems, Wetzlar, Germany). The area of fat tissue and of the total cross-sectional area of the muscle biopsy was measured in each section. Mean values of fat tissue and cross-sectional area from both sections as well as the proportion of fat in the cross-sectional areas were calculated.
Muscle fiber diameters of type 1- and type 2- muscle fibers were measured with the Leica microscope LMD 6500 and the provided software (LMD6500, Leica Microsystems, Wetzlar, Germany). The muscle fiber diameter was defined as the widest distance between the opposite sides of the fiber. The minimal, maximal, and mean diameters of each type 1- and type 2- muscle fibers were determined. The number of type 1-, type 2- and muscle fibers with both features (hereafter called “hybrid muscle fibers”) was counted and added in 3 independent visual fields with a 20-fold magnification (see Fig. 4). The degree of histopathological “vacuolar” and “inflammatory” alterations as well as the intensity of the immunofluorescence markers for MHCI, CD3, CD68, p62, FYCO1 and Myotilin were categorized in the three categories ”normal”, “slight to moderate increase”, ”strong increase”. Presence of vacuoles, cellular infiltrations as well as MHCI, CD3, CD68, or aggregate formations of p62, FYCO I and Myotilin in each individual are listed in Table 1.
Statistical analysis
All statistical analysis was performed using IBM SPSS statistics V25. In a first approach, each qMRI-parameter was correlated with the putatively corresponding histopathological parameter (e.g. fat fraction (Dixon) with: fat fraction in cross section, amount of Myotilin-positive aggregates, amount of hybrid muscle fibers; water T2-time with: amount of CD68-positive macrophages, amount of vacuoles, amount of p62-positive aggregates; fractioned anisotropy (FA) with: amount of type 1-fibers, fat fraction in cross section, amount of hybrid muscle fibers). Putative corresponding parameters from the qMRI analysis and the histological analysis were compared using Spearman correlation analysis with a significance level of p < 0.05.
RESULTS
Three of the ten patients included in this study had unspecific changes on histopathology, one had features of a muscular dystrophy (hereafter named as “dystrophic changes”), three showed the histopathological features of sporadic inclusion body myositis (hereafter referred to as “sIBM”), and 3 were described as “myositis other than sIBM”.
In a first approach, the proportion of fat tissue in the skeletal muscle biopsies was measured and compared to the fat fraction in the qMRI-scan, which was calculated for the whole muscle from which the biopsy was taken. Fat fractions calculated from the qMRI-data correlated significantly with the proportion of fat tissue in the skeletal muscle biopsy sample (Fig. 5A) (r = 0.842, p = 0.002). Fat fraction in the qMRI-scan also tended to be associated with Myotilin-positive aggregates as a marker for degeneration of muscle cells as well as with the amount of hybrid muscle fibers, but without statistical significance (Fig. 5A).
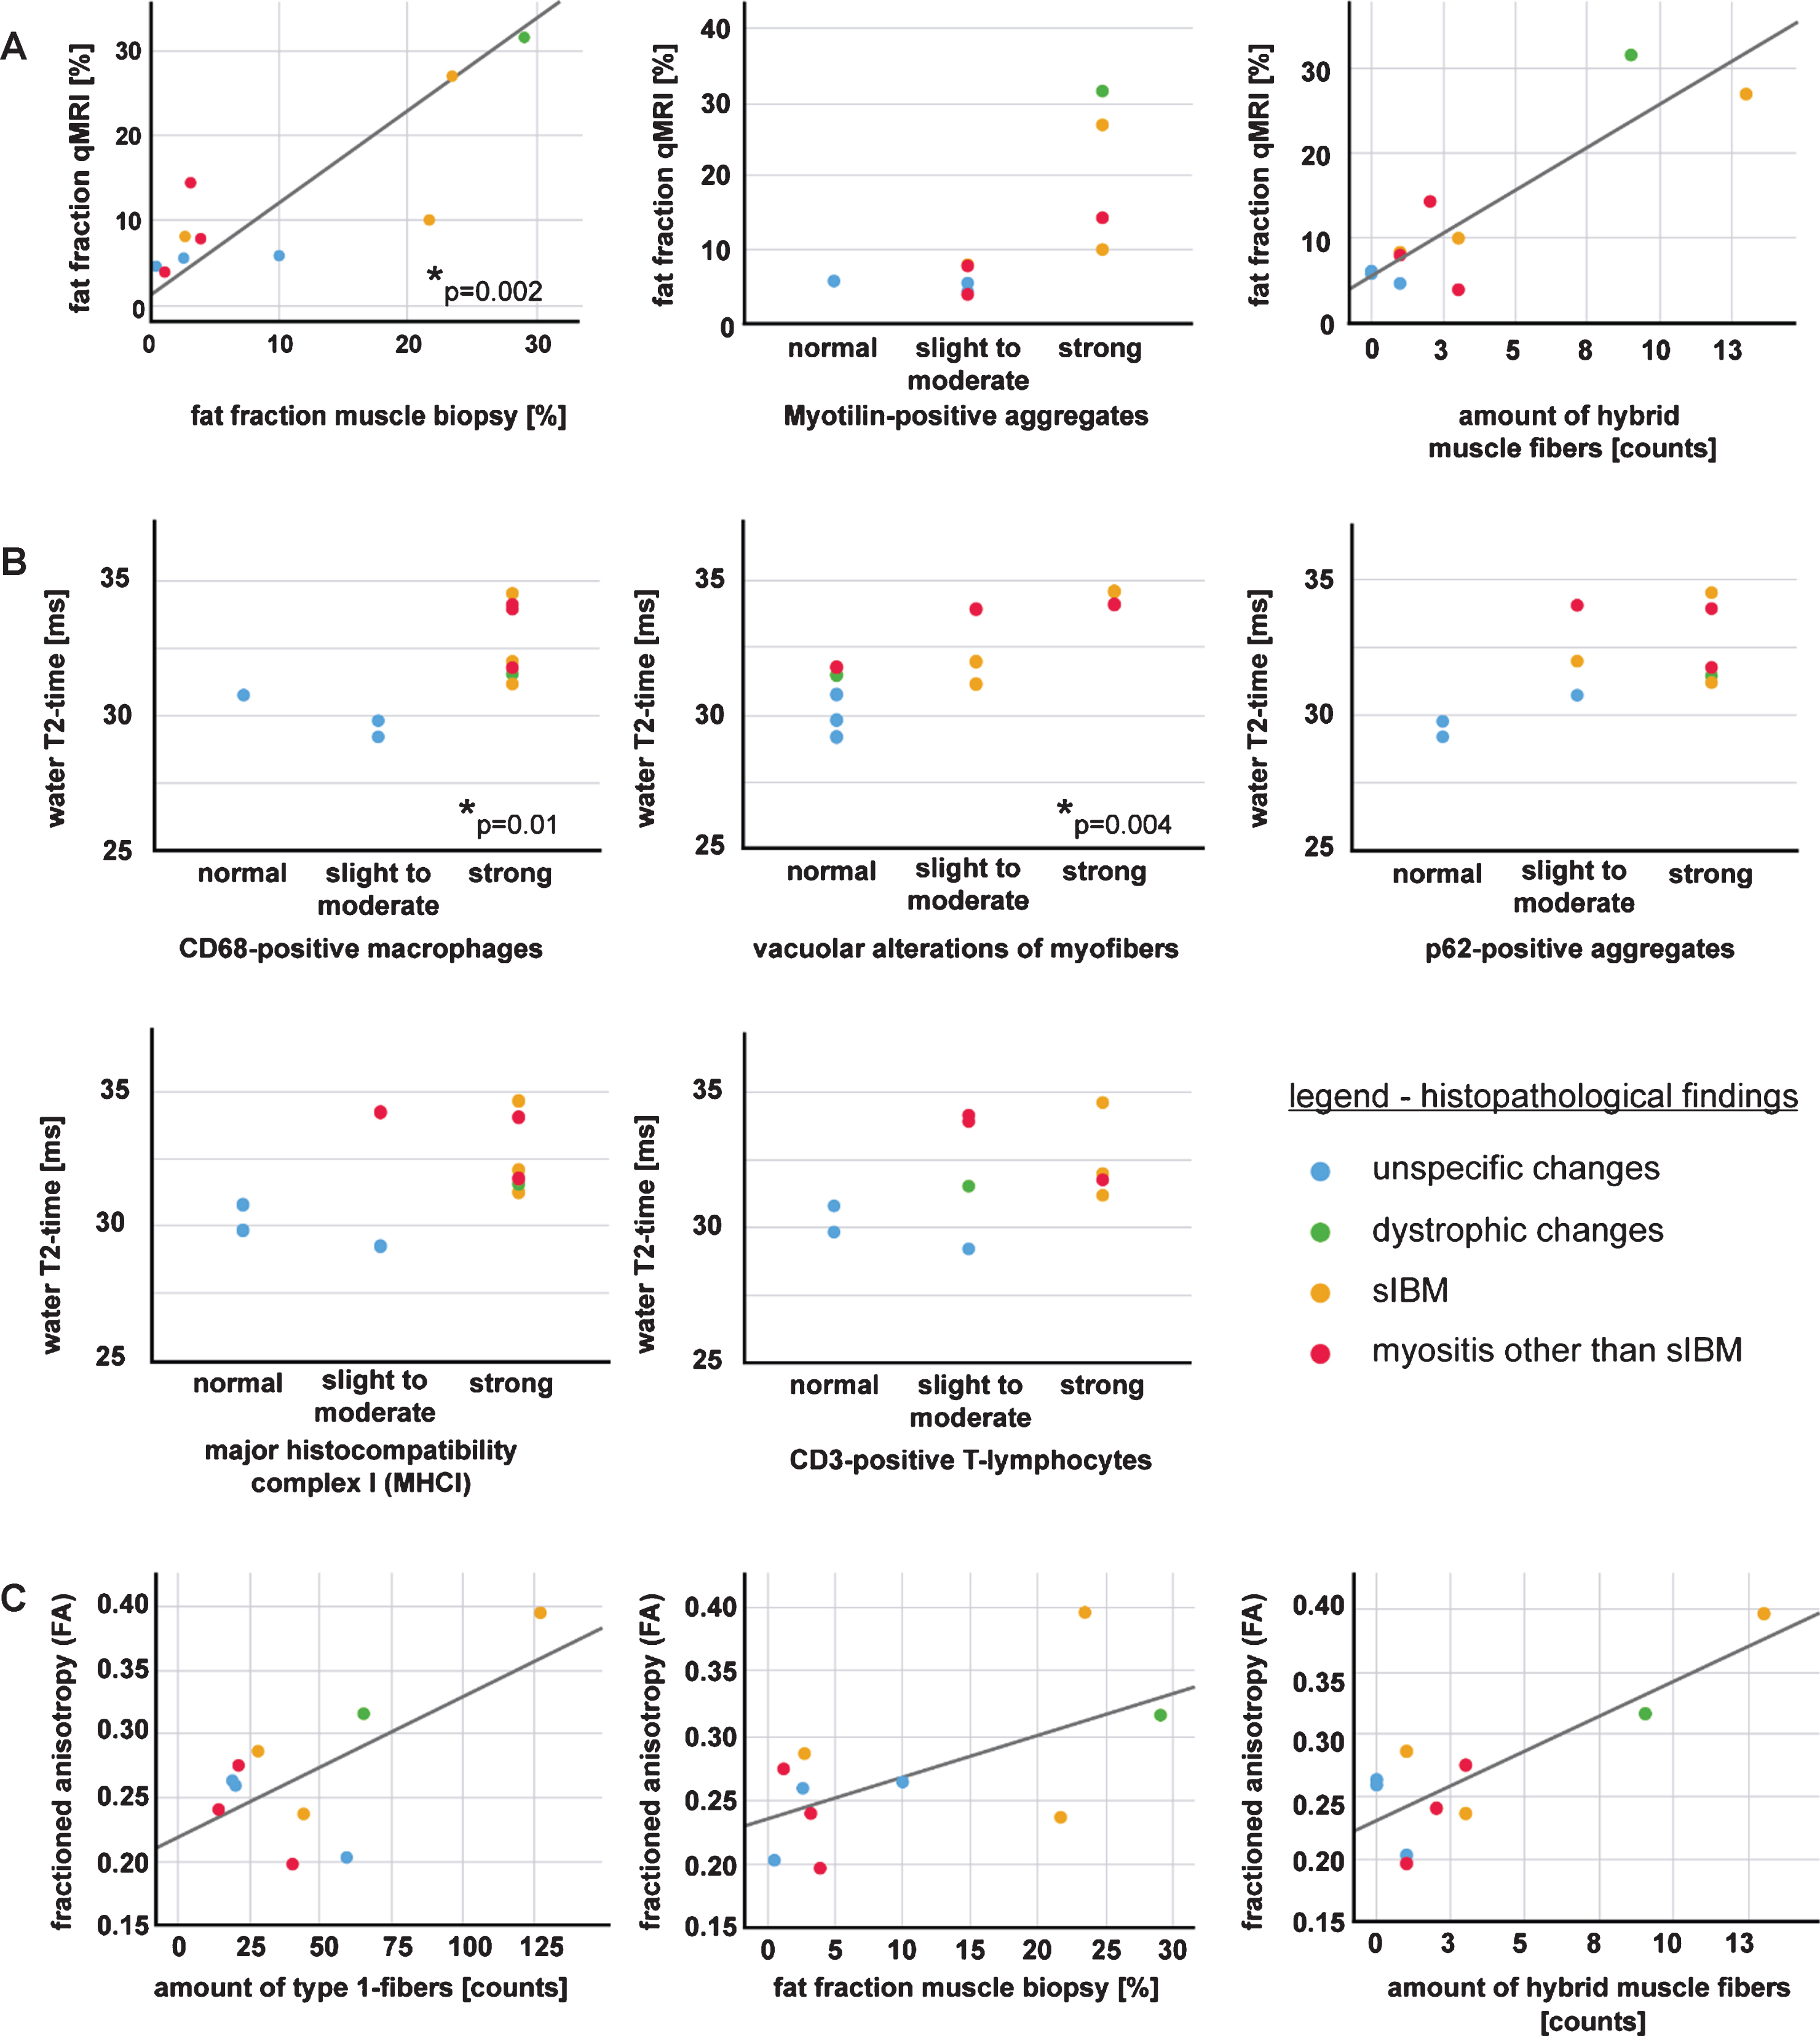
Correlations of qMRI-parameters with histopathological findings in skeletal muscle biopsies. Parameters which correlate significantly are marked with *. Regression lines are shown only when metric variables are compared. A: Fat fraction in qMRI and skeletal muscle biopsy, fat fraction and Myotilin-positive aggregates and amount of hybrid muscle fibers. The proportion of fat tissue in the skeletal muscle biopsy section correlated significantly with the calculated fat fraction in the MRI scan (r = 0.842; p = 0.002), correlation with Myotilin-positive aggregates and amount of hybrid muscle fibers lack statistical significance. B: The water T2-time correlates significantly with the amount of CD68-positive macrophages (r = 0.764, p = 0.01), and with the presence of cytoplasmic vacuoles (r = 0.816, p = 0.004); correlation with p62-positive aggregates, CD3-positive T-lymphocytes and major histocompatibility complex I (MHCI) lack statistical significance. C: An increase of the fractioned anisotropy (FA) tends to be associated with the amount of type 1-fibers, fat fraction in muscle biopsy and amount of hybrid muscle fibers, but without statistical significance.
Regarding the subgroups, patients with muscular dystrophy and two of the sIBM- patients showed the highest amount of fat tissue in qMRI and on muscle biopsy (2.7%–29%on muscle biopsy and 8.2%–31.6%for the whole muscle in qMRI). Patients with unspecific changes and myositis (other than sIBM) had the lowest fat fraction in both qMRI and the proportion of fat tissue in the muscle biopsy (0.5%–10%and 4.6%–10.1%for the whole muscle in qMRI).
Next, we analyzed the water T2-time as a parameter for tissue edema, and compared it to typical histopathological features associated with inflammation, i.e. endomysial cellular infiltrations and markers for major histocompatibility complex I (MHCI), CD3-positive T-lymphocytes (CD3) and CD68-positive macrophages (CD68). Our data show that long water T2-times (>30 ms) are associated with the presence of CD68-positive macrophages in skeletal muscle tissue (Fig. 5B). Although there was only significant correlation of water T2-time with the amount of macrophages (r = 0.764, p = 0.01), the amount of CD3-positive T-lymphocytes and the presence of MHC I at the sarcolemma was also higher in muscle tissue with a long T2-time, but without statistical significance.
As not only inflammatory changes, but also structural defects of the muscle cells might result in tissue edema, we compared the water T2-time with the amount of vacuolar alterations of myofibers and p62 as markers for tissue degeneration and autophagy. We could show that a long water T2-time correlates significantly with the amount of cytoplasmic vacuoles (r = 0.816, p = 0.004) (Fig. 5B). Long water T2-times also tend to be associated with the autophagy-marker p62, but without statistical significance.
Subgroup analysis showed that the water T2-time was increased in patients with sIBM (mean value: 32.6 ms), myositis (other than sIBM) (mean value: 33.31 ms) and the patient with dystrophic muscle tissue (31.54 ms), whereas the water T2-time in muscle with unspecific changes was normal (mean value: 29.94 ms) (see Fig. 5B and C).
The amount and the diameters of the type 1-, type 2- and hybrid muscle fibers were also correlated to qMRI-parameters. The results hint at an association of the FA (fractioned anisotropy) with the amount of type 1- muscle fibers, the fat fraction, and the amount of hybrid muscle fibers with type 1- and type 2- features, but the data lack statistical significance (Fig. 5C). Hybrid muscle fibers were only found in muscle tissue with features of myositis or muscular dystrophy (Fig. 4).
In addition, correlation of FYCO1 with fat fraction in qMRI, water T2-time and FA did not reveal any significant results, but the amount of FYCO1-aggregates tended to be associated with an increased FA (p = 0.05, data not shown).
DISCUSSION
Quantitative MRI (qMRI) is a powerful, non-invasive tool in the detection of structural muscle tissue alterations in muscle disorders. In this study, we performed muscle qMRI the day before skeletal muscle biopsy, and correlated qMRI parameters from the biopsied muscle with the histopathological findings. A comparison of skeletal muscle biopsies with the quantitative Dixon MRI method has been performed before in animal models [15]. Regarding humans, Lassche et al. compared histologic analysis of needle biopsies with routine MRI parameters [27]. In another study by Kinali et al., conventional T1-MRI sequences were compared to open skeletal muscle biopsies [28]. Both studies provided evidence that MRI changes correlate with muscle histopathology. However, histologic alterations occur before visible changes in T1- imaging, and MRI and histopathology correlated mainly in more advanced stages of the disease. Moreover, MRI parameters were assessed semi-quantitatively [27, 28]. Therefore, novel quantitative MRI sequences need to be established, in order to evaluate also early or less advanced muscle disorders.
This study was thus performed to validate putative novel qMRI parameters for the follow-up of patients with muscle disorders. The results correlated between qMRI and skeletal muscle biopsy, especially for the detection of fat replacement and tissue edema. Fractioned anisotropy tended to be associated with the amount of type 1- and hybrid muscle fibers, but the correlation was not significant. Thus, the data indicate that at least a part of the the applied qMRI-methods are able to detect features of muscle disorders. Given that follow-up studies confirm these findings, qMRI will probably provide a powerful, objective tool for clinical follow up and therapy monitoring in the future.
Our study showed a significant correlation of fat fraction in qMRI with the proportion of fat tissue in muscle biopsy. Former studies have described an increased fat fraction in several neuromuscular disorders [12, 29] which corresponds to clinical muscle function parameters [5, 29]. Correlation of qMRI fat fraction with histological proportion of fat tissue taken within 24 hours before muscle biopsy thus validated Dixon MRI as a reliable method to detect fat replacement in neuromuscular disorders.
Muscle edema cannot be shown directly in skeletal muscle biopsy. They occur as a consequence of structural lesions in the context of inflammatory or degenerative changes. Structural lesions in muscle fibers comprise for example vacuolic degeneration (sIBM), protein defects (muscular dystrophy) or inflammatory cellular invasion of non-necrotic muscle fibers (myositis) leading to muscle fiber necrosis. Necrosis initiates invasion of macrophages and other inflammatory cells [1–3], leading to tissue edema [30]. Muscle tissue with aspects of inflammatory as well as degenerative changes is characterized by a longer water T2-time in qMRI, which has already been established as a marker of tissue edema associated with active muscle degeneration and a method suitable for longitudinal follow-up [13, 31–34]. The correlation of water-T2 with histopathologic parameters like CD68 or the amount of vacuoles can thus be regarded as a marker for the activity of the disease, as had already been postulated by Carlier et al. in inflammatory myopathies [35]. As correlation was only significant for CD68-positive macrophages and the amount of vacuoles but not for the autophagy marker p62, the data will have to be further evaluated in a larger cohort. Follow-up studies with more study participants and an MRI exactly of the biopsied muscle area are currently underway to further investigate this point.
Previous studies have postulated a correlation of the qMRI-parameter FA and λ1 with muscle fiber atrophy [29, 36–38]. In this study, we correlated the amount and distribution of fiber types and fiber diameter to qMRI-parameters. There was a slight hint at an association of the FA (fractioned anisotropy) with the amount of type 1- and hybrid muscle fibers, as well as with FYCO1-aggregates, but the data lack statistical significance, probably due to the small number of study participants. The small sample size is a limitation of this study, and larger studies with more participants will be needed to further investigate this point in more detail. The current project is a first pilot study, showing first correlations between qMRI and histological parameters. Thus, we will integrate the qMRI-protocol in the diagnostic workup and correlate it to skeletal muscle biopsy parameters, in order to validate it on larger numbers of study participants.
Moreover, the qMRI parameters were calculated from the whole muscle, from which the biopsy was taken, whereas the skeletal muscle biopsy only represents a small piece of it. Therefore, a correlation of the parameters is limited. In the follow-up study, the qMRI-parameters only of the biopsied region will be correlated to the histologic parameters of the skeletal muscle biopsy.
Validation is also useful for the description and follow- up of animal models in the context of novel treatment strategies, i.e. gene therapy of LGMD. First studies hint at a correlation between qMRI techniques and histopathology in different species [15]. As tissue parameters can be expected to be comparable between different species, the data provided in this pilot study will be helpful also in the follow-up of animal models of myopathies.
To conclude, we evaluated the relation of novel qMRI techniques (Dixon and water T2-time) to characteristic histopathologic features of muscle disorders. The study provides the basis for further development of qMRI methods and interpretation of qMRI parameters in the follow-up of patients with muscle disorders, especially in the context of emerging treatment strategies.
Footnotes
ACKNOWLEDGMENTS
We thank Philips Germany for continuous scientific support and specifically Dr. Burkhard Mädler for valuable discussion. JF, LS and MT received funding from the “Deutsche Forschungsgemeinschaft” Project number 122679504 SFB874 (TP-A1 to MT and JF, TP-A5 to LS).
CONFLICTS OF INTEREST
The authors have no conflict of interest to report.