
Abstract
Background:
Muscle MRI protocols have been developed to assess muscle involvement in a wide variety of muscular dystrophies. Different muscular dystrophies can involve muscle groups in characteristic patterns. These patterns can be identified in muscle MRI in the form of fatty infiltration.
Objective:
This study was conducted to add the existing knowledge of muscle MRI in GNE myopathy and evaluate the correlation of muscular involvement with different gene mutations.
Methods:
The MRI scans of the 18 GNE patients were analyzed retrospectively. Cluster analysis was done for grouping the muscles and patients.
Results:
The four muscles with the highest fat infiltration were adductor magnus, tibialis anterior, semitendinosus, and semimembranosus. Furthermore, three clusters of muscle involvement were found, including cluster 1, typical muscle involvement indicating muscles with the highest infiltration: extensor digitorum longus, gracilis, biceps femoris, soleus, gastrocnemius medial, adductor longus, tibialis anterior, adductor magnus, semimembranosus, semitendinosus; cluster 2, less typical muscle involvement indicating muscles with intermediate fat infiltration, peroneus longus, gastrocnemius lateral, and minimal fat infiltration in most of the patients, i.e., tibialis posterior; and cluster 3, atypical muscle involvement with low-fat infiltration: rectus femoris, sartorius, vastus intermedius, vastus medialis, and vastus lateralis.
Conclusions:
This study found three clusters of muscle involvement and three groups of patients among GNE patients. Hamstring muscles and the anterior compartment of the lower leg were the muscles with the highest fat infiltration. Moreover, a weak genotype-muscle MRI association was found in which tibialis posterior was more involved in patients with the most frequent mutation, i.e., C.2228T > C (p.M743T) mutation; however, this finding may be related to longer disease duration.
INTRODUCTION
Hereditary inclusion-body myopathies (h-IBMs) were introduced in 1993 as a group of autosomal recessive or dominant muscle disorders with different clinical phenotypes. These disorders share a similar muscle pathology to sporadic inclusion-body myositis and accumulations of β amyloid protein [1, 2]. In the early 2000s, UDP-N-acetylglucosamine 2-epimerase/N- acetylmannosamine kinase (GNE) gene mutation was found as the most common cause of this disorder [3].
The muscular weakness of GNE myopathy usually starts in the distal muscles of the lower extremities, usually in late adolescence or early adulthood [4]. The proximal muscles of the lower limbs and eventually upper extremities become involved with disease progression. The only exception is that the quadriceps muscle is relatively spared in this disease [4]. The laboratory or electrodiagnostic features are not specific in GNE myopathy as serum creatinine kinase (CK) may be normal or slightly elevated, and electromyography may show mixed myopathic and neuropathic features [4].
In the past decade, muscle MRI protocols were developed to assess muscle involvement in a wide variety of congenital myopathies and muscular dystrophies [5–7]. Previous studies have demonstrated that different inherited myopathies can involve muscle groups in characteristic patterns, and diagnostic algorithms can be designed based on these distinguishing features [8].
To the best of our knowledge, only one study has exclusively discussed the MRI findings of GNE patients [9]. In this study, the duration of disease, was over 10 years (up to 28 years) in more than 50 percent of patients, and characteristic features were demonstrated, including fatty infiltration of the short head biceps femoris muscle always accompanied by less severe involvement of the gluteus minimus, tibialis anterior, extensor hallucis and digitorum longus, soleus, and gastrocnemius medialis [9].
Although a previous study [9] suggested a particular muscular involvement pattern for GNE myopathy, the data is still limited. Moreover, it is not known whether different mutations have different MRI patterns. The main objective of the present study was to find characteristic MRI patterns in Iranian GNE patients and to evaluate the possible association of muscular involvement patterns with different mutations.
PATIENTS AND METHODS
Eighteen Iranian patients with genetically proven GNE myopathy were included in this study. All subjects were assessed and followed in Shariati Hospital, Tehran. All participants provided informed consent, and the Ethics Review Board of Tehran University of Medical Sciences approved the study.
Demographic data, including age, gender, and disease duration, were collected. Disease duration was calculated based on the onset of muscle weakness. Three neurologists with experience in neuromuscular disorders (SN, FF, HS) examined the patients, and muscle strength was assessed in lower limbs using Medical Research Council (MRC) muscle testing scale through hip flexion, knee extension, and foot dorsiflexion and plantar flexion.
Muscle MRI
The MRI scans of the patients were analyzed retrospectively. All scans were performed using the Siemens MAGNETOM Avanto 1.5T MR scanner.
Contiguous axial slices with a thickness of 8–12 mm were obtained from the lower limbs. The standard protocol included T1 (repetition time: 300 ms, echo-time: 15 ms) and short-time inversion recovery (STIR) (repetition time 2500–3500 ms, echo time 60 ms, inversion time 150 ms sequences).
A total of 18 muscles were analyzed on each side (36 in total) in each patient, including vastus medialis (VM), vastus lateralis (VL), vastus intermedius (VI), rectus femoris (RF), sartorius (S), gracilis (G), adductor magnus (AM), adductor longus (AL), semimembranosus (SM), semitendinosus (ST), biceps femoris (BF) in thigh, and tibialis anterior (TA), tibialis posterior (TP), extensor digitorum longus (EDL), peroneus longus (PL), soleus (SOL), gastrocnemius lateral (GCL), and gastrocnemius medial (GCM) (Fig. 1).
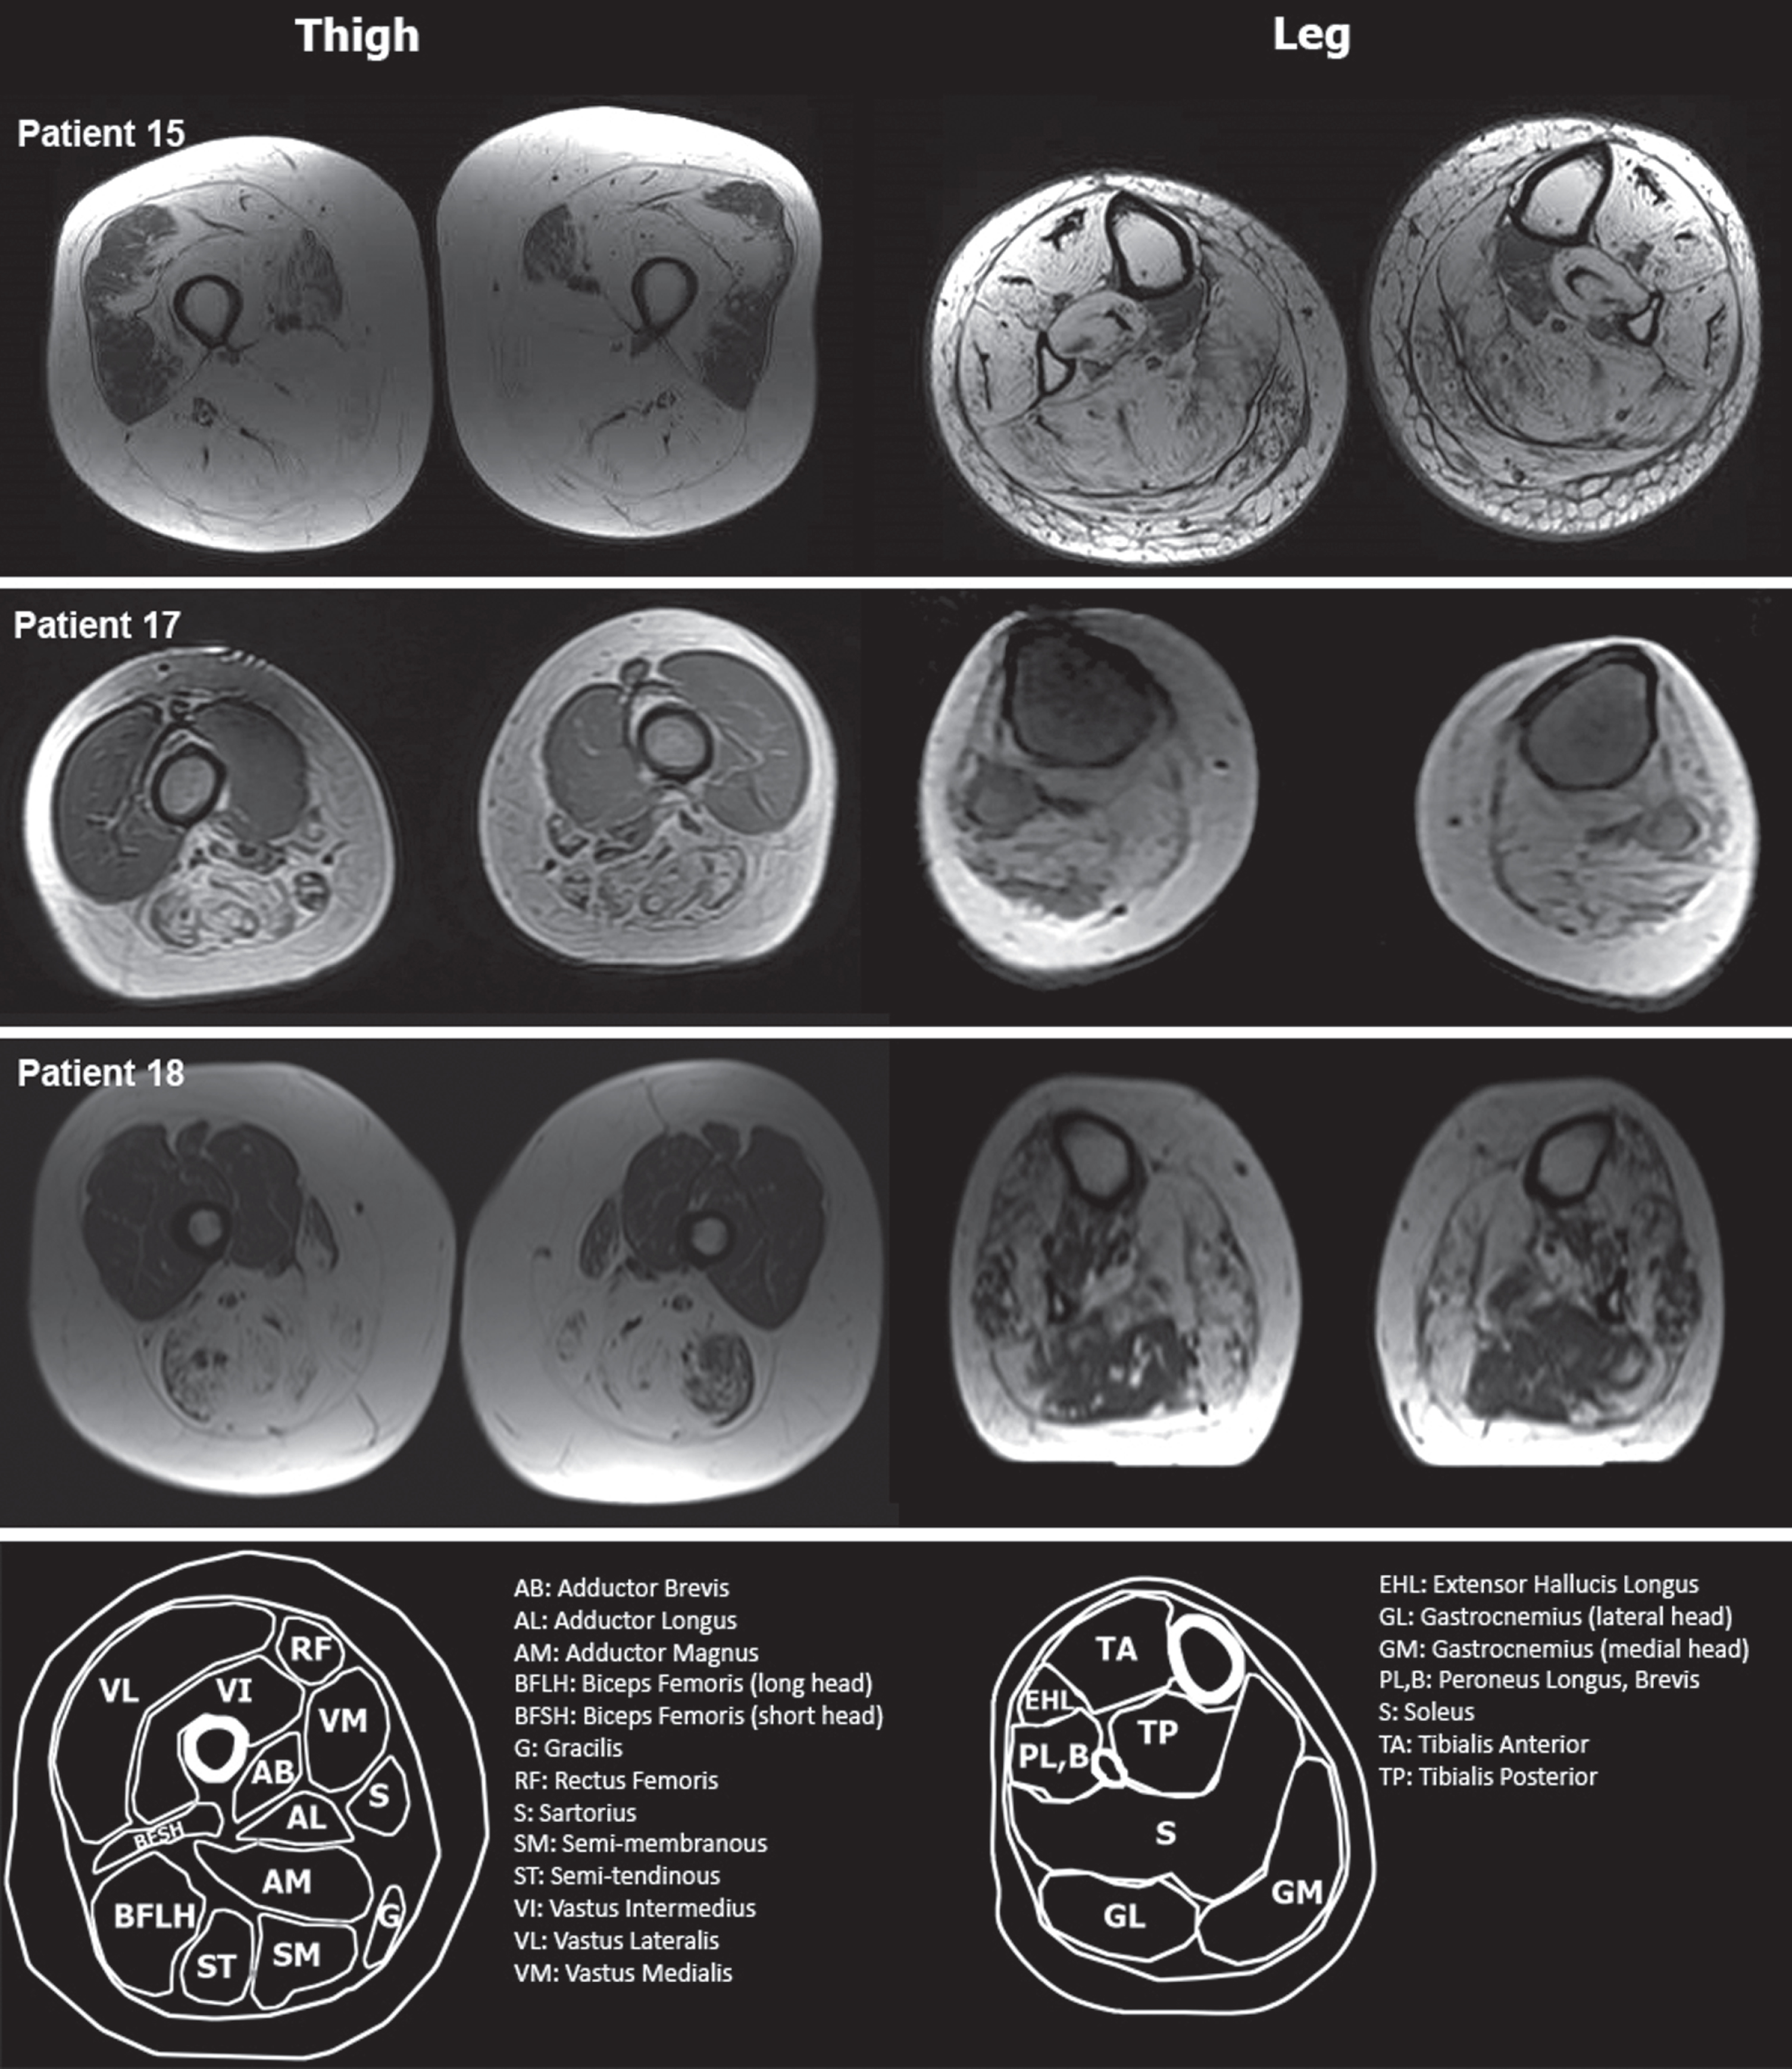
Thigh and leg muscle MRI of patients 15, 17, and 18. In thigh muscles, the quadriceps was spared in patients 17 and 18, while it was involved in patient 15. In leg muscles, involvement of the anterior and posterior compartment was seen. In patient 18, GCL and TP were less involved compared to TA.
The degree of muscle fatty infiltration was assessed using the Mercuri scale [10] modified by Fischer et al. [11]. This scale consists of five levels in T1-weighted MRI, including normal muscle appearance: 0 point; mild involvement with traces of increased signal intensity: 1 point; moderate involvement with increased signal intensity with the beginning confluence in less than 50% of the muscle: 2 points; severe involvement with increased signal intensity with the beginning confluence in more than 50% of the muscle: 3 points; end-stage appearance with the entire muscle replaced by increased density of connective tissue and fat: 4 points.
In addition, for correlation analysis, the leg was divided into four compartments. Two muscle compartments were in the thigh, including the anterior thigh compartment (VL, VM, VI, and RF muscles) and the posterior thigh compartment (AL, AM, SM, ST, BF, S, and G muscles). Two muscle compartments were in the leg, including the anterior leg compartment (TA, EDL, and PL) and the posterior leg compartment (GCM, GCL, TP, and SOL). To calculate the Mercuri score for each compartment, we averaged the Mercuri scores of the related muscles.
The Mercuri score measurements were performed by an experienced neurologist blind to the clinical data (AAO).
Statistical analysis
Data analysis was performed using the RStudio (R version 3.5.2). The Shapiro Wilk test was used to assess data distribution. If the data had a non-normal distribution, non-parametric tests were applied. The Spearman correlation analysis was used to evaluate the association between clinical and MRI scores of the muscle compartments (i.e., anterior thigh, posterior thigh, anterior leg, posterior leg). Cluster analysis was done for muscle and patient grouping using the Pheatmap package of R. [12]. Hierarchical clustering is a process by which similar objects are classified into groups named clusters generating a set of clusters. Each cluster is different from other clusters, and the objects within each cluster are generally comparable to one another. The results are described as median (25th –75th percentiles) and range (minimum-maximum). P-values≤0.05 were considered significant.
RESULTS
This study was conducted on 18 patients (9 men and 9 women). The median age of the patients at the time of the study was 29.0 (25.3 –35.0) years (range: 23–50 years), the median age of onset was 25.0 (22.0 –28.8) years (range: 19 –46 years), and the median disease duration was 3.0 (2.0 –6.8) years (range: 1–10 years). The patients’ demographic and clinical characteristics, as well as mutations, are summarized in Table 1. The most frequent mutation was C.2228T > C (p.M743T), which was observed in 9 patients (50%) (Table 1). The median CK was 443 (357 –543) IU/L (range: 156 –2260 IU/L).
Patients’ mutations and demographic and clinical characteristics
The median foot dorsiflexion strength was 3 (2 - 3) versus 4 (4 - 4) for plantar flexion (p < 0.001). In addition, the strength of knee flexion was 3 (3 - 4) versus 5 (5 - 5) for knee extension (p < 0.00001).
The four muscles with the highest fat infiltration were AM, TA, ST, SM, and the muscles with the least fat infiltration were VM, VL, VI, and TP (Figs. 2 and 3). RF muscle was involved more than VM, VL, and VI in the quadriceps muscle.
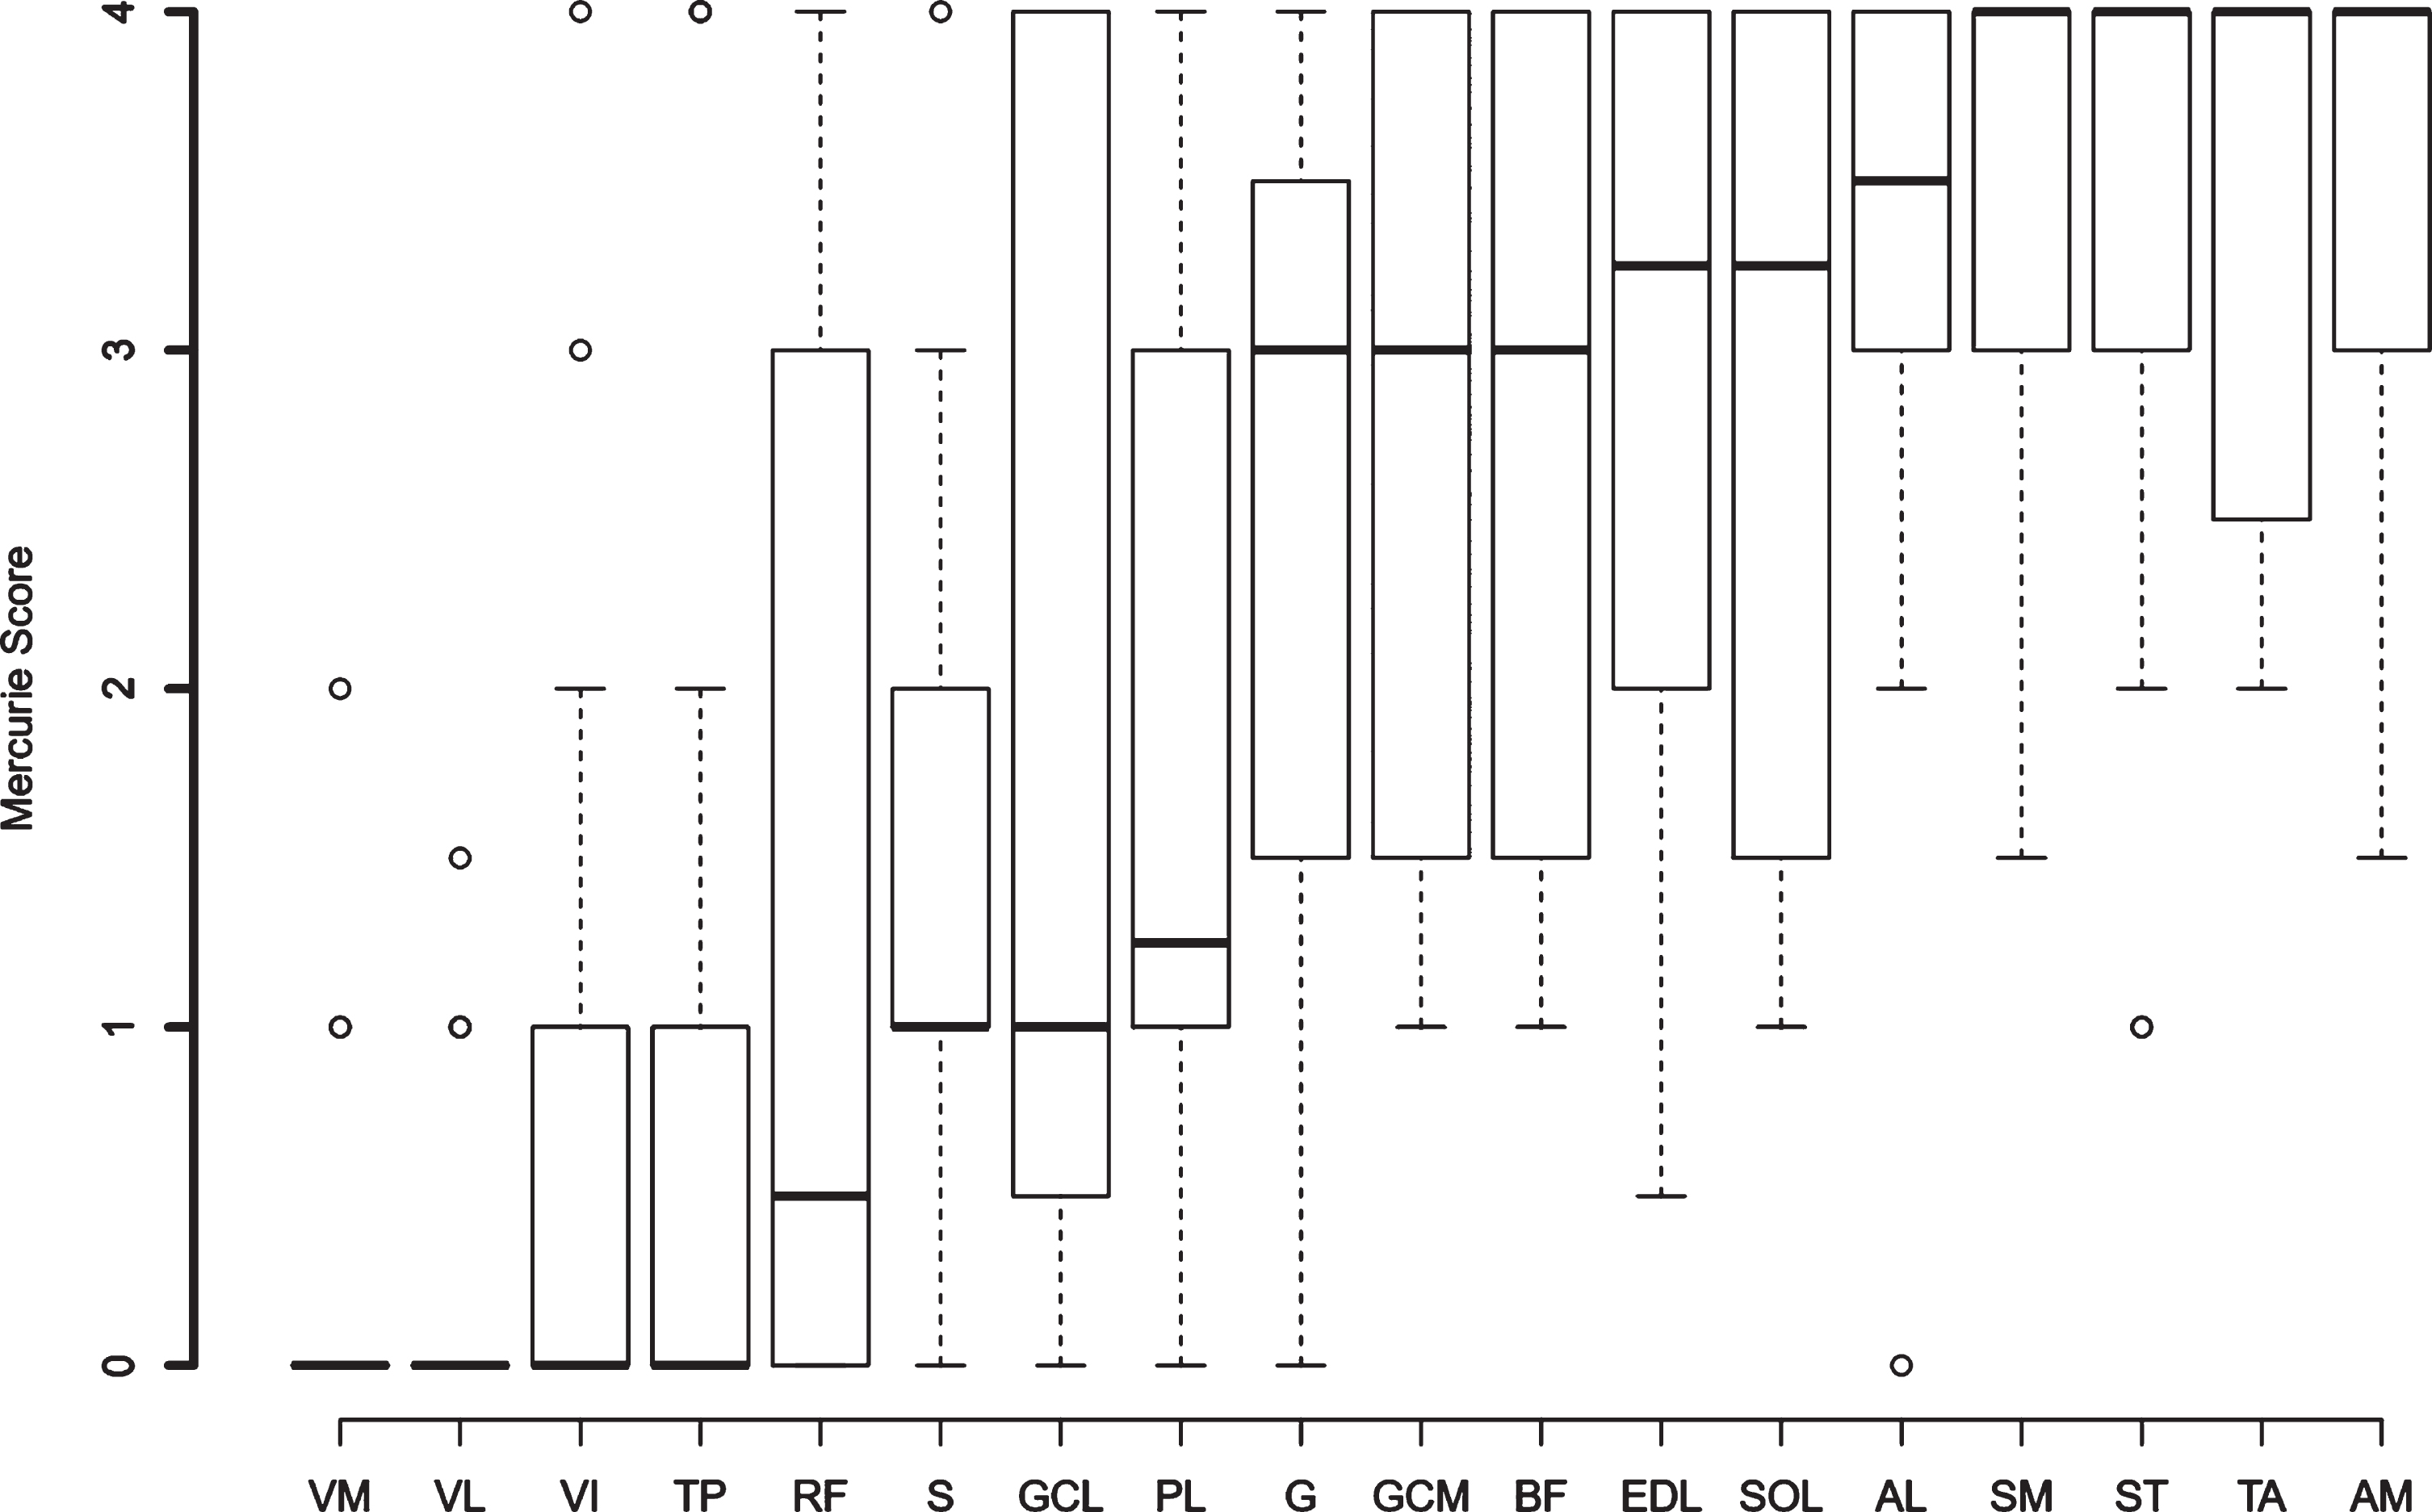
Fat infiltration of different muscles according to Mercuri scale.
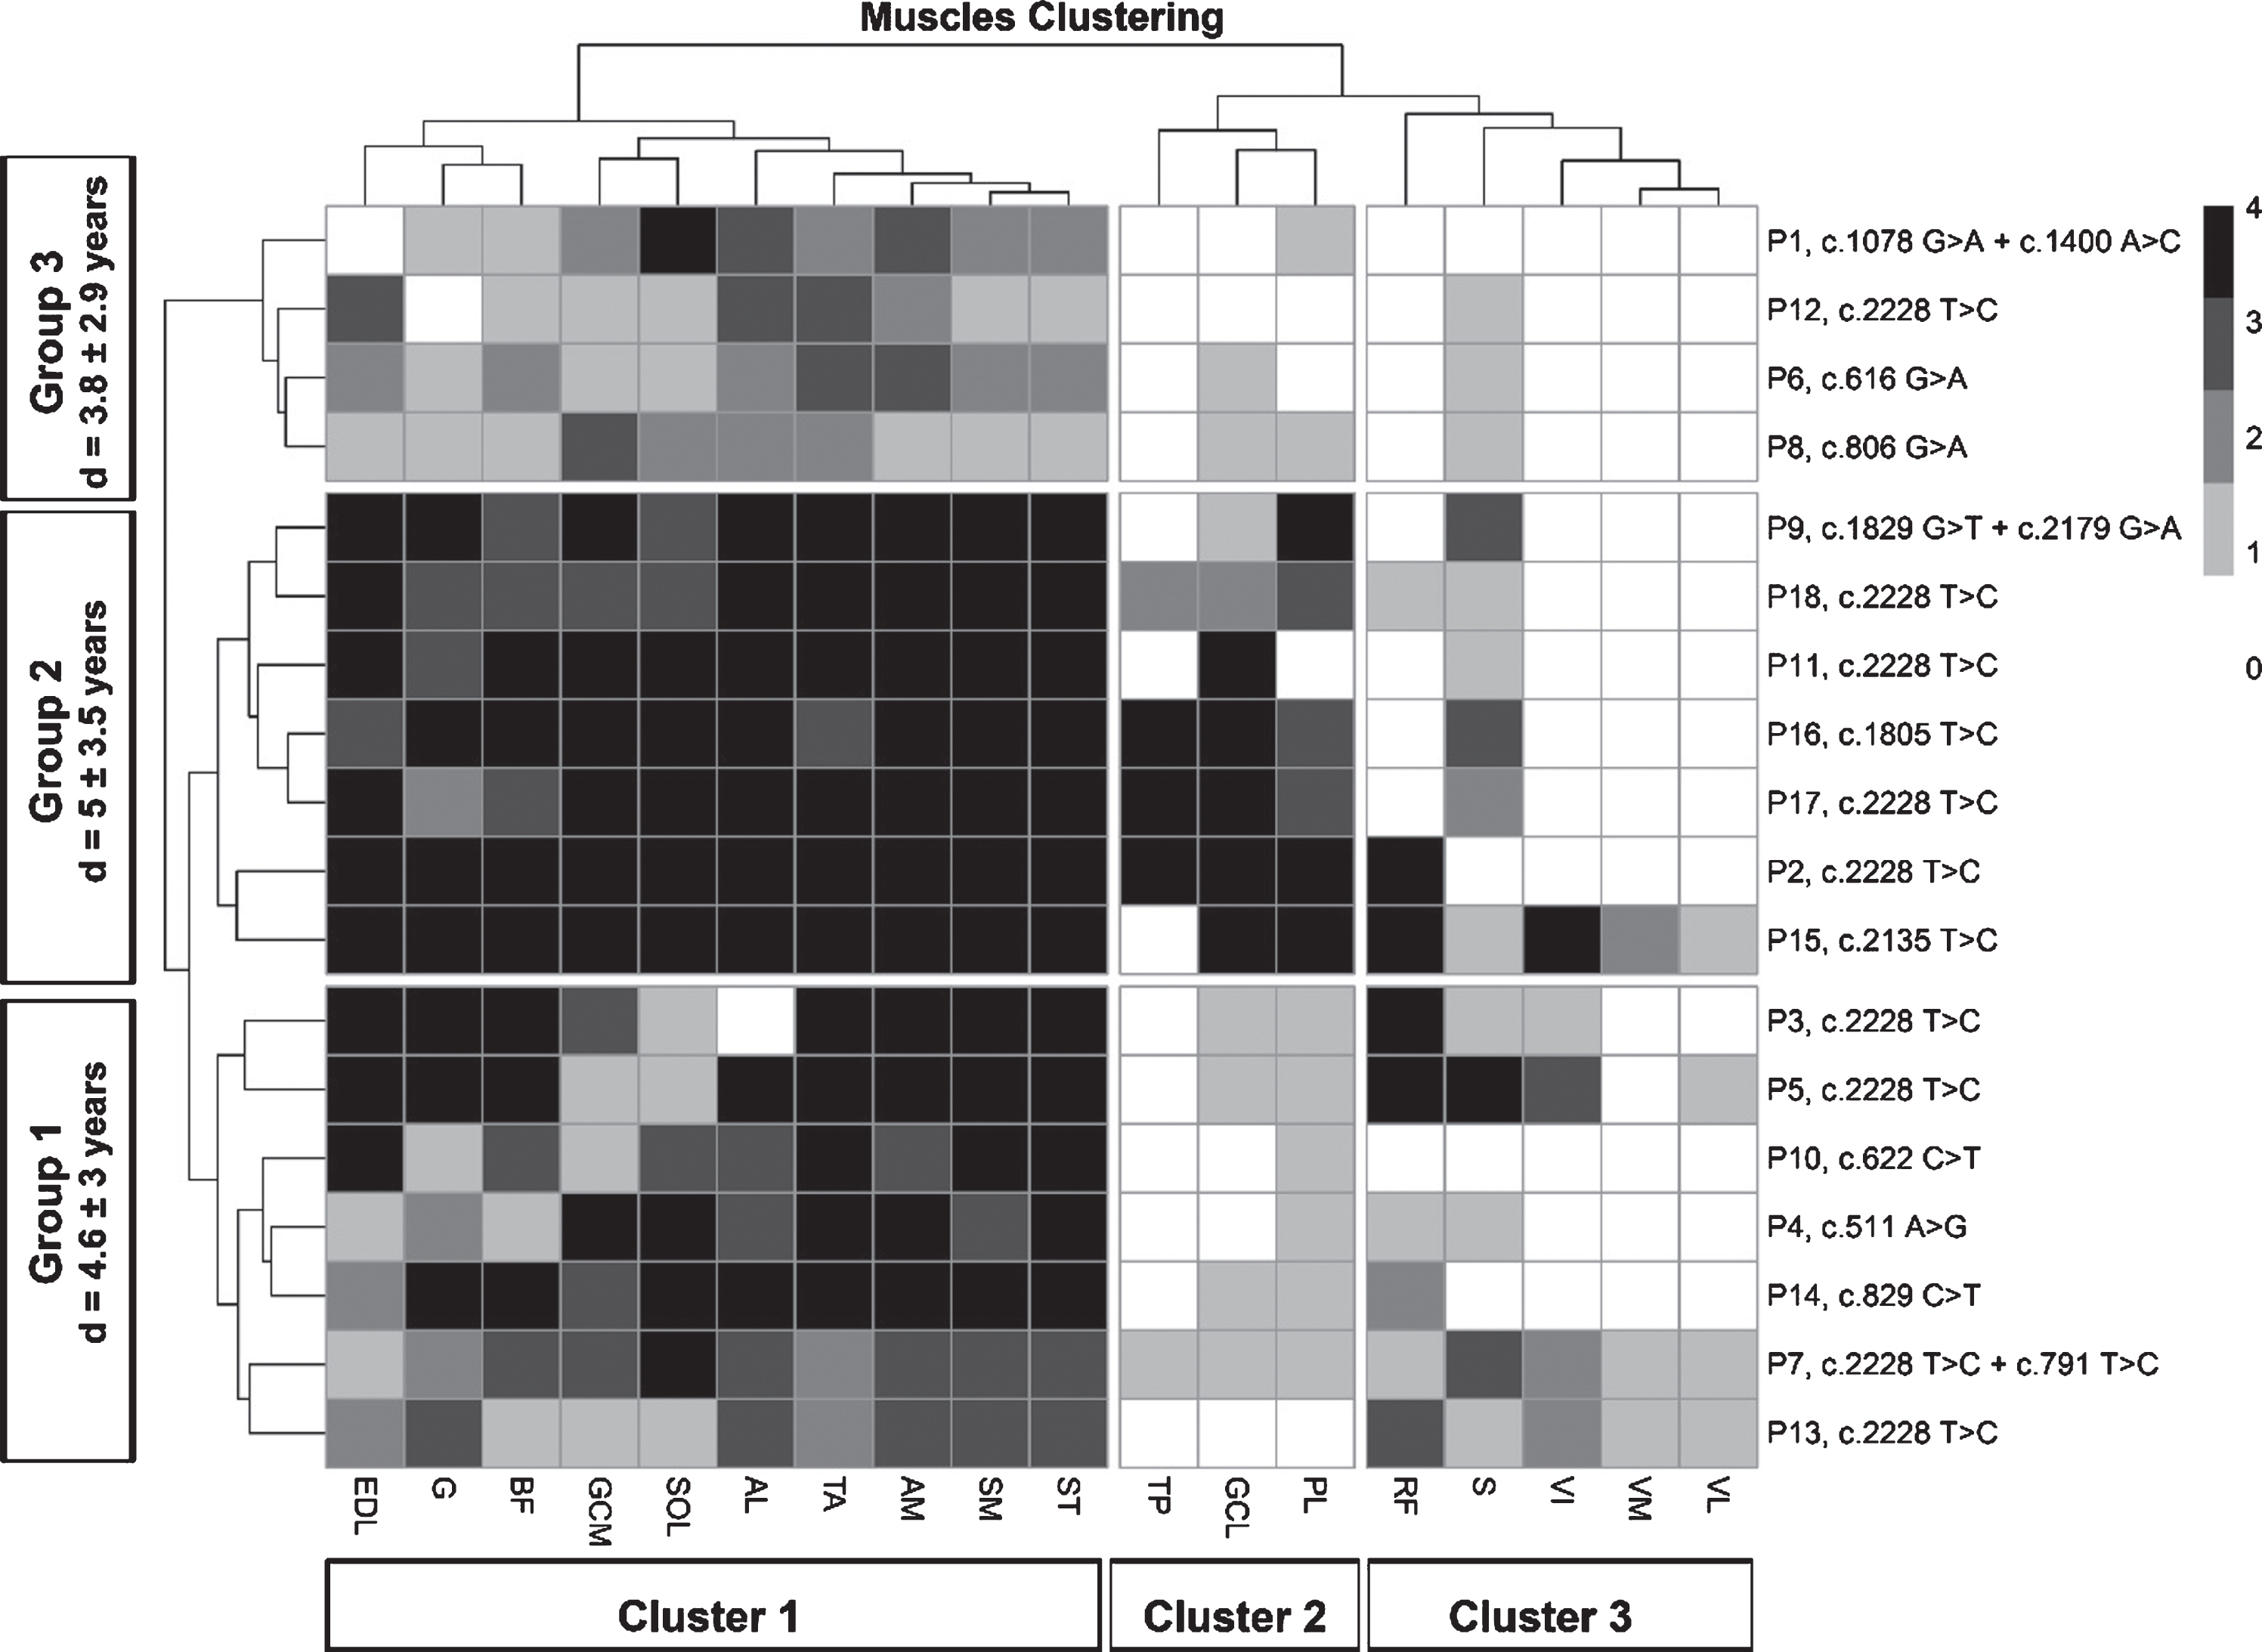
Hierarchical cluster analysis and heat map of all muscles and patients. Cluster 1, typical muscle involvement indicating the muscles with the highest infiltration: EDL, G, BF, SOL, GCM, AL, TA, AM, SM, ST; Cluster 2, less typical muscle involvement indicating muscles with intermediate fat infiltration, PL, GCL, and minimal fat infiltration in most of the patients, i.e. TP; and Cluster 3, atypical muscle involvement with low fat infiltration: RF, S, VI, VM, VL. Patient groups. Group 1 (Classic): patients with cluster 1 involvement as well as rare involvement of cluster 2 or 3 muscles (seven patients including P3, P4, P5, P7, P10, P13, P14); Group 2 (Extensive): patients with cluster 1 involvement as well as the involvement of several muscles of cluster 2 or 3 (seven patients: P2, P9, P11, P15, P16, P17, P18); and Group 3 (Restricted): patients with involvement of fewer cluster 1 muscles as well as rare involvement of cluster 2 or 3 muscles (four patients: P1, P6, P8, P12). “d” indicates disease duration.
Cluster analysis of muscles and patients
Figure 3 indicates the hierarchical cluster analysis of all muscles and patients.
Cluster analysis of muscles revealed three clusters of muscle involvement in the patients as cluster 1, typical muscle involvement indicating the muscles with the highest infiltration: EDL, G, BF, SOL, GCM, AL, TA, AM, SM, ST; cluster 2, less typical muscle involvement indicating muscles with intermediate fat infiltration, PL, GCL, and minimal fat infiltration in most of the patients, i.e., TP; and cluster 3, atypical muscle involvement with low-fat infiltration: RF, S, VI, VM, VL.
In addition, three groups of patients were identified as group 1 (classic): patients with cluster 1 involvement as well as rare involvement of cluster 2 or 3 muscles (seven patients including P3, P4, P5, P7, P10, P13, P14); group 2 (extensive): patients with cluster 1 involvement as well as the involvement of several muscles of cluster 2 or 3 (seven patients: P2, P9, P11, P15, P16, P17, P18); and group 3 (restricted): patients with involvement of fewer cluster 1 muscles as well as rare involvement of cluster 2 or 3 muscles (four patients: P1, P6, P8, P12). In group 3, muscle involvement was mild in all compartments in general. Mean disease duration in group 1 was 4.6±3 years; group 2, 5±3.5 years; and group 3, 3.8±2.9 years.
Association between clinical findings and MRI fat infiltration
No associations were found between the disease duration and Mercuri score (anterior thigh: r = –0.01, p = 0.94; posterior thigh: r = 0.22, p = 0.2; anterior leg: r = 0.2, p = 0.25; posterior leg: r = 0.1, p = 0.56). Likewise, we did not find any significant association between the disease duration and any muscle group.
However, there was a significant correlation between the knee flexion strength and posterior thigh Mercuri score (r = –0.39, p = 0.02), foot dorsiflexion strength and anterior leg Mercuri score (r = –0.45, p = 0.01), and foot plantarflexion strength and posterior leg Mercuri score (r = –0.54, p < 0.001). No significant correlation was observed between knee extension and anterior thigh Mercuri score (r = 0.07, p = 0.67).
Phenotype-genotype correlation
Nine patients (50%) had c.2228T > C (p.M743T) mutation. The median age of onset with c.2228T > C (p.M743T) mutation was 25 (21 –35) years versus 26 (22 –30) years in other mutations (p = 0.93). Muscle fat infiltration was compared between c.2228T > C (p.M743T) mutation and other variants. A significantly higher fat infiltration was found compared to other mutations only for TP [Mercuri score of 0.5 (0–2), range (0–4) in c.2228T > C (p.M743T) mutation versus 0 (0-0), range (0–4) in other mutations, p = 0.02)]. It should be noted that most of the patients with c.2228T > C (p.M743T) mutation clustered to group 2 (5 of 9 patients), i.e., more extensive muscle involvement.
DISCUSSION
Since the introduction of MRI, many studies have used it as a diagnostic tool for tracing muscle changes in muscular dystrophies and congenital myopathies [13]. Few studies have assessed the patterns of muscle involvement in GNE myopathy. The present study was different from other studies due to recruiting a significantly more significant number of patients, using a single scanner, and the short time from onset to scanning.
This study found three patterns of muscle involvement and three groups of patients among 18 patients.
Three main clusters of muscle involvement were observed, including muscles usually involved typically, i.e., cluster 1 (EDL, G, BF, SOL, GCM, AL, TA, AM, SM, ST), muscles with less typical involvement, i.e., cluster 2 (PL, GCL, TP), and atypical muscle involvement, i.e., cluster 3 (RF, S, VI, VM, VL). Posterior thigh muscles and anterior leg muscles were the muscles with the highest fat infiltration.
Such clusters may assist us in the differentiation of GNE myopathy from other distal myopathies. Moreover, it was shown that most of the patients fell into typical and less typical clusters; however, a small group of patients may present with atypical muscle involvement. To the best of our knowledge, only one systematic study defines the MRI pattern of GNE myopathy [9]. This study found a constant severe fat infiltration of the BF short head muscle with gluteus minimus, TA, EDL, SOL, GCM, and extensor hallucis longus was interpreted as the “MRI signature” of GNE myopathy [9]. Other than these muscles, SM, ST, adductors, and TP were also affected. Likewise, in the present study, there was severe involvement of EDL, BF, TA, SM, ST, SOL, GCM, and adductor muscles; otherwise, the involvement of TP was minimal in the patients. The main reason for this difference may be different disease durations between the two studies as the disease duration of patients in the study performed by Tasca was much longer, and the involvement of TP and quadriceps could be considered as a late finding in GNE patients. A recent study using proton magnetic resonance spectroscopy proposed that altered muscle metabolism existed before fat infiltration [14]. Since the degree of muscle fat infiltration was quantified using the Mercuri scale in the present study, early stages of muscle involvement could be overlooked. Another explanation for the difference may be different mutations in these two studies.
The patients’ genetic status was heterogeneous in the present study, with c.2228T > C (p.M743T) being the most common mutation. This variant was first reported in Persian Jewish GNE myopathy patients but was later found in many Middle East countries, including the non-Jewish population [15]. We were unable to find any phenotype-genotype correlation except for a marginal increase in fat infiltration of the TP muscle in patients with c.2228T > C (p.M743T) mutation. It should be mentioned that the patients with this mutation had a more advanced disease compared to other patients, and 4 out of 9 patients had the most prolonged disease duration among the patients. This finding was similar to the study conducted by Tasca in which TP involvement was frequently detected [9]. An interesting finding of patients with this mutation was that most of them fell into group 2, i.e., patients with typical muscle involvement and several less typical or atypical classes of muscle involvement.
The main limitation of this study was the semi-quantitative nature of evaluation and the small number of patients. Quantitative sequences such as 3-point Dixon or T2-mapping in a larger population of patients would be more beneficial in future studies [16]. We only performed lower-limb MRI and did not study the progression of the disease. Evaluation of upper limbs and patient follow-up would probably improve our knowledge of MRI patterns in GNE patients.
In conclusion, this study found three clusters of muscle involvement and three groups of patients among GNE patients. Hamstring muscles and the anterior compartment of the lower leg were the muscles with the highest fat infiltration. A weak genotype-muscle MRI association was found in which the tibialis posterior was more involved in the patients with the most frequent mutation, i.e., c.2228T > C (p.M743T); however, this finding may be related to longer disease duration.
FUNDING
No funding was received for this study.
CONFLICTS OF INTEREST
The authors declare that they have no conflict of interest.
ETHICAL APPROVAL
All procedures were according to the ethical standards of the Tehran University of Medical Sciences Research Committee as well as the Helsinki declaration.
INFORMED CONSENT
Informed consent was obtained from all participants.