
Abstract
Fatigability is the hallmark of myasthenia gravis (MG). It is not clear, however, whether there is an analogous increase in jitter during the course of a single fiber electromyography (SFEMG) session. The individual jitter values of all potentials of 76 normal and 44 myasthenic orbicularis oculi muscles were assigned a rank number according to their temporal order in which they were collected and linear regression was performed to determine if the slope of the regression line was significantly different from zero. Control and MG subjects displayed rather flat linear regression lines with non-significant positive or negative slopes. Accordingly, ROC analysis yielded areas under the curve near 0.5. We conclude that there is no systematic jitter increase during the collection of 20 potential pairs in a typical SFEMG session.
Single fiber electromyography (SFEMG) is a time consuming and technically demanding procedure for both the operator and the patient. Nonetheless, it remains the most sensitive electrodiagnostic technique in disorders of the neuromuscular junction. In myasthenia gravis (MG), the sensitivity of SFEMG practically reaches 100%when studying a weak muscle [1–4]. Fatigability, in the sense of worsening of weakness after prolonged muscle contraction or use is the hallmark of diseases affecting the neuromuscular junction [5]. However, there are surprisingly few, if any, studies dealing with the “fatigability” of jitter values during the course of a SFEMG session.
Here, we investigated changes in individual jitter values during the course of a SFEMG study in 76 normal and 44 myasthenic orbicularis oculi (OO) muscles throughout the recording period from pair 1 to pair 20. Normal participants (age range: 15–87 years) were healthy adults without peripheral or central neurological disorders. The majority of MG patients (age range: 14–82 years) were seropositive for either acetylcholine receptor (AchR) or muscle-specific receptor tyrosine kinase antibodies (anti-MuSK). The rest had typical MG phenotypes and a documented sustained clinical improvement in response to either acetylcholinesterase inhibitor or steroid treatment. Normal participants were examined prospectively, while muscles from subjects with MG were retrieved retrospectively from the database of the Department of Clinical Neurophysiology. Pyridostigmine was discontinued at least 12 hours prior to SFEMG recording. Twenty patients were on immunosuporessants at the time of testing. All subjects gave written informed consent for participation in the study which was conducted in accordance with the Declaration of Helsinki and approved by the Ethics Committee of the Department of Neurology of the University of Athens. SFEMG with voluntary activation was performed on a Medtronic (Keypoint 31A02) machine with the commercially available, disposable concentric needle electrode (Alpine DCF 25, needle outer diameter = 30G, Alpine BioMed ApS, Skovlunde, Denmark). The signals were bandpassed between 1 kHz and 10 kHz. Single fiber action potentials were detected by the built-in software and were then visually evaluated by the operator, in order to assure compliance with established criteria for action potential waveforms [6, 7]. Recordings not fulfilling these requirements were excluded. If the search for adequate potential pairs lasted >30 s, a short (∼20 s) pause of muscle contraction was introduced to avoid fatigue.
The individual jitter values of all potentials for each muscle tested were assigned a rank number according to their temporal order in which they were collected. Different jitter values were assigned the same rank number if they were obtained simultaneously from a motor unit potential with more than one pair of fiber potentials. As a consequence, in cases where two or more potential pairs were obtained in a single muscle contraction (e.g. in a polyphasic motor unit), these pairs received the same rank. For example, rank number 12 might include the pair number 12, 13 and 14. Thereafter, linear regression was performed to determine if the slope of the regression line was significantly different from zero. A statistically significant positive slope of the regression line would indicate a gradual increase of jitter toward the end of the recording session. Receiver operating characteristic (ROC) curves were also constructed to quantify the diagnostic sensitivity and specificity of the regression slopes.
Pooled jitter values for control and MG subjects exhibited unsystematically scattered data clouds, with no clear trend from potential pair 1 to potential pair 20 (Fig. 1).
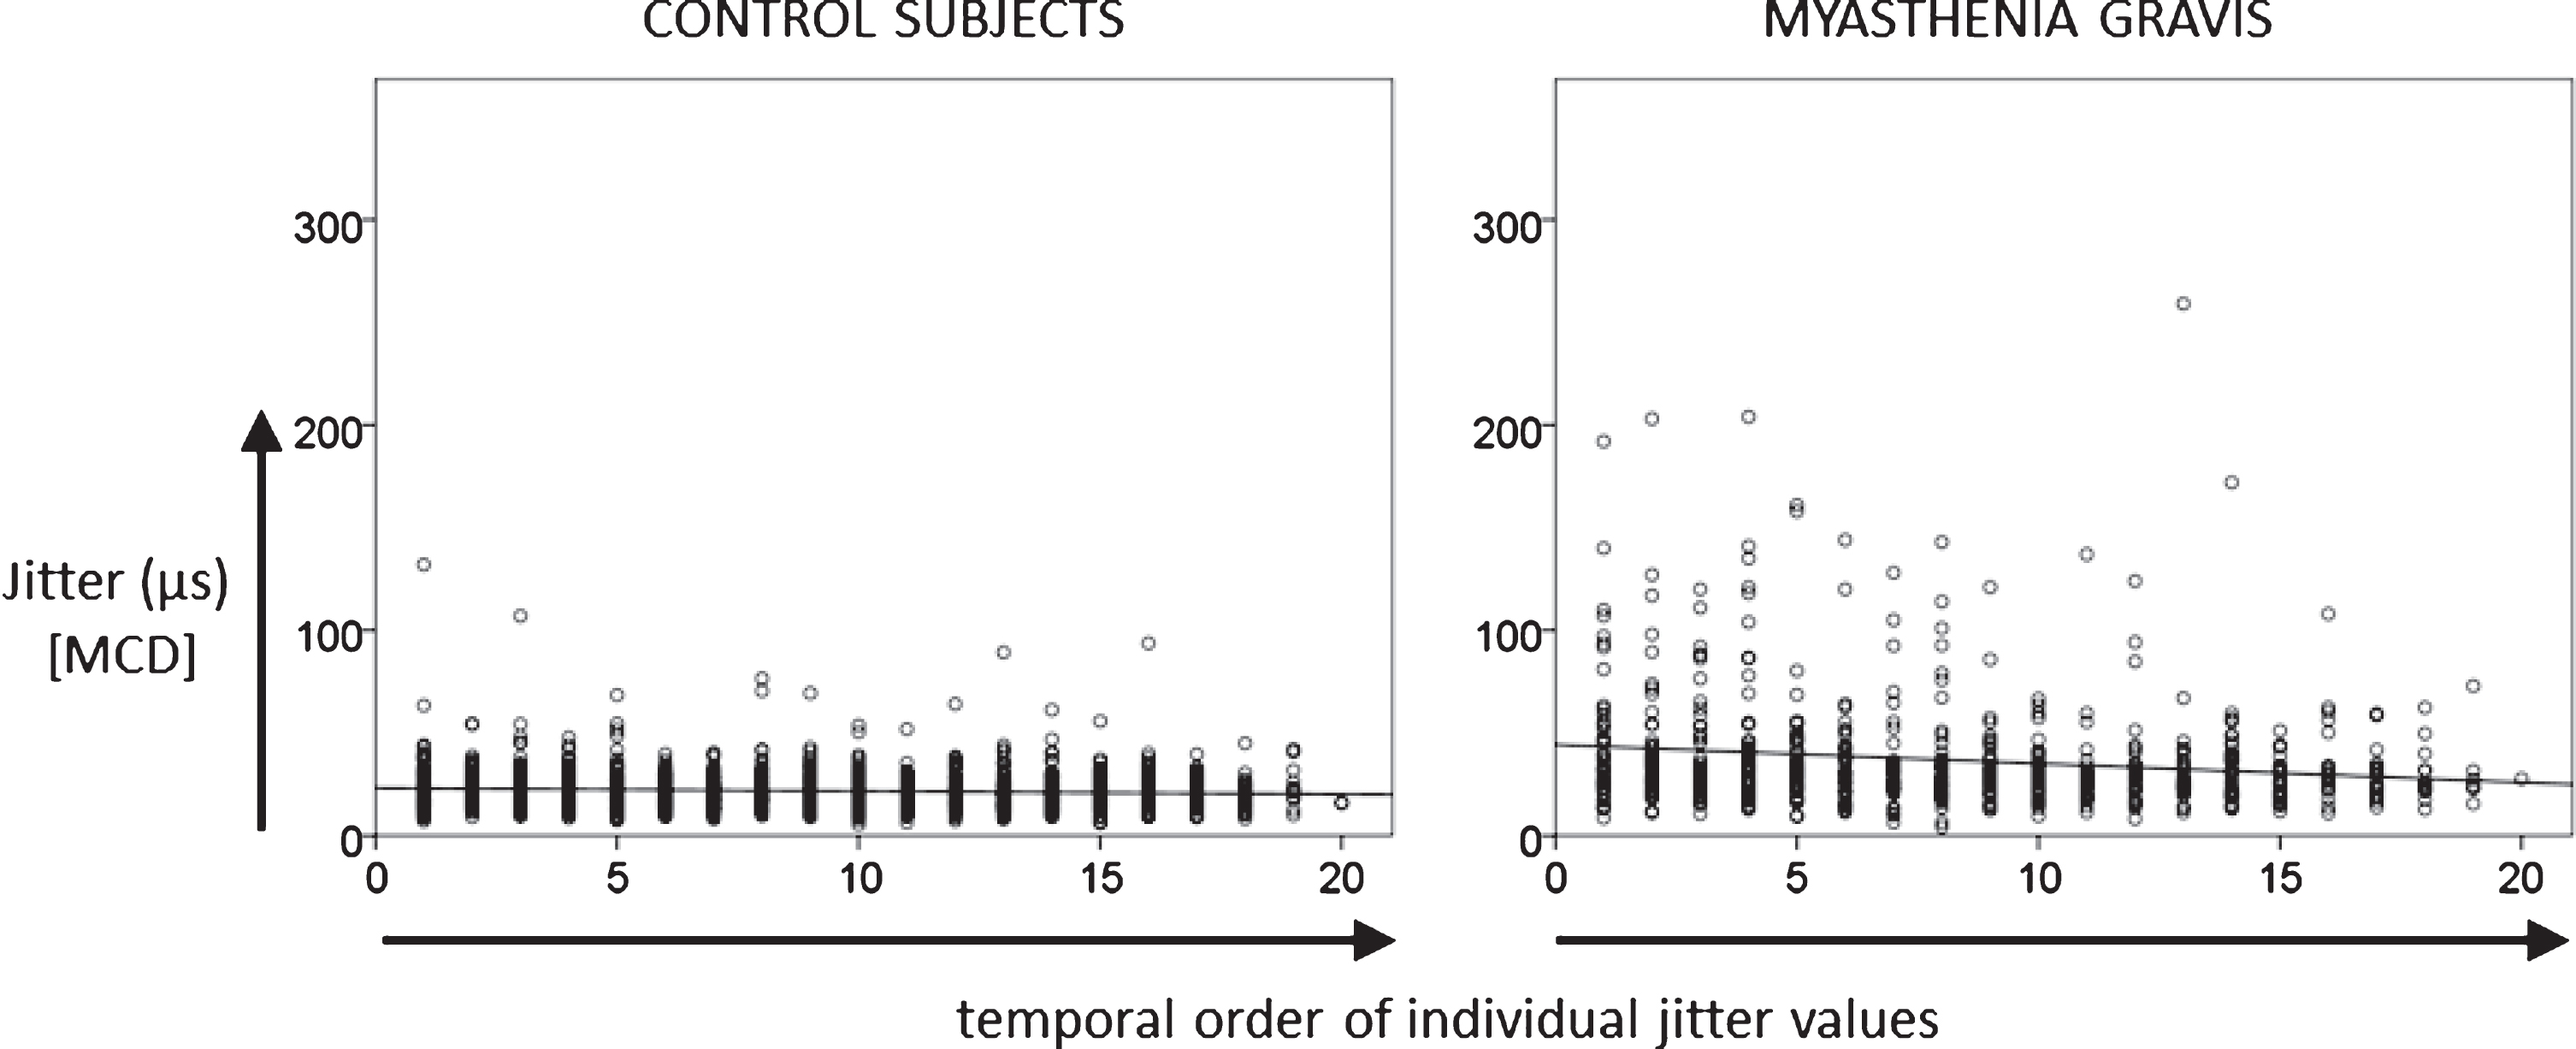
Linear regression of 1541 individual jitter values of control subjects and 694 jitter values of MG patients as a function of temporal order of potential pairs collected during the course of the recording.
Examining each SFEMG study separately showed that most control and MG subjects displayed rather flat linear regression lines with non-significant positive or negative slopes. No differences were found between controls and MG and between subjects with normal and abnormal SFEMG result. Notably, the categories normal and abnormal SFEMG are based on established criteria (abnormal mean consecutive difference (MCD) or >2 abnormal individual jitter values) and include both MG patients and normal controls. According to our reference values 4 of 76 muscles exhibited abnormal jitter in the control group and 36 of 44 muscles in the MG group. The former is a usual finding in all SFEMG employing normal cohorts to determine jitter reference values [8]. Hence, our analysis comprised two distinct comparisons. First, we tested muscles from healthy controls (n = 76) against muscles of MG patients (n = 44). Second, we tested the muscles of the same (control and MG) subjects, but this time the comparison consisted of muscles that had a normal SFEMG result (n = 80) versus muscles that had an abnormal SFEMG result (n = 40), irrespective of whether they belonged to the control or the MG group. ROC analysis showed that slope values performed poorly at distinguishing MG from control subjects, as well as normal from abnormal SFEMG studies (Fig. 2), yielding areas under the curves near 0.5 (0.506 for MG vs. controls and 0.490 for normal vs. abnormal SFEMG).
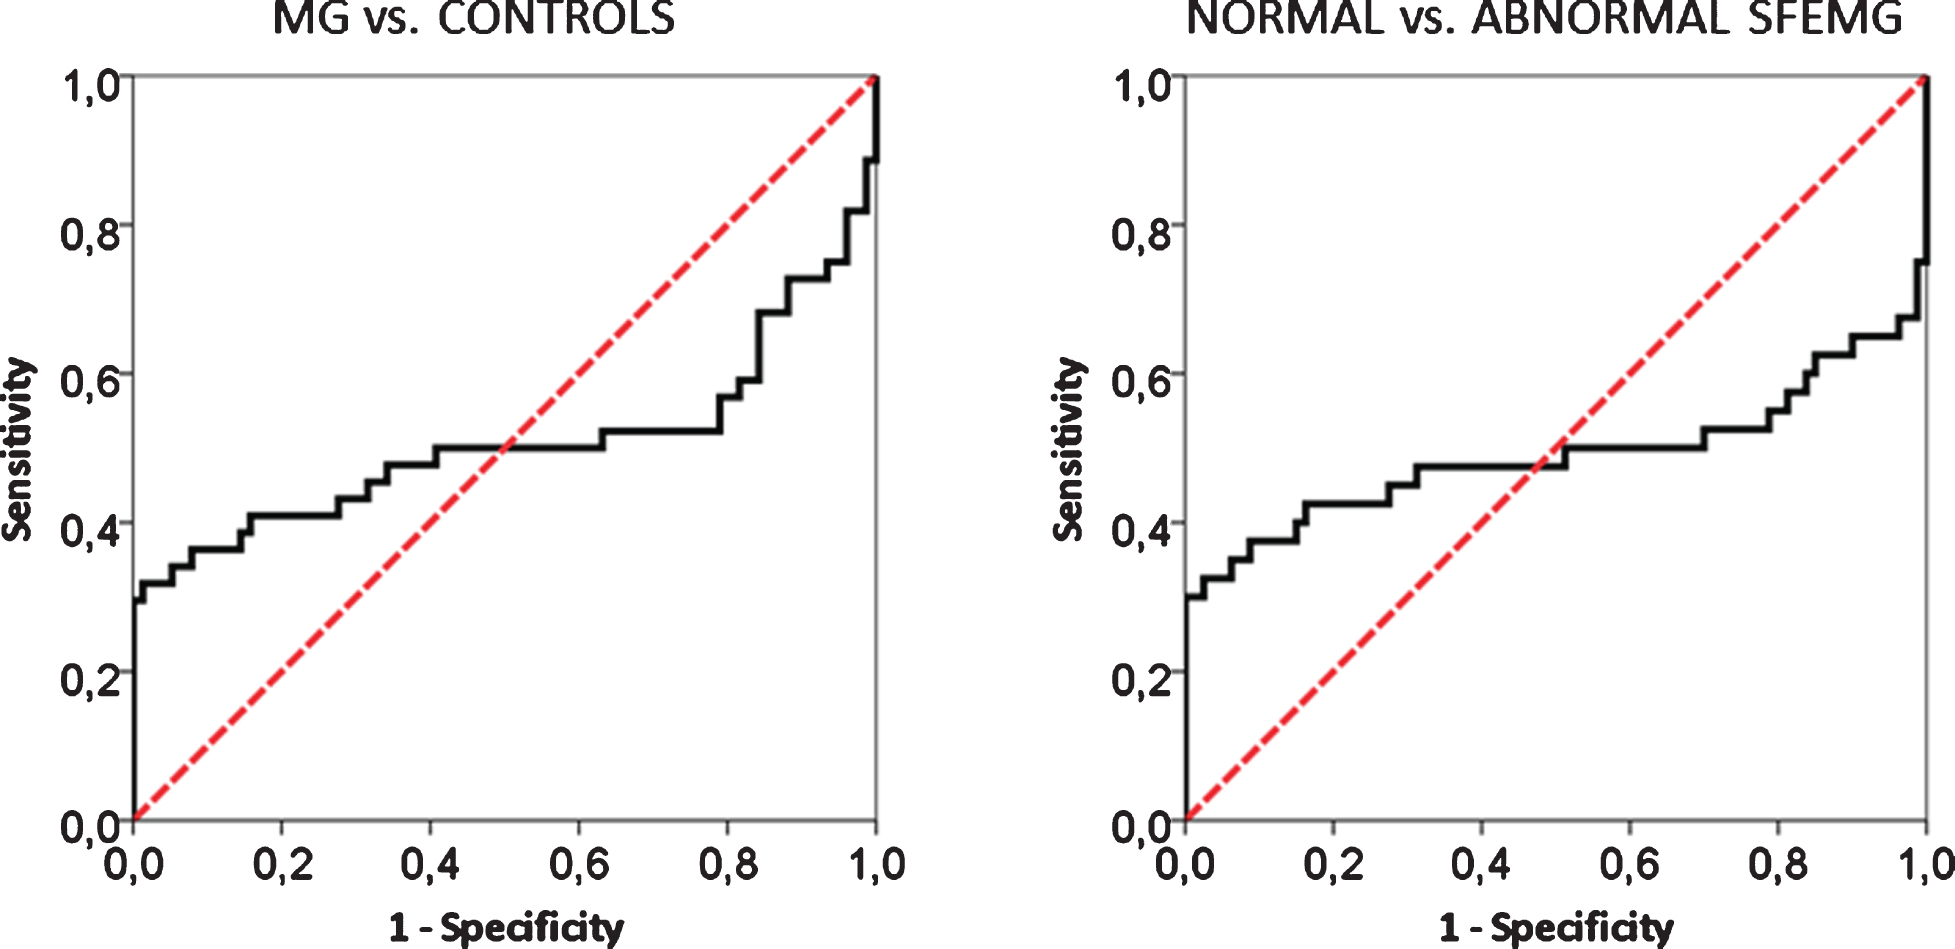
ROC curves showing the performance of jitter slope values over the MG vs. controls and the normal vs. abnormal SFEMG data set. The area under both curves is around 0.5 indicating that jitter slope is a bad classifier for MG or an abnormal SFEMG study.
Very few studies have examined the issue of neuromuscular jitter fatigability in the past. Here, we investigated a possible gradual increase in individual jitter values during the course or recording of 20 consecutive single fibre potential pairs. We included both normal and myasthenic subjects and tested the OO muscle which is particularly vulnerable in MG. We showed that individual regression line slopes exhibit positive and negative signs in approximately equal proportions, which was true for both controls and MG patients. Hence, at the single subject level, the temporal order of the jitter values holds no practical value. Importantly, only very few SFEMG recordings displayed a significant regression slope (positive or negative) at all. This was also reflected in the ROC analysis which yielded an area under the curve of approximately 0.5, thus indicating a poor classification performance.
Using a continuous voluntary activation paradigm, Ingram et al. [9] observed that, in contrast to normal subjects, patients with MG or other neuromuscular disorders display an increase in jitter during recordings of several minutes of continuous muscle contraction at steady innervation rates. This, however, is hardly comparable to routine SFEMG studies, where each MCD value is obtained from 50 to 100 motor unit discharges corresponding to a 5 to 10 s recording epoch, given an average firing rate of 10 Hz. In fact, the above finding could not be reproduced in a subsequent study which employed the conventional SFEMG method. By comparing the mean MCD of the first 10 versus the mean MCD of the last 10 potential pairs, these authors found no significant differences [10]. Unfortunately, there were no regression analyses conducted in this study, so direct comparisons with our data must be cautious. Notably, neither this nor our study controlled for firing rate, which has been found to affect neuromuscular jitter [11–13]. Another limitation of the present study, is the use of short pauses between successive potential pair recordings, as mentioned in the methods paragraph. Omission of these pauses might have allowed some degree of jitter increase to emerge.
We conclude that, at the individual subject level, neuromuscular jitter does not deteriorate during the collection of 20 potential pairs as is commonly practiced in SFEMG studies. This is true for studies in healthy controls as well as in patients with MG.
This might also be relevant in the context of recent studies designed to test whether collecting fewer than the recommended 20 individual jitter values in each study compromises the diagnostic accuracy of the study [14, 15].
DISCLOSURE OF INTEREST
The authors declare that they have no competing interest.
CONFLICTS OF INTEREST AND SOURCE OF FUNDING
None of the authors has any conflict of interest to disclose.