
Abstract
Background:
Clinical characteristics of patients with congenital myopathies (CM) are well known but there is a lack of knowledge about the natural history and course of disease of the different genetic subtypes. In 2010 we assessed the national cohort of Danish patients with CM to decide genetic diagnosing and describe genotype- phenotype relationships.
Methods:
All available genetically diagnosed patients studied by us in 2010 (n = 41) were invited to the follow-up study; assessment of motor function (MFM-32), muscle strength (MRC %)and respiratory function (FVC %) and prime assessor were the same as in the initial study. Patients were asked whether the course of disease had progresses, was stable or had improved.
Results:
23 patients (15–61 y) accepted the invitation. Mean follow-up time was 7.7 years. Loss of muscle strength was more prominent in patients with mutations in DNM2, RYR1 and TPM2/3 genes and deterioration in FVC % was more evident in patients carrying NEB and ACTA1 gene mutations. MFM-sum score was less sensitive to change compared to MRC-sum score. In general, agreement between the patient’s own opinion of the course of disease and results of assessments was good.
Conclusion:
The number of patients in the study is too small to be conclusive, but the results indicate that CM can be stable or slowly progressive depending on the genetic subtype.
INTRODUCTION
Congenital myopathies (CM) are a group of neuromuscular diseases presenting with hypotonia and muscle weakness at birth or in infancy. The clinical presentation of the CM phenotypes varies from a mild to severe impairment of physical functions with a great overlap among the different genetic sub-types. Some children are born with a profound muscle weakness with respiratory failure and do not survive their first years of life; some children survive with a comprehensive impairment of motor and respiratory functions; other children experience an improvement and/or stabilization in physical function after their initial period of life [1, 2] and achieve their gross motor milestones with slight to moderate delay; knowledge on progression in youth and adulthood is scarce.
CM is caused by mutations in genes that encode proteins involved in the contractile and cytoskeletal function of muscle fibers and is classified in five groups based on the histological features found on muscle biopsy [1, 3]. In the last decade, there has been focus on identifying genes involved in the five subgroups, which not only helps to generate knowledge about incidence and prevalence of the various subtypes, but also to describe the clinical characteristics of the individual genetic subtypes [4–6].
CM is often characterized as nonprogressive, but precise data describing the natural history is sparse and in our experience some patients suffer a loss of physical function or worsening of symptoms later in their disease course. Longitudinal studies in CM are few and often retrospective based on survival, and motor milestones and over a short period of time [2, 7]; prospective studies with quantifiable evaluation of physical function are even rarer [8, 9]. A reason for this is the uniqueness and small number of patients in the individual CM-subtypes and the quite large number of patients with no specific genetic subtype, which makes it challenging and difficult to design natural history studies on CM. Knowledge on natural history is important not only for the patients that suffers from the disease but also for the clinicians and counselors that advice on the progression of the disease and how to plan for rehabilitation. Finally, a thorough understanding of the natural history is a prerequisite for planning outcomes to be assessed in future clinical trials.
In 2009-2010 our study group conducted a study on diagnostics and functional evaluation of the national cohort of patients with CM in Denmark. Eighty-two patients (5–69 y) were included in the study that resulted in a genetically confirmed diagnosis in 56 % of all patients [10]. A lower age limit of five years was set due to a comprehensive and time-consuming assessment protocol. Our findings of phenotypes, genotypes and prevalence of the individual subtypes have been published in several studies [11–14].
In the initial study, many patients –both children and adults - expressed that the course of disease had improved or been stable in childhood and adolescence, however, most adult patients had an experience of a slow decline in physical functions in adulthood. Based on this, we decided to re-invite the genetically verified CM patients from our initial study population to a follow-up physical examination using the same physical assessment protocol as in the initial study. The period between first and follow-up assessment was decided from earlier findings that a longer period is needed to demonstrate stability or progression in a slowly progressive disease [15].
The aim of the study was to contribute to the building of knowledge on the natural history of the individual CM-subtypes by evaluating the course of CM over time, the applicability of standard assessment methods to reflect a change over time and to register patients own opinion on the course of disease.
MATERIALS AND METHODS
Forty-seven patients had reached a genetic diagnosis in the initial study; of those, five had died and one had moved abroad; 41 patients were thus invited to the follow-up study. Patients who did not respond to the invitation were reminded twice.
Participants signed an informed consent; in case the patient was less than 18 years of age, the parents gave consent.
ETHICS
The study was conducted in accordance with the Helsinki Declaration of 1975. According to the Central Denmark Region Committees on Biomedical Research Ethics the project was not further liable to notification (43/2017).
ASSESSMENTS
Functional ability
Motor Function Measure (MFM) is an ordinal scale validated for use in patients with neuromuscular diseases [16]. The scale evaluates physical function by 32 items in three dimensions (standing and transfers/MFM D1), axial and proximal motor function/MFM D2), and distal motor function/MFM D3). Each item is scored as 0–3 according to the ability to perform the task. Higher numbers represent better function. MFM-sum score and the score of each dimension are calculated as the percentage of the highest possible score.
Muscle tests
Muscle strength was tested by manual muscle testing (MMT) based on the Medical research Council scale [17] and performed in 40 muscles groups (neck flexion and extension, trunk flexion-extension, shoulder flexion-extension-abduction-adduction, elbow flexion-extension, wrist flexion-extension, finger-flexion, thumb opponens, hip flexion-extension-abduction-adduction, knee flexion-extension, ankle dorsal flexion-plantar flexion). MRC raw scores 0–5 were modified to 0–10 scoring scale to make the score more sensitive according to the modification of Kendall et al. [18]. The MRC% scores were calculated for total muscle strength (MRC sum score), proximal muscle strength (shoulders, hips) and distal muscle strength (hands, feet) as percentage of maximal possible score (MRC% = (sum of graded scores×100)/ (number of tested muscles×10) [19].
Respiratory function
Forced vital capacity (FVC %) was measured in upright and back-lying position by a calibrated spirometer (Medikro® Pro). The best value of three was recorded and expressed as percentage of the reference value for the individual patient.
All patients were assessed by the same PT at the initial study (UW); at the follow-up assessment another experienced PT (PDH) assessed one fourth of the patients; to confirm consistency and agreement among the evaluators, six patients were assessed by both evaluators.
Patients opinion on progression
At the follow-up-study patients were asked to rate their opinion on the course of disease in the past eight years as progressive, stable, or improved.
STATISTICS
SPSS version 25 was used for statistics; significance level was set at p < 0.05. Non-parametric analyses (Wilcoxon signed rank test, Kruskal-Wallis, and spearman’s rho) were used to determine change over time and correlations between the individual assessment methods. Change over time was calculated for the whole group. Since number of patients was small, change over time was not calculated in the individual genetic subgroups, but illustrated by boxplot.
Patients own opinion of the course of disease was compared to the results of the physical assessments by simple calculations of agreement: Progression was considered as≥5 % deterioration from baseline assessment in both MFM % sum score and MRC % sum score; stability was considered as a score be-tween > –5% and < 5 %, and improvement as≥5 % gain of function.
RESULTS
Five Patients had died. Baseline characteristics for these patients are illustrated in Table 1.
Baseline characteristics in five patients, that had died in the period
Twenty-three patients (14 F) accepted the invitation (56 % of eligible patients). Genetic subtypes were mutations in the following genes: ACTA1, NEB, TPM2/3, MTM1, DNM2 and RYR1. Mean period between baseline and follow-up assessment was 7.7 years (7.1–8.1). Patients’ age at follow-up assessment was 15–61 years. All patients had symptoms from birth or in early infancy. Three patients were non-ambulant; none had lost ambulation in the follow-up period, and none of the participants had had a need for further interventions such as surgery or assisted ventilatory support. Patient characteristics are illustrated in Table 2.
Characteristics for 23 patients in the follow-up study
Brackets represent the initial study eight years before. Non-amb = non ambulant, amb = ambulation, ss = slight scoliosis, *in childhood, NIV = Non-invasive ventilation; BMI = Body mass index; All illustrated as percentage of max value.
Physical function (MFM % scores)
Physical function calculated as MFM-sum score had deteriorated from 88% to 80% of normal value in the period; the D1 dimension (transfer) was the most affected from start and had deteriorated from 71 % to 56 % of normal value in the period whereas D2 and D3 dimensions (axial and distal function) were stable at a level near normal values (Table 3). Deterioration in MFM-score was not significant; this was also illustr-ated by a median change in MFM-sum score per year of 0.07 % (–2.7–1.22). However, when MFM-sum score was illustrated according to the individual genetic subgroups, all patients with DNM2 mutations had lost function with a deterioration of 6% (2–14), (Fig. 1).
Functional ability, muscle strength and respiratory function in genetic subgroups
The results are displayed as median values at baseline/ follow-up. MRC % = percentage score in distal and proximal muscle groups and total score MFM % : D1 (standing and transfer) D2 (axial motor function) D3 (distal motor function).
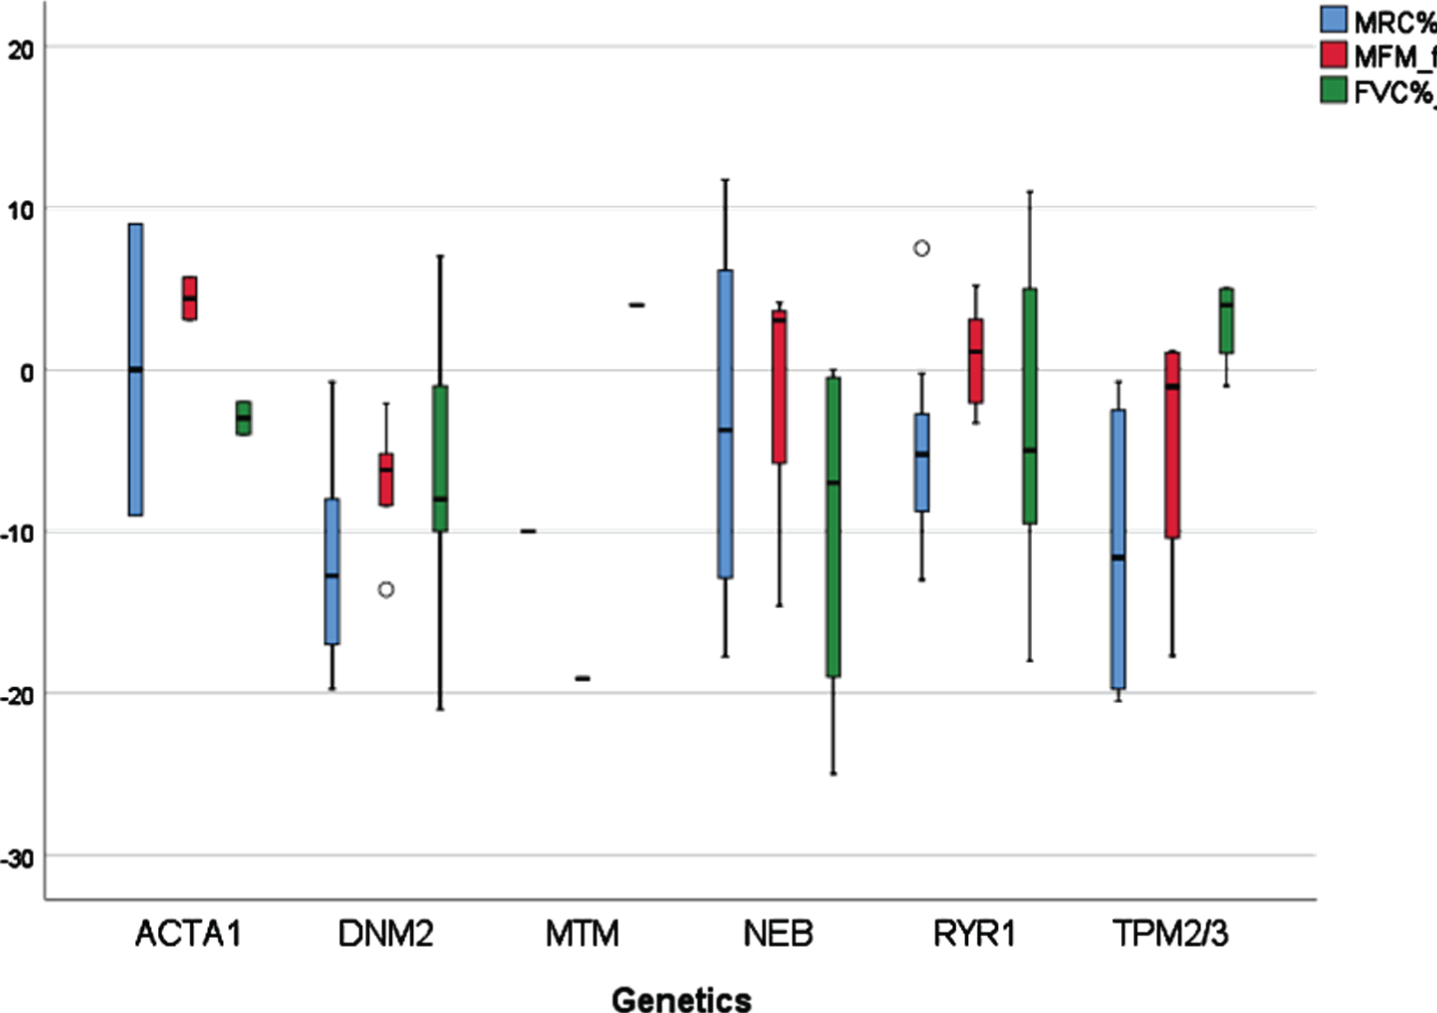
Change over time in muscle strength (MRC%) motor function (MFM %) and Respiratory function (FVC %) illustrated as boxplots in genetic subgroups. ACTA 1 = 2, DNM2 = 5; MTM = 1; NEB = 4, RYR1 = 7, TPM2/3 = 4 patients. The horizontal line in the box represent median change.
Muscle strength (MRC % scores)
Muscle strength, as measured by MRC, was in gen-eral impacted in all patients in both proximal and distal muscle groups (Table 3). The decrease in mus-cle strength over time was significant in both MRC-sum score (p = 0.003), proximal scores (p = 0.007) and distal scores (p = 0.025). The annual change in MRC-sum score was estimated to 0.9 % (–2.6–1.5).
A decrease in MRC-sum % was most pronounced in patients with DNM2, RYR1, TPM2/3 mutations, who all lost muscle strength (Fig. 1). Deterioration in patients with DNM2 mutations was 13 % (2–20%); in patients with RYR1 mutations 6 % (1–13%) and in patients with TPM2/3 mutations 12 % (1–21 %).
Respiratory function
In general, FVC% was lower in lying position compared to upright position (p = 0.03) but with no clear relation to genetic subgroups. The largest difference was seen in a young man with MTM1 mutation, where FVC % declined from 39 % in upright position to 30 % in lying position and a woman with RYR1 mutation where FVC % declined from 95% to 75%.
Respiratory capacity measured as FVC% fell during the period in the whole group (p < 0.004). At the initial assessment, patients with ACTA1, TPM2/3 and MTM1 mutations had the lowest values of FVC (Table 3). This was also the case at the follow-up assessment; decline in respiratory function over time was most prominent in patients with ACTA1 and NEB mutations (Fig. 1).
Correlation between assessment methods
Measurements of MFM and MRC (% total) were generally highly correlated; however distal motor function (MFM D3 and MRC % distal) correlated poorly or not at all with proximal and overall scores; FVC % had a weak correlation with both motor function and muscle strength (Table 4).
Correlations between assessments
All correlations were significant except correlations for distal dimension (MRC % distal and D3). ** significant at 0.01 level; *significant a 0.05 level.
Patients own opinion
Twelve patients (ACTA1 (1), NEB (2), TMP2/3 (2), DNM2 (3), RYR1 (3)) thought their course of disease in the past eight years had been progressive; this was reflected in a decline in MRC % score in 11/12 patients (mean decline 12 % /range 5–20 %) and in a decline in MFM-total score in 7/12 patients (mean decline 12 % /range 5–19 %).
Eight patients (ACTA1 (1), NEB (1), TMP2/3 (2), DNM2 (1), RYR1 (4) considered the course of disease as stable. This was demonstrated by stability in MRC% and MFM-total scores in five and six of these patients, respectively. One patient (17 y) had in fact improved in both MRC score (9 %) and total MFM-sum score (6 %).
Two patients thought their physical function had improved in the period; in a 15-year old patient (NEB) this was reflected in an improvement in both MRC score (9 %) and MFM-total score (6 %). In the other patient (DNM2) the MRC and MFM-scores were stable, but the perceived improvement could not be demonstrated.
There was no difference in age between patients who found the disease had been progressive (34.3 y) or patients who thought the disease had imp-roved/been stable (38.2).
DISCUSSION
This study is one of the first natural history studies that has followed patients with genetical confirmed CM over several years. Although the number of patients in the study is small, the results indicate that CM can be slowly progressive and that a decline in physical function experienced by patients can be captured by standard assessment methods.
The results also indicate that deterioration in physical function may be more pronounced in some genetic subtypes than in others. In our study, patients with DNM2 mutations lost physical function and limb muscle strength whereas deterioration in respiratory function (FVC %) was more pronounced in patients with ACTA1 and NEB mutations.
Fifty-six % of all eligible patients with a genetic CM-diagnosis accepted the invitation to the follow-up study. The response rate was considerably lower than in the initial study where 90 % of the invited patients accepted the invitation. Very few non-parti-cipants explained why they declined the invitation; the vast majority did not respond to the invitation despite they were reminded twice. Gaul et al. [20] describe factors that can influence motivation of participation in clinical trials and conclude that the primary motivator is personal benefit; a potential adv-antage for other patients comes next. The modest support in our study could relate to no direct benefit for the patient of the current study contrary to the initial study where many patients hoped for a genetic diagnosis. Also, we do not know whether patients who decline the invitation had a more stable course of disease than patients who accepted the invitation and therefore were not motivated to participate. Finally, we could have been more specific in explaining the aim, the perspective, and benefits in the invitation letter to the patients.
Five patients had died since our initial study. Three patients due to underlying diseases, and two young non-ambulatory patients due to secondary complications after surgery/fracture. We did not have the possibility to look further into this.
Our choice of assessment methods in the initial study was based on an aim to record physical capacity and motor performance. MFM is –according to our knowledge - the only generic measurement at level of activity that has been validated for patients with CM [16]. Furthermore, MFM reflects gross motor function, upper limb, and distal function. After our initial study, a revised version of the MFM with 25 instead of 32 items (Rs-MFM25CDM) has been published and recommended for use in clinical trials on patients with congenital disorders of muscle [21].
Manual muscle testing is widely used as clinical tool and pick up significant changes in muscle strength that may not be reflected in a gross motor functional scale [22]. The test is not appreciated as an outcome measure in clinical trials because of low intra-rater reliability; it is however, recognized that reliability is improved when evaluators are experienced and few [23] as was the case in our study.
MFM score % indicated a change in the standing and transfer dimension (D1) but could not capture a change in proximal and distal function (D2, D3) although this was demonstrated by all MRC % scores (total, proximal and distal scores). A loss of physical function in patients with DNM2 mutations was indicated by both MFM and MRC % scores. However, patients with RYR1 and TPM2/3 mutations also lost muscle strength as measured by MRC% scores; a finding that was not captured by MFM sum scores %. This potential lack of discrimination among strong patients and the suggestion of a ceiling effect in the proximal and distal dimension has been addressed in the new MFM version Rs-MFM25CDM for patients with CM [21].
Correlations between MFM and MRC scores were high with exception of MFM distal scores (D3) that had the lowest correlations among the physical assessment methods. CM phenotypes mainly manifest with general or proximal impact on muscle strength and fatigability and distal motor function is often well preserved. Consequently, assessment of distal fine motor function may not be appropriate to reflect disease impact in a CM population with a high variability in physical function.
Most patients in our study had decreased forced vital capacity (FVC %) and in more than half of the patients, FVC % deteriorated over time. Earlier studies have documented that patients with nemaline mutations have a significant respiratory insufficiency [2, 24], which was also the finding in our group of patients; furthermore our results indicated that change over time was most pronounced in patients with ACTA1 and NEB mutations. Respiratory complications in patients with congenital myopathy can develop over time independent of functional status and regular assessment of respiratory status is therefore recommended [1]. It is well-known that patients with SEPN1 mutations have a lower forced vital capacity in lying vs. upright position due to diaphragmatic dysfunction [25], but little is known about this in other genetic CM sub-groups. Our results indicate a general decline in FVC % in lying position, but our group of patients is too small to say whether it relates to age, genetic subtype, or level of respiratory function.
Correlations between FVC% and MFM scores were significant with expectance of the distal dimension D3. The highest correlation was found in the axial/proximal dimension D2; the items in this dim-ension involve not only axial and proximal muscles but also core muscles, that must provide stabilization for the functional tasks. The relatively high correlation is therefore not surprising.
In the clinic, the patient’s own perception about the status of their disease is important since this - in combination with the clinical assessment - form the basis treatment interventions. We have earlier shown that fatigue is a characteristic feature in patients with CM and should be addressed when rehabilitation is planned [12]. Patients’ own experiences on progression are not always captured by the outcome measures and physical changes perceived important by patients may turn out to be non-significant in clinical trials. In this study, we wanted to evaluate whether the patient’s own experience on progression was reflected by the applied assessment methods. In general, agreement among patients and assessment methods was very good; in nearly all patients who thought their course of disease had been stable or had deteriorated, this was captured by the assessment methods. Our decision of a minimum 5 % change from baseline assessment in MFM and MRC sum scores to establish progression or improvement was an attempt to estimate whether the patients perceived this relatively small change as important. To calculate the minimal clinical important difference (MCID) [26] we should have given the patient more possibilities to rate their answers and not only one question with only three options (progressive, stable, improved).
There are several questionnaires that evaluates patients’ opinion and perception of their disease but since our aim was to evaluate the course of disease, we abstained from looking further into these areas in this study.
An improvement in muscle strength and physical function was only seen in the two youngest patients in our study. The inclusion age (5 y) at the initial study was set because several of the assessment methods were not validated for children under age 5 years but have probably influenced the possibility of detecting the improvement in motor functions that is often seen in very young children with CM. Furthermore, since only 4/23 patients in the follow-up study were younger than 18 years at the initial assessment, we could not compare the course of disease in patients < and≥18 years at the first assessment. Thus, the general impression on improvement or stability of the disease in childhood and adolescence cannot be confirmed from the study.
Our study population is too small to conclude upon the natural history of individual subtypes of CM. It is, however, one of the first prospective evaluations of CMs and thus an important contribution to the description of the natural history.
The collection of CM natural history data is important but challenged since many patients with pathological features of CM remain without a genetic diagnosis [10], new CM-genes are still identified [27] and patients who are already genetical confirmed may have a potential lower motivation to participate in observational studies. In the light of this it is important to find a core set of relevant and valid outcome measures that have potentials not only for clinical trials but also for clinical care. The results from this study may contribute to this discussion.
CONCLUSION
Although the number of patients in this study is too small to be conclusive, our findings indicate that CM can be stable or slowly progressive depending on the genetic subtype; assessment methods must be sensitive to capture progression if present and to reflect the patient’s own perception of the disease.
Footnotes
ACKNOWLEDGMENTS
We thank our patients for their time, efforts, and contribution to gather important knowledge on their disease.
This study has not received any funding.
CONFLICT OF INTEREST
The authors have no conflict of interest to report.
Appendix
Genetic mutations and age at independent walking in 23 patients .
ID
Diagnosis
Gene mutation
Month at independent walking
16
ACTA1
c.16 G > A
24
49
ACTA1
c.1106C>T
24
7
NEB
c.2836-2A>G; c.576315G>A
22
48
NEB
c.11330dup; c.10354T>C
12
47
NEB
c.10354T>C; c.17725G>T
14
58
NEB
c.12130C>T; c.17503_17505del
20
35
TPM2
daughter 34
15
34
TPM2
c.415_417delGAG
23
5
TPM3
c.503G>A
17
91
TPM3
c.502C>T
24
102
MTM
c.1037 G > C
18
46
DMN2
c.1840G>A
17 (lost at 13 y)
8
DNM2
c.1393C>T
18
67
DNM2
c.1102G>A
14
82
DNM2
c.1393C>T
9
85
DNM2
c.1553G>A
12
6
RYR1
c.14818G>C
18
9
RYR1
c.325C>T; c.2989C>T
15
25
RYR1
c.14567C>G
14
31
RYR1
c.14422–14423delinsAA
Never achieved amb
81
RYR1
sister to 107
15
107
RYR1
c.325C>T; c.7308_7309delTG
24 (lost at 14 y)
83
RYR1
c.14567C>T
15