
Abstract
Background:
Congenital Myotonic Dystrophy (CDM1) is a rare neuromuscular condition caused by a triplet repeat expansion in the DMPK gene. Despite there being a well-recognized clinical syndrome, there has not been an effort to use a standardized ontology system to describe the disease characteristics in existing literature. Thus, comparing or contrasting different cohorts from the literature can be challenging, and coding disease features for clinical research or for registry data items is not uniform. PhenoStacks is a visualization analytics tool which helps graphically illustrate phenotypes of patients with genetic disorders using Human Phenotype Ontology (HPO) terms and can sort phenotypes by different disease characteristics.
Objective:
To demonstrate the efficacy of PhenoStacks and the HPO system as clinical research tools when describing CDM1 cohorts.
Methods:
Health Endpoints and Longitudinal progression in congenital myotonic dystrophy (HELP-CDM) is an ongoing study which longitudinally follows patients with CDM1. Items from the HELP-CDM data sheet were matched to corresponding HPO terms and analyzed using PhenoStacks.
Results:
In total 40 subjects’ phenotypes were visualized through PhenoStacks and 73 HPO terms were used for the analysis. Frequent phenotypic features included “high narrow palate”, “facial palsy”, “ptosis”, “hyporeflexia”, and “weak voice”. Contractures were associated with higher repeat sizes. Hypoplastic muscles and infantile axial hypotonia were more frequently observed in infants.
Conclusions:
PhenoStacks is a valuable clinical and scientific tool as it identifies variability within cohorts and highlights significant phenotypic features.
Abbreviations
(congenital myotonic dystrophy)
(Human Phenotype Ontology)
INTRODUCTION
Congenital myotonic dystrophy (CDM1) is the most severe form of Myotonic Dystrophy type 1 (DM1). DM1 itself is one of the most commonly inherited neuromuscular disorders in adults, but CDM1 is rarer, with an incidence of 2.1/100000 in Canada [1]. The condition is autosomal dominant and caused by a CTG repeat expansion in the DMPK gene. The pathophysiology is not primarily related to dysfunction of the DMPK protein product, but rather to a spliceopathy that is related to dysregulation of mRNA binding proteins caused by the abnormally expanded CTG mRNA. The clinical presentation during the prenatal period is with polyhydramnios and reduced fetal movements; while in the neonatal period patients can have severe hypotonia, feeding, and respiratory difficulties, and clubfeet [2, 3].
While there have been studies done on the initial presentation of CDM1, less is written about the long-term consequences, and the best methods to monitor clinical outcomes in older children. Health Endpoints and Longitudinal progression in congenital myotonic dystrophy (HELP-CDM) is an ongoing study which longitudinally follows patients with CDM1 in order to describe the natural history and evaluate outcome measures of progression of the disease. The study is jointly directed by the Universities of Utah and Western Ontario respectively. Data being collected includes medical morbidity and mortality, multiple functional testing, orofacial testing, neuropsychological profiling, quality of life studies, imaging and tissue biomarkers, as well as evaluation of the cardiac, respiratory, and gastrointestinal systems [4]. However, it became clear during the development of the data collection items that there was variability in the way phenotypic features are described.
A database like the Human Phenotype Ontology (HPO) helps provide a standardized vocabulary of phenotypic abnormalities encountered in human diseases. The HPO was first published in 2008 and continues to grow with over 14000 terms in the database [5]. The HPO collaborates with many organizations such as OMIM, Orphanet, DECIPHER, and medical literature to further develop its clinical vocabulary. The HPO is a flagship product of the Monarch Initiative, and is used for differential diagnosis, translational research, and deep phenotyping. Each phenotypic abnormality is a separate HPO term and is assigned a specific identification [5]. The terms are arranged in a directed cyclic graph and are connected by “is-a” relationships, and each term can have more than one parent term. For example, dysphagia is both an abnormality of esophageal physiology and an abnormality of nervous system physiology.
PhenoStacks [6] is a novel visual analysis tool that enables comparison of patients’ phenotypes using a matrix-like visualization based on Human Phenotype Ontology (HPO) terms.
The study had the following objectives 1) Demonstrate PhenoStacks’ effectiveness at visually identifying salient characteristics in a cohort of CDM1 patients, and 2) List the benefits of using HPO terms to describe phenotypic features of CDM1.
MATERIALS AND METHODS
Ethics Approval for the HELP-CDM study was obtained from the two enrolling sites: Western University and the University of Utah. Children aged 0-13 years and 11 months were enrolled if they fit the definition of CDM1 as follows; All participants had (1) an onset of symptoms in the neonatal period requiring 72 hours or more of hospitalization, (2) a history of hypotonia, respiratory failure, or feeding difficulty, and (3) participants were required to have genetic testing confirming a CTG repeat expansion in the DMPK gene greater than 200 repeats [1]. Forty children from the HELP-CDM sample were used for this study who had adequate phenotyping done as part of the medical history. The details of this study can be found in the following reference [4]. Items from the HELP-CDM Data Collection Sheet, were then paired with matching HPO terms. If a term could not be mapped to the most specific HPO term available, a more general term was used if it was still diagnostically appropriate. However, if the general term was too broad, i.e., abnormality of the nervous system, then it was not included. The data was then entered and analysed with PhenoStacks. PhenoStacks is described in detail by one of the authors (MG) in a recent paper [6]. A visual schematic of how to interpret the findings from PhenoStacks is presented in Fig. 1A to 1E. The visualization of the whole cohort arranged by age and the occurrence of the phenotypic features can be seen in Fig. 2.
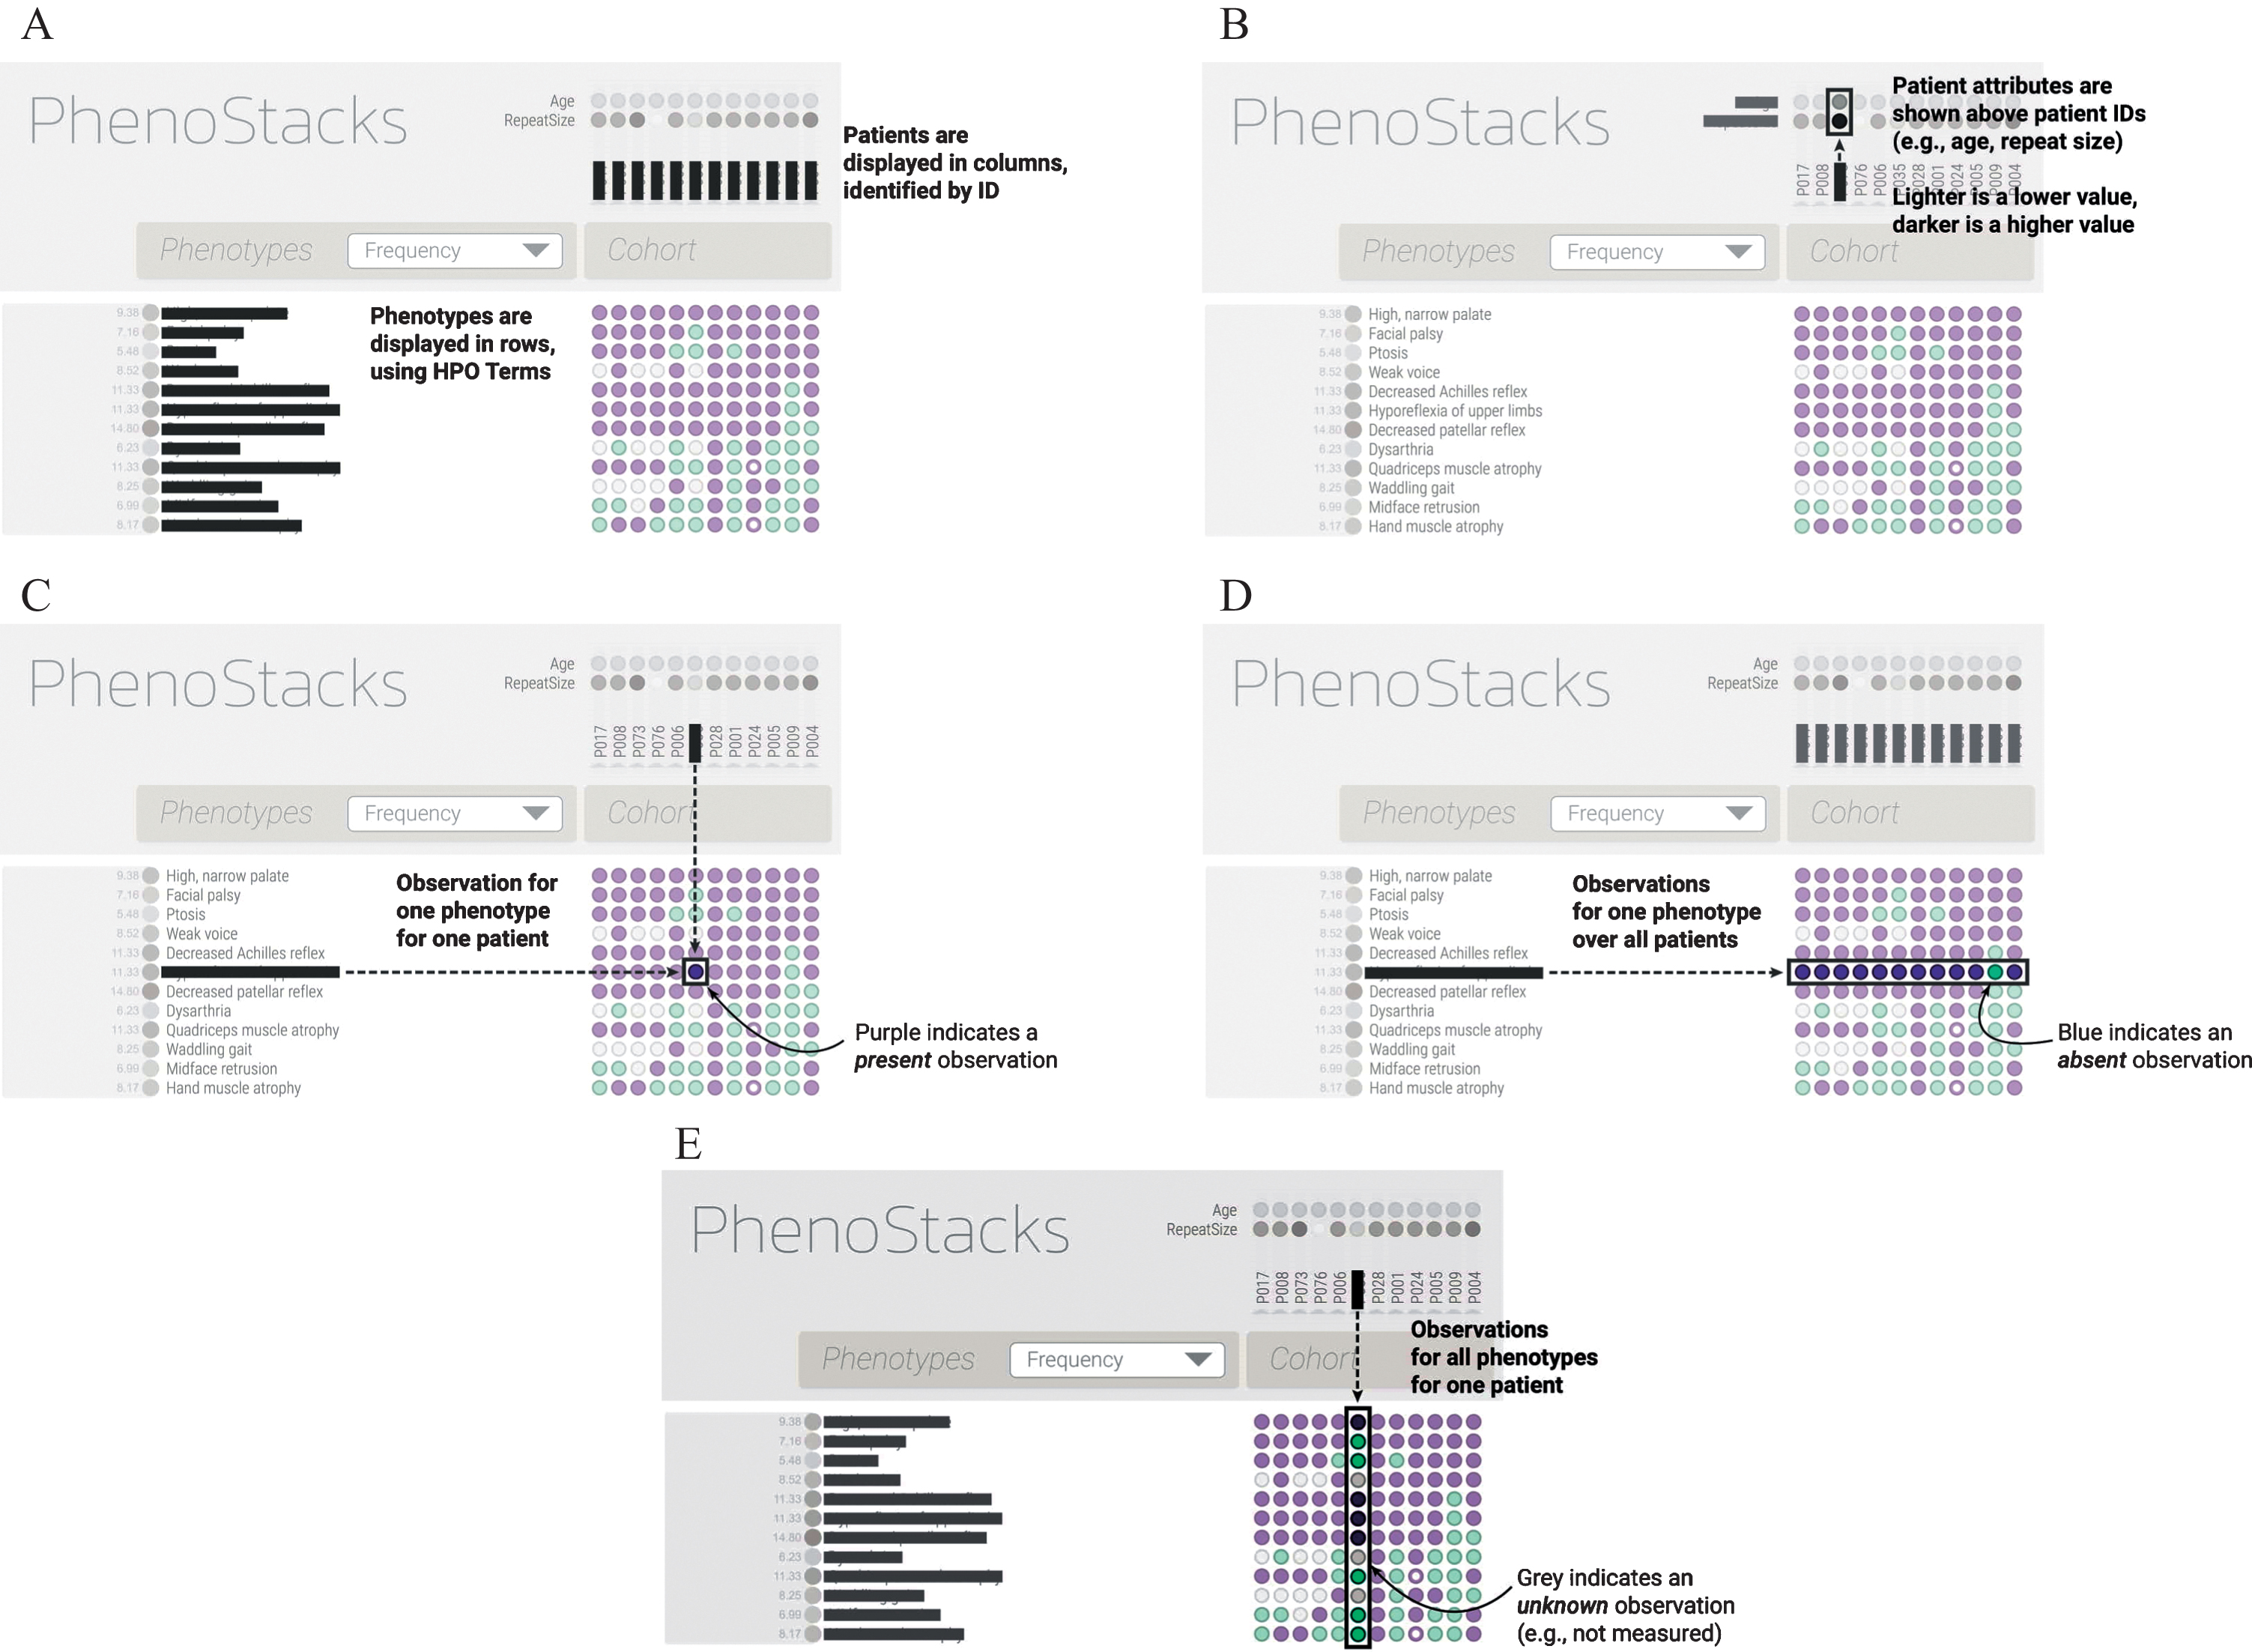
A– E: The figures above explain how to read and interpret the findings in PhenoStacks.
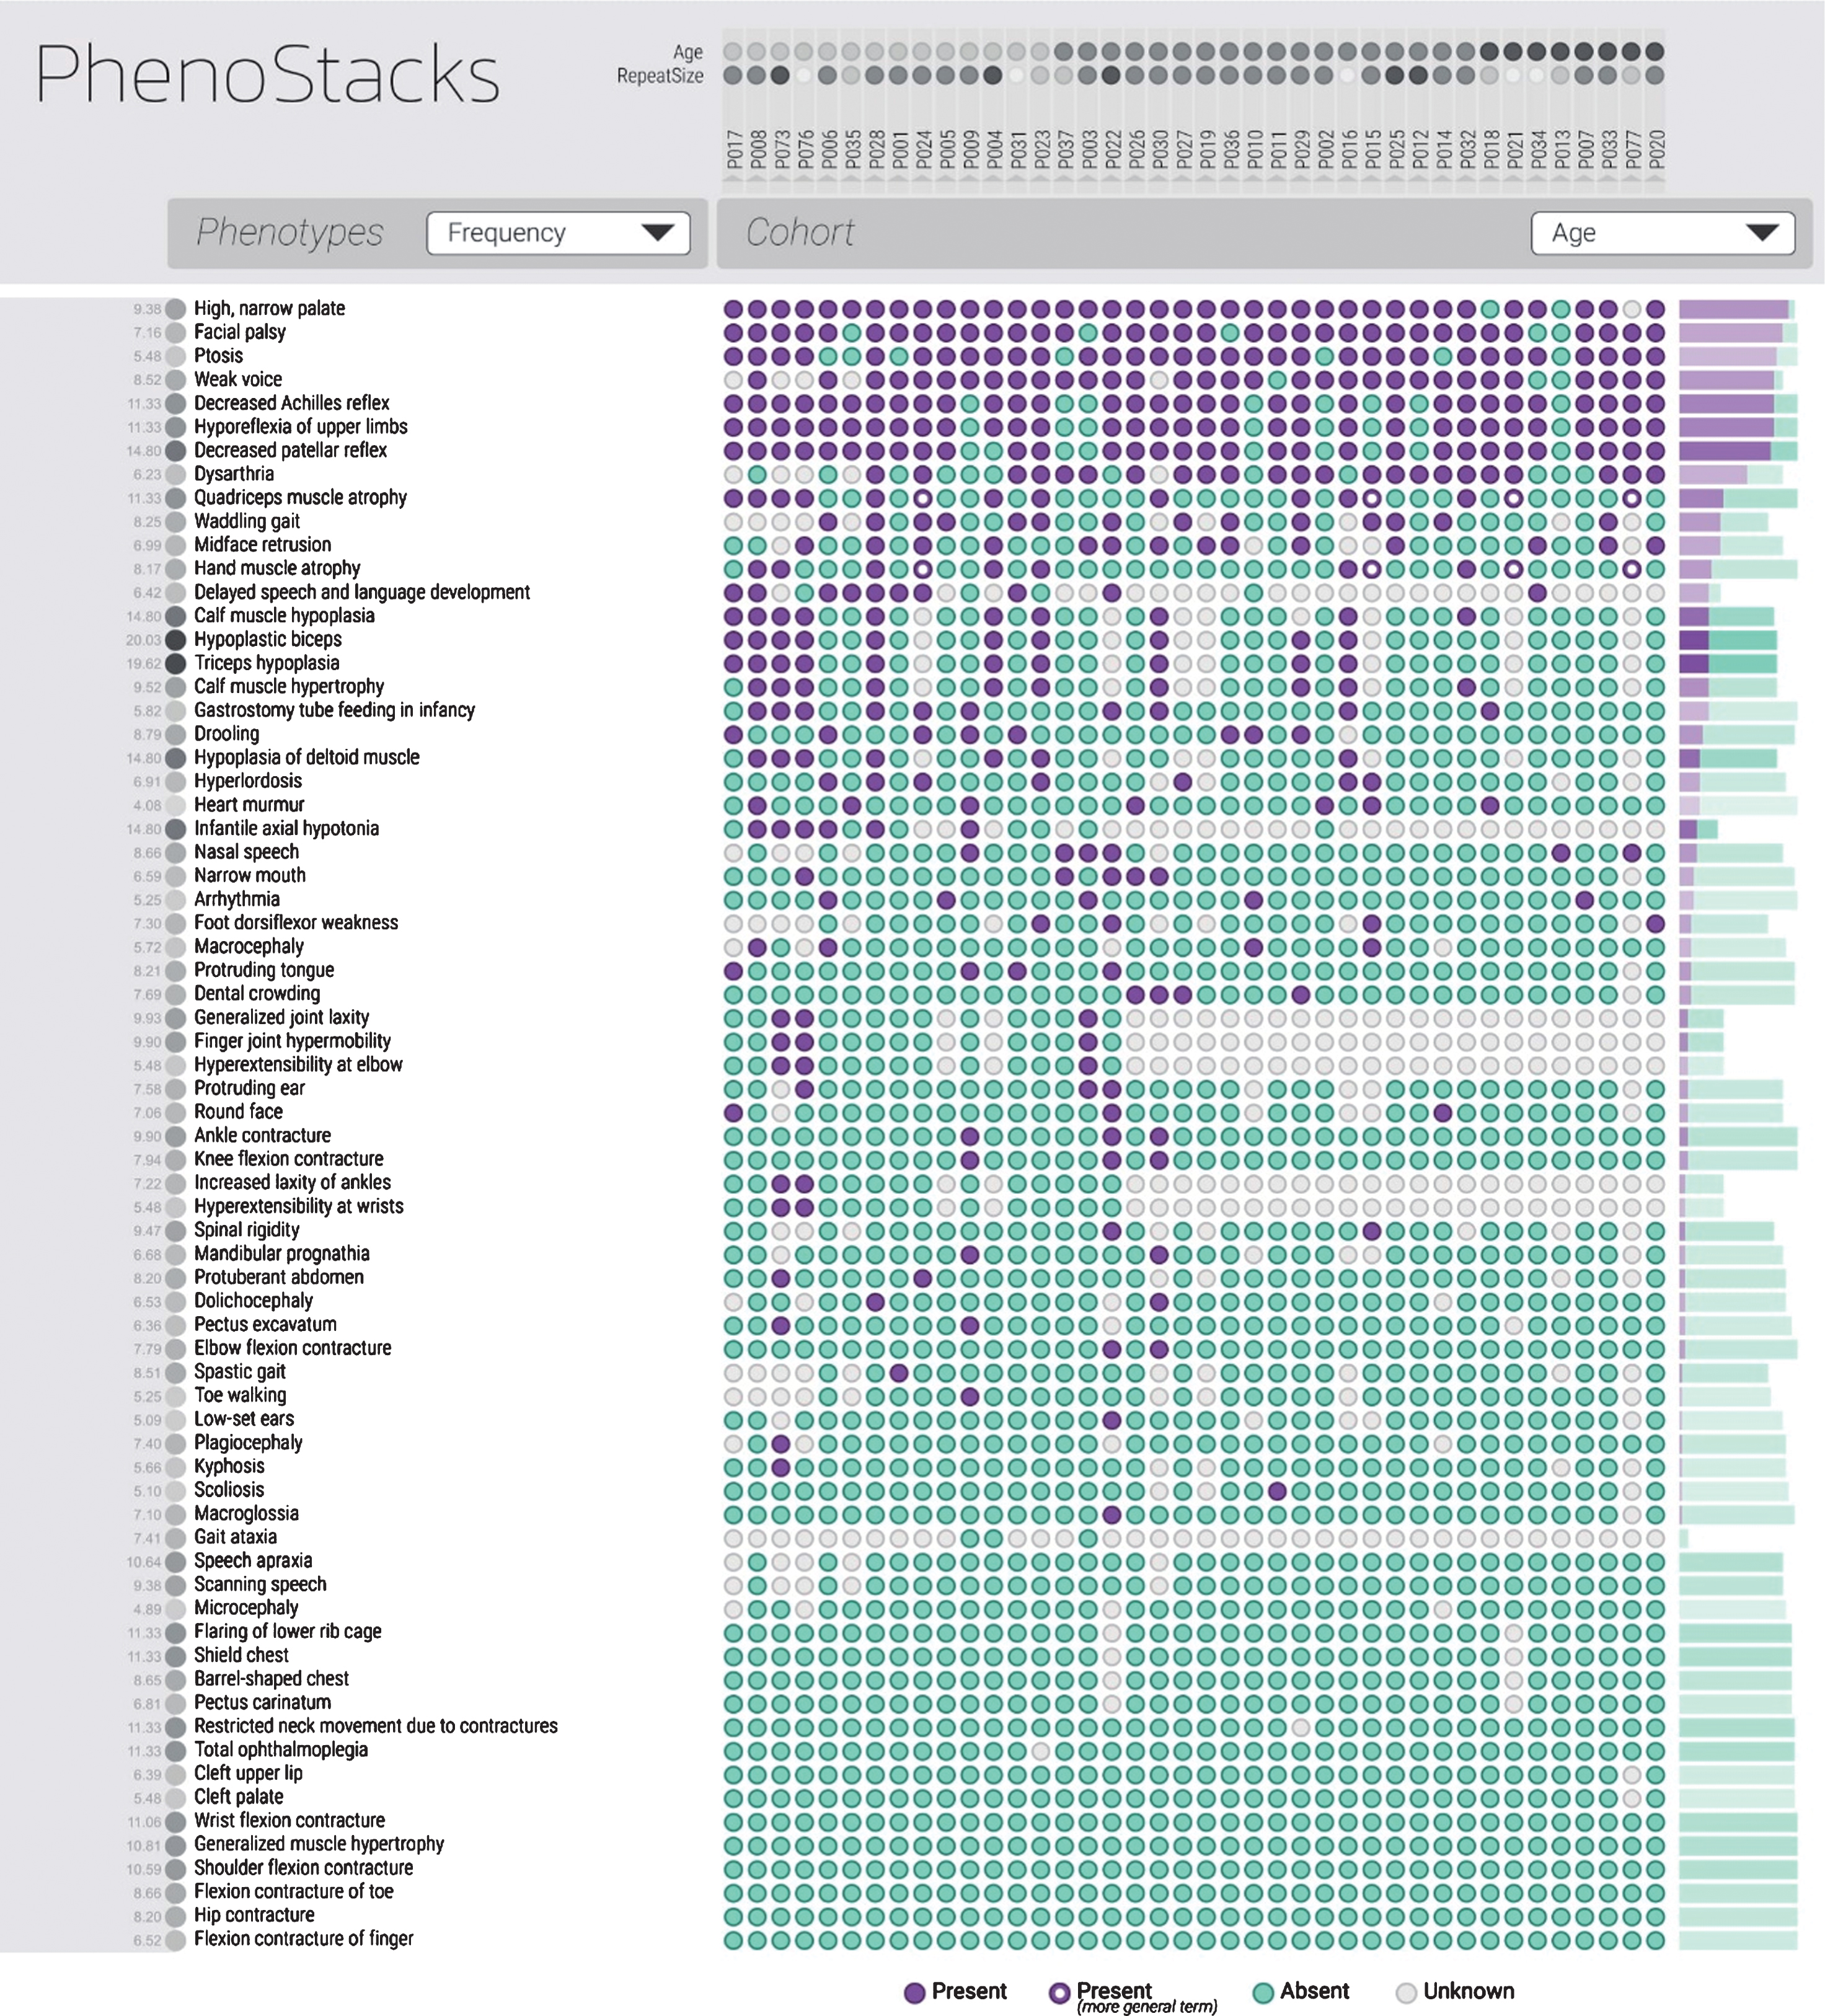
The most frequently appearing phenotypes are listed in descending order. The cohort has been organized by age with the youngest patients appearing on the left and the oldest on the right. As indicated in the figure, purple indicates a present phenotype, blue indicates an absent phenotype and gray is unknown. The figure has been updated to include terms that were not originally found during the mapping process such as macroglossia.
RESULTS
In total, forty CDM1 patients’ phenotypes were analyzed. The ages ranged from 1.67 to 13.22 with the average age being 6.12. The length of CTG repeats ranged from 300 to 2530, with the average being 1196. The repeat size for five patients was unknown at the time of the study. The authors used the inputted HPO terms in PhenoStacks. Using PhenoStacks enabled a visual representation of the cross-sectional sample of children with CDM1. The cohort was sorted by different factors in order to identify possible phenotypic trends in the samples. The most frequently visualized phenotypic features of CDM1 included facial palsy, high narrow palate, ptosis, weak voice, and hyporeflexia (Fig. 3). The most frequently visualized feature in the category of lower extremity distal features was a decreased Achilles reflex (Fig. 4).
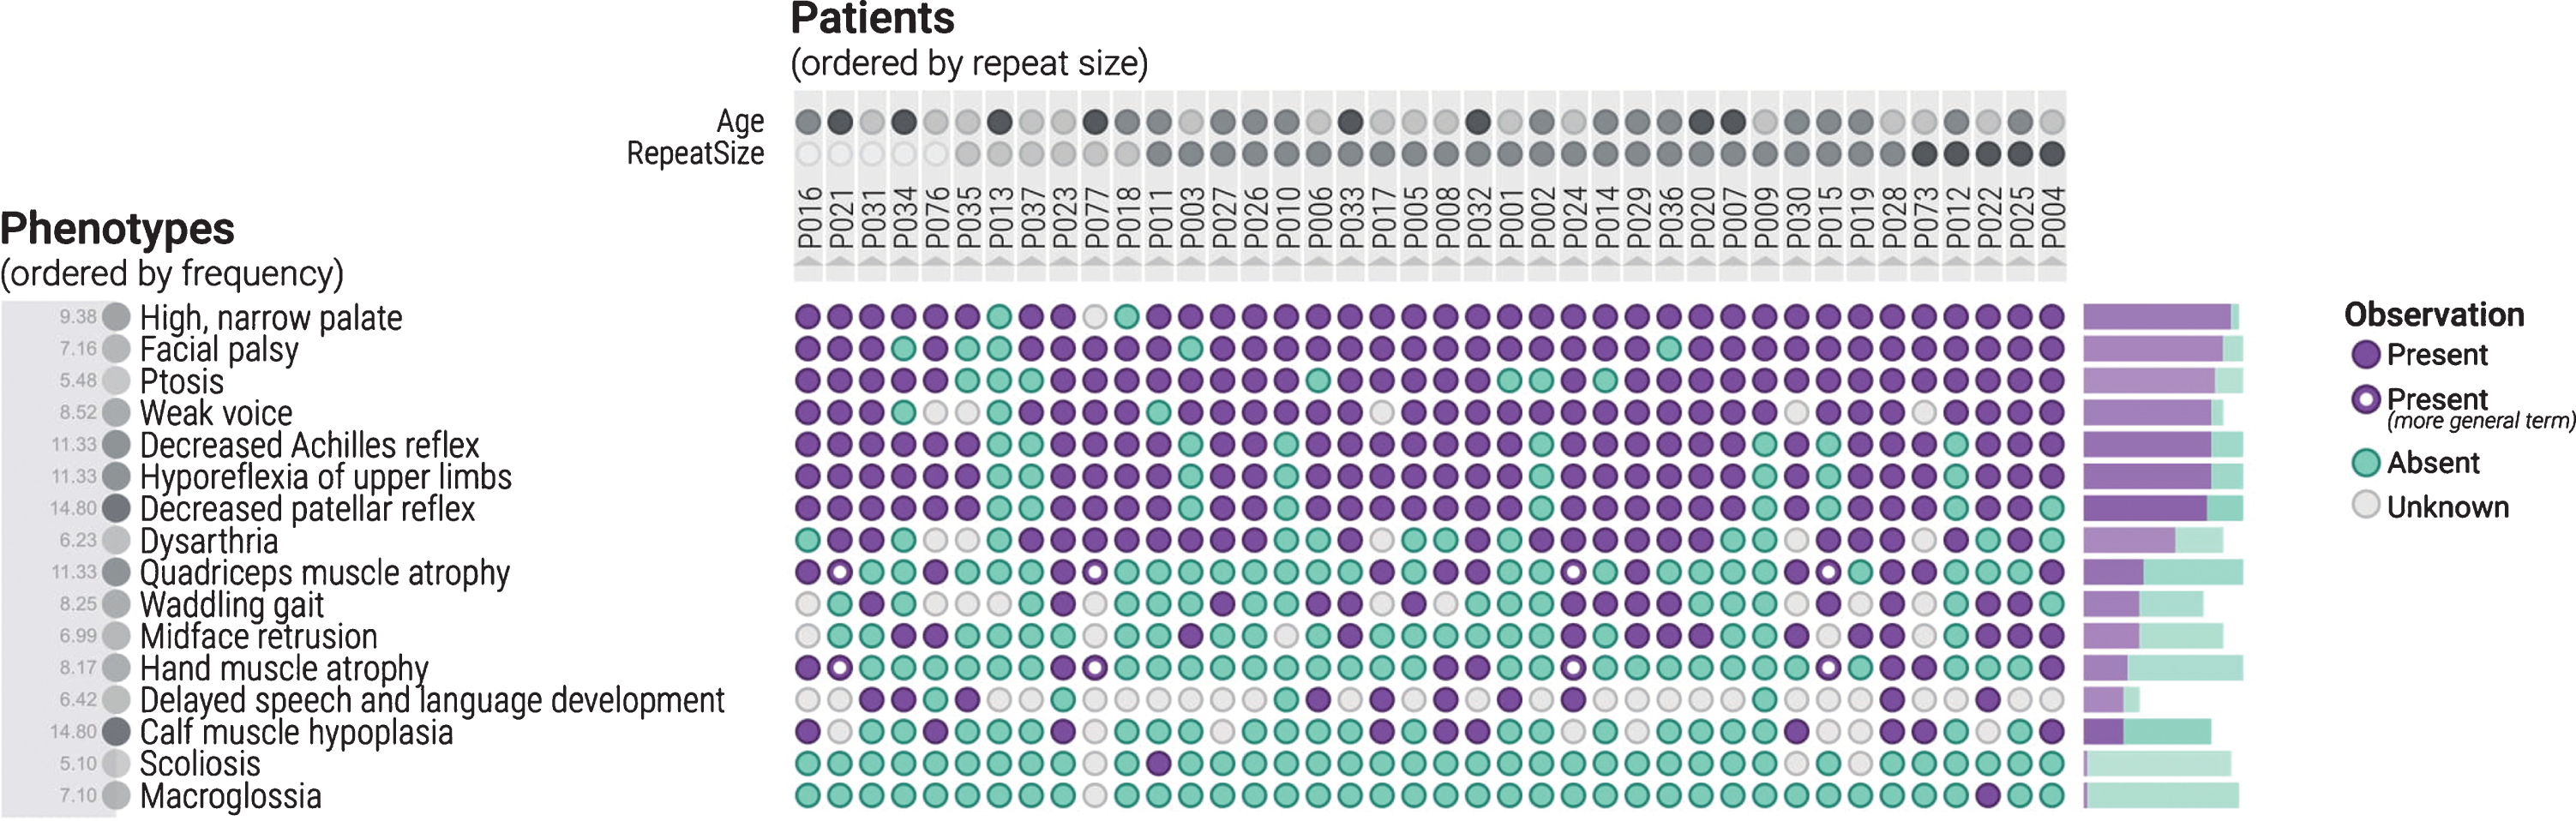
The cohort is now organized with the patients in order of repeat size, from the smallest repeat size on the left to the largest on the right. The phenotype terms are organized by frequency. In this figure, the most frequent phenotypes observed in this cohort are displayed, as evident by the large number of purple coloured circles displayed.
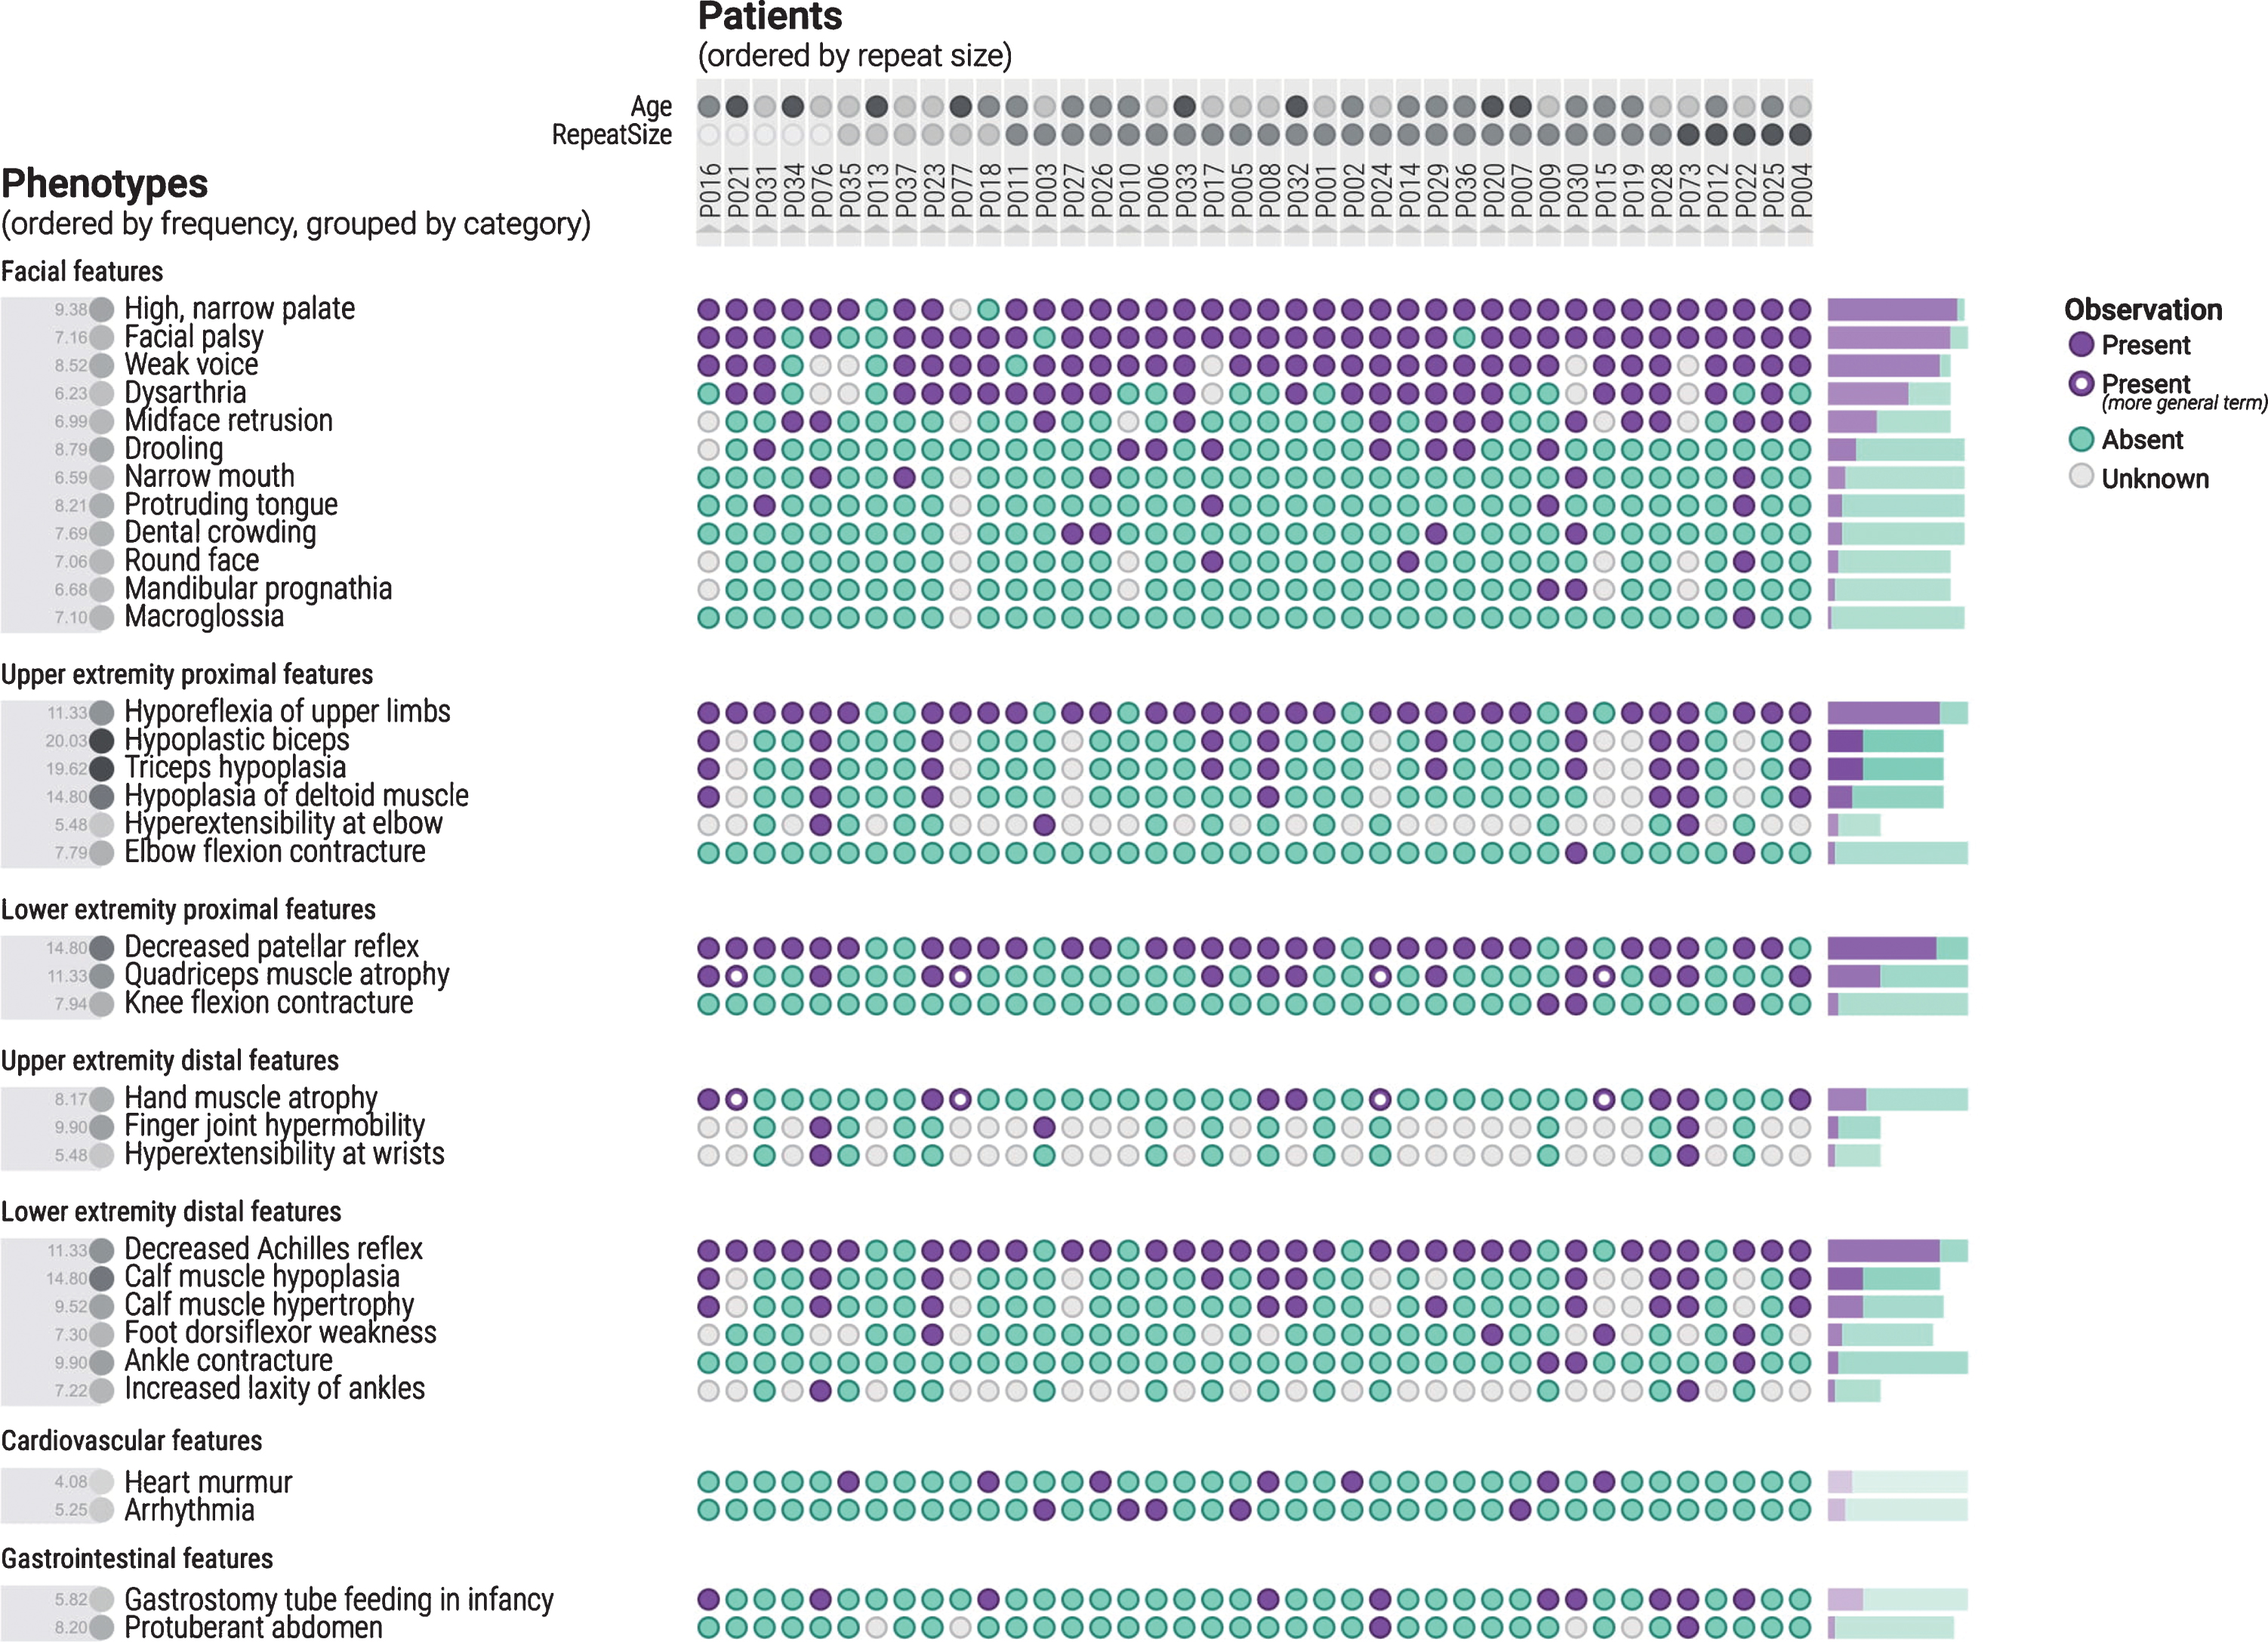
The phenotypes are organized by category, with the cohort sorted by repeat size. The highest frequency of visualized features within each category can be seen.
The April 2016 release of the HPO was originally used for this study. In general, there was good association between the HELP-CDM Data Collection Form items and the corresponding HPO terms. 73 different HPO terms could be directly mapped to clinical phenotypic features that the investigators had felt important to collect in the course of the study.
In four cases, no corresponding HPO term could be identified at the time. Tracheostomy, hypertrophic tongue, babbling speech, and flat chest were items in the HELP-CDM Standard Data Collection Sheet, but there was no corresponding HPO term. However, after review of the HPO database, macroglossia (HP:0000158) was found to be a corresponding term. Tracheostomy is not a phenotypic feature; however, for the study it was important to identify patients who are dependent on invasive mechanical ventilation. The closest HPO term found is Respiratory failure requiring assisted ventilation (HP:0004887). More often, the closest HPO term found lacked the desired level of precision. For example, at the time of this study in 2016, distal muscle finger flexor weakness was not an HPO term, but it has since been added (HP:0031177), as HPO is a dynamic system where new terms are added regularly. The three missing terms have been submitted to the HPO for consideration.
Phenotypic features can also be organized into disease severity markers for further analysis. The goal of this exercise is for the user to be able to visually identify trends in the data by categorizing the patients. As seen in Fig. 2, there is not much variation in frequency of phenotypic features across repeat size in this sample. This is what would be expected for a relatively homogeneous sample of CDM1. However, over a wider spectrum of DM1 patients this could be very valuable for hypothesis generation in clinical research. In addition, one can look at specific phenotypic categories as well to try to identify trends. Ankle, knee, and elbow contractures tended to be associated with longer repeat sizes (Fig. 5). When sorted by age it was apparent that hypoplastic muscles and infantile axial hypotonia were more frequently observed in younger patients (Fig. 6). This result, although clinically expected, was included as a reportable trend, as it demonstrates PhenoStacks’ efficacy as a visualization tool.
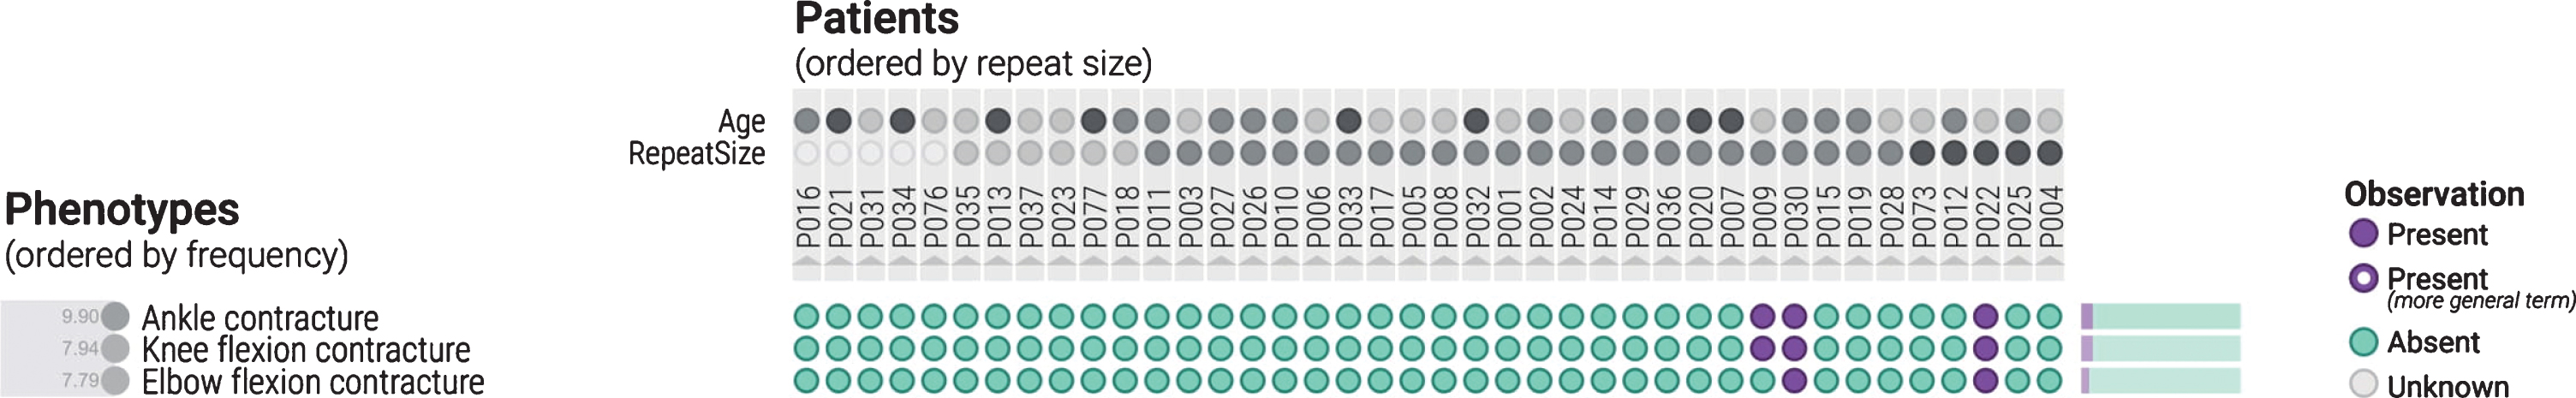
The cohort is arranged by repeat size with the smallest on the left and the largest on the right. Ankle, knee and elbow contractures are more common in higher repeat size patients as indicated by the clustering of purple circles on the right.
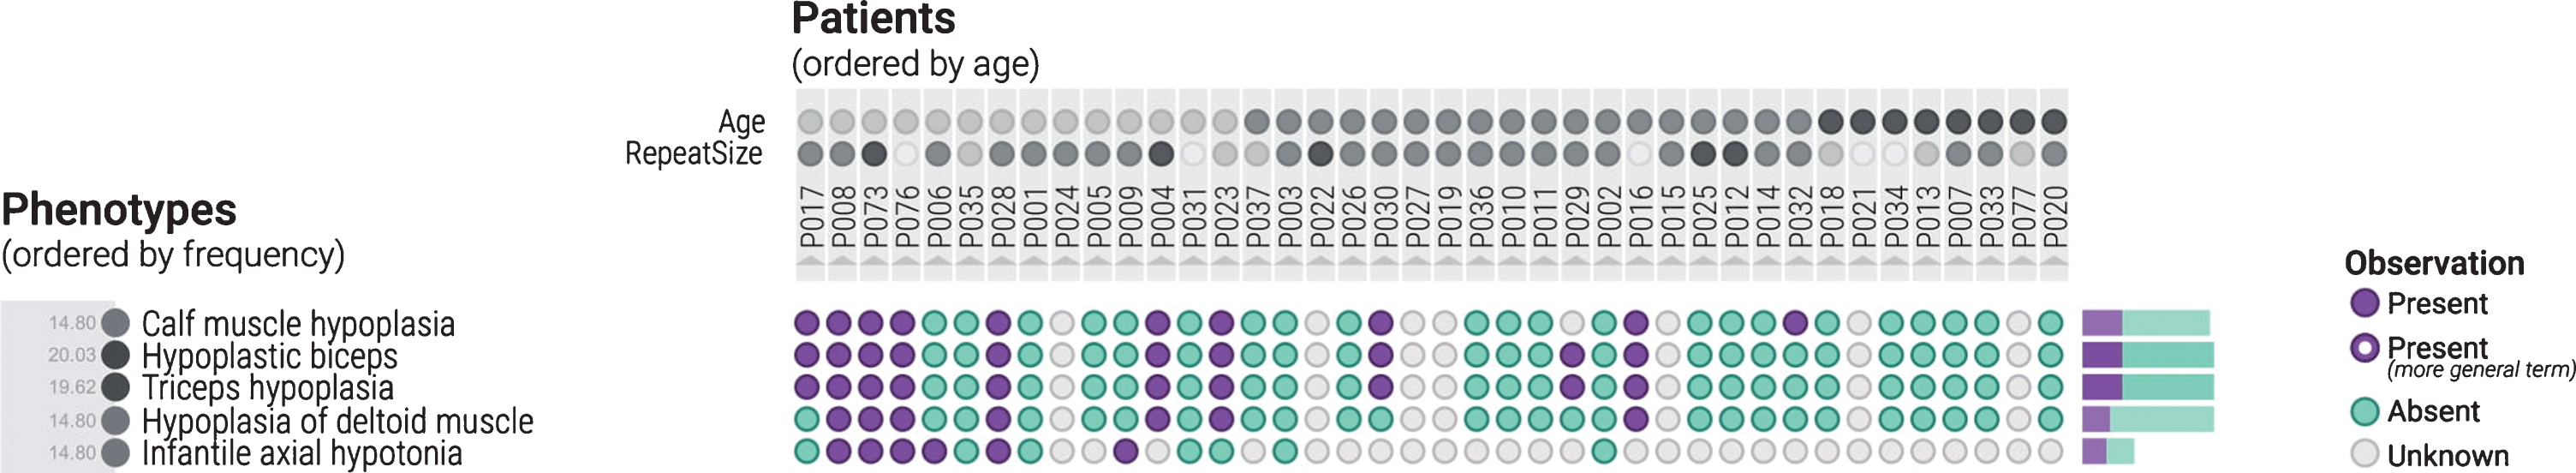
The cohort is arranged by age, with the youngest patients on the left, and the oldest on the right. Hypoplasia of muscles and infantile axial hypotonia are more common in younger patients due to the clustering of purple circles on the left side of the figure.
DISCUSSION
Standardized vocabularies have not, to our knowledge, been previously used to describe CDM1 patients. The HPO system was applicable for characterizing this CDM1 sample of patients in this clinical research project and should be considered as a viable method for future research studies. PhenoStacks helped demonstrate relevant phenotypic features and phenotypic variability within this cohort, as well as provide a tool to visually analyze relationships between phenotypes and disease severity markers. Terms for clinical descriptions can be updated consistently using a common ontology like HPO. Discordance when reporting different phenotypes represents a challenge to describe the frequency of clinical features. The importance of standardizing the phenotypic features during the clinical description for clinical or scientific purposes is to be more homogenous, making it easier to report and measure the frequencies of a certain feature of a disease, and prevent errors that may occur during translation.
It is important to mention that the Monarch initiative, the organization that builds the HPO, has a predecessor tool called Phenogrid, which is used to compare HPO terms to diseases. The phenotypes for each disease appear to be based on a canonical listing based on data from prior research. For example, for a given strain of a disease, phenotypes A, B, and C were observed. These may be different from the HPO terms used for comparison in the Y-axis, so a similarity calculation is performed to determine how close (hierarchically) the observed phenotypes A, B, and C are from any of the comparison HPO terms. This similarity score is used to shade the cells of the matrix. The example usage of Phenogrid is used to compare different strains of diseases, although it is conceivable that it could be used to compare individual patients against a canonical representation of the disease. Examples of how Phenogrid is used can be found here [7].
The key difference between Phenogrid and PhenoStacks is that Phenogrid uses specific terms as points of comparison that may not be derived from the compared diseases. PhenoStacks, on the other hand, uses comparison terms derived from the compared patients. PhenoStacks displays the most granular phenotypes observed across all patients. It also visualizes where overlap with more general terms exist. PhenoStacks provides a multi-scale perspective on the patient phenotypes that includes both granular terms and relevant more general terms. In terms of the goals of this research, as an exploratory investigation into the variability of phenotype presentation in a disease across patients of different ages and severities, the data-centric approach used by PhenoStacks was preferable. PhenoStacks also supported operations (i.e., sorting) on non-phenotypic patient attributes, such as age and repeat size.
PhenoStacks (and the HPO system in general) can be used to visualize similar cohorts of patients, to compare different diseases and for diagnostic purposes by comparing an undiagnosed patient to a cohort. A specific example can help illustrate the clinical application of PhenoStacks. In this specific cohort, one of the frequent phenotypic features was a “High Narrow Palate”. The High Narrow Palate is linked to orofacial weakness, and with a combination of other factors like oropharynx dysfunction and weakness of the facial muscles, it results in oropharynx dysphagia, drooling and speech problems, which are all common to CDM1 [8]. If one were using the HPO and PhenoStacks as a reference for diagnosis, the characteristic features of facial weakness and speech difficulties would map as important diagnostic signs for CDM1.
The HPO is useful for rare conditions where there are only a few cases worldwide. It also provides a standardized vocabulary for clinical databases, allowing for better communication between different research and clinical communities. When the HELP CDM study first began, the authors were unaware of the HPO system. It would have aided in elucidating one formal definition for CDM1, by highlighting the clinical differences between the congenital, pediatric, and adult onset forms of the disorder, as there are currently multiple definitions of CDM1 in use [9].
Future studies with this tool could look at subsets within a cohort and examine the overall homogeneity. Using this tool in larger cohorts can highlight more potential trends between phenotypic features and severity of disease. One of the elements of this cohort specifically that we were interested in was examining whether there appeared to be changes in the cohort depending on age and repeat size. In CDM1 there is a clinical impression that there is an inflection point in the disease symptoms where children seem to change from improvement in symptoms seen with a pathophysiologic consequence of immature muscle development to a more degenerative muscular dystrophy phenotype as seen in more classic older onset of DM1 [10].
PhenoStacks is a tool that visually displays phenotypic features and highlights potential relationships; it is not a tool for statistical analysis. A possible trend that was found during the analysis of phenotypes was that in this cohort, ankle, knee, and elbow contractures were seen in patients who had an increased repeat size (Fig. 4). In general, children with CDM1 are at high risk of musculoskeletal deformities of the lower extremities and contractures are typically located in the lower limb for CDM1 patients [11]. Contractures can contribute to quality of life issues, such as delayed walking in children. If severe, patients may require surgery to correct the deformity [12]. As this cohort is small, this result was not statistically examined. However, more phenotypes of patients with large repeat sizes should be analyzed to see if this trend continues.
The HPO system and PhenoStacks are relevant tools for better characterizing rare genetic diseases like CDM1. A more concerted effort to use this terminology by researchers, rare disease registries and scientific medical journals would start to harmonize the study of DM1.
CONFLICT OF INTEREST
Dr. Campbell is a site investigator for AMO Pharma and Biogen. He has an investigator-initiated grant from Valerion Therapeutics. The other authors have no conflict of interest to report.
Footnotes
ACKNOWLEDGMENTS
We would like to thank the participants of the HELP CDM study.