
Abstract
Background:
Clinical nerve conduction studies (NCS) are often used as a secondary outcome measure in therapeutic trials, but show a high degree of inter-trial variability even when technical factors known to affect the recorded responses are minimised. This raises the intriguing possibility that some of the observed variability may reflect true changes in nerve activity.
Objectives:
Our aim was determine how much variability these factors might produce, and how this might affect the results of commonly used neuropathy rating scales.
Methods:
A standardised protocol was repeated over forty consecutive trials by the same operators in two healthy subjects. The protocol included recordings that shared either a stimulating or a recording electrode position, such that changes due to electrode position could be excluded, and hand temperature was closely controlled.
Results:
Despite controlling for inter-operator differences, electrode position, and hand temperature, the variability in sensory nerve action potential (SNAP) amplitude was extremely high (Range 23 μV, CoV = 10.7–18.8). This variability was greater than the change in amplitude needed to move a subject from point 0 to point 4 on the CMT neuropathy rating scale. Neither temperature or electrode position accounted for all of this variability, suggesting that additional as yet unidentified factors are responsible.
Conclusion:
Even under closely controlled conditions and sophisticated laboratory methods, test-to-test variability can be significant. The factors responsible for this variability may be difficult to control, limiting the utility of single nerve recordings as a trial outcome measure.
Keywords
Abbreviations
Abductor Pollicis Brevis
compound motor action potential
co-efficient of variance
electromyography
intraclass correlation coefficients
median CMAP amplitude
median nerve motor forearm velocity
median digit 1 SNAP amplitude
median digit 1 SNAP conduction velocity
median digit 3 SNAP amplitude
median digit 3 SNAP conduction velocity
median nerve minimum F-wave latency
nerve conduction studies
operator
radial digit 1 SNAP amplitude
radial digit 1 SNAP conduction velocity
subject
standard deviation
sensory nerve action potential
INTRODUCTION
Nerve conduction studies (NCS) are widely regarded as an objective, quantitative and reproducible evaluation of peripheral nerve function [1] and are widely used in the diagnosis of neuropathies, [2] in the serial monitoring of neuropathic disease progression, [3] and in the assessment of therapeutic intervention efficacy [4]. Several commonly used neuropathy rating scales include measures of motor and sensory response amplitudes as an outcome measure [5].
In order for a test to be of use in the long term monitoring of any condition, changes in the results that it generates must be secondary to changes in the underlying pathology, rather than variability inherent to the test itself. However, several of the routinely measured NCS parameters show a high degree of variability over serial measurements [6–9] even when potential technical confounds are minimised. There are two possible explanations for this residual variability; first, the known technical confounds such as hand temperature [10], hand position [11], and electrode position [12–15] produce so much inter-trial variability that it is inherently impossible to control for them completely no matter how carefully the tests are performed. Second, and more intriguing, is that some of the residual variability is not due to technical factors but represent an inherent variability in some physiological parameter such as nerve excitability that affects the recorded responses.
Several factors are known to affect nerve excitability. Some, eg the degree of myelination or depth below the skin are specific to a given nerve and are unlikely to change over the duration of a typical clinical trial. Others, such as extracellular ion concentration, hormone levels or skin conductances do change on a day-to-day basis, and critically all are likely to affect all of the nerves in a given body region. Hence, one prediction is that if changes in nerve excitability account for some of the variability in NCS values, this variability should affect all of the nerves in tandem. However, if all of the variability is due to technical factors such as electrode placement, these will vary independently between nerves.
We present the first longitudinal study of multiple commonly tested NCS parameters. This was designed such that hand temperature was tightly controlled and two of the measured nerves shared a stimulating electrode position, and two shared a recording electrode position. This allowed us to construct a model to determine how much of the variability was due to known sources of variability and how much remained unexplained. We found that even controlling for all known sources of error, the inherent variability of standard NCS parameters was sufficient to cause large changes in the scores of commonly used neuropathy rating scales.
MATERIALS AND METHODS
Subjects
The study was conducted by two healthy right-handed physicians (AK, a woman aged 29, height 165 cm; and GL, a man aged 30, height 178 cm); both were training at the Department of Neurophysiology of the Royal Victoria Infirmary, Newcastle upon Tyne, United Kingdom. This pair performed 40 trials on each other over a period of 113 days ie a total of 80 trials. When acting as a subject these individuals were labelled as S:I and S:II respectively, and when acting as the operator were designated as O:I and O:II respectively. In order to validate the technique of these relatively inexperienced operators, an experienced consultant clinical neurophysiologist (RW) performed the same study protocol on both of these subjects every fifth trial (labelled as O:III) but was not a subject. Neither of the subjects had: any history of hand or upper extremity symptoms; any history of recent or remote trauma; any systemic and central or peripheral neurological diseases; and were of normal body mass index (to limit the influence of physiological variables on the measurements). Both subjects participated after giving written informed consent and all the procedure were performed in accord with the Helsinki Declaration of 1975.
Procedure
A total of nine commonly performed NCS measurements were recorded in each of the 80 trials; details of the nerve conduction methodology is given in the supplementary information. The entire protocol was performed by the same operators on each other, in the same lab and with the same instruments each day at approximately the same time. Room temperature was controlled by a climate control system and was monitored and kept at 30 °C during the whole procedure in order to minimize skin sympathetic reflex activity [16, 17]. The skin temperature in the centre of both hands was measured every trial; if <30 °C, hands were warmed in hot water and the temperature rechecked. During the procedure, hand temperature was checked periodically to ensure it was stably >30 °C (mean hand temperature over the whole procedure was approximately 32 °C). The hand position was kept supinated on a couch with fingers slightly spread in a similar position for all recording configurations (Fig. 1). Although the cutaneous impedance was not measured, the skin was carefully cleaned with alcohol solution and dried if wet. Electrode pads and ring electrodes were soaked for one minute in physiological saline.
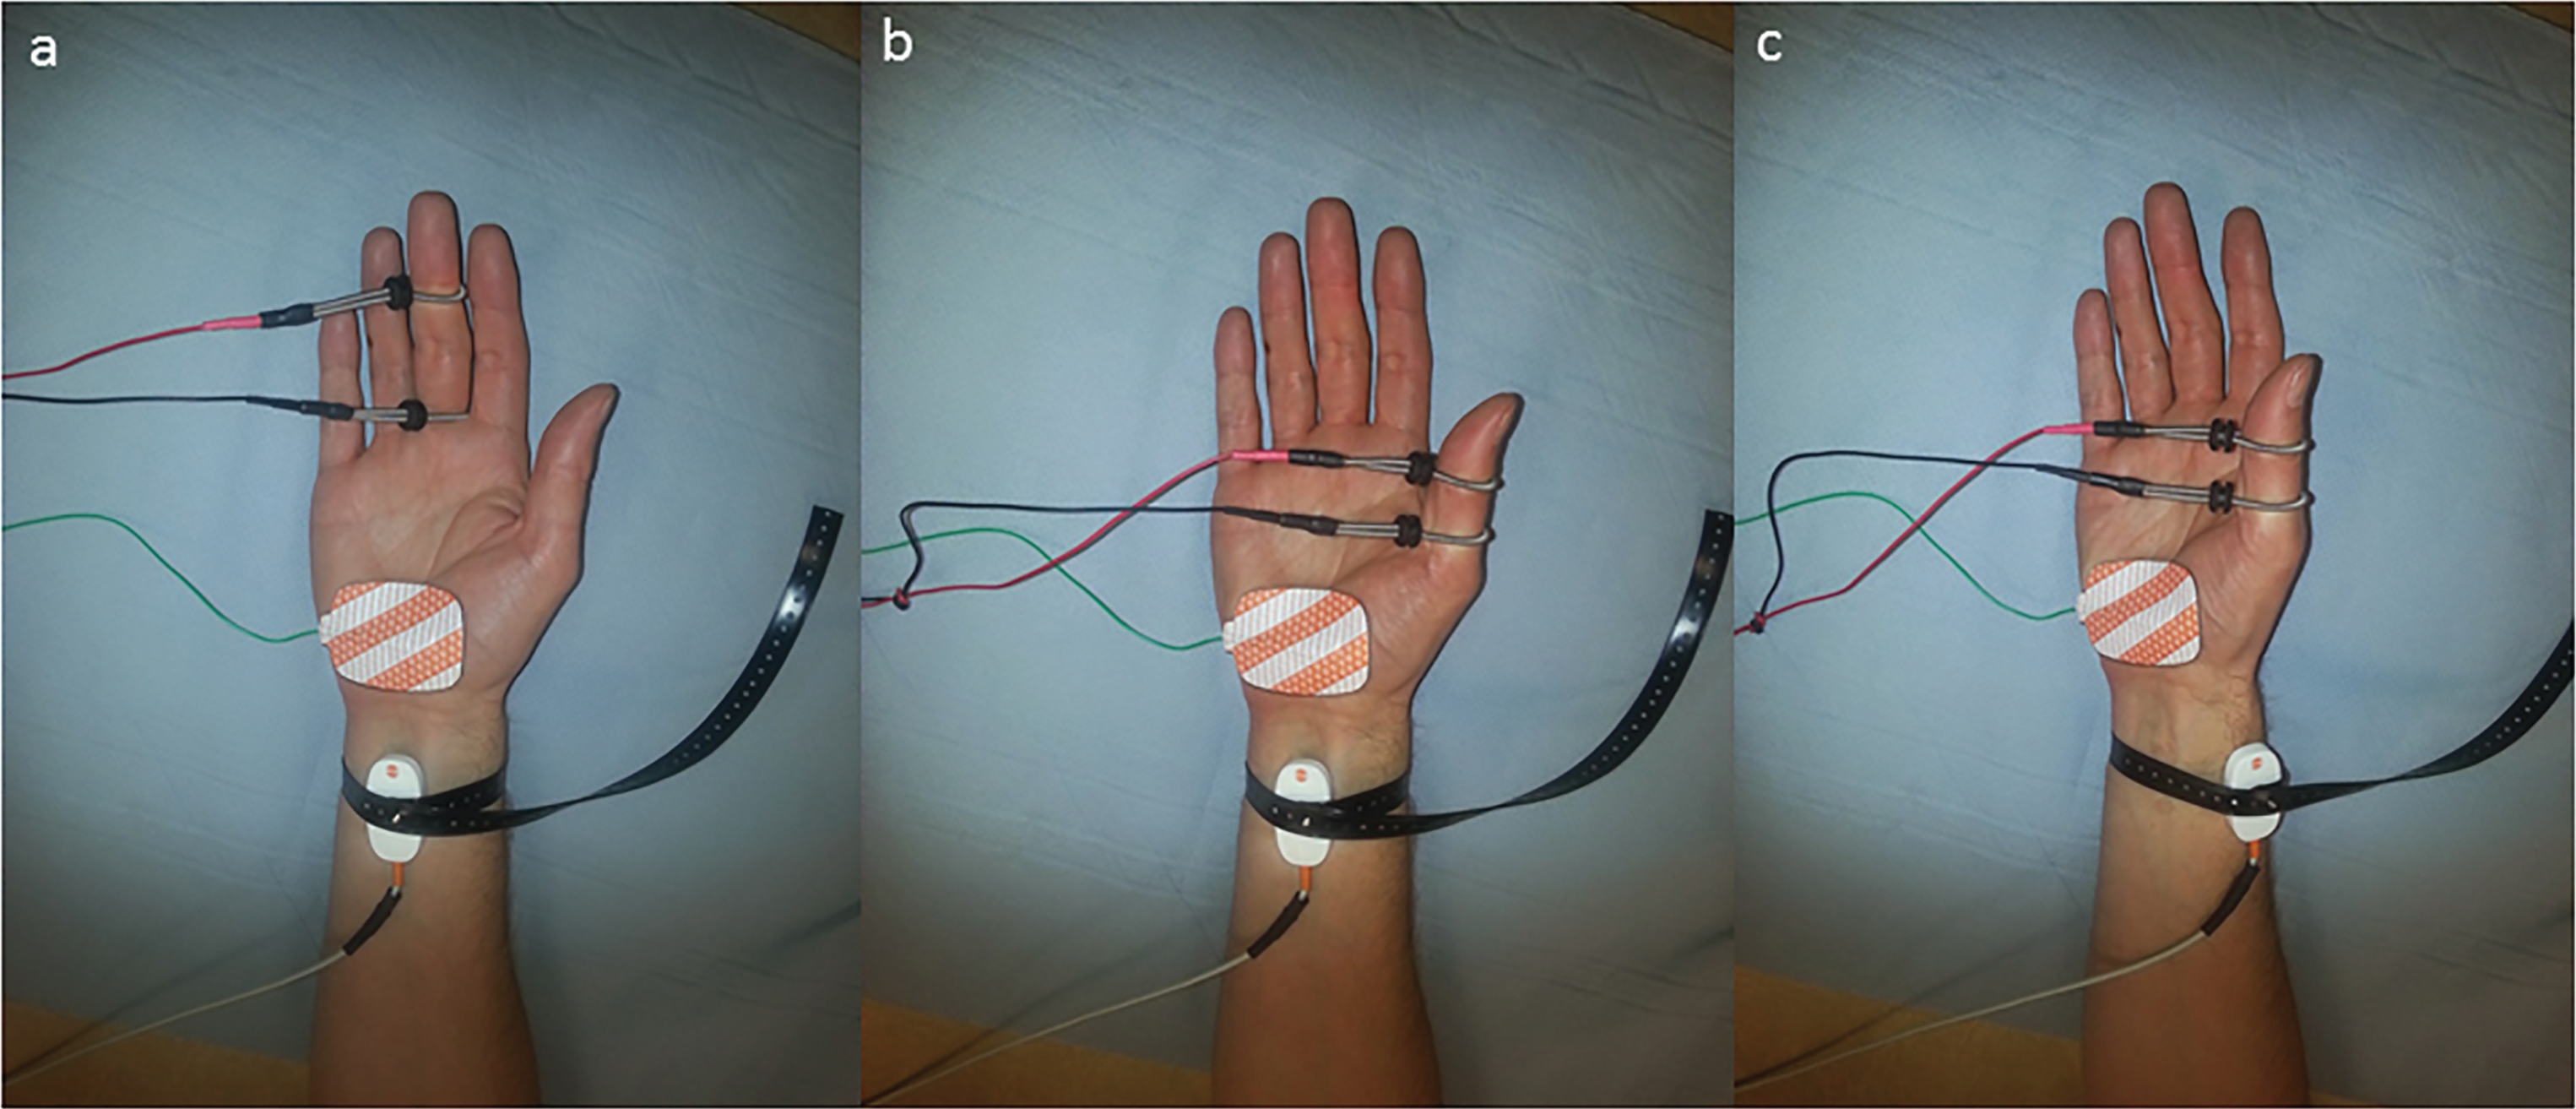
Sequence of electrode placements, a) Orthodromic median digit 3 sensory response. Recording electrodes are placed over the median nerve at the wrist and the stimulating electrodes over the proximal (cathode) and distal (anode) digital crease of digit 3. b) Stimulating electrodes are moved to digit 1 without touching the recording electrode in order to record the median digit 1 response, c) The recording electrode is moved to lie over the radial nerve without touching the stimulating electrodes in order to record the radial digit 1 response.
Analysis
Descriptive statistics, including numbers and percentages of categorical data, or mean, standard deviation and coefficient of variation of numerical data were used to characterize the study sample. The comparison between frequency data was tested by the Fisher exact test. Agreement between the two observers (AK & GL) was estimated using calculations of the intraclass correlation coefficients (ICC). Values of ICC below 0.4 were considered poor, values between 0.4 and 0.75 fair to good, and values ≥0.75 were considered as excellent agreement [18]. We used control charts to monitor statistical stability of repeated NCS measurements in longitudinal design. We applied the six-sigma rule to detect outliers. After detecting and removing outliers for every serial measurement, for both subjects and both sides, we conducted multilevel modelling with NCS data as dependent variables, and skin temperature as an independent variable. Multilevel model was performed with a two-level data structure, with serial measurements on the right or the left side at the first level, and subjects (S:I or S:II) at the second level. We used a two-sided p value ≤0.05 to indicate statistical significance. Statistical analyses were performed using R language and environment for statistical computing (R Core Team, 2014) [19] and SPSS for Windows, version 21.
RESULTS
1) The NCS tests were being performed to a high technical standard
We wanted to assess the variability of NCS indices when as far as possible technical factor had been removed. Although a standardised protocol was used, it was essential to ensure that all the operators were performing the tests to an equal standard. The operators included two relatively inexperienced registrars (O:I and O:II) and one experienced consultant (O:III). During the study period O:III (RW) performed 504 measurements on S:I (AK) and S:II (GL). Observers I (AK) and II (GL) performed 1511 measurements on each other. Poor technique leads to measurement errors, and consequently is expected to increase the number of outliers. In order to ensure that all three operators were performing to an acceptable technical standard, the number of outlying measurements was compared. Observer III had 8 (1.6%) outlier measurements, and observer I and II 27 (1.8%) outliers, together. The number of outliers showed no statistically significant difference (p = 0.85; Fisher exact test), indicating a similar number of errors between the experienced (O:3) and relatively inexperienced operators (O:1 and O:2).
2) The variability differs between parameters and is comparable to previously published data
Having established that all 3 operators were performing the tests to a comparable standard, we compared the variability of each of the 9 indices (Table 1). For this we used the data from O:1 and O:2 since they performed by far the most trials. In keeping with previously published literature, different indices showed different degrees of variability. The lowest co-efficient of variance was seen for the F-wave minimum latency (CoV 1.8). Sensory nerve action potential amplitudes (median-digit 1, median-digit 3, radial-digit 1) showed the highest co-efficient of variation (CoV 10.7–18.8) indicating the least stable parameters (Fig. 2). Among these, the radial nerve showed the highest variation (range 17 to 40 μV; CoV 15.6–18.8) over the 80 trials. Summating the SNAP amplitudes from the 3 different nerves produced a far lower variability (CoV 8.5).
Descriptive statistics of individual nerve conduction indices. Mean, standard deviation (SD) and co-efficient of variance (CoV) for all 9 nerve conduction studies parameters are shown for each subject and for each side (right and left)
MedDig3AMP = median sensory nerve action potential amplitude from digit 3 (μV); MedDig3CV = median-digit 3 sensory nerve action potential conduction velocity (m/s); MedDig1AMP = median sensory nerve action potential amplitude from digit 1 (μV); MedDig1CV = median-digit 1 sensory nerve action potential conduction velocity (m/s); RadDig1AMP = radial sensory nerve action potential amplitude from digit 1 (μV); RadDig1CV = radial-digit 1 sensory nerve action potential conduction velocity (m/s); MedCMAPamp = median compound motor action potential amplitude (mV); MedCV = median nerve motor forearm velocity (m/s); MedFwmin = median nerve minimum F-wave latency (ms).
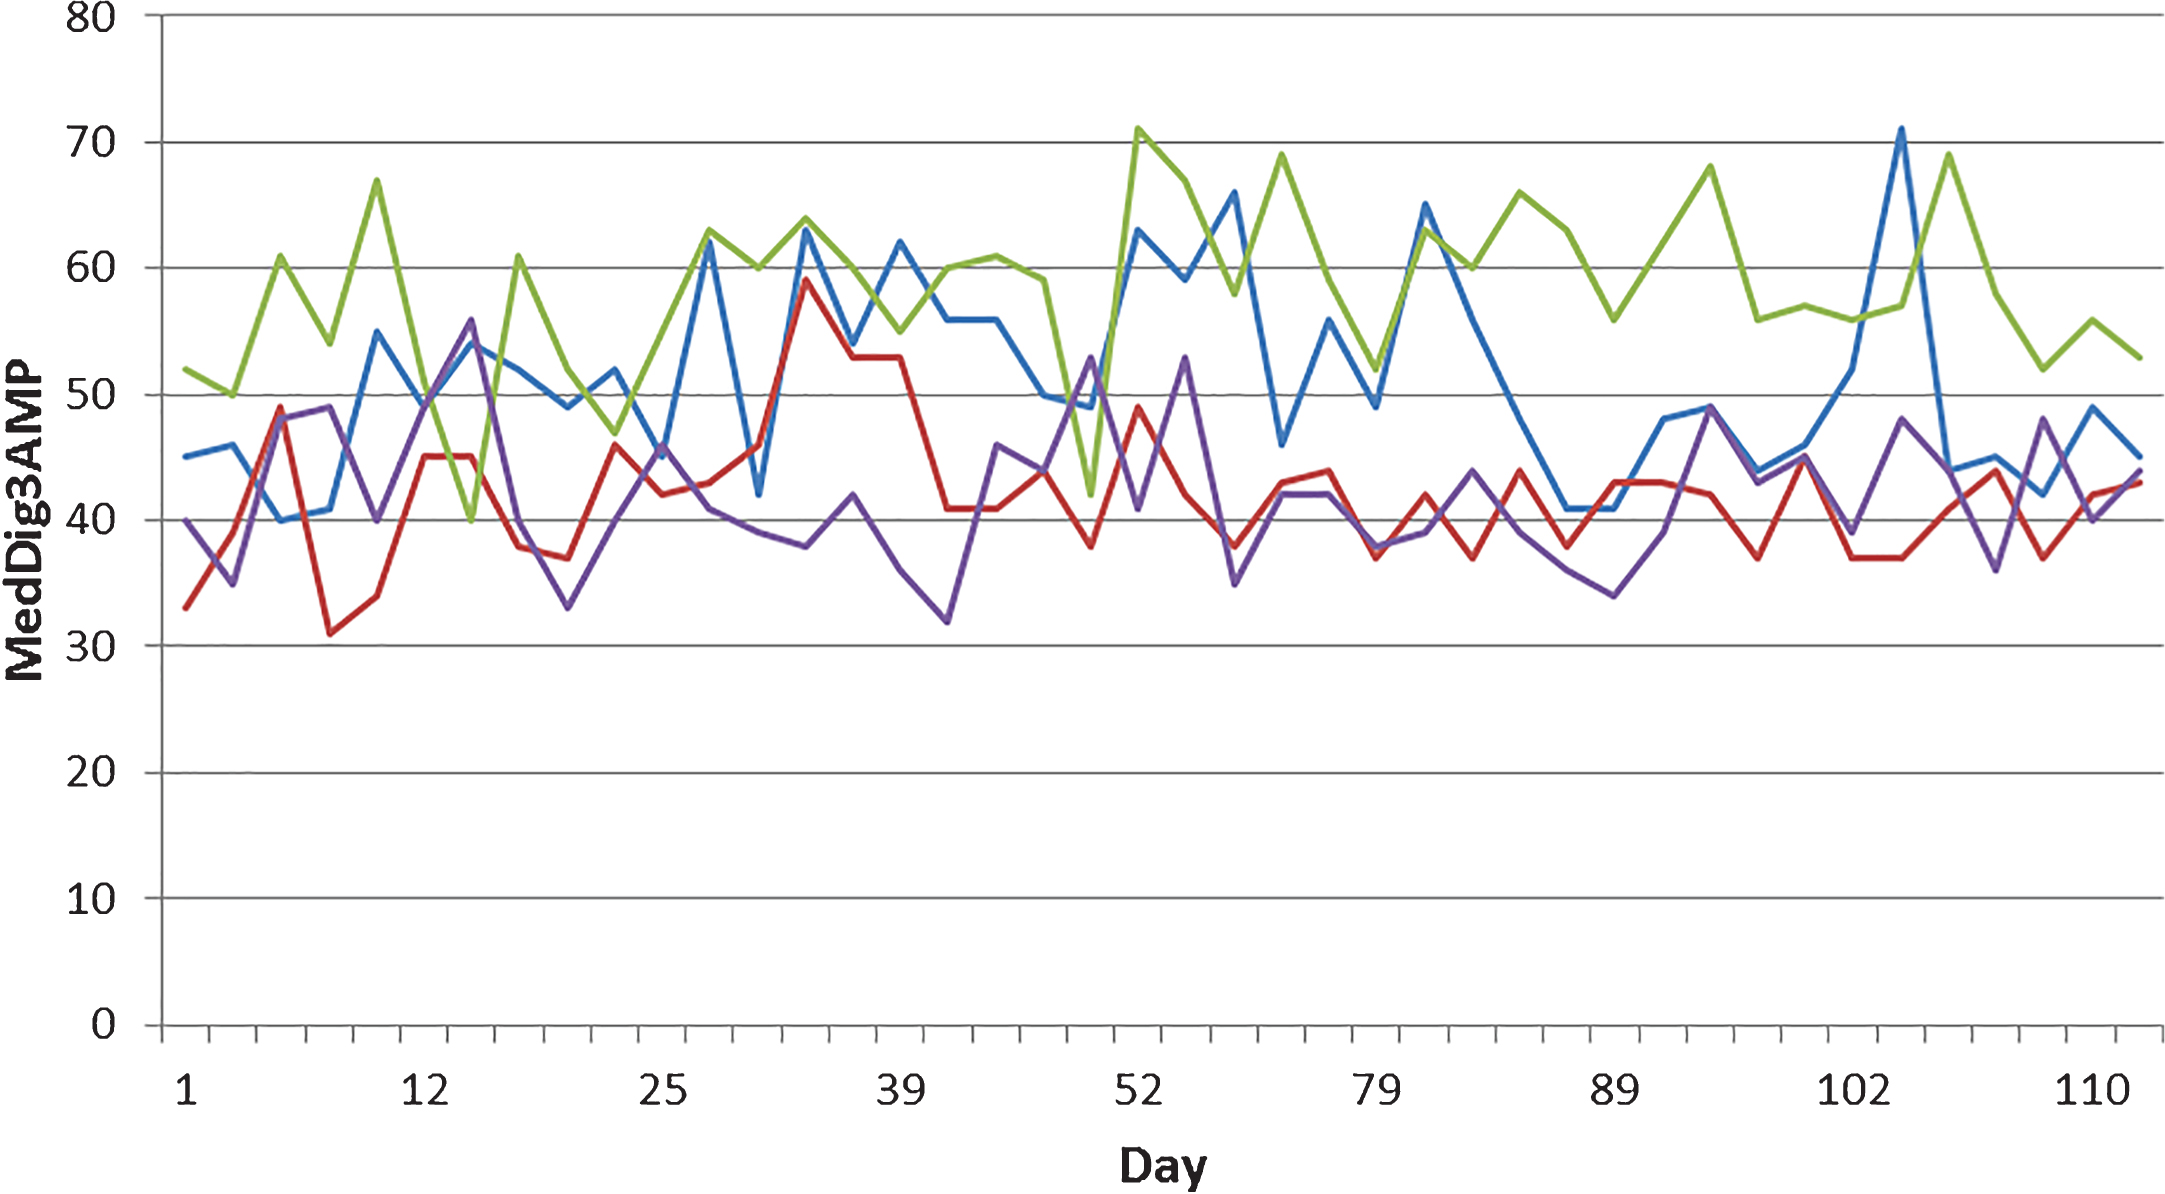
Example of variability in nerve conduction indices. The median digit 3 SNAP amplitude is shown for 113 consecutive measurements from the right (blue) and left (red) hand of subject 1, and the right (green) and left (purple) hand of subject 2.
3) Recording electrode position accounts for some but not all of the amplitude variability
We established that the operators in this study were performing the tests to a high technical standard, and yet were still producing results with a high variability over time, particularly in recordings of SNAP amplitudes. We next investigated the mechanism of the residual variability. We had designed the study to incorporate two pairs of measurements that shared either a recording (Median-digit 3 SNAP vs median-digit 1 SNAP) or a stimulating (median-digit 1 SNAP vs radial-digit 1 SNAP) electrode position, and one pair that shared neither (median-digit 3 SNAP vs radial-digit 1 SNAP). We selected these pairs since they show among the highest amplitude variability of all commonly recorded nerves in published studies, a finding that we replicated. We compared the correlation co-efficient of the amplitude measurements for these three pairs of recordings (Table 2). The correlation co-efficient of the amplitudes was highest in the pair that shared a recording electrode position (0.36), but was very low for those that shared a stimulating electrode position (0.003) or did not share either position (0.04).
Correlation matrix showing correlation between SNAP amplitudes from pairs of recording/stimulating electrode positions
MedDig3AMP = median sensory nerve action potential amplitude from digit 3; MedDig1AMP = median sensory nerve action potential amplitude from digit 1; RadDig1AMP = radial sensory nerve action potential amplitude from digit 1. MedDig3AMP and MedDig1AMP share a recording electrode position, MedDig1AMP and RadDig1AMP share a stimulating electrode position, and MedDig3AMP and RadDig1AMP share neither.
4) Temperature accounts for up to half of the variability in sensory nerve conduction velocity but does not account for the variability in SNAP amplitude
We had taken great care to perform the studies at approximately the same time of day in the same temperature controlled room. Furthermore, the skin temperature of both hands was measured both before and during the trials to ensure that it remained above 30°C. Nevertheless, these factors remain as potential confounds. No significant differences were seen in the mean or standard deviations of these parameters between subjects S:1 and S:2. We therefore felt confident in pooling the data from these subjects to develop a linear mixed model using skin temperature as an independent variable and the nerve conduction parameters as dependent variables (Table 3). This demonstrated significant correlations between skin temperature and all of the sensory nerve conduction velocities, explaining between 40.3% and 48.4% of the variance. A weaker correlation was found between skin temperature and F-wave minimum latency, explaining 18.6% of the variance. However, skin temperature did not significantly affect SNAP amplitudes or the median motor conduction velocity.
Linear mixed models (multilevel analysis) with skin temperature as independent variable
MedDig3AMP = median sensory nerve action potential amplitude from digit 3 (μV); MedDig3CV = median-digit 3 sensory nerve action potential conduction velocity (m/s); MedDig1AMP = median sensory nerve action potential amplitude from digit 1 (μV); MedDig1CV = median-digit 1 sensory nerve action potential conduction velocity (m/s); RadDig1AMP = radial sensory nerve action potential amplitude from digit 1 (μV); RadDig1CV = radial-digit 1 sensory nerve action potential conduction velocity (m/s); MedCMAPamp = median compound motor action potential amplitude (mV); MedCV = median nerve motor forearm velocity (m/s); MedFwmin = median nerve minimum F-wave latency (ms); *≤0.05.
DISCUSSION
We present the first longitudinal study of the variability of multiple nerve conduction indices, and exploit the measurement of multiple indices at each trial in an attempt to identify which factors account for this variability in the clinical setting.
The most salient outcome of this study is that even when technically proficient operators use a standardised protocol in which known sources of variability have been optimised (to a far greater extent than would be achieved during a routine clinical or research study), a large variability in individual indices remains. In general, the greatest variability was seen in SNAP amplitudes, with the lowest variability seen in F-wave latencies. This has obvious implications for the use of nerve conduction studies for serial studies, for example in assessing disease progression or therapeutic intervention. The CMT Neuropathy Score gives a value of between 0 and 4 based on the radial SNAP amplitude. Whether a patient scores 0 or 4 requires a change in amplitude of only 15 μV, significantly less than the 23 μV variation in this parameter encountered in our study. Indeed, this parameter showed the greatest variation in any of the recorded responses, questioning the suitability of using it in isolation to monitor progression. We did find that a composite outcome derived from the sum of all 3 nerves produced a far lower variability, and it may be that in future rating scales a score based on the sum of several indices will be needed to provide an objective measure of progression.
We next attempted to determine which factors accounted for this variability, and specifically whether it could be accounted for by technical or biological factors. We found that nerves that shared a recording electrode position showed a far higher correlation co-efficient in SNAP amplitudes than those that did not, indicating that despite attempting to optimise recording electrode position at each trial at least some of the remaining variability was due to this factor. This correlation remained only moderate, so clearly other factors also influence the variability. Despite controlling the hand temperature to a far greater degree than would occur during routine clinical testing, this factor accounted for a significant part of the variability in SNAP conduction velocities, but did not account for the variability in SNAP amplitude. Since we had also controlled for operator- and equipment-related errors, this leaves the intriguing possibility that this residual variability reflected an underlying change in nerve excitability. We found that there was essentially no correlation in SNAP amplitudes between anatomically distant nerves implying that if the remaining variability is due to biological factors, these are specific to an individual nerve rather than a general alteration in nerve excitability. What these factors might be are an interesting avenue for further study.
The lack of an independent rater evaluating each curve represents a limitation of the study; similarly, although the statistical analysis was refined, it included two subjects only. Although not investigated in the present paper, previous studies comparing antidromic and orthodromic techniques found no significant difference except for the SNAP amplitude that was bigger and wider in the antidromic technique compared to the orthodromic [20]. Finally, other measurements of disease progression, such as the maximal isometric voluntary contraction, were not included because they were beyond the scope of this study. However, a previous study revealed substantial reproducibility of the neurophysiological and myometric measurements in the ulnar nerve-abductor digiti minimi system [21].
In conclusion, we believe that nerve conduction studies can still play a role in monitoring disease progression, but that the current practice of using single nerve conduction indices may give a false impression of objectivity. Even under the most tightly controlled conditions, the variability in single nerve indices seems to be too high to be a meaningful indicator of disease progression. Only by using composite measures based on recordings from multiple nerves does the consistency needed to accurately monitor disease progression appear, and we recommend that any future scales take this into account.
CONFLICT OF INTEREST
The authors have no conflicts of interest to declare.