
Abstract
Background:
Inclusion body myositis is a late onset inflammatory myopathy lacking reliable serum biomarkers for diagnosis and for disease progression.
Objective:
To identify diagnostic and predictive biomarkers, cytokine profiling is used to assess the potential of cytokines to discriminate between cases and controls and to assess whether treatment with methotrexate can influence biomarkers associated with disease progression.
Methods:
The diagnostic and follow-up potential of 48 cytokines was tested using Bioplex-assay and ELISA in sera of healthy individuals, IBM patients and patients with other neuromuscular disorders.
Results:
Ten cytokines (TRAIL, IL-8, MIF, MCP-1, LIF, IP-10, IFN-α2, MIG, bNGF and IL-3) were identified to be good to excellent markers to discern IBM patients from healthy controls. Three cytokines (IP-10, Eotaxin and SDF1A) changed significantly upon methotrexate treatment as compared with the natural clinical course. Muscle strength loss was associated with changes in IL-8 and SDF1A levels. IFN-γ levels were only associated with survival of IBM patients before correction for multiple comparisons.
Discussion:
Cytokine profiling can discriminate IBM patients from healthy controls and other neuromuscular disorders. Immunosuppression with methotrexate affects cytokine levels in IBM. IL-8 and SDF1A could serve as biomarkers for disease progression.
INTRODUCTION
Inclusion body myositis (IBM) is a slowly progressive, often asymmetric, inflammatory myopathy ultimately leading to profound weakness and burden of disease [1, 2]. A muscle biopsy is required to secure the diagnosis whichever set of diagnostic criteria is used, and some patients are assigned a possible or probable diagnosis because of lacking features for the definite diagnosis [3–6].
The site of onset of weakness and the rate of progression varies between individuals, and between different muscle groups of an individual patient. Weakness has a preference for ventrally located muscles, especially deep finger flexors, quadriceps and pharyngeal muscles [7, 8]. Due to these many variables documenting and determining clinical progression of IBM within short time intervals is challenging.
The search for biomarkers that help in the diagnostic process, that differentiate and stratify disease subgroups, that support clinical follow-up or serve as outcome measures in clinical trials is on-going. Anti-cytosolic 5-nucleotidase 1A (cN-1A) antibodies were detected in 29–72% of IBM patients and hold promise in acquiring the diagnosis, but the test has not been integrated into diagnostic criteria yet, as specificity and sensitivity are currently further defined [9–12]. Little is known about the mechanisms behind the preferential muscle weakness distribution and progression differences. Onset of disease has been associated to HLA-A1, and more profound quadriceps weakness with HLA-DRB1*03 : 01 and HLA-DRB1*13 : 01 [7, 14]. Disease progression has been related to age at onset, with faster progression when age at onset is higher and anti cN-1A positivity has been linked to more severe weakness, a higher frequency of dysphagia and respiratory dysfunction, and higher mortality risk [8, 16].
Several research groups tried to identify biomarkers to discern inflammatory myopathies from healthy controls and hereditary muscle diseases, and biomarkers that would enable the identification of pathological pathways involved in inflammatory myopathies including IBM [17–19]. The availability of objectively measured, easily obtainable and reproducible serum markers with a robust correlation with clinical progression would not only help monitoring patients during routine clinical visits but could also be used in clinical trials as surrogate endpoints to reduce the number of patients enrolled to reach statistical significance. In this study we appraised the diagnostic potential of each of 48 quantified cytokines and tested which could discriminate between cases and controls. Secondly, we monitored the cytokine profile change over time of IBM patients treated with methotrexate to investigate whether treatment affected cytokine levels. Thirdly we looked for correlation between cytokine levels and functional outcome measures. When applicable, reproducibility was studied.
MATERIALS AND METHODS
Participants and sample collection
Fifty-nine Caucasian IBM patients (39 men), 21 healthy controls (11 men) and 22 patients with other neuromuscular disorders (NMD) (i.e. autoimmune myasthenia gravis (MG, n = 5), limb girdle muscular dystrophy (LGMD) type 2A (n = 9), type 2B (n = 3) and type 2I (n = 5)) were included in the study. All IBM patients fulfilled the European Neuromuscular Centre (ENMC 2000) criteria for probable or definite IBM [6]. Clinical characteristics of all IBM patients and NMD controls were assessed, including age, age at onset, disease duration, and treatment with immunosuppressive or immunomodulating agents. The muscle strength sum score in IBM patients was measured by hand-held myometry as previously described [20]. Serum samples were collected, aliquoted and stored at –80°C prior to analysis. Per healthy control subject one serum sample was available. For 16 IBM patients serum of one time-point was available, for 9 patients one baseline and one follow-up sample was available and for 34 patients one baseline and follow-up samples at two time-points were available with 6 month intervals in between each of the 3 time-points.
All patients gave their informed consent. The study was approved by the Ethics Committee of the Leiden University Medical Center.
Bio-plex assay
Two Bio-Plex cytokine assays (Bio-Plex Protrademark Human Cytokine 27-plex Assay #M500KCAF0Y and Bio-Plex Protrademark Human Cytokine 21-plex Assay #MF0005KMII) were obtained from Bio-Rad (Veenendaal, Netherlands) to quantify 48 cytokines in serum samples on a Luminex instrument (Supplementary Table 1). The assays were performed according manufacturer’s guidelines, with the following exceptions: (I) the protocol was optimized to use half of the reagents to measure two 96 well-plates with one assay, (II) serum samples were diluted 2-fold in sample diluent, (III) reconstituted standards were diluted 10-fold in standard diluent and (IV) a filter plate from Millipore (Amsterdam, Netherlands, #MSBVN1250) was used to remove fluids by vacuum filtration.
ELISA
Bio-plex quantification results were validated with ELISA kits (R&D Systems Europe Ltd., Abingdon, UK); targeted α-chemokines or CXC chemokines were interferon-γ (IFN-γ)-inducible protein of 10 kDa (IP-10 or CXCL10) (catalog number DIP100), monokine induced by IFN-γ (MIG or CXCL9) (catalog number DCX 900) and interferon-γ-inducible T cell α chemoattractant (I-TAC or CXCL11) (catalog number DCX110). All procedures were performed according to the manufacturer’s instructions.
Statistical analysis
A t-test was used to assess differences in age at baseline between IBM patients and controls. Cytokine data were log10 transformed to obtain normally distributed data and 3 cytokines (tumor necrosis factor β (TNF-β), granulocyte-macrophage colony-stimulating factor (GM-CSF) and interleukin-12p40 (IL-12p40)) were excluded before the analysis because of missing data (≥90%). Unsupervised analysis of the data was done by principal component analysis using all data obtained in healthy control samples and data obtained at baseline for IBM patients. Missing data were substituted with the mean. Seven components were extracted explaining 65.7% of the total variance. To identify differentially represented cytokines we performed a multivariate analysis by restructuring the dataset into the long format. A regression analysis was performed where cytokine levels were used as dependent variable and diagnosis (either IBM or healthy control), gender, cytokine identifier, age at sampling, the interactions between diagnosis and cytokine identifier, between diagnosis and age at sampling and between cytokine and age at sampling were included as covariates. Cytokines with statistically different mean levels between the two groups were identified using the likelihood ratio test. The obtained p-values were corrected for multiple testing, p c , using Bonferroni correction (45 tests). Unsupervised clustering was performed on the cytokines passing the Bonferroni cut-off using the linear regression model explained above. ROC curves were used to estimate the diagnostic potential of the quantified individual cytokines to discriminate between cases and controls, again by using baseline data for IBM patients only. Longitudinal cytokine measurements were analyzed using a multivariate regression model with correlated errors for each cytokine. Mean log-transformed cytokine levels were modeled as a function of treatment (either treated or untreated), time since baseline (in year quarters) and the interaction between treatment and time since baseline. The within patients correlations were modeled using an unstructured covariance matrix. To identify correlations between cytokine levels and outcome measures we used a linear mixed model where time since baseline was used as a repeated measure (again an unstructured covariance matrix was used to model time) and the muscle strength sum score (Newton) was included as fixed effect. The comparison of IP-10 levels among different NMD was performed by one-way ANOVA, and post-hoc tests were corrected according to Bonferroni. The association between cytokines and patient survival was studied using a time-dependent Cox model. Patient survival was defined as time since start of symptoms. Missing cytokine values have first been imputed using multiple imputation and the time-dependent Cox model has then been fitted on the multiple imputed datasets. All the analyses were performed using IBM SPSS version 23 except for the last analysis for which the R package mice for the multiple imputation [21] and the R package survival [22] were used to fit the time-dependent Coxmodel.
RESULTS
Participant characteristics
The median age at baseline was 70.5 years (range 50.2–84.2) for IBM patients and 58.3 years (range 45.8–76.8) for healthy controls. The median age for controls with other NMD was 45 (range 26–80) for LGMD2A, 18 (range 14–45) for LGMD2B, 52 (range 30–69) for LGMD2I and 37 (range 13–43) for MG patients. At baseline none of the IBM patients used immunosuppressive or immunomodulating treatment. In the NMD control group, one MG patient was treated with prednisone at the time of sampling while another one had received immunosuppressive drugs many years before sampling. The other three MG subjects had never been treated with immunosuppressive drugs. Three MG patients had undergone thymectomy before the sample was taken and the thymus was hyperplastic in all three cases.
IBM patients were significantly older than healthy controls (mean age 69.0 years vs 58.2 years, p < 10–5) at baseline. In IBM patients, the mean age of onset was 57.7 years and the mean disease duration was 19.5 years.
Cytokine profiling of patients and healthy controls
Cytokine levels were quantified in samples of IBM patients and healthy controls. Unsupervised analysis of cytokine levels in blood by principal components analysis showed that it was possible to separate IBM patients from healthy controls (Fig. 1A). Linear regression analysis allowed the identification of 10 cytokines elevated in patients over healthy controls (Fig. 1B). Next, we divided samples by unsupervised hierarchical clustering based on the 10 cytokines identified by regression analysis. This algorithm separated patients and controls, except for 2 patients mis-clustering with controls and 1 control mis-clustering with patients (Fig. 1C). ROC curves were then used to further dig into the capability of these 10 markers to discriminate between cases and controls (Fig. 1D). Areas under the curves (AUCs) between 0.8 and 0.9 are generally considered good, while an AUC above 0.9 is considered excellent [23]. ROC curves were considered good for 4 cytokines: TNF-related apoptosis-inducing ligand (TRAIL), interleukin 8 (IL-8), macrophage migration inhibitory factor (MIF) and monocyte chemoattractant protein-1 (MCP-1). AUCs of six cytokines were considered excellent: leukemia inhibitory factor (LIF), interferon gamma-induced protein 10 (IP-10), interferon alpha-2 (IFN-α2), MIG, beta nerve growth factor (bNGF) and interleukin 3 (IL-3). There was moderate correlation between the cytokines. Pairwise Pearson correlations are presented in the Supplementary Figure 1.
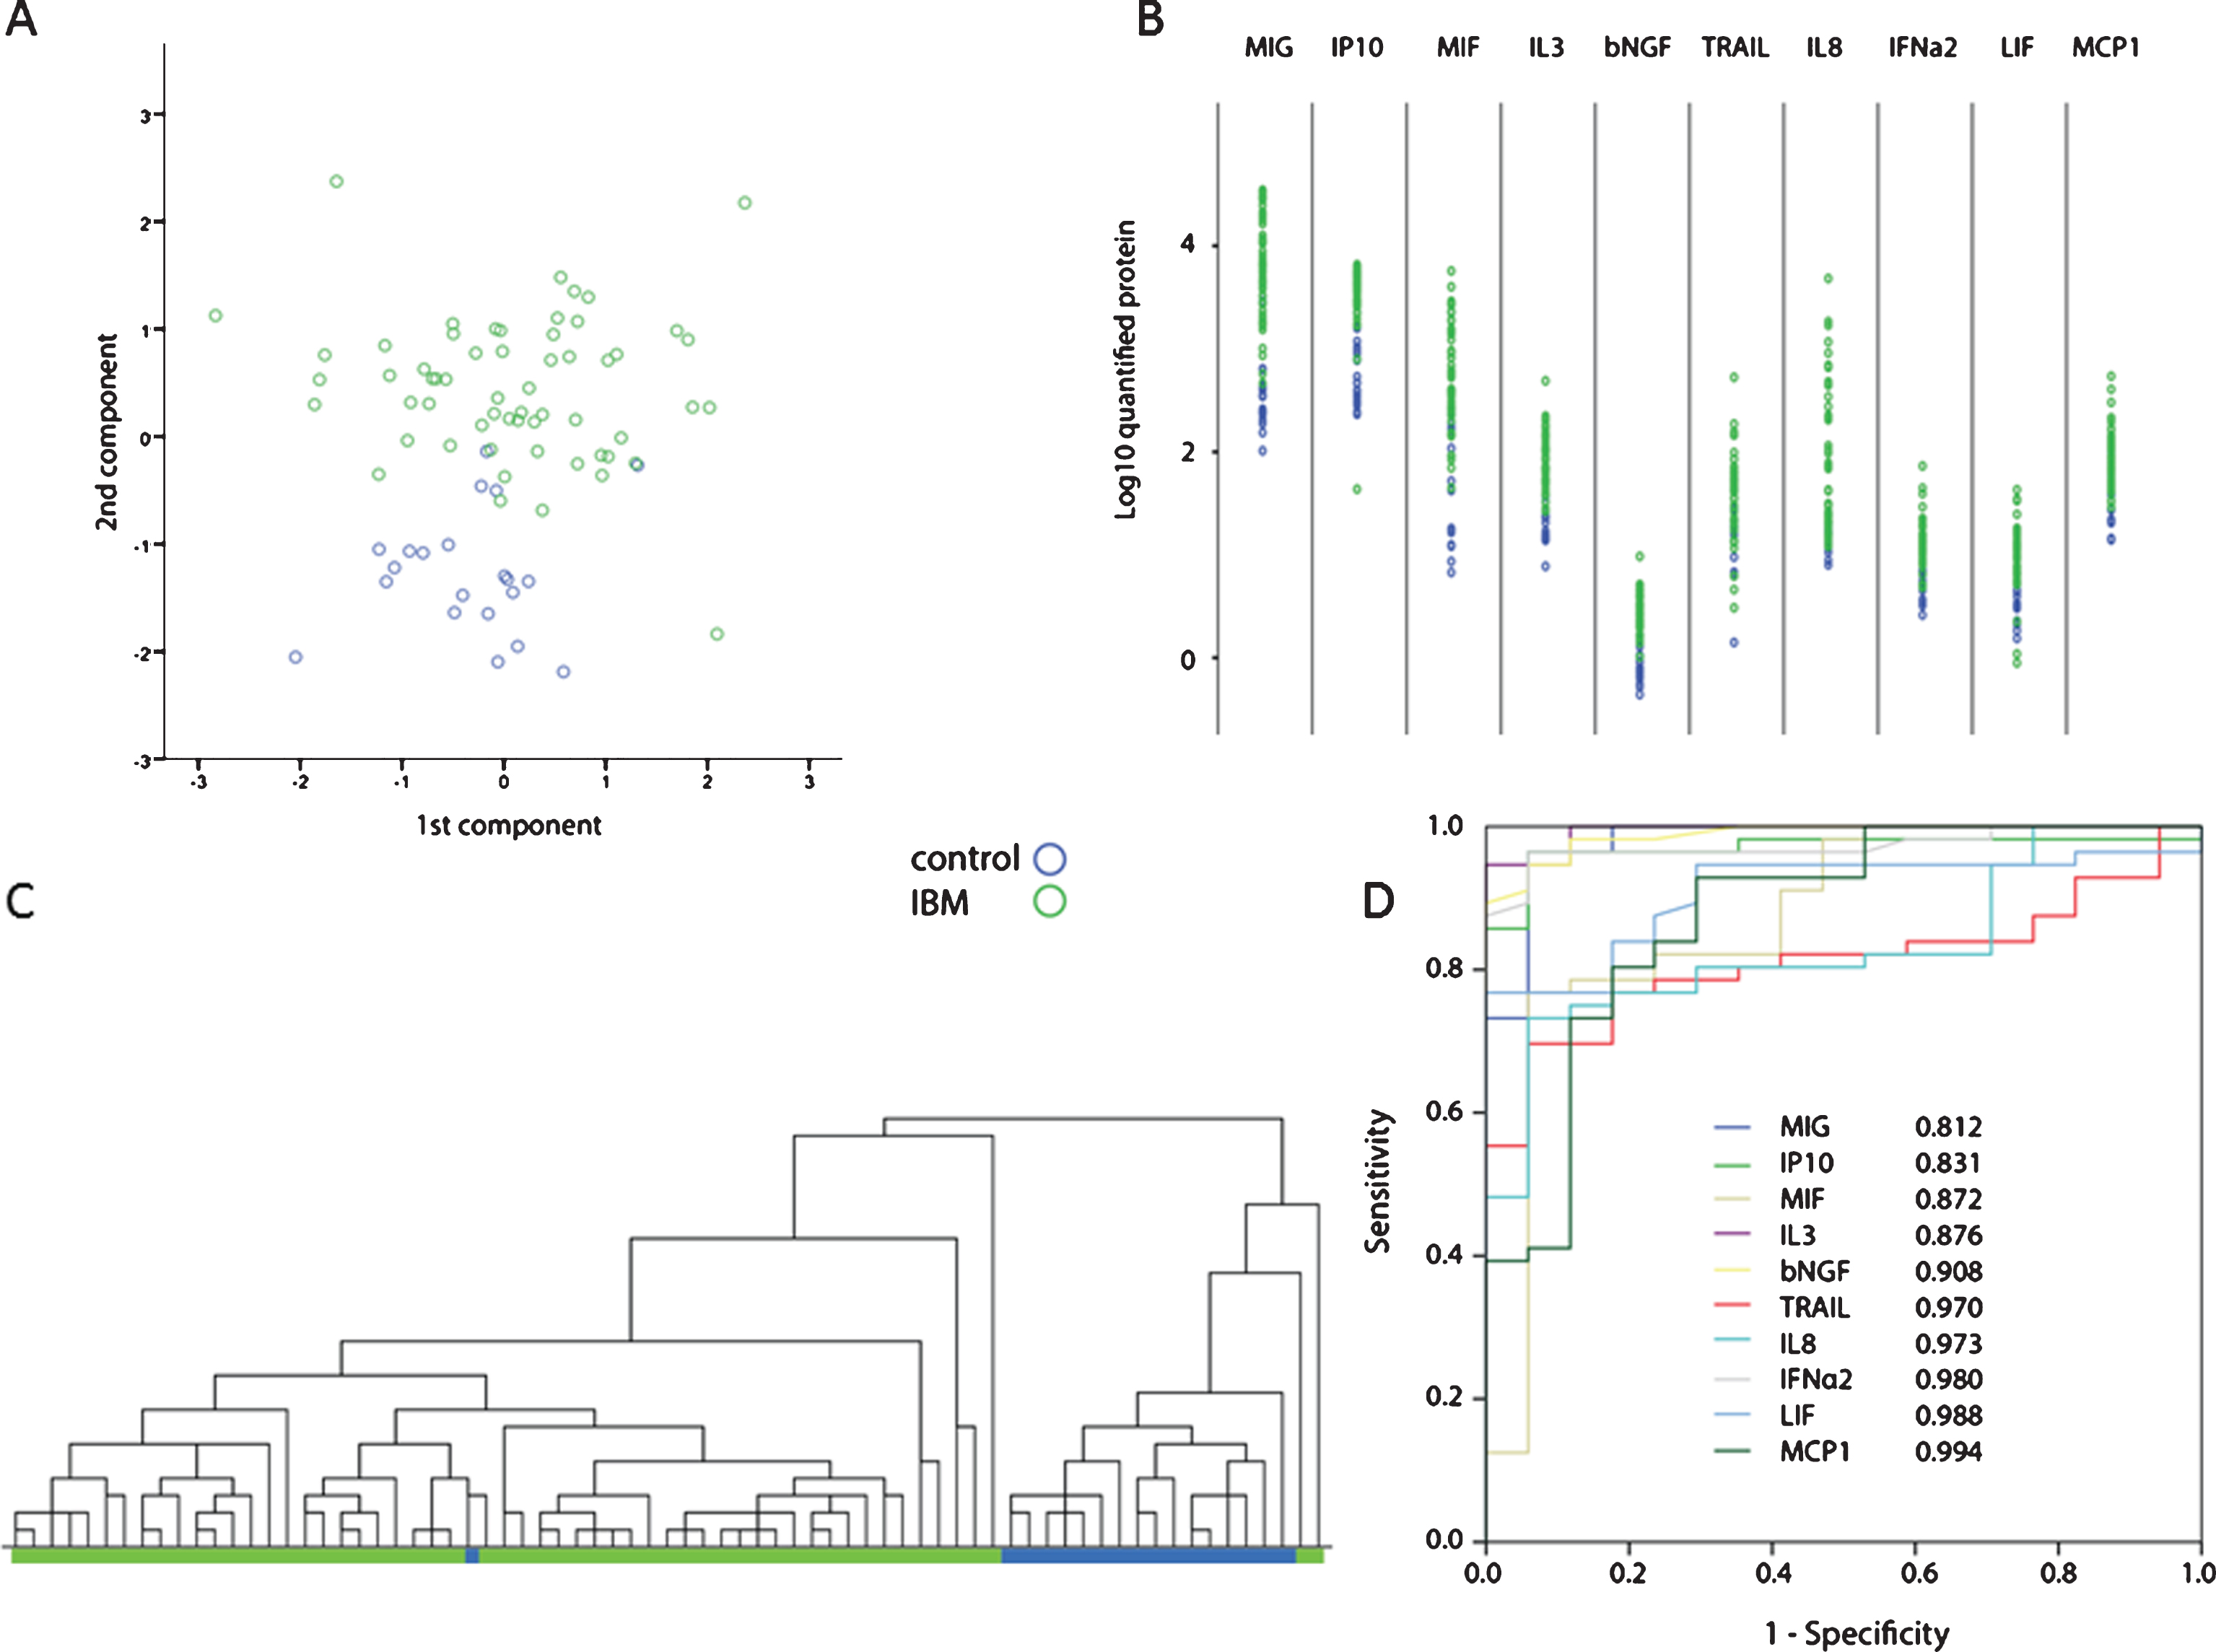
Cytokine serum profiling in IBM patients (green) and healthy controls (blue). A. Scatter plot of the first 2 components obtained by principal components analysis shows clustering of IBM patients and healthy controls. B. Dot plot showing the 10 cytokines differentially found in patients and controls by linear regression analysis. C. Unsupervised hierarchical clustering based on the 10 cytokines depicted in panel B shows clustering of patients and controls. D. ROC curves for the 10 cytokines in panel B. All cytokines are able to discriminate between cases and controls as indicated by the large areas under the curve mentioned in figure.
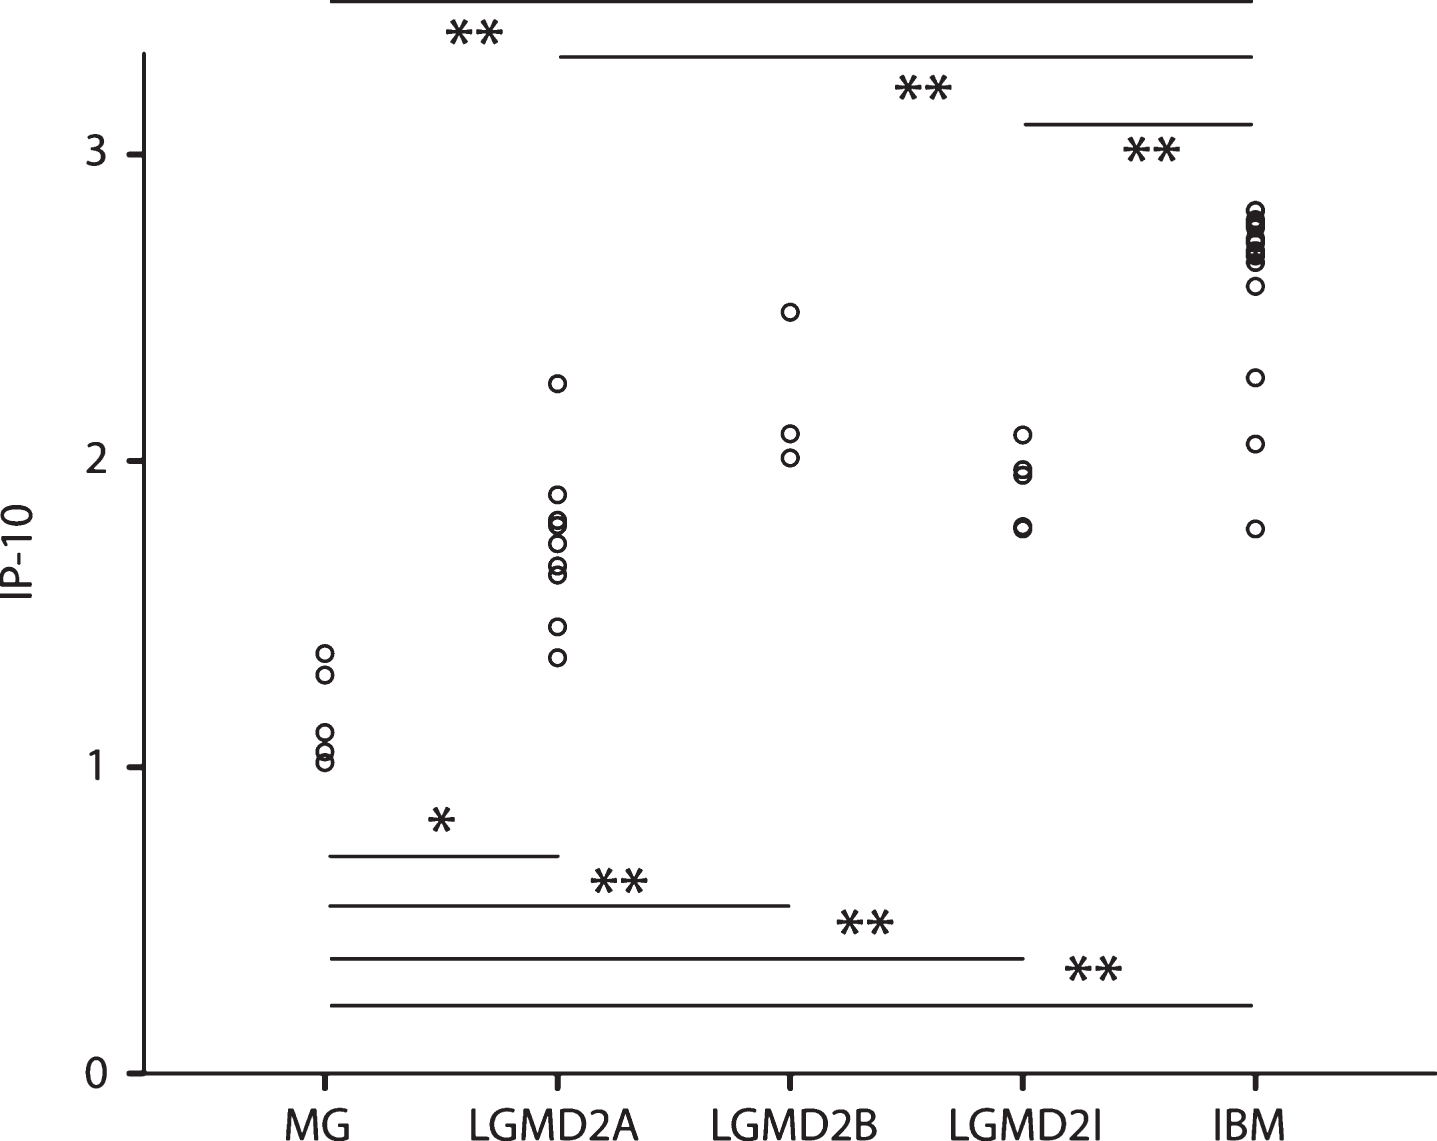
MIG and IP-10 were previously reported to be elevated in IBM and bind to the same receptor called CXCR3 [17, 24]. Another protein, I-TAC also binds to CXCR3 but was not tested before. To validate these previous results and study I-TAC levels we quantified MIG, IP-10 and I-TAC by ELISA in IBM patients and healthy control samples. Results obtained with ELISA and Luminex highly correlated (R = 0.80, p < 10–8 for MIG, R = 0.91 p < 10–7 for IP-10) (Supplementary Figure 2, left panel). MIG serum levels correlated with I-TAC levels (R = 0.57 p < 10–3), while IP-10 and I-TAC did not correlate. As IP-10 was recently evaluated as a marker of inflammatory myopathies [19], IP-10 levels were compared between IBM patients and patients affected by other NMD. Even though the number of patients was limited, MG patients showed lower IP-10 levels compared to all the other myopathies. IBM patients showed elevated levels of IP-10 compared to all other myopathies, but not to LGMD2B (Fig. 2).
Comparison of IP-10 levels with other neuromuscular disorders. Plot showing IP-10 levels in patients with myasthenia gravis (MG), limb girdle muscular dystrophy type 2A (LGMD2A), type 2B (LGMD2B, type 2I (LGMD2I) and IBM patients. *is p < 0.01. **is p < 0.001.
Analysis of consecutive samples of treated versus not treated patients
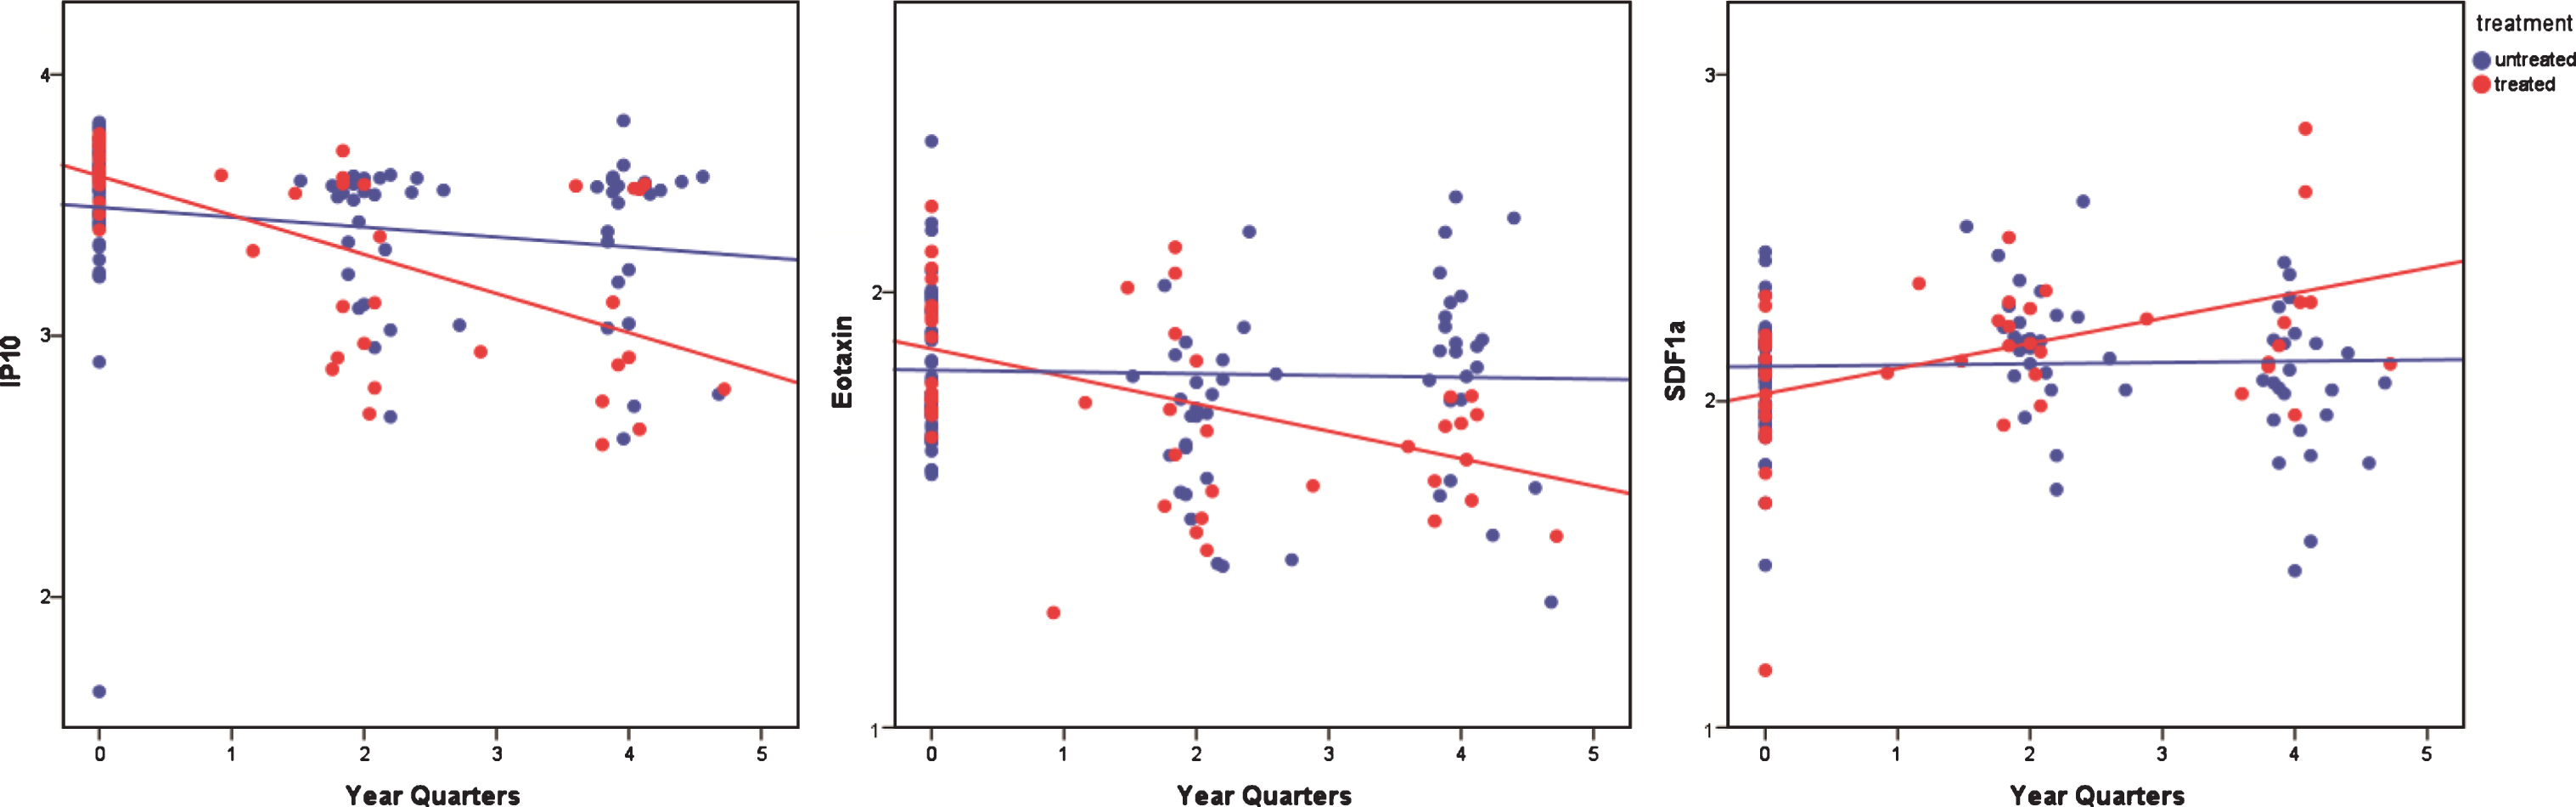
After baseline, one patient group remained not treated (with immunosuppressive or immunomodulating therapy) (n = 41) while another group participated in a clinical trial with methotrexate (mtx), and received an escalating dose of 5–20 mg of mtx per week at the 2nd and 3rd time-point and was considered treated (n = 18) 20. For the non-treatment group two follow-up time points were available for 24 patients, and 1 follow-up time point was available for 2 patients. For the treatment group two follow-up time points were available in 11 patients and 1 follow-up time point was available for 5 patients, while for the remaining patients only 1 sample was available. Three out of 45 cytokines (IP-10, Eotaxin and stromal cell-derived factor (SDF1A)) changed differently between treated and untreated patients over the course of time. IP-10 remained stably elevated in untreated patients and significantly decreased upon treatment with mtx (p = 1.03×10⁻⁴, p c = 0.0046). Eotaxin was stable in untreated patients and was reduced upon mtx treatment (p = 4.84×10⁻⁴, p c = 0.022), while SDF1A increased upon treatment as compared to untreated patients, although this last association lacked statistical significance after correction (p = 1.83×10⁻³, p c = 0.082) (Fig. 3).
Analysis over time of methotrexate treated and untreated patients. Scatter plots showing the progression of IP-10, Eotaxin and SDF1A upon methotrexate (red) treatment and non-treatment (blue). IP-10 and Eotaxin significantly decrease with treatment (adjusted p-values p < 0.01 and p < 0.05 respectively), while SDF1A increases (p c = 0.08) compared to non-treatment.
For 22 patients combined muscle strength sum scores at baseline and after 12 months were available. Interleukin-8 (IL-8) and SDF-1A significantly correlated with sum scores during the period of the study whilst interleukin-12 (IL-12) significantly correlated before adjustment (Fig. 4).
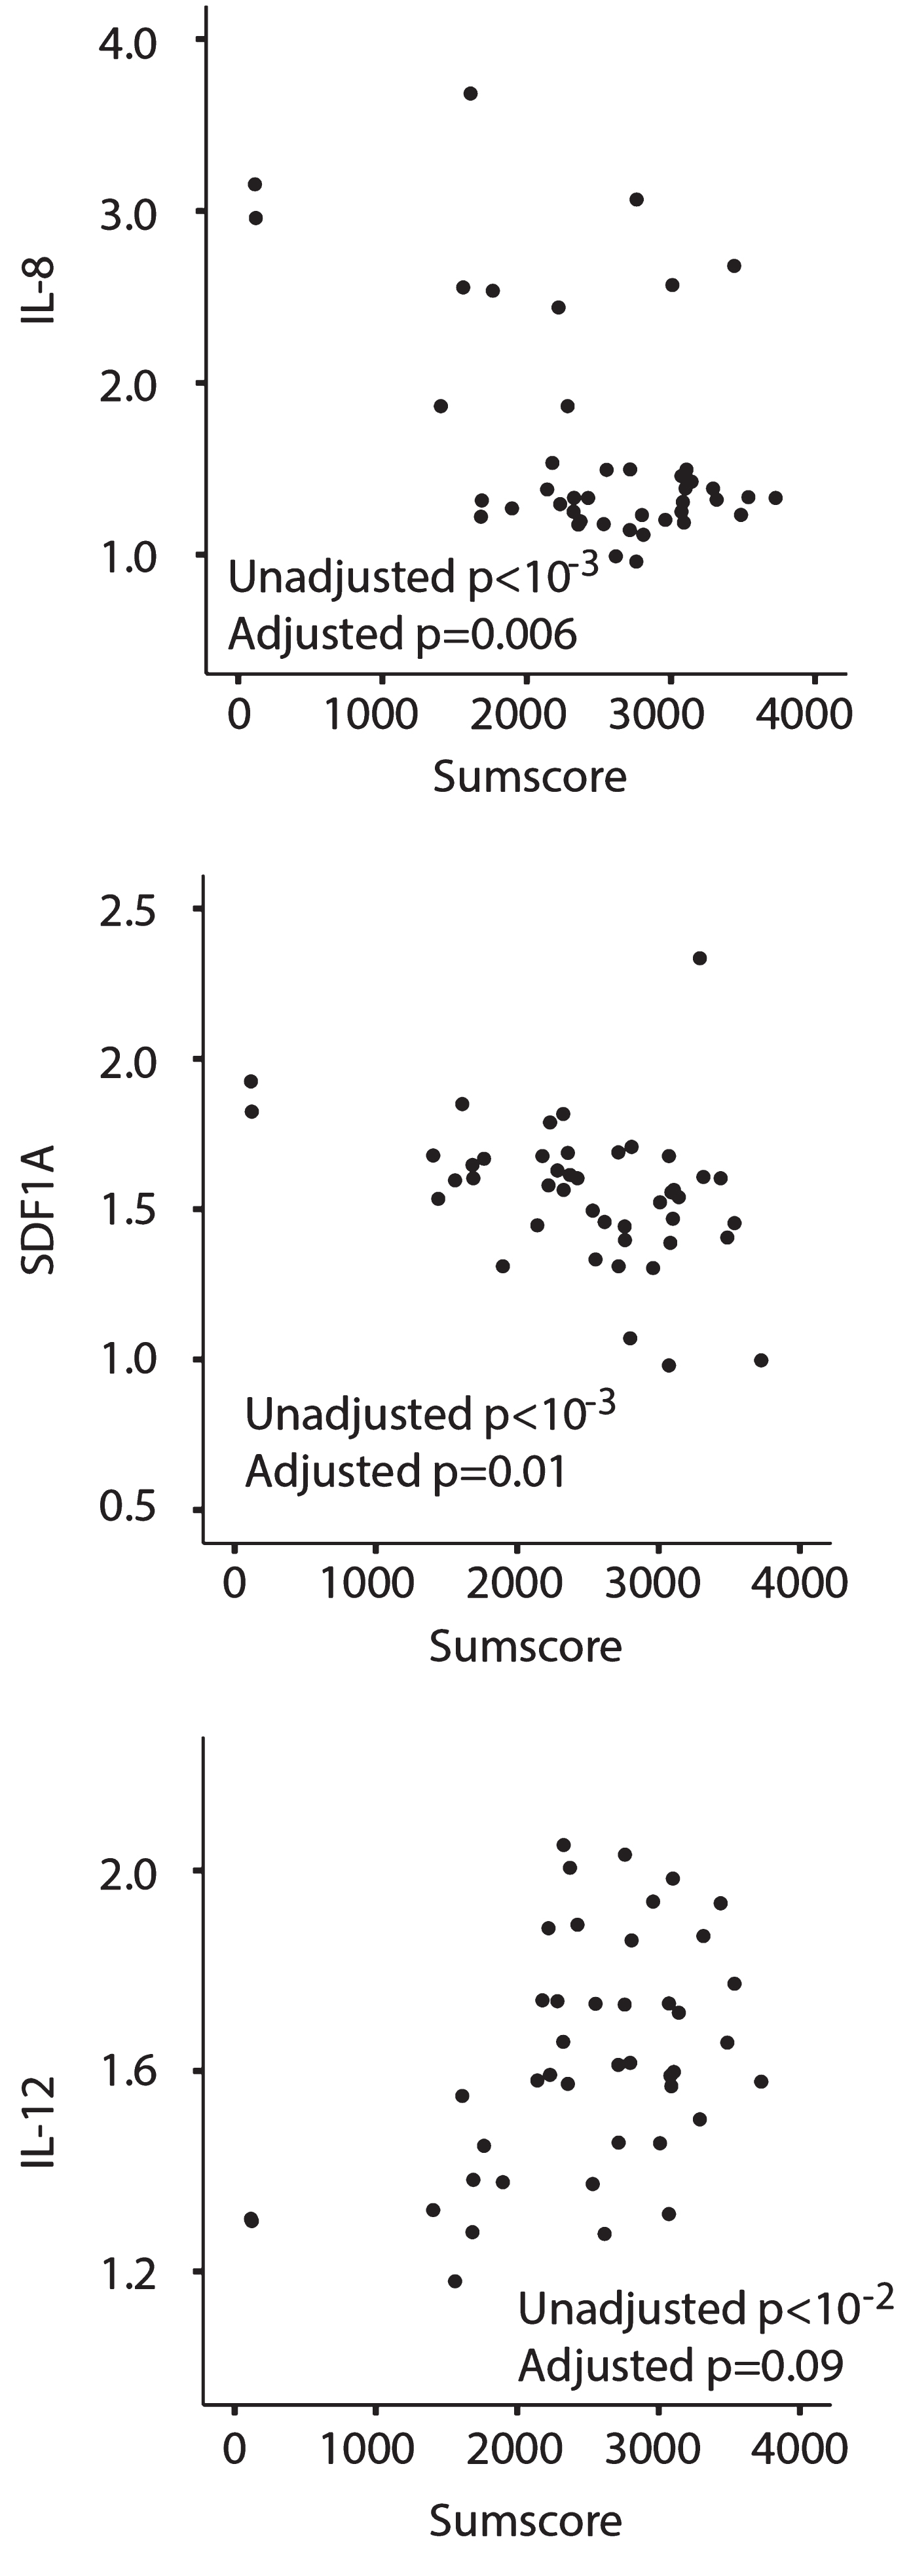
Three cytokines are associated with muscle strength. IL-8 and SDF1A serum levels were negatively associated with the muscle strength sum score (N) (upper and middle panel), while IL-12 (lower panel) was positively associated with the sum score.
IFN-γ in relation to patient survival
The date of death of 25 participating patients was available. We sought to identify cytokines associated with survival after correcting for age and gender effects, based on the time of their disease onset. The analysis of each cytokine showed that only IFN-γ passed the 5% significance threshold (p = 0.03, hazard ratio 0.515) without multiple testing adjustment. After Bonferroni correction and false discovery rate multiple testing correction none of the cytokines was found to be associated withsurvival.
DISCUSSION
The identification of biomarkers, including cytokines, is thought to help in diagnosis, in identifying targets for therapy and readout to objectively follow disease progression. To this aim we quantified a panel of 45 cytokines. Until now, serotyping for cytokines has been done on a very limited scale i.e. in small numbers of patients and with smaller selections of cytokines. Here we studied the largest series of patients tested so far. Among the tested cytokines 10 were confidently found to be elevated in patients as compared to healthy controls.
This study confirmed the elevations of IP-10, MIG and MCP1 found by others [17], but could not do so for elevated IL-12 and IL-1RA. The reason for this difference is unclear, but perhaps a different disease duration, treatment or presence of other disorders may have influenced these data.
IP-10 is elevated in IBM, polymyositis (PM), dermatomyositis (DM), and less so in immune-mediated necrotizing myopathy, which underlines its role in inflammatory myopathies and a possible common pathophysiologic mechanism [17, 24]. Although there also appear to be differences in the level of elevation, the overlap among different inflammatory myopathies of elevated cytokines accentuates a lack of specificity of cytokines, a requirement for proposal as diagnostic biomarker (Supplementary Table 2) [25–38]. We confirm here that IP-10 is not only higher in IBM compared to healthy controls, but is higher than in MG and LGMDs, the latter can have an additional inflammatory component.
IP-10 and MIG are encoded by genes in chromosome 4 and both bind to the same receptor called CXCR3. A third CXCR3 binder, I-TAC, is encoded by a gene located on the same locus. We found a significant correlation between I-TAC and MIG but not with IP-10. I-TAC levels however, were not elevated in patients as compared to healthy controls. These data illuminate how CXCR3 signalling is involved in the pathologic processes occurring in IBM patients but also shows that MIG, IP-10 and I-TAC may undergo differential gene expression regulation.
IP-10 was stably elevated over time in untreated patients but was significantly reduced upon treatment with mtx. Eotaxin was also reduced in mtx treated patients indicating that (part of) the inflammatory component was mitigated by the drug, even though a moderate increase of SDF1A was also observed in treated patients over controls. Mtx treatment did not stabilize patients’ muscle strength, possibly due to insufficient statistical power [20]. We cannot rule out that the observed molecular findings anticipated functional slowing of disease progression.
Since the connection between reduced IP10/Eotaxin and clinical improvement is lacking so far, these cytokines cannot be used as therapy monitoring markers or surrogate endpoints yet. By including them as exploratory endpoints in future clinical trials more information could be obtained about their usefulness. To gather more information on Eotaxin and IP-10 synthesis we consulted the Expression atlas of the EMBL-EBI to get a better idea of the organs that express these cytokines [38]. Both proteins were predominantly present in the organs of the immune system such as lymph nodes and thymus pointing to a systemic inflammatory state but also to focal areas where the disease might be chronically sustained.
Three cytokines (IL-8, SDF1A and IL-12) were associated with muscle strength sum scores. This finding is of particular importance in view of future intervention trials, as they could be used for candidate surrogate endpoints to support clinical outcome measures as to convince regulators of the beneficial effect of tested drugs based on both clinical and immunological grounds. The association of IFN-γ with survival was not statistically significant after correction for multiple testing, but could be important when confirmed in another study. Our data underline the importance of the immune component in IBM, as the level of the serological inflammatory component in IBM patients can be related to muscle strength and presumably has impact on survival.
Clearly, this study does not allow a direct comparison between IBM and other inflammatory myopathies, which may be regarded as a shortcoming. However, comparison with isolated PM is obviously a challenge as PM as a separate entity is very rare in The Netherlands and we expect this to be the case world-wide [39]. But because “isolated PM” is rare, it should not appear to be a frequent diagnostic challenge compared to IBM. So, most other PM-like myositis cases would have a “non-specific myositis” (according to the ENMC consensus) [40], often in concurrence with another connective tissue disease, with or without myositis specific or myositis associated antibodies. To make any comparison between IBM and all these subforms of “PM”, a very high number of patients would be needed per (sub)group to make any assumptions and to correct for confounding factors. In case of DM, splitting groups according to myositis specific antibodies would be preferable over lumping all patients, equally requiring large patient numbers. Still, such prospective studies are required and might be helpful in understanding the pathogenesis of the different inflammatory myopathies.
In conclusion, cytokine profiling is able to discriminate between patients affected by IBM, healthy controls and other patients with neuromuscular disorders. Treatment of IBM patients with methotrexate changes serum levels of 3 cytokines and IFN-γ levels may be associated with shorter life span. Finally, 3 cytokines are associated with strength, thus they represent natural candidate surrogate endpoints to be used in clinical trials.
CONFLICT OF INTEREST
UAB is participating in BYM338 studies of Novartis and is a consultant for Novartis and Argen-X. All financial compensation for these activities go to the Leiden University Medical Center (LUMC).
RT reports no disclosures.
MH reports no disclosures.
EHN reports grants from Duchenne Parent Project, ZonMW and AFM, and trial support from BioMarin, GSK, Lilly and Santhera, outside the submitted work. He also reports consultancies for BioMarin and Summit. All reimbursements were received by the LUMC. No personal financial benefits were received.
TE reports no disclosures.
HL received research support from Marigold Foundation LTd, Ultragenix, PTC, Eli Lilly, Action Benni and co, GSK, Throphos, RD-Connect (305444), Optimistic (305697), NeurOmics (305121), MRC (G1002274, 98482), NIHR (PD00402), Action Duchenne, Association francaise contre les myopathies, British heart foundation, Muscular Dystrophy UK, National Cancer Institute, Spinal Muscular Atrophy Support UK, Wellcome Trust, Jennifer Trust, Duchenne Parent Project. He is a consultant for Roche, ASD Therapeutics Partners LLC, IOS press, Alexion, Ultragenyx, and Fondazione Cariplo, all paid to Newcastle University. He received speaker honoraria from PTC for a lecture and travel reimbursements at satellite symposium ICNMD Nice 2014, paid to Newcastle University, and travel reimbursements from Ultragenyx. He is editor in chief of Journal of Neuromuscular Diseases and member of the advisory board of the German Duchenne parents project, IRDiRC interdisciplinary scientific committee, German Muscular Dystrophy Network, Myotubular Trust Patient Registry, Action Duchenne patient registry, German patient registries on DMD and SMA.
JJGMV was involved in Duchenne trials that were sponsored by Biomarin/Prosensa, GSK, Santhera or Lilly, and in two FP7-sponsored projects on Duchenne muscular dystrophy (BIOIMAGE NMD, #602485, and SCOPE DMD, #60157). He was involved in the NIH sponsored thymectomy trial, and a FP7-sponsored project (#602420) on myasthenia gravis with the company Curavac. He is consultant for Argen-X. The LUMC received royalties from IBL for antibody tests. All reimbursements were received by the LUMC, JJGMV had no personal financial benefit.
AAR is employed by LUMC, which has patents on exon skipping. As co-inventor on some of these patents, AAR stands to gain financially from potential royalty payments. AAR further reports being ad hoc consultant for BioMarin, PTC, Summit, BioClinica, Global Guidepoint, GLG consulting and BMS and being on advisory boards for Philae Pharmaceuticals and ProQR. Remuneration for these activities and speaker honoraria for presenting at BioMarin and PTC organized satellite symposia go to LUMC.
PS is employed by the LUMC and receives salary from the LUMC. He received research funding from the Association française contre les myopathies (grant n 17724 and 19118), the Prinses Beatrix Spierfonds (grant number W.OR14-13), Parent Project Muscular Dystrophy and Spieren voor Spieren. He served in the scientific advisory board of Summit PLC and he is an ad-hoc consultant for Bioclinica BV, Summit PLC and Marathon Pharmaceuticals.
Footnotes
ACKNOWLEDGMENTS
The authors would like to acknowledge the “Association française contre les myopathies” (grant n. 17724 to PS) and EU projects Neuromics (No. 305121) and RD-Connect (305444) for supporting this work. Laura van Vliet is acknowledged for helping with the ELISA and Els van Beelen is acknowledged for the help with the Luminex. The study was supported by the Medical Research Council (MRC) Centre for Neuromuscular Diseases Biobanks (Newcastle) which are part of EuroBioBank; we are grateful to Dan Cox and Mojgan Reza for technical support at the biobank.