
Abstract
Keywords
INTRODUCTION
Inclusion Body Myositis (IBM) is a rare and debilitating muscle disease characterized by the slow and progressive asymmetric weakness and atrophy of proximal and distal muscles, and primarily affects those aged over 50 years of age [1, 2]. IBM is defined pathologically by the presence of rimmed vacuoles and tubulofilaments on muscle histology. IBM is classified as sporadic inclusion body myositis (sIBM) and hereditary or familial form of inclusion body myositis (hIBM/fIBM) [3]. Pathologically, sIBM involves inflammatory and degenerative processes occurring simultaneously and persist from the early stages of the disease to its most advanced phase in sIBM patients [3, 4]. hIBM is caused due to an autosomal recessive gene and does not show inflammation. The majority of the IBM patients are sIBM patients [3]. The progressive weakness often results in loss of ambulatory status, loss of independence and increasing need for assistive devices and supportive care over the lifetime of the patient [5].
Given the rarity of sIBM and overall lack of awareness of the disease, few epidemiological studies exist globally and notably, most available studies were only published in the last 16 years. Of the studies that have been conducted, published prevalence and incidence rates vary substantially [6]. There may be several reasons why variation exists in prevalence rates including; increasing disease awareness resulting in more diagnosed patients; differing healthcare systems resulting in varying referral and diagnostic pathways; variation in available diagnostic guidelines; and expansion of diagnostic criteria for diagnosing sIBM. On the latter, original guidelines proposed by Griggs and his colleagues in 1995 [2], focused on histological findings while more recent guidelines provided by the European Neuro-Muscular Centre (ENMC) propose a clinically-defined subgroup for cases with highly suggestive clinical features but incomplete histology [7, 8]. An additional and previously unexplored explanation of the variation in prevalence rates may be due to study methodological differences and variation in the methodological quality of published sIBM epidemiological studies. The objective of this research was to conduct a systematic literature review, including a methodological quality assessment of the selected papers, and a meta-analysis of the prevalence of sIBM.
METHODS
This systematic review of the literature was conducted and reported according to the Meta-analysis of Observational Studies in Epidemiologyguidelines [9].
Inclusion and exclusion criteria
Studies published in English and reporting prevalence and/or incidence of sIBM patients of all ages, gender and race were included. Many epidemiological studies did not differentiate subtypes of IBM and as the proportion of familial IBM can be considered negligible [10]; such studies are included in this review. Epidemiological studies focusing on other forms of Myositis were excluded.
Data sources and searches
A search of Medline, Medline in-process & other non-indexed citations, Embase, and Cochrane Database of Systematic Reviews was conducted through the OvidSP search platform. A flow diagram of the search process article selection is presented in Fig. 1. The search string used was “Inclusion body myositis AND (epidemiol* OR prevalen* OR inciden* OR trend* OR estimat* OR project* OR extrapol*). Considering the rarity of the disease, the search performed on 23rd March 2017 was not restricted by publication year. Additionally, both the Incidence and Prevalence Database, which is an epidemiological database, and major Myositis and Neurological conferences held in USA and Europe between 2013–2016 were manually searched for relevant articles and abstracts. Bibliographies of all relevant reviews and primary studies were also screened for the validation of the search. No identifiable patient information was extracted during the course of the study. Hence, this study did not require informed consent or institutional review board approval. The review protocol is available from the corresponding author.
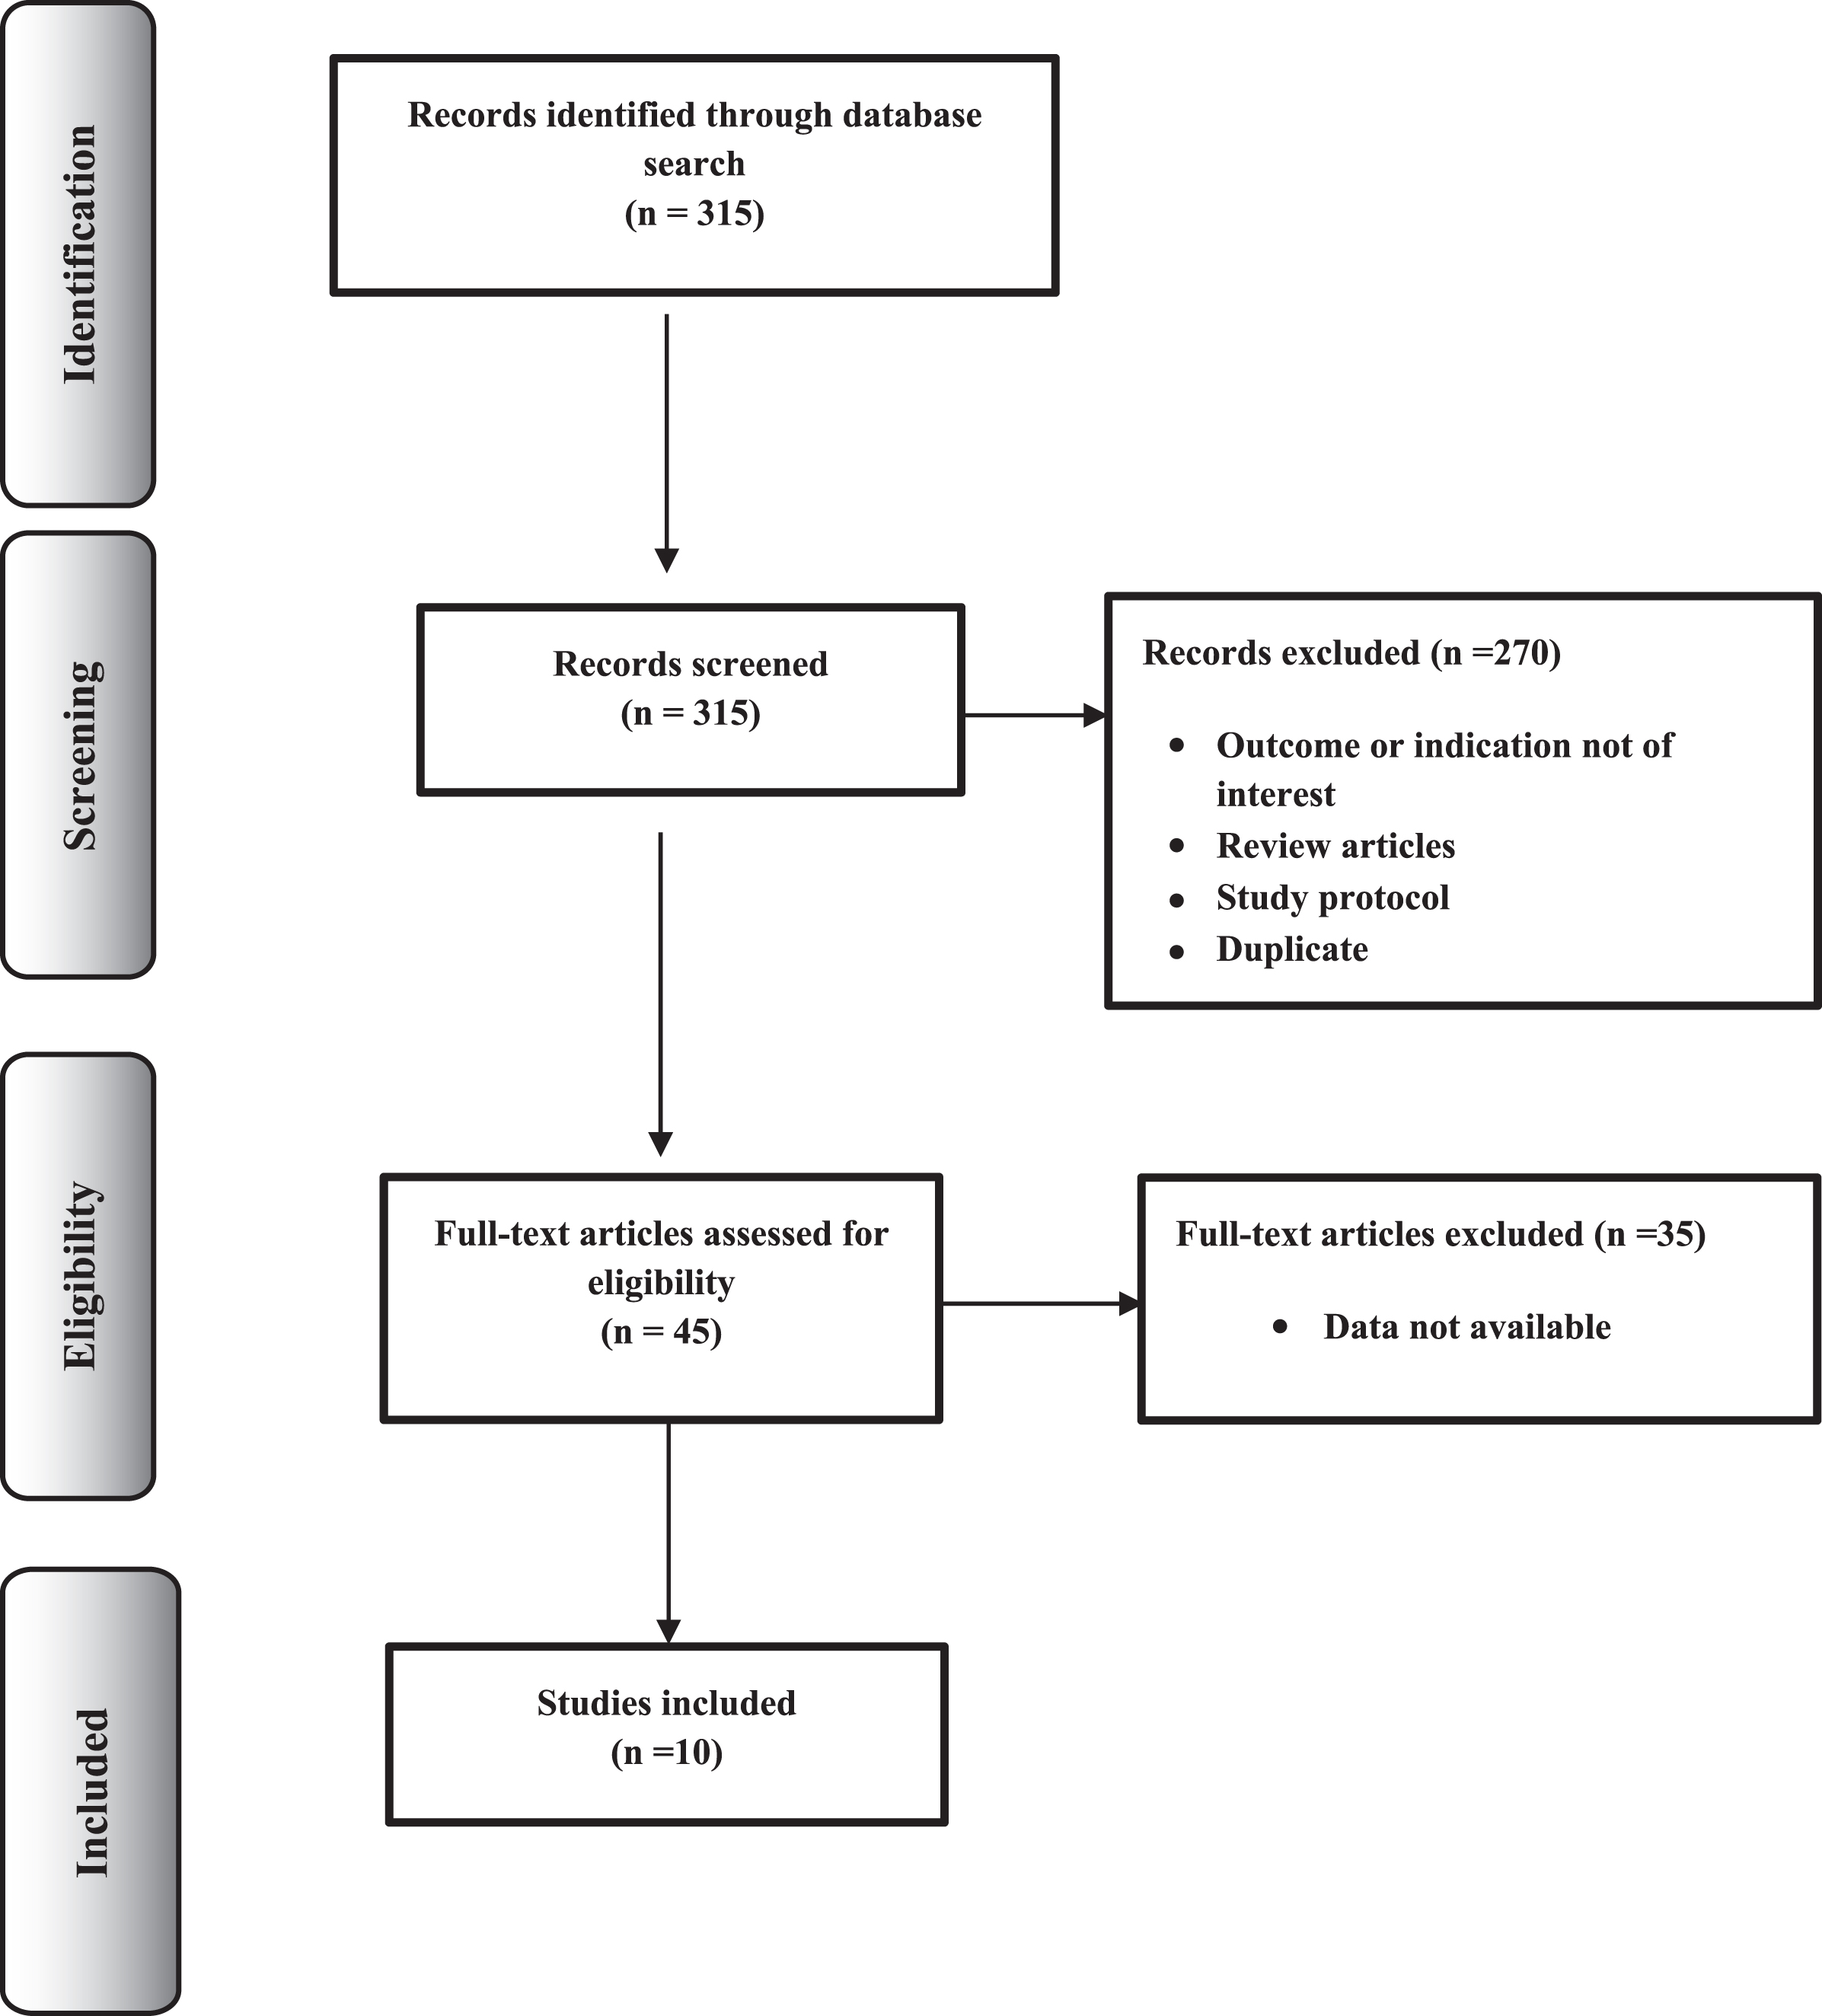
Flow diagram of the articles selection process.
Screening strategy and data extraction
Following the exclusion of duplicates, retrieved citations were exported into an automated Excel file for screening. Two reviewers independently screened the titles and abstracts for eligibility and subsequently, full texts of the potentially relevant abstracts were reviewed. Reasons for exclusion were recorded and any disparities in relevance were resolved by a third reviewer. Study details including region, target population, study design, sampling method and frame, baseline characteristics of the study population and study outcomes (incident cases, incidence, prevalent cases, prevalence, denominator used) were extracted into an excel data sheet.
Quality assessment
The methodological quality assessments were conducted using two scoring tools and a qualitative checklist. The scoring tools included the Loney tool [11] and relevant questions from the Downs and Black questionnaire [12]. The Loney tool is a validated quality assessment scoring tool developed specifically for prevalence studies by Loney and colleagues [11]. The Loney tool evaluates the methods of sampling, sampling frame, sample size, outcome measurement, outcome assessment, response rate, statistical reporting, and interpretation of study results. The overall single quality score ranges from zero to eight with scores from one to three points indicating poor quality, ratings between four and six points considered as of moderate quality and between seven to eight considered as higher methodological quality. Nine relevant questions out of 26 in the Downs and Black questionnaire applicable for observational studies were applied. Eight out of nine questions are rated either as 1 (yes) or zero (no/unable to determine), and one question is rated on a 3-point scale (yes = 2, partial = 1, and no = 0). As a final check to ensure robustness of the results, each paper of interest was evaluated using the MORE qualitative assessment tool. This checklist reflects the ‘gold standard’ methodology applied by the Center for Disease Control (CDC) for incidence and prevalence studies of chronic conditions. The MORE checklist was used to facilitate a broader analysis of the prevalence papers, as the quality evaluators within the checklist are flexible to permit defining biases for specific research questions [13, 14].
Data synthesis
Meta-analysis was performed using the methodology described in Neyeloff et al. [15] and a random effects model was chosen to report pooled prevalence estimates with the associated 95% confidence interval (CI). A random-effects model was preferred to a fixed effect model due to the variation in prevalence estimates which may be a result of variation in population characteristics and differences in risk factors. This was further supported by the H & Q statistics, and the I2 index [16], which indicated considerable heterogeneity. Pooled summary estimates of the prevalence papers identified in the systematic literature review were generated as well as pooled summary estimates of general population prevalence and over 50 s prevalence for the four studies considered as moderate in quality. Q test results, the I2 index and H statistic are reported to express heterogeneity between studies [17]. Between-studies variance (τ2) is also reported. Some studies provided numerator and denominator permitting estimation of standard errors but others did not provide a denominator. Thus the relevant population estimates were imputed through back calculations where possible and where studies did not report the prevalence estimate of interest, the denominator was adjusted to estimate the prevalence rate. As this is a disease predominantly in those aged over 50, the number of cases was assumed to be the same in the general population as in the >50 s population and used to calculate the prevalence estimates for each country / region of interest, where applicable. One prevalence study applied a ratio of polymyositis to sIBM patients to their survey data on polymyositis patients to generate a prevalence estimate of sIBM. Given the low methodological quality of such an approach, this prevalence study was excluded from the overall meta-analysis.
RESULTS
The systematic and manual search returned a total of 315 articles. Initial screening of title and abstract resulted in the further exclusion of 270 abstracts with the remaining 45 articles selected for full text screening. Subsequently, 10 papers were identified and assessed for methodological quality from which prevalence estimates were also extracted (Fig. 1). Eight of these studies retrospectively examined the patient’s medical and biopsy reports [18–25] and one study from Ireland completed prospective and retrospective case identification of patients with neuromuscular disease [26]. One study conducted in Japan estimated the number of sIBM patients from the number of polymyositis patients obtained through a survey [27]. A summary of each study and the reported prevalence estimates are presented in Table 1.
Summary of prevalence studies and quality assessments
*Prevalence cases as reported in paper. #As reported in paper but estimated based on ratio of polymyositis to sIBM patients.
Results from the systematic search suggest a concentration of studies completed in either Australia or the US and confirmed wide variation in reported prevalence of sIBM. Of the two studies conducted in the USA, the prevalence reported in Minnesota County was 70.6 per million among individuals above 30 years of age in 2000 [18]; the highest prevalence estimate reported to date. In Connecticut, the reported prevalence was 10.7 per million in 1998 [19]. Both studies used Griggs et al. diagnostic criteria.
Three of the included studies were conducted in Australia, of which two were sequential studies conducted by the same investigators to examine prevalence over time. The first of these studies estimated prevalence at 9.3 per million in 1998 [20] while the second study, completed 8 years later, reported prevalence at 14.9 per million in 2006 [21]. A third, separate study conducted in South Australia in 2009 reported much higher prevalence of 50.5 per million among the over 18 population [22].
The remaining studies were conducted in Europe, Turkey and Japan. In 2012, the prevalence in individuals above 18 years in Southeast Norway was reported as 35 per million [23]. Estimates from Turkey are the lowest prevalence estimates available globally with a prevalence estimate of 1.06 per million in 2010 [24]. Prevalence estimates from the Netherlands are 4.9 per million in 1999 in individuals above 45 years of age [25]. The most recent published study reported the prevalence of sIBM in the population of above 50 years as 117.0 per million (95% CI: 98.2–135.8) in Ireland [26]. Finally, one study in Japan based on a retrospective survey, reported the prevalence of sIBM as 1.28 per million in 1991 and 9.83 million in 2003 [27].
Overall, the results of the methodological quality assessments were consistent across assessment tools (Table 1). As per the Loney score, methodological quality was considered low for six of the studies and moderate (score of 4 or 5) for the remaining four studies [18, 26]. The most frequent source of potential bias identified by the Loney assessment was lack of random sample followed by inadequate sample size (N > 300), although the latter is unlikely to be achievable given the rarity of sIBM (Table 2). All studies sufficiently described the study subjects and eight of the studies had independent assessors involved in the studies assessing diagnosis of sIBM. One study included patients with neuromuscular disease as diagnosed by a neurologist. However, relatively few of the studies (three studies) reported CI of their prevalence estimates while another two studies reported a range of estimates given different diagnostic criteria. Overall, studies with a Loney score of 4 or higher reported higher prevalence ranging from 35.9 –70.8 per million [18, 22–24]. Of note, these studies were also the more recently published studies found in the literature search and used standard diagnostic criteria. In addition, the Olmsted county study was a small population based studies and sIBM patients who refused muscle biopsies were not included, thus their estimates may be considered an underestimate.
Summary of prevalence studies and quality assessments
The Downs and Black appraisal scores ranged between 6 and 10 and are presented in more detail in Table 3. Out of 4 domains, 3 domains had questions relevant to observational studies. The prevalence study conducted in South Australia scored affirmatively on all the relevant questions and received the highest score [22]. Three studies scored nine [18, 26], four studies scored eight [20, 25], and the remaining two studies scored six [19, 27]. While the MORE results are not reported in detail here, results were consistent with both the findings of the Loney tool and Downs and Blacks quality assessment.
Results of Downs and Blacks Questionnaire assessment
The results of the meta-analysis are presented in a forest plot in Fig. 2. Utilizing available data from 9 of the prevalence articles provided a pooled meta-prevalence of 24.8/1,000,000 (95% CI: 20.0–29.6; Q = 83.6; H = 3.2; I2 = 90.4; τ2 = 53.7) [18–26]. For those publications with a Loney score of 4 or 5, the pooled adjusted meta-prevalence was 45.6/ 1,000,000 (95% CI: 35.9 – 55.2; Q = 13.0; H = 1.6; I2 = 77.1; τ2 = 132.9) [18, 26]. The adjusted >50 s pooled meta-prevalence from the nine papers was 77.0/1,000,000 (95% CI 60.9–93.1; Q = 66.7; H = 2.9; I2 = 88.0; τ2 = 607.5). For the four publications with the highest Loney scores, the adjusted >50 s meta-prevalence estimate was substantially higher at 138.9/1,000,000 (95% CI 105.7–172.1; Q = 10.2; H = 1.8; I2 = 70.6; τ2 = 1149.2).
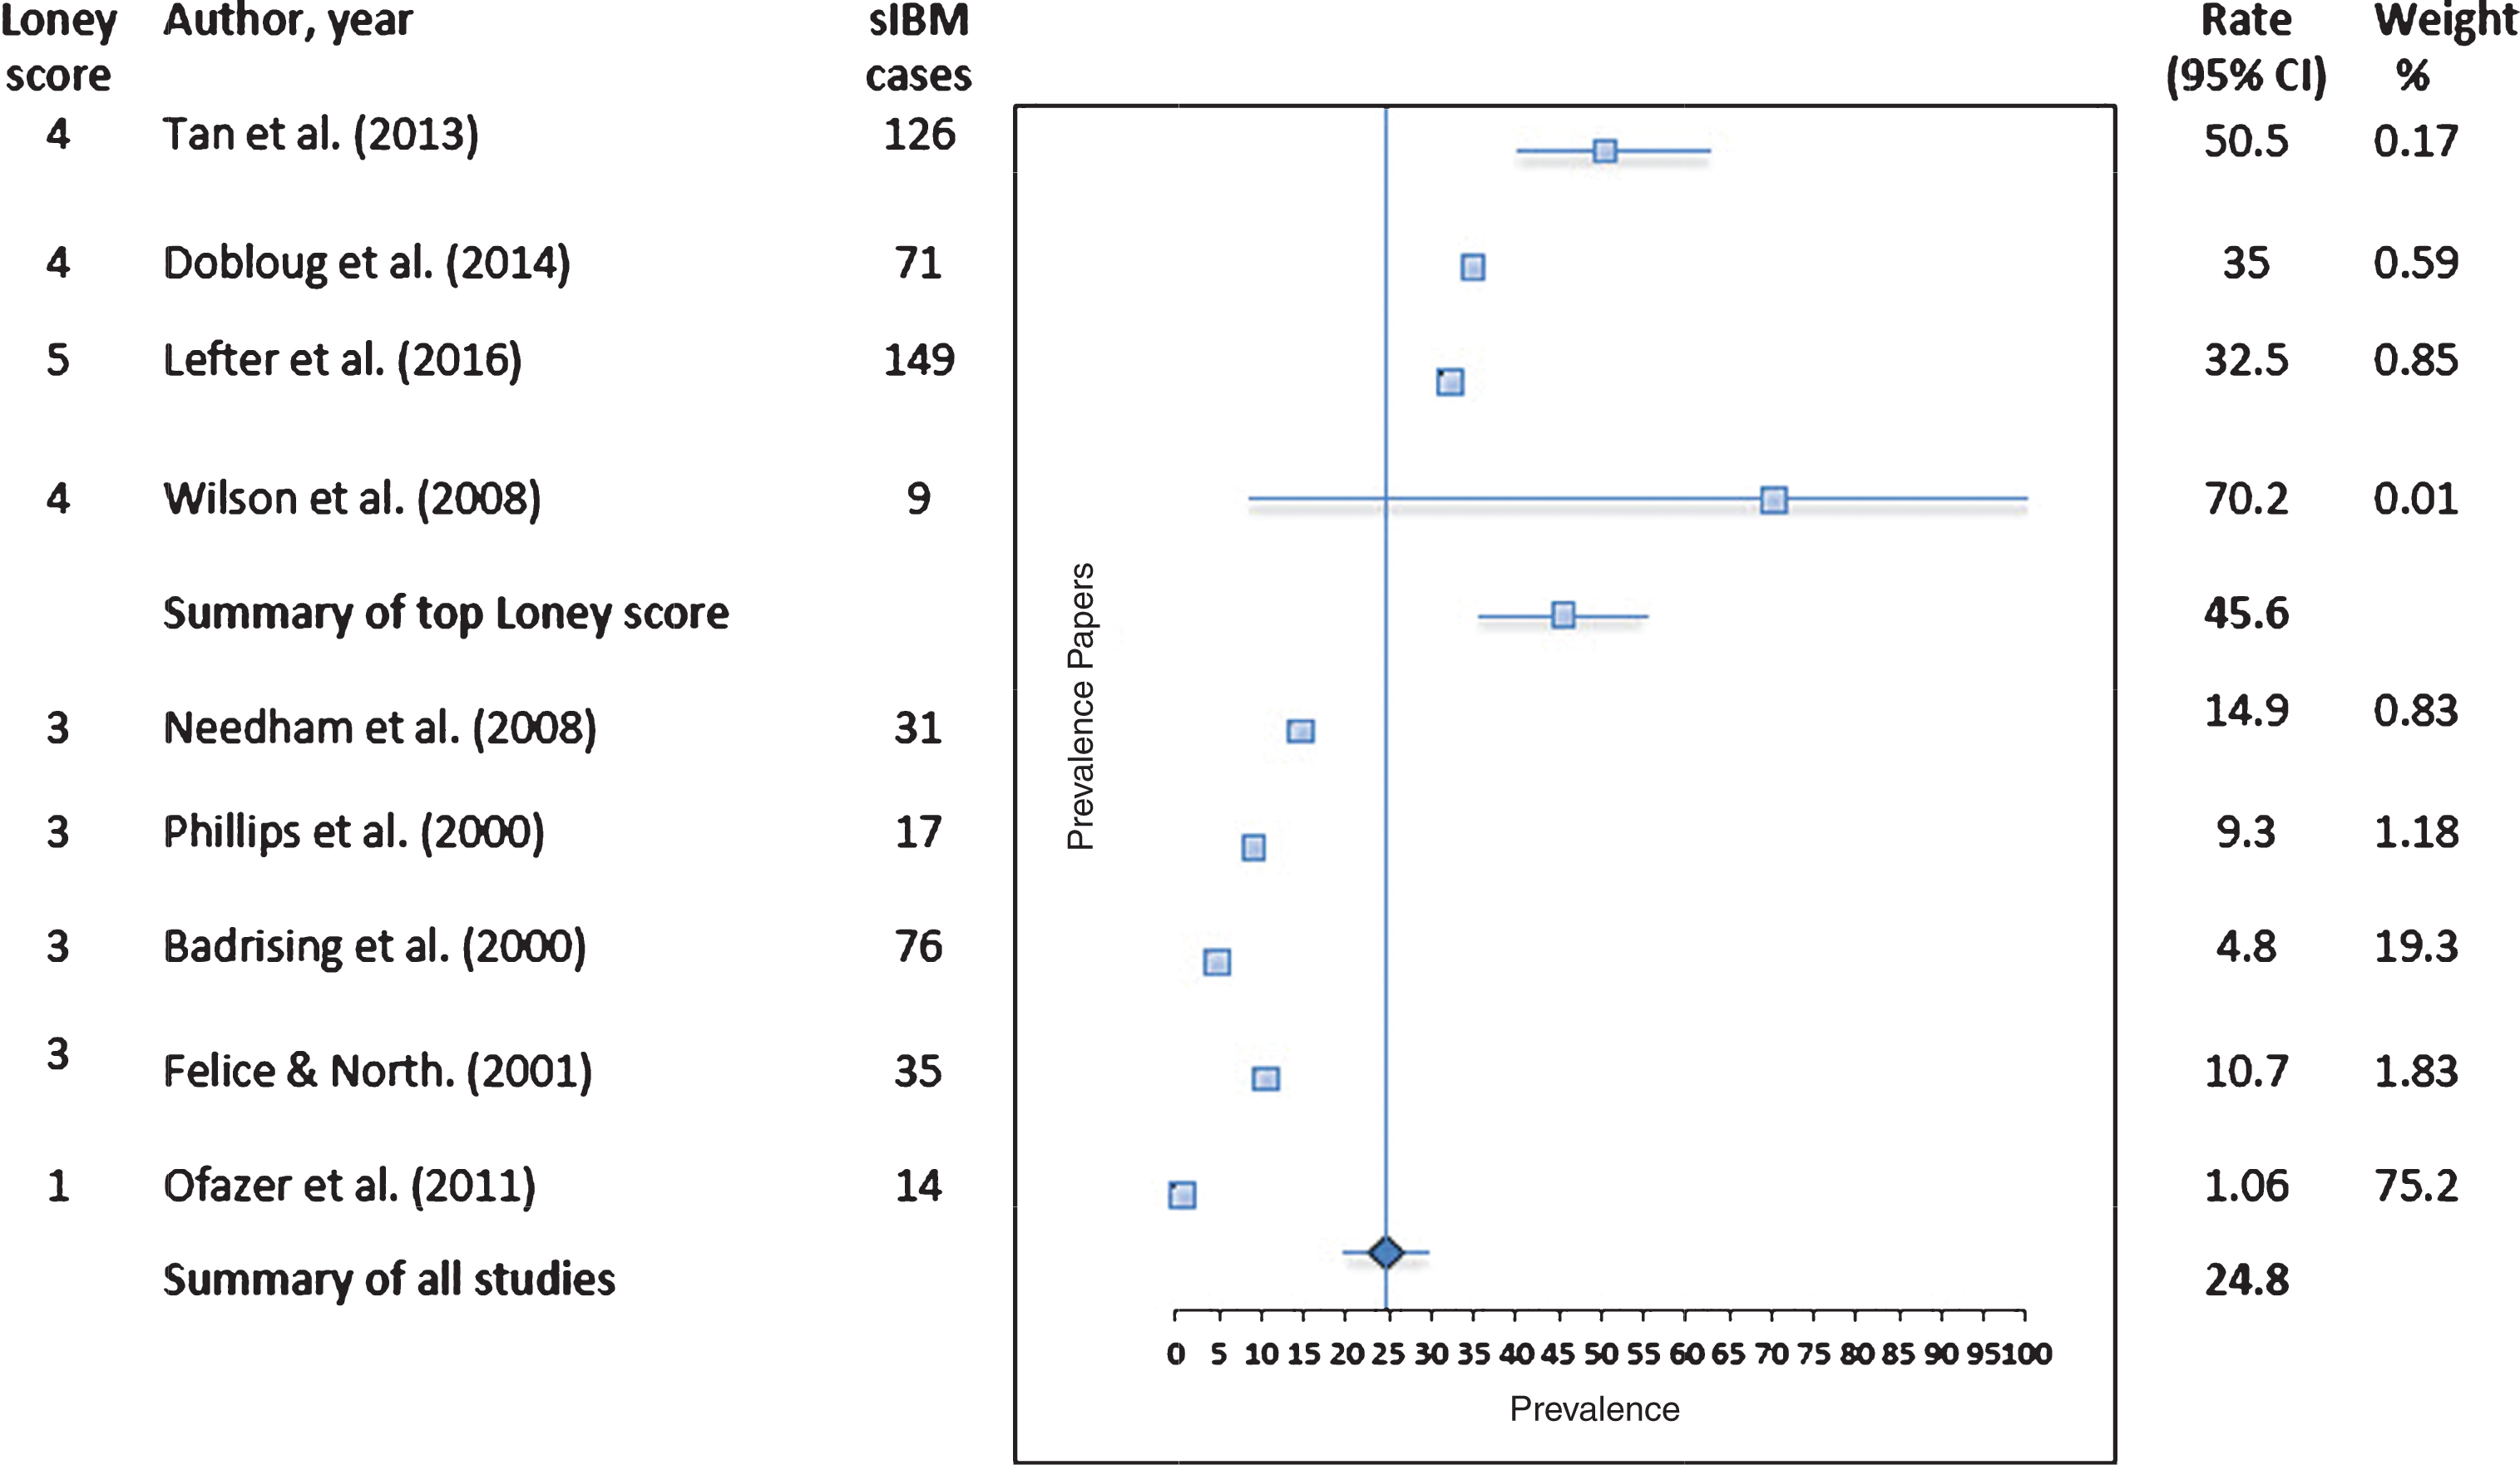
Pooled prevalence of sIBM, as reported from the 9 studies in general population*$.*Dobloug et al. [23] reported a range for different ENMC diagnostic criteria of 33 per million (1997 criteria) to 35 per million (2011 criteria). *Ofazer et al. [24] reported a range for most suggestive sIBM cases (prevalence of 0.697) to also including cases of probable sIBM (prevalence of 1.056) to further including questionable sIBM (prevalence of 1.886). *Lefter et al. [26] reported >50 s prevalence and was adjusted to the general population in the forest plot. #Results as reported in paper. Where prevalence rate of interest is not reported, the reported prevalence is adjusted for meta-analysis. $Fixed effects for all 9 studies was 2.69 and for the top four studies was 32.6. I2 index, H and Q statistics indicated the appropriate selection of the random effects model.
DISCUSSION
This systematic review demonstrated both the rareness of sIBM and also the variation in the available prevalence estimates worldwide. The comprehensive search of major databases and the systematic review of papers meeting our inclusion criteria returned papers which reported both regional prevalence of sIBM (6 studies) and national prevalence of sIBM (4 studies). The wide range in reported prevalence may, in part, be explained by improvements in disease awareness and variation in diagnostic criteria applied within each study. Recent findings indicate Grigg et al. or ENMC diagnostic criteria are not sensitive enough for early diagnosis [25, 28]. Another significant contributing factor to the underreporting of sIBM is the delay in diagnosis due to the slow progressive nature of the disease [1]. Under-reporting is also supported within the noted limitations of each of the prevalence papers where authors acknowledge that the prevalence estimates reported are likely to be underestimates due to incomplete case ascertainment and underreporting due to misdiagnosis [19]. Indeed Lefter et al., [26] suggest better disease awareness, improved diagnostic modalities and more comprehensive case ascertainment as reasons for estimating one of the highest over 50 s prevalence of sIBM (117.0 per million) [26].
Given the evident variation in prevalence estimates across continents, geographical variations in estimates have been suggested as a possible explanation by some authors. Badrising et al., in their discussion of their prevalence estimates obtained for the Netherlands relative to other regions such as Western Australia, suggest that regional differences should not be ruled out [25]. Furthermore, both Mastaligia et al. and Needham et al. indicate that genetic susceptibility, particularly the higher frequency in Caucasians of HLA-DR3 (DRBI*0301), the strongest genetic susceptible factor identified so far, may help further explain why prevalence differs across countries [6, 21]. However, further work to help clarify the importance of genetic factors and the interaction with environmental factors in sIBM is warranted.
Our study aimed to further understand the variation in reported prevalence by completing a robust methodological quality assessment of the published prevalence papers using the frameworks provided by Loney et al., Downs and Blacks and the MORE checklist. The Loney quality assessment, as well as the other assessment tools described, provided an equivalent grouping of studies by methodological quality and facilitated a meta-analysis of results. The results across tools were consistent and as demonstrated here, those papers assessed as having higher methodological quality also returned the highest prevalence estimates. The Loney tool also identified frequent sources of potential bias which must be considered when understanding the prevalence of sIBM. The inadequate sample sizes and response rate can be attributed to the rareness of sIBM and coupled with the difficulties in diagnosis and disease awareness, we conclude these are likely to result in an underestimation of the prevalence of sIBM.
There is only one previous meta-analysis of sIBM prevalence conducted by Meyer et al. in 2015 [29] and since their publication, two additional prevalence studies from Norway [23] and Ireland [26] have been published and are included in our review. Our pooled prevalence estimate returned a slightly higher meta-estimate of 24.8/1,000,000 (95% CI: 20.0–29.6) compared with Meyer et al. estimate of sIBM of 20.1 per million (95% CI15.1–26.9) [29].
Inevitably, the overall small pool of available prevalence papers with variable published results resulted in some limitations for this study. While grouping of the papers by methodological quality facilitated a meta-analysis, the small number of papers means exercising caution over drawing firm conclusions on the precise prevalence rate of sIBM. Notably there is considerable heterogeneity, as is evident by the I2 index and H statistic for each of the meta-prevalence results. In addition, the reported prevalence in some cases, did not adjust for age or gender and consequently the pooled estimate does not take into account age and sex adjustments.
In conclusion, coupled with the demonstration of increasing prevalence over time, as is evident by the two sequential Australian studies, it is clear that the true prevalence of sIBM may be higher than previously reported. The pooled estimate restricting to those publications with highest methodological quality also lends support to this. It is thus strongly recommended that more high quality prevalence studies are undertaken to establish the ‘true’ rate of prevalence of sIBM. It is the authors’ recommendation that such studies follow ‘gold standard’ methodological guidelines for conducting prevalence studies in a rare and orphan disease including selecting and describing appropriate disease diagnostic criteria and subject selection, clearly defining the population of interest to the study (regional or country population, subgroups of patients by gender, age etc.), selecting an appropriate sampling frame and conducting a robust analysis while reporting precision of estimates (e.g. 95% confidence intervals) and any study limitations [30]. Further studies of high methodological quality will permit a better understanding of the prevalence of sIBM and will help improve our knowledge regarding the variability of sIBM by region and ethnicities.
CONFLICT OF INTEREST
Drs. Callan, Capkun and Ms. Vasanthaprasad are employees of Novartis. Ms. Fritas and Dr. Needham were consultants for this study. This study was funded by Novartis Pharma AG. The authors have no conflict of interest to report.
PREVIOUS PRESENTATION
Data previously presented in American College of Rheumatology-2015; The 68th American Academy of Neurology conference-2016.
Footnotes
ACKNOWLEDGMENTS
The authors would like to thank Parul Houston and Pamela Vo from Novartis Pharma AG for reviewing the manuscript and Shubhro Ghosh from Novartis Healthcare Pvt. Ltd., India for his advice on the systematic review.