
Abstract
Information amount has been shown to be one of the most efficient methods for measuring uncertainty. However, there has been little research on outlier detection using information amount. To fill this void, this paper provides a new unsupervised outlier detection method based on the amount of information. First, the information amount in a given information system is determined, which offers a thorough estimate of the uncertainty of this information system. Then, the relative information amount and the relative cardinality are proposed. Following that, the degree of outlierness and weight function are shown. Furthermore, the information amount-based outlier factor is constructed, which determines whether an object is an outlier by its rank. Finally, a new unsupervised outlier detection method called the information amount-based outlier factor (IAOF) is developed. To validate the effectiveness and advantages of IAOF, it is compared to five existing outlier identification methods. The experimental results on real-world data sets show that this method is capable of addressing the problem of outlier detection in categorical information systems.
Introduction
Background and related work
Data mining aims to select the best information from massive amounts of data. Most information conforms to certain rules, but there are also small quantities of information that runs counter to the rules for various reasons, and these are called outliers.Until now, there has not been a uniform and rigorous definition of outliers, and the description commonly cited by scholars was proposed by Hawkins in the 1980s, namely, “outliers are different data points in a data set”. We can understand that outliers are significantly different from the rest of the data set. Outliers are also commonly referred to as outliers, blemishes, outliers, inconsistencies, deviations, and novelties [13]. Edgeworth was the first to perform outlier detection by analyzing and mining outlier points using mathematical statistics. Since then, many scholars have applied new theories and technologies to outlier detection and optimized and improved them constantly, making outlier detection an important branch of data mining on a par with predictive modeling, cluster analysis, and association analysis and playing a pivotal role in many fields such as public health and medical treatment [25], loan approval [31], weather forecasting [4], education management [26], and power operation [19, 38]. The name, definition, and criterion of outliers are different due to different application fields or purposes.
There are various ways to categorize outlier detection methods. Outlier detection methods can be classified into three categories according to whether labels are involved in the process of recognition: supervised, supervised nested, and unsupervised supervised. It can be divided into four categories based on different method principles as well: probability distribution-based methods, classification-based methods, clustering-based methods, and proximity-based methods.
Probability distribution-based methods utilize a standard distribution to fit the data set and identify outliers based on the probability distribution. For example, Yamanishi et al. [33] used a Gaussian mixture model to represent normal behavior and scored each case according to the variation of the model, and a high score indicates a high probability of being an outlier. Later, this research result was used in conjunction with a supervised learning method to obtain another probability distribution outlier detection model.Shin [30] employed Markov chains to probabilistically model abnormal events in networked systems.While classification-based methods do not need to know the sample distribution and do not need to label the sample, They have strong learning inference ability, good generalization, and are theoretically more suitable for outlier detection of high-dimensional data. Such as neural network-based methods, Bayesian network-based methods, support vector machine-based methods, and rule-based methods.For clustering-based methods such as DBSCAN [11] and DPC [27], no strict rules about data types, no priori knowledge, and class labels are needed. They mainly focus on finding clusters and regard objects far from the cluster centers as outliers.Proximity-based methods have similar advantages to clustering-based methods and identify outliers mainly based on the distance or density of objects. The method commonly used for local proximity is the LOF method [3], and then a series of methods such as LDOF and LoOP have been proposed based on LOF [6, 18].
With the rapid development and gradual improvement of methods related to rough set theory (RST), these methods are widely used in the fields of knowledge acquisition, machine learning, pattern recognition, attribute approximation, and decision analysis. RST has also been successfully used for outlier detection.Shaari [29] used the new concept of nonapproximation to detect outlier patterns based on RST.Jiang et al. [16] proposed the IEOF method for a categorical information system based on information entropy, one of the metric tools of uncertainty.Chen et al. [5] introduced a neighborhood model to combine the coarse-grained technique with an outlier detection technique. Sangeetha et al. [28] considered the weighted density values of attributes and objects in outlier detection for an intuitionistic fuzzy information system. Domingueset et al. [8] gave a comparative evaluation of outlier detection methods.Yuan et al. [34] proposed the NIEOD method by building a neighborhood information system using heterogeneous distances and adaptive radius and then realizing the information metrics by using the neighborhood information entropy. Degirmenci et al. [10] put forward efficient density and cluster-based incremental outlier detection in data streams. Yuan et al. [35–37] proposed methods based on fuzzy information entropy, fuzzy roughness granularity, and weighted fuzzy roughness density, respectively. Jin et al. [15] introduced intrusion detection on the internet of vehicles via combining log-ratio oversampling, outlier detection, and metric learning. Kandanaarachchi et al. [17] brought up unsupervised anomaly detection ensembles using item response theory. Meira et al. [22] came up with fast anomaly detection with locality-sensitive hashing and hyperparameter autotuning. Wang et al. [32] provided outlier detection based on a weighted neighborhood information network for mixed-valued data sets.
Motivation and inspiration
The existing detection methods apply to numerical data or mixed data, and only a few methods can deal with data using categorical attributes, but categorical attributes account for the majority of data in real life and applications. In addition, data processing methods for casting numerical data into categorical data tend to be more complex and sometimes lead to suboptimal results, while categorical data can be converted into numerical data more easily. Therefore, outlier detection for categorical data is still a topic that needs to be continually explored and developed.
The information amount is a basic metric for the uncertainty of an information system. However, the study for outlier detection based on information amount has not yet been reported.
Based on the research motivations stated above, we propose a new unsupervised method for spotting outliers that takes advantage of the information amount in rough set theory. Our method’s main idea is as follows. If we have an information system and a set of indiscernibility relations on domain U, we conceive of each equivalence class in the partition as a collection of objects on U. This is because every indiscernibility relation makes U partitionable. In other words, the indiscernibility relationship separates U into multiple groups. Then, based on the information amount, we compute the relative information amount and relative cardinality of object x under the indiscernibility relation, which provides us with a measure of x’s uncertainty. Because uncertainty can be considered an abnormal quality, the calculation of the relative information amount helps to identify group objects that are not common on U. The relative information amount, relative cardinality, and weights are then utilized to construct the information amount-based outlier factor, which explains the outlier. Finally, if the outlier factor of x under these relations is always very high, we can treat x as an information amount-based outlier on U with respect to the information system.
The main contributions are summarized as follows:
(1) The information amount and relative information amount for categorical data are proposed, which provide a comprehensive measure for the uncertainty of categorical data. The degree of outlierness and weight function are presented to find outlier factors.
(2) An outlier detection method based on information amount is presented. Instead of labeling data and determining the neighborhood radius to identify outlier samples, this method measures the difference in the information amount after abandoning a certain object. Compared with neighborhood-based and clustering-based methods, it does not need to consider finding out the optimal parameter values, nor does it need to calculate the distance between two objects.
(3) The information amount-based outlier factor method is given. The experimental results show that the proposed method has better validity and adaptability for categorical data.
Organization
The remainder of this essay is structured as follows: Section 2 briefly reviews information systems and information amount. Section 3 introduces the necessary definition and concept of the outlier detection method based on information amount, and Section 4 describes the particular method of the proposed detection method and the spatial and temporal complexity of the method. The experimental findings are presented in Section 5, along with a discussion of the findings following statistical analysis. Section 6 of this work contains its conclusion. Fig. 1 depicts the research framework of this paper.
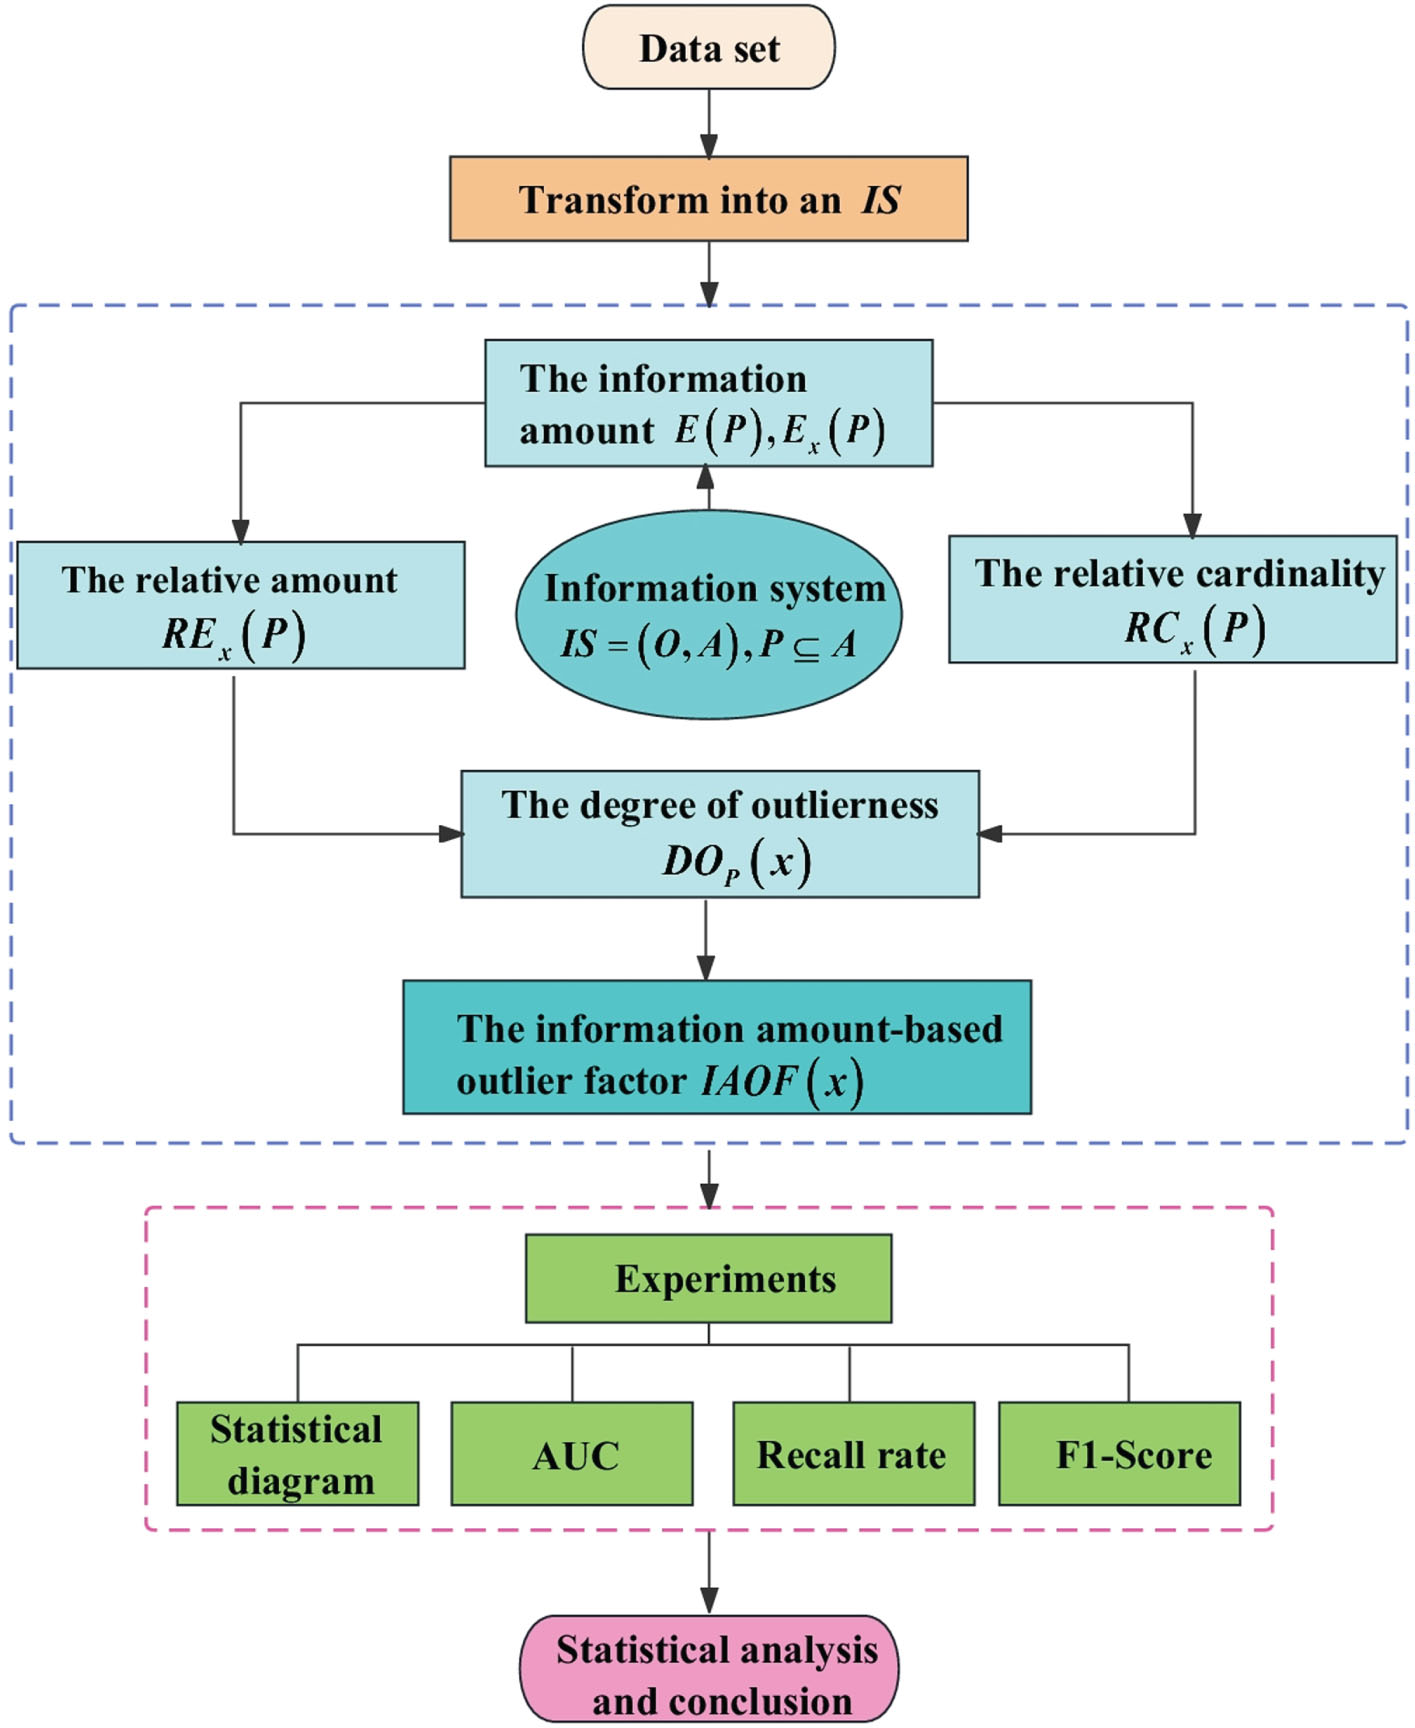
The research framework of this paper.
The section recalls information systems and the concept of information amount. In this paper, O and A are two non-empty finite sets; 2
O
denotes the power set of O, and |X| represents the cardinality of X ∈ 2
O
. Concretely, let
If the attribute in (O, A) is categorical, then (O, A) is known as a categorical information system (CIS).
In a given CIS (O, A), for any subset of attributes P ⊆ A, the indistinguishable relation under attribute subset P is defined as follows:
Obviously, ind (P) is an equivalence relation on O. Denote
Then [o] P is known as the equivalence class of o under relation ind (P).
Suppose that X
i
= {oi1, oi2, …, o
is
i
}, then |X
i
| = s
i
. So
X i = [oi1] P = [oi2] P = ⋯ = [o is i ] P .
This implies that ∀ i,
Thus ∀ i,
Hence
In this section, we present a formally and strictly defined method for detecting outliers in a CIS based on information amount.
Let (O, A) be a CIS. ∀ P ⊆ A, ∀ x ∈ O, removing all objects belonging to the equivalence class [x]
P
from O and letting
Naturally, from Proposition 2.4, the information amount of ind
x
(P) that does not contain [x]
P
from O is defined as
It’s easy to derive 0 ≤ RE P (x) ≤1.
Especially, E x (P) =0 and RE P (x) =1 when O/ind (P) = {[x] P , O - [x] P }.
In particular, RC P (x) = |O| when m = 1.
From the form of the formula, relative cardinality denotes the difference between the cardinality of [x]
P
and the mean cardinality of other equivalence classes. In general, the cardinality of the minority class is smaller than the cardinality of the majority class. It means the cardinality of [x]
P
is larger than that of the equivalence classes in
Suppose that (O, A) is a CIS with A = {a1, a2, ⋯ , a
m
}. We rearrange the attributes in A to get a sequence
Denote
Denote
Then IAOF (x) is known as the information amount-based outlier factor (IAOF) of x.
In this article, the set of all μ-outliers in a CIS is denoted as Ω μ. Next, an illustrative example is shown in detail.
Initial CIS for Example 1
The equivalence class of each object
For {a1}, O/ind ({a1}) = {{o1, o2} , {o3, o4, o5} , {o6}} .
For {a2}, O/ind ({a2}) = {{o1, o2, o4, o5} , {o3, o6}} .
For {a3}, O/ind ({a3}) = {{o1, o6} , {o2, o3, o4, o5}} .
(1) According to Proposition 2.4 mentioned above, the information amount for each singleton attribute subset of A is
(2) A descending sequence of attribute subsets can be constructed as A1 = {a2, a3, a1} , A2 = {a3, a1} , A3 = {a1} since E ({a1}) > E ({a2}) = E ({a3}).
For A1, O/ind (A1) = {{o1} , {o2} , {o3} , {o4, o5} , {o6}} .
For A2, O/ind (A2) = {{o1} , {o2} , {o3, o4, o5} , {o6}} .
For A3, O/ind (A3) = {{o1, o2} , {o3, o4, o5} , {o6}} .
Analogously, the information amount for each attribute subset in the sequence becomes
And the information amount for each attribute subset in the sequence after removing an equivalence class is
(3) Based on Definition 3.1 and the above results, we next determine the relative information amount of different subsystems.
Similarly, we can obtain
(4) From Definition 3.2, the relative cardinality
(5) Correspondingly, from Definition 3.3, the degree of outlierness of o i can be calculated as follows:
Meanwhile, the degree of outlierness of different objects with respect to different subsets of attributes is
DO A 2 (o3) =0 = DO A 2 (o4) = DO A 2 (o5) ;
(6) In addition, according to Definition 3.4, the weights of different objects with respect to different subsets of attributes can be calculated:
Besides,
(7) As a result, the information amount-based outlier factor of o1 in (O, A) is given as follows:
Similarly, we compute each object’s information amount-based outlier factor:
IAOF (o2) ≈0.5492, IAOF (o3) ≈0.5243,
IAOF (o4) = IAOF (o5) ≈0.4001, IAOF (o6) ≈0.7406 .
Finally, the IAOF for each instance is compared against the judgment threshold λ = 0.72:
IAOF (o4) = IAOF (o5) < IAOF (o3) < IAOF (o2) < IAOF (o1) < μ < IAOF (o6) .
As a result, o6 has an IAOF greater than the judgment threshold mu, implying that o6 is an information amount-based outlier, as defined in Definition 3.6.
Section 3 describes an outlier detection method based on the information amount, including theoretical concepts, specific calculation procedures, and an illustrative example. This section also presents the corresponding algorithm and examines its complexity.
Algorithm 1 depicts the process of calculating the IAOF for a CIS (O, A), which includes four loops. Because O/ind (a j ) and O/ind (A j ) have a time complexity of O (nlogn) and O (m × nlogn), respectively, the calculation costs for the first three loops are O (m × nlogn) , O (m2 × nlogn), and O (mn). As a result, the IAOF method has a worst-case time complexity of O (m2 × nlogn). The technique of the method also employs a two-dimensional array data structure and has an O (mn) space complexity. Therefore, the algorithm is feasible in terms of computer operating time and space.
1:
2: Ω μ← ∅
3:
Calculate O/ind ({a j })
4: Calculate E ({a j })
6:
7: Determine
8: Construct A1, A2, ⋯ , A m
9:
10: Calculate O/ind (A j )
11: Calculate E (A j )
12:
13:
14:
15: Calculate E o i ({a j }) and E o i (A j )
16: Calculate RE{a j } (o i ) and RE A j (o i )
17: Calculate RC{a j } (o i ) and RC A j (o i )
18: Calculate DO a j (o i ) and DO A j (o i )
19: Calculate ω a j (o i ) and ω A j (o i )
20:
21: Calculate IAOF (o i )
22: If IAOF (o i ) textgreaterμ
23: Ω μ ← Ω μ ∪ {o i }
24:
25:
26: return Ω μ.
Experiments and comparative analyses
In this section, data sets collected from the real world are chosen for experiments to assess the behavior of IAOF. Due to the limited number of categorical data sets provided by the UCI (University of California Irvine) machine learning repository and the problems of a large number of missing values or a high percentage of outliers in some data sets, we selected several data sets from the KEEL (Knowledge Extraction based on Evolutionary Learning) data set repository [2]. The KEEL is available under the GNU General Public License version 3, which can be used for a variety of data discovery applications. It provides a simple user interface that uses data flow to design experiments with different data sets and computational intelligence methods. Almost all of the imbalanced data sets in the KEEL are from UCI. After preprocessing, the original UCI data sets are divided into five folds employing stratified cross-validation. In this way, a sufficient quantity of minority objects in the test partitions is disposed of, and the test partition objects are more representative of the underlying knowledge. Besides, the imbalance rate of the data set ranges from 1.5% to less than 10%, which is extremely suitable for imbalanced data classification as well as outlier detection.
Experimental settings
Data descriptions
In the experiment, we selected three datasets from the UCI repository, namely the Hayes-Roth dataset (referred to as Hayes), the Congressional Voting Records dataset (referred to as Voting), and the Mammographic Mass dataset (referred to as Mamm). Additionally, four datasets were chosen from the KEEL repository, including the MONK-2 dataset (referred to as Monk), the Australian Credit Approval dataset (referred to as Aust), the Pima Indians Diabetes dataset (referred to as Pima), the Breast Cancer Wisconsin (Diagnostic) dataset (referred to as Cancer), and the Solar Flare-2 dataset (referred to as Flare). The datasets in question comprise categorical attributes, including both nominal and ordinal attributes, as well as numerical attributes, encompassing interval and ratio attributes. Moreover, the data sets exhibit a few instances of missing data. In the context of semantically relevant datasets, classes that are rare and deviate from the typical case are defined as outlier classes. Alternatively, if there is no clear deviation, the outlier class is determined based on the class with the fewest number of objects [7, 20].
Consequently, three main steps are involved in data preprocessing: The first step is imputing the missing values. Because of the relatively low percentage of missing values (the data sets Mamm and Voting suffer from 3.41% and 5.63% missing values, respectively), missing values for numerical attributes are filled with the mean, while missing values for categorical attributes are filled with the mode, which is also known as the maximum probability value method. The second step is to cut the numerical attribute data into three bins using the equal-range discretization method to obtain categorical data. The third step is to generate outliers using the downsampling method proposed in [7]. Outlier detection usually involves the random downsampling of a specific class to generate outliers while retaining all instances of the remaining classes to generate inliers. Random downsampling usually results in a dramatic change in the data set. Therefore, to mitigate the effect of randomization after downsampling, we repeat downsampling 10 times for the data sets with more than 10% outliers, use IAOF to detect outliers for each of these 10 variants, and finally select the variant with average detection performance for the comparison experiment. Table 3 shows the detailed information and data preprocessing of each data set.
Detailed information and data preprocessing for the data sets
Detailed information and data preprocessing for the data sets
To evaluate our method’s performance quantitatively and comprehensively, we compare it to five other popular outlier detection methods: the k-nearest neighbor method (KNN) [24], the isolation forest method (IForest) [21], the cluster-based local outlier factor method (CBLOF) [14], the information entropy-based method (IEOF) [16], and the neighborhood-based outlier detection method (NED) [5].
KNN is one of the simplest methods in data mining. This algorithm is used to classifying rare events. To apply KNN for outlier detection, all features of the training data must be numeric, as it is based on the distance between two objects. Therefore, in the case of categorical features present in the training data, it is necessary to encode the categorical features with dummy variables to convert them into numerical features. Throughout this experiment, the Euclidean distance is used as the distance matrix after data transformation, and cross-validation and grid search are used to select the optimal value for hyperparameter k. IForest does not need to calculate the distance or density of objects and is widely used in industry for outlier detection of structured data due to its linear time complexity and excellent accuracy. CBLOF uses the data set and the cluster model generated by the clustering algorithm as inputs. It classifies the clusters into small clusters and large clusters using the parameters alpha and beta. According to the size and distance of the cluster to which the point belongs, an anomaly score will be calculated. When dealing with different types of data, CBLOF uses a variety of clustering methods. In the present experiment, clustering by CBLOF is performed using the k-means method. The parameters and required by the CBLOF algorithm are set to 0.9 and 5, and the optimal value of the number of clusters to form as well as the number of centroids to generate n _ cluster is calculated in the range [1, 50] with a step size of 1. NED measures the local information in a CIS and performs well in outlier detection for mixed data sets as well as categorical attribute data sets.
KNN, CBLOF, IEOF, and NED are proximity-base methods, while IForest is a classification-based method. All in all, the five outlier detection methods mentioned above apply to categorical data indirectly. For the outlier detection experiments, Table 4 gives the optimum parameter settings for both KNN and CBLOF.
Optimal parameter for KNN and CBLOF on different data sets
Optimal parameter for KNN and CBLOF on different data sets
In the binary classification of machine learning, there is a difference between the predicted outcomes and the actual classification, so some classification evaluation metrics such as precision, recall, receiver operating characteristic (ROC) curve, area under curve (AUC), and F1-score are often employed to evaluate the classification ability of different methods. Outlier detection is essentially a binary problem, so we can use the ROC curve, AUC, and F1-score to measure the efficiency of the outlier detection algorithms. In outlier detection, most detection methods output an outlier factor for each object in U. When an object has an outlier factor greater than or equal to a given threshold, it is regarded as an outlier. Therefore, if the given threshold is too small, then some outliers will be regarded as inliers; likewise, if the threshold is too large, some inliers will be regarded as outliers. That is, the output objects are divided into 4 parts: outliers predicted as outliers (true outliers, TO), outliers predicted as inliers (false inliers, FI), inliers predicted as outliers (false outliers, FO), and inliers predicted as inliers (true inliers, TI).
Precision is the probability that samples predicted to be outliers are outliers. Recall denotes the possibility of outliers being indicated to be outliers. It requires a threshold t for the prediction probability when taking precision or recall as evaluation metrics. That is, an object is regarded as an outlier when the prediction probability is greater than the threshold t, and vice versa as an inlier. These two indicators are calculated by
The comparative experiments in this section are conducted on a computer with the Intel (R) core (TM) i5-8250U processor platform, 1.80 GHz frequency, and 8 GB of memory. The operating system is Windows 11. The experiments are performed in Python 3.8.
In this subsection, outlier detection is carried out for IAOF and the other five existing methods on the eight data sets mentioned above. Scatter diagrams, broken line graphs, and tables are presented as results to reflect the performance of different methods.
First, we calculate the outlier factors of each object in every data set and the judgment threshold μ by the process of IOAF. In turn, scatter diagrams are generated by taking an object’s serial number as the horizontal coordinate and the outlier factor as the vertical coordinate. In the diagrams, blue circles represent the true inliers, red-filled circles represent the true outliers, and the red dotted line stands for the judgment threshold μ. According to the IAOF, objects above the red dotted line are considered outliers, and objects below the red dotted line are considered inliers. It can be seen from Figs. 2(a)-(h) that IAOF detects well, where the method recognizes almost all true outliers in the Hayes, Monk, Voting, and Cancer data sets and about half of the true outliers in the Aust, Pima, and Mamm data sets. Although IAOF only recognizes a small part of the outliers in the Flare data set, it can be seen from Fig. 2(h) that almost all of the outliers in the data set were distributed in the middle and top of the scatter diagram, indicating that the outliers calculated by IAOF have relatively large outlier factors, which indirectly demonstrates the effectiveness of the method in the data set.
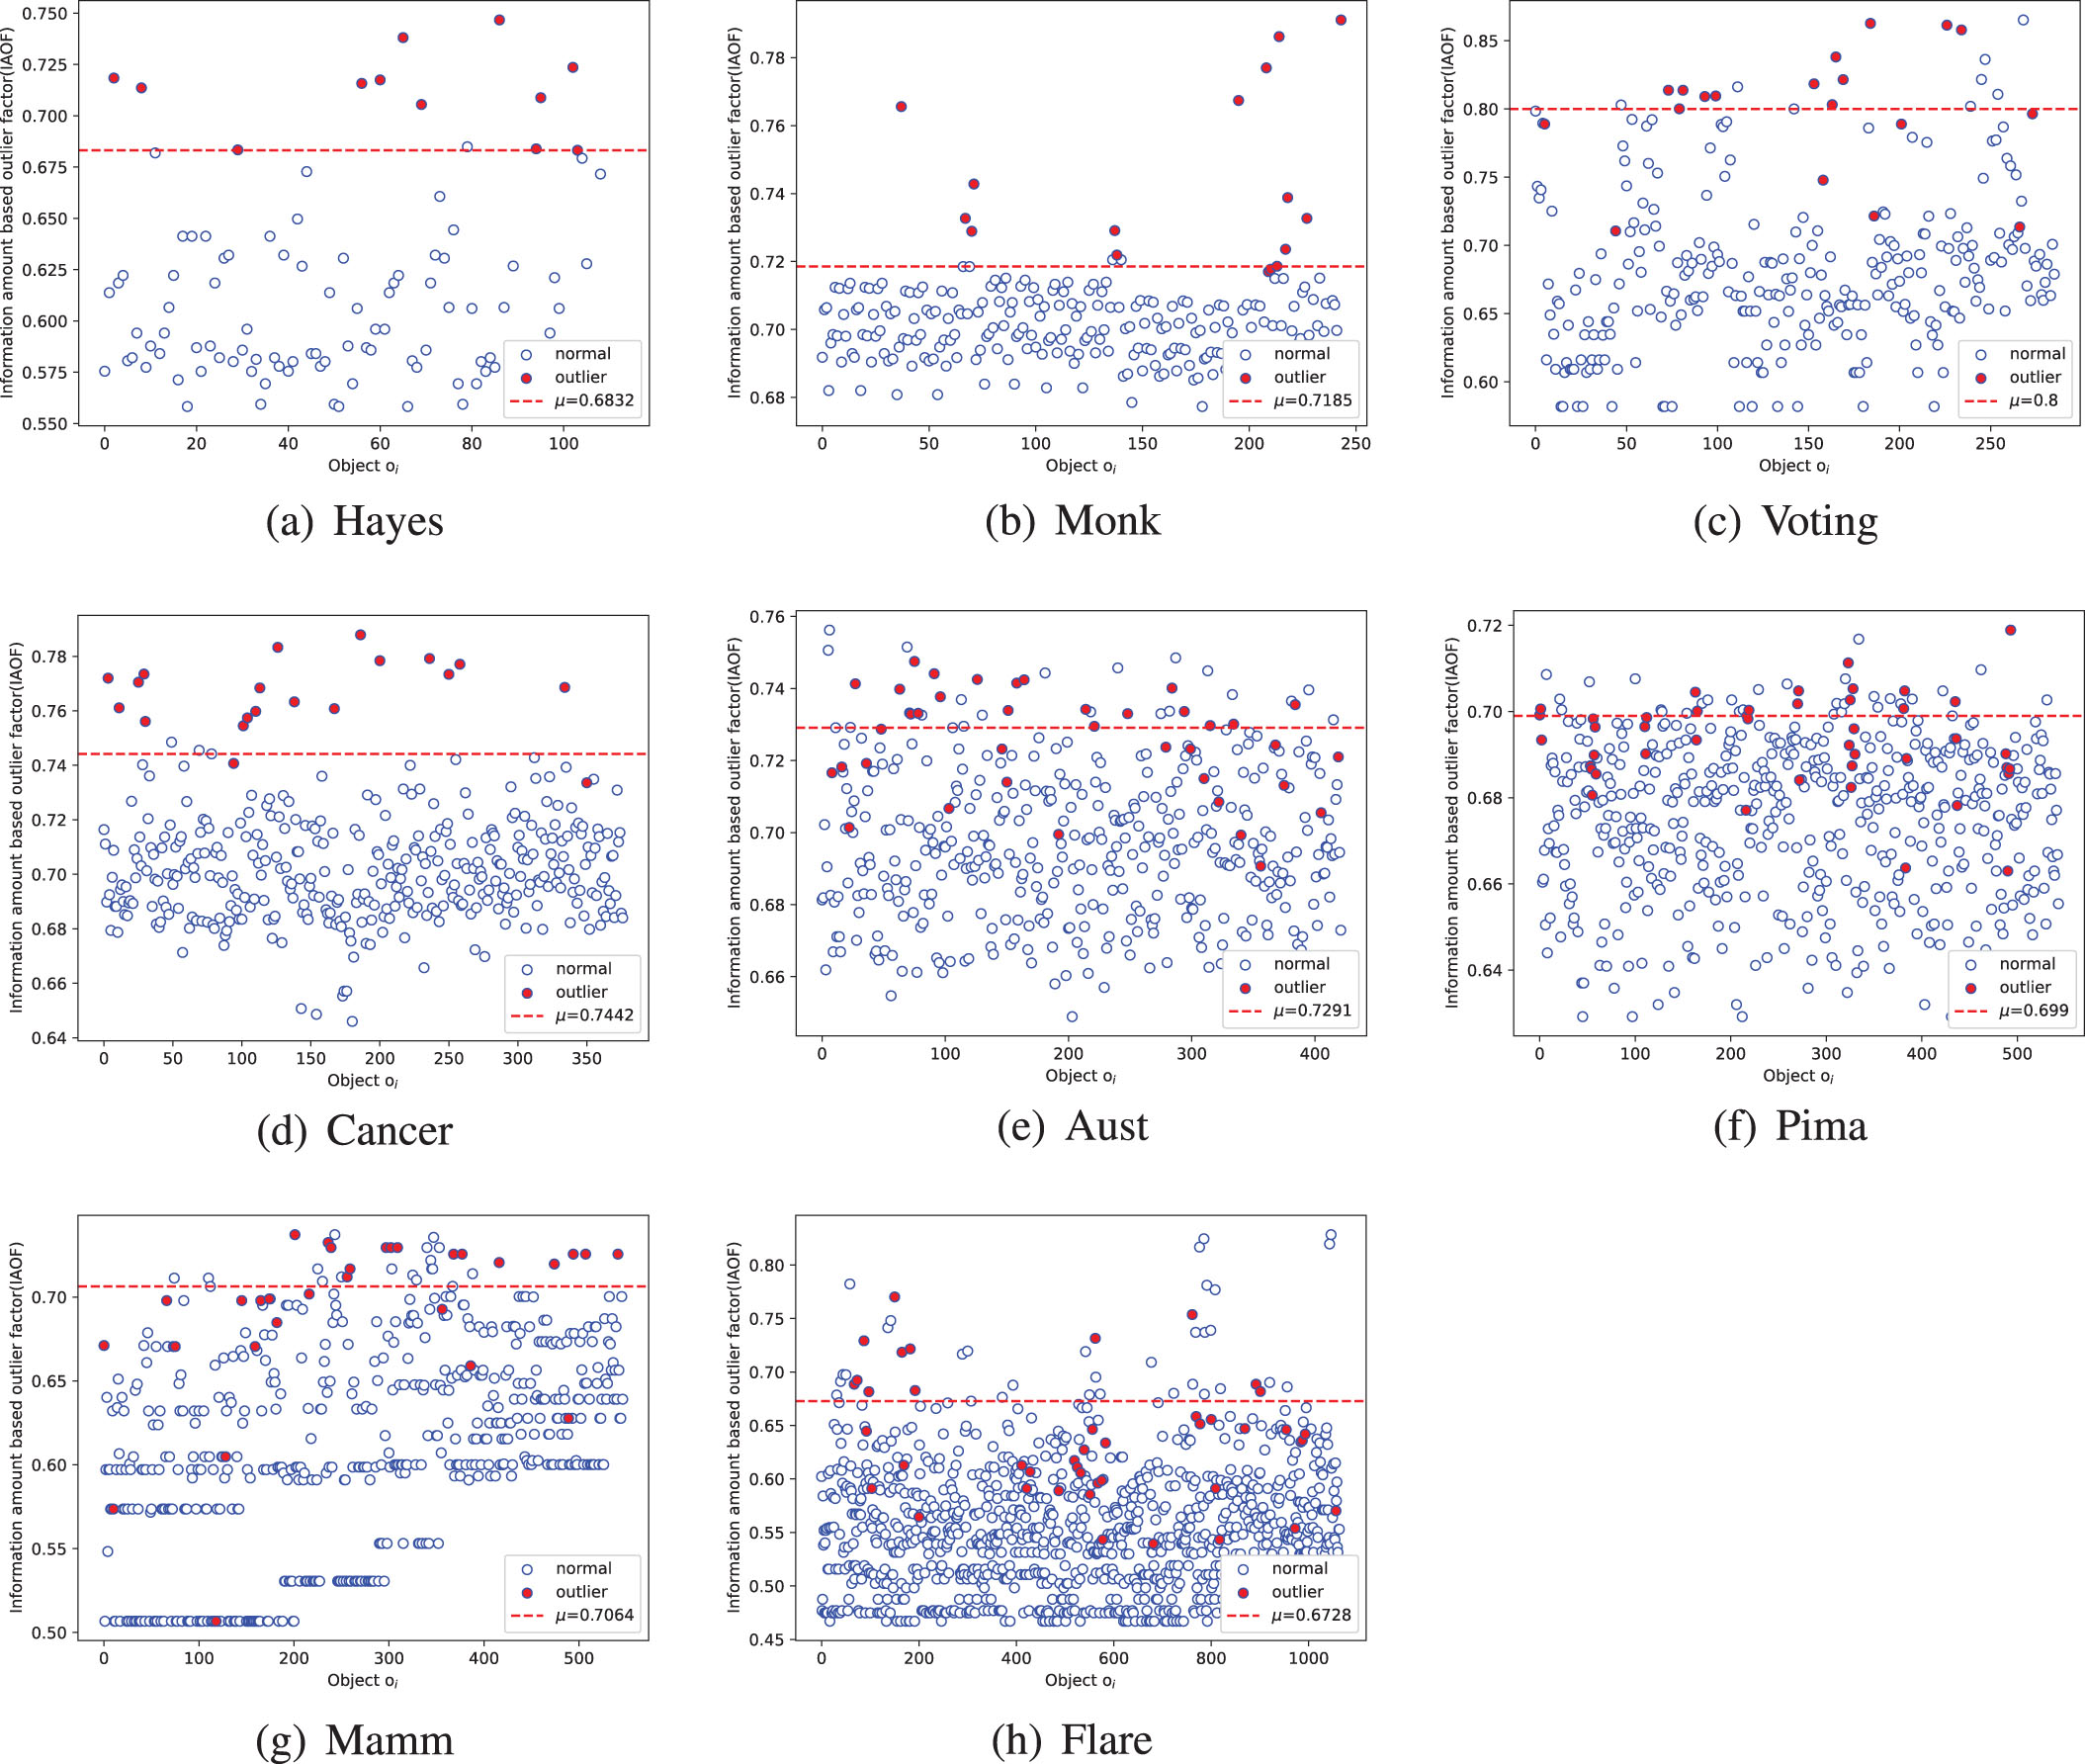
Outlier factor scatter diagrams of the data sets.
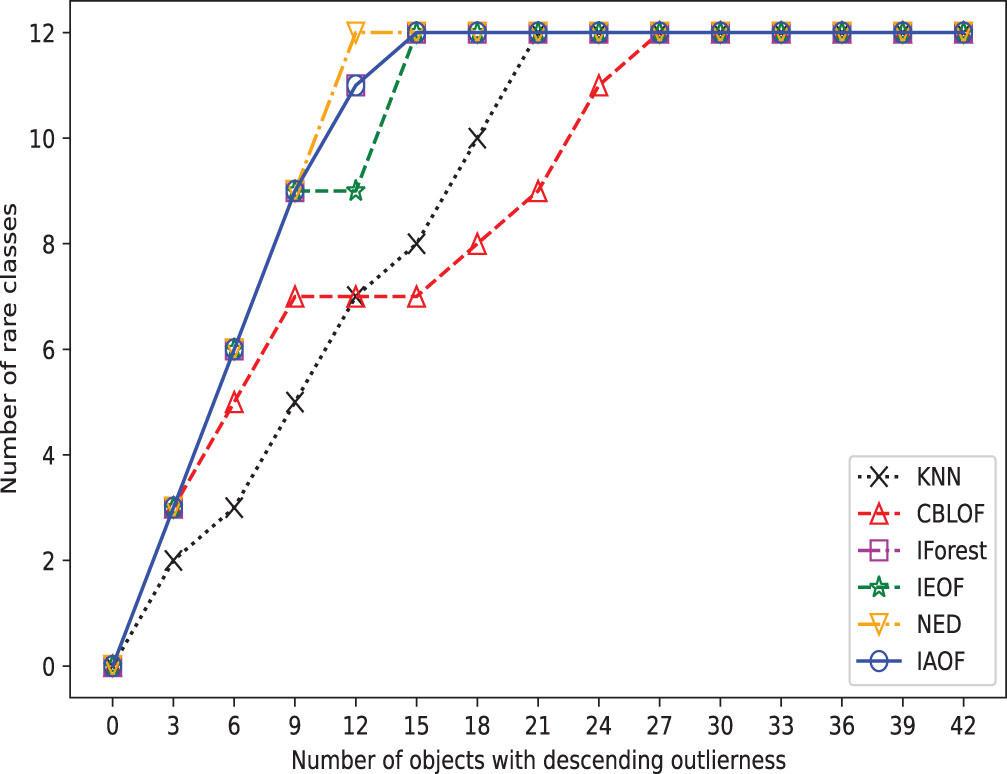
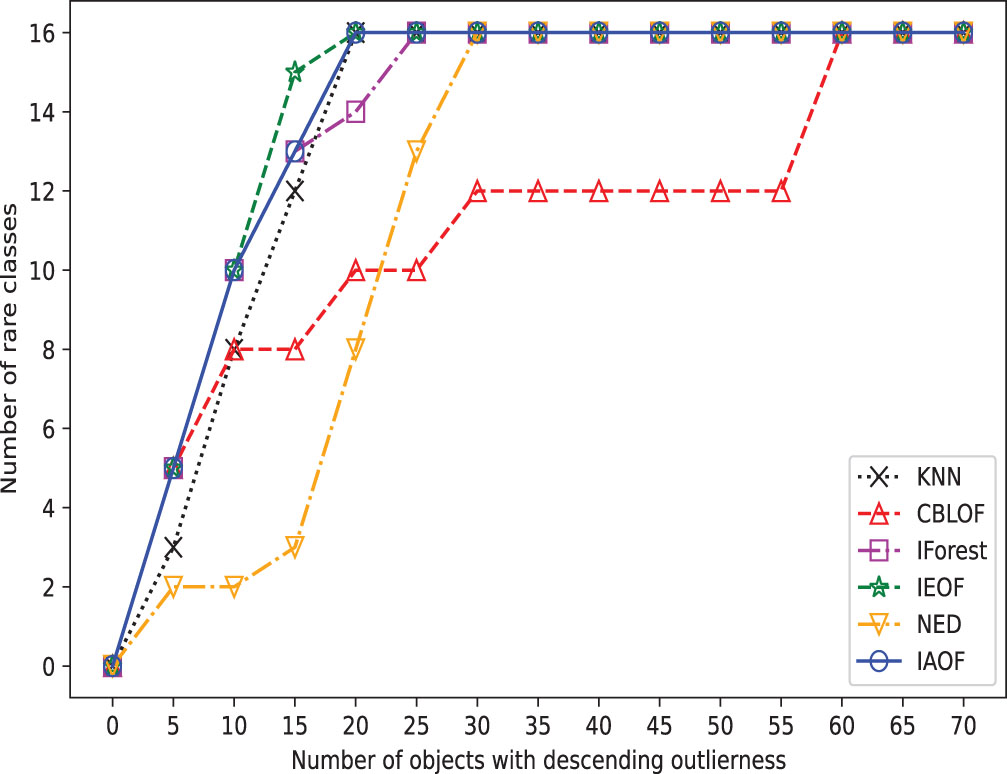
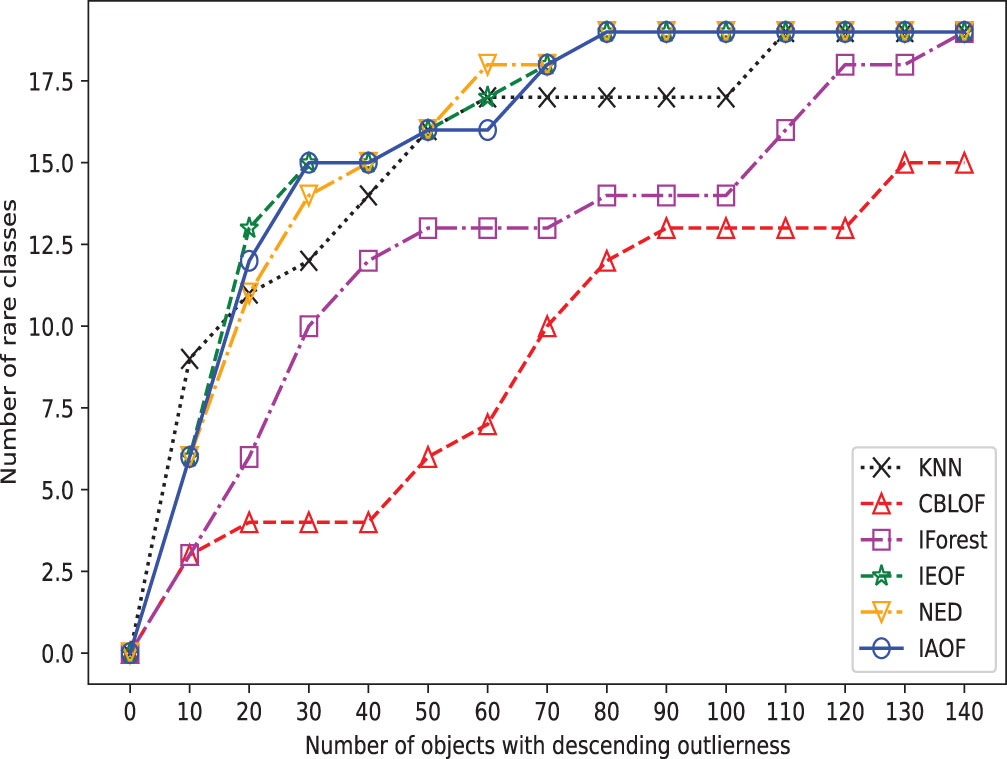
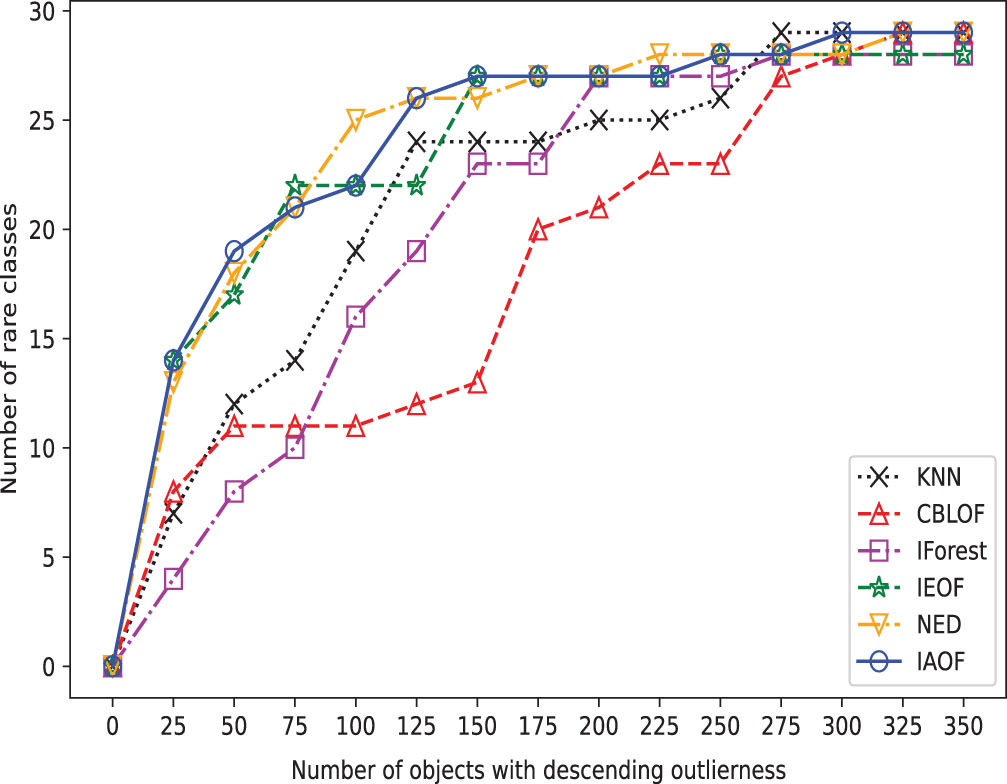
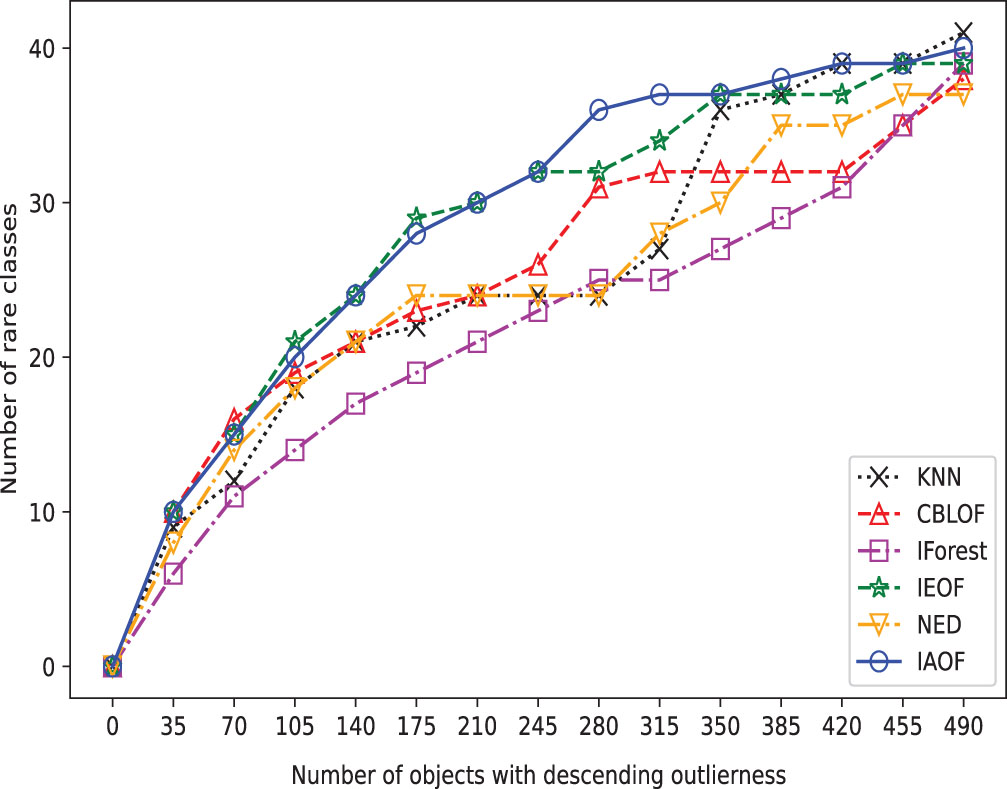
Furthermore, we perform outlier detection on every data set using the six methods. In real-world scenarios, identifying outliers in a dataset is generally difficult due to a lack of prior knowledge about the precise occurrences that differ greatly from the norm. These methods put all objects in descending or ascending order based on their determined “outlier factors,” and then consider the objects at the top of the sequence to be outliers. In detail, as shown in Figs. 3–10, if a detection method deems the objects at the top of the sequence as outliers and the number of objects in this part is “number of objects", then the proportion of objects in this part of the data set is “Top ratio”. In fact, only some of these objects are true outliers, and the number of real outliers is written as “Number of true outliers”, and the proportion of the currently successfully identified outliers to all true outliers in the data set is expressed as “outlier coverage”. In other words, a larger value of “Number of true outliers (outlier coverage)” indicates that the detection method is capable of detecting outliers more effectively. The maximum number of outliers identified successfully (outlier coverage) on each line is typed in bold characters in the table. According to Figs. 3–10, IAOF performs significantly better than KNN, CBLOF, IForest, and NED in terms of overall performance, and IAOF has a similar detection efficiency to IEOF. However, when the number of objects equals 15, 30, 45, 60, and 75 on the Aust data set, the outlier coverage of IEOF is slightly smaller than that of IAOF.
The broken line chart of outliers detected on Hayes.
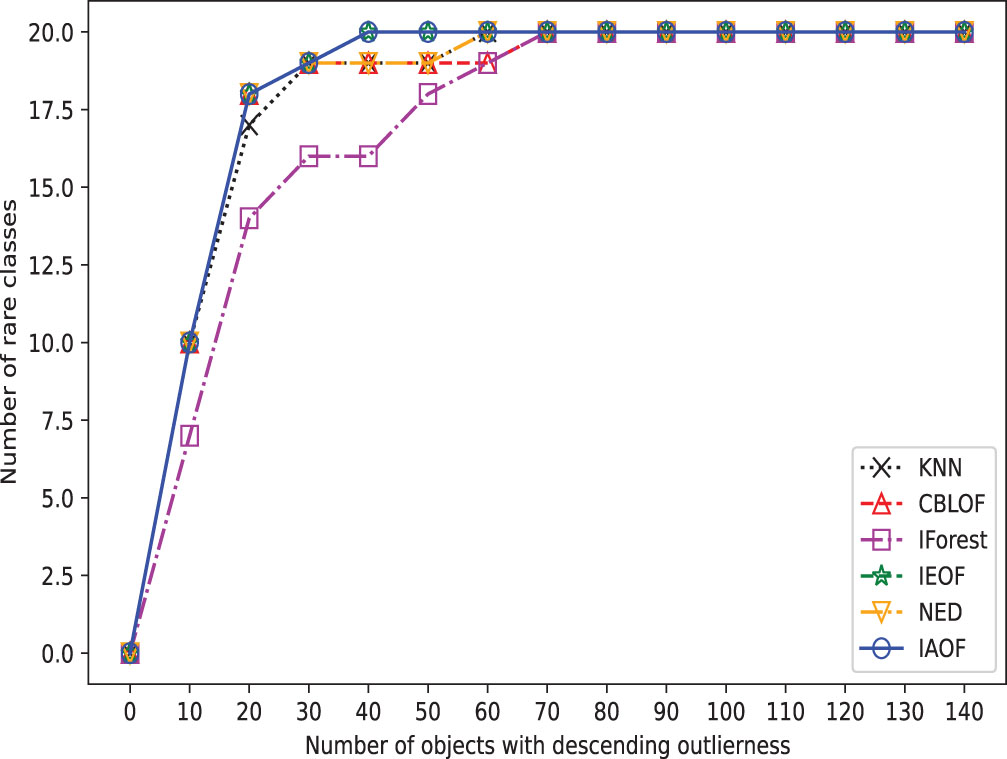
The broken line chart of outliers detected on Monk.
The broken line chart of outliers detected on Voting.
The broken line chart of outliers detected on Cancer.
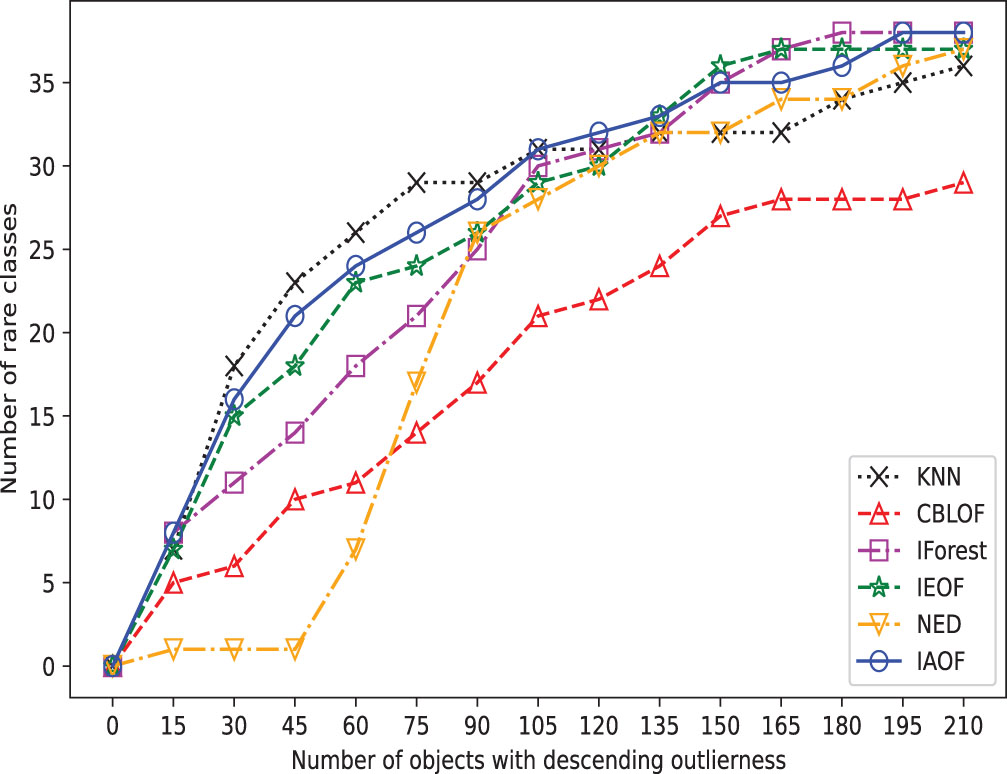
The broken line chart of outliers detected on Aust.
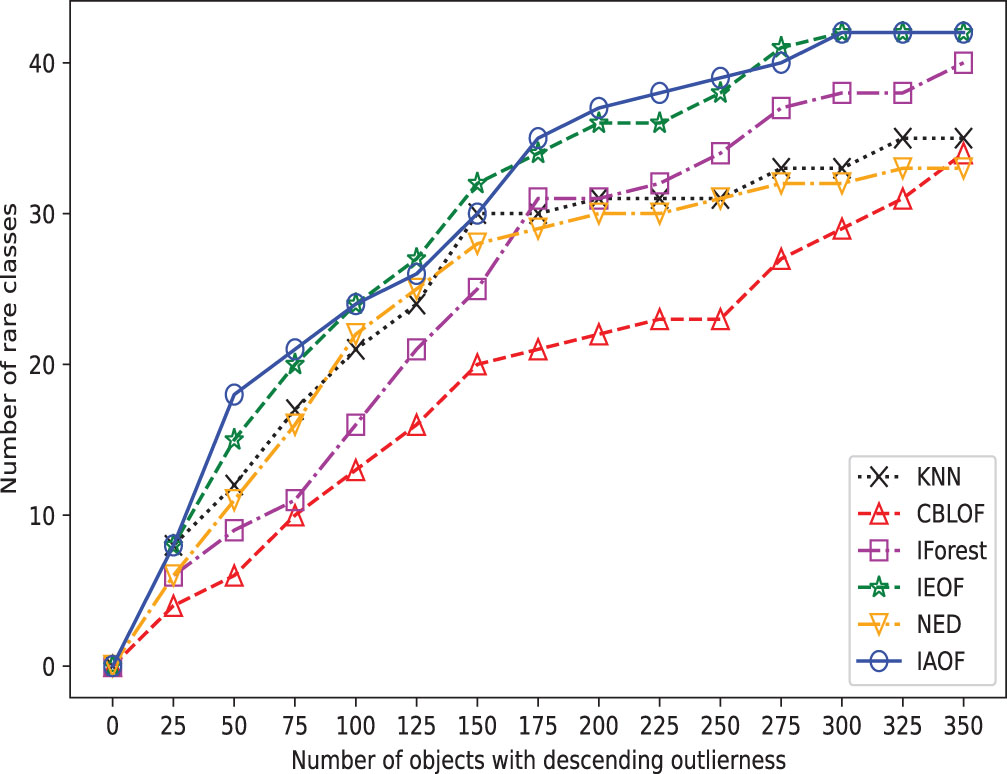
The broken line chart of outliers detected on Pima.
The broken line chart of outliers detected on Mamm.
The broken line chart of outliers detected on Flare.
In order to provide a concise overview of the detection effects of all methods, we generated broken line graphs using the experimental data. These graphs are depicted in Figs. 3–10. In most cases, except for Figs. 6 and 7, the broken line representing IAOF consistently surpasses the line representing KNN in terms of detection efficiency. This suggests that IAOF generally offers a superior degree of detection performance compared to KNN. Similarly, it can be observed from Figs. 3–10 that the performance of IAOF in detecting outliers surpasses that of CBLOF, IForest, and NED. The broken lines representing IAOF in Figs. 3, 4, and 6 almost overlap with those representing IEOF, while in Figs. 7, 8, and 9, the broken lines of IAOF are positioned above those representing IEOF. Consequently, it can be inferred that IAOF demonstrates slightly superior performance compared to IEOF.
Confusion matrix for outlier detection
Experimental results for different detection methods
In the preceding subsection, we examined the performance of IAOF and the other five methods in detecting outliers based on experimental results. The goal of this subsection is to compare the efficiency of IAOF and the other five methods using the classification evaluation indices stated above. The following is a summary of the key analysis:
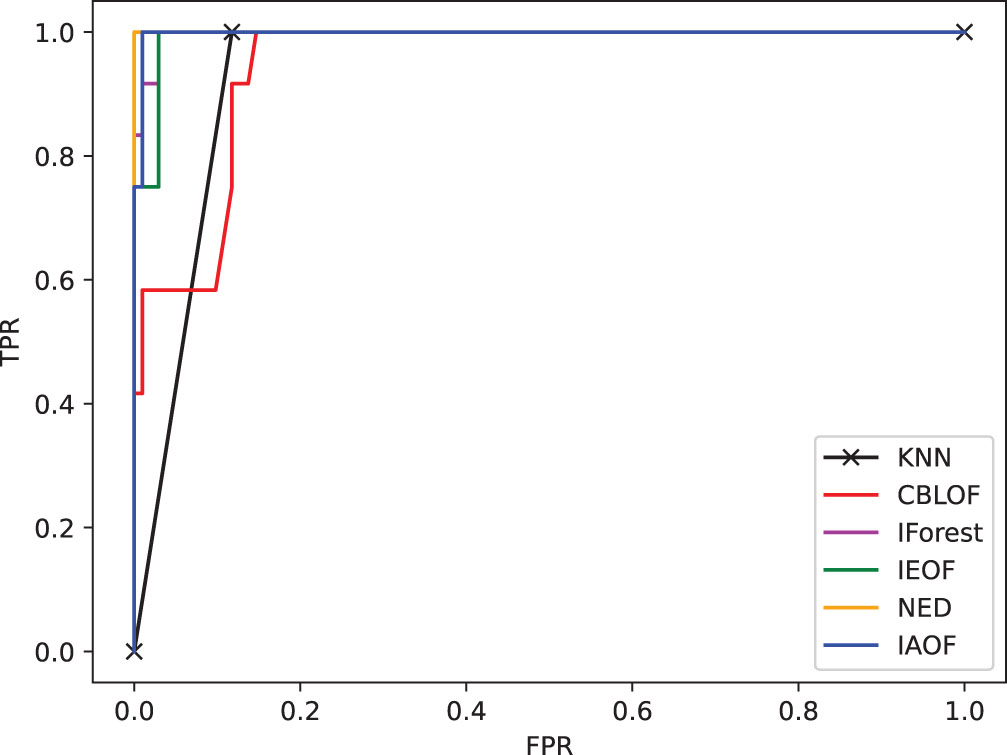
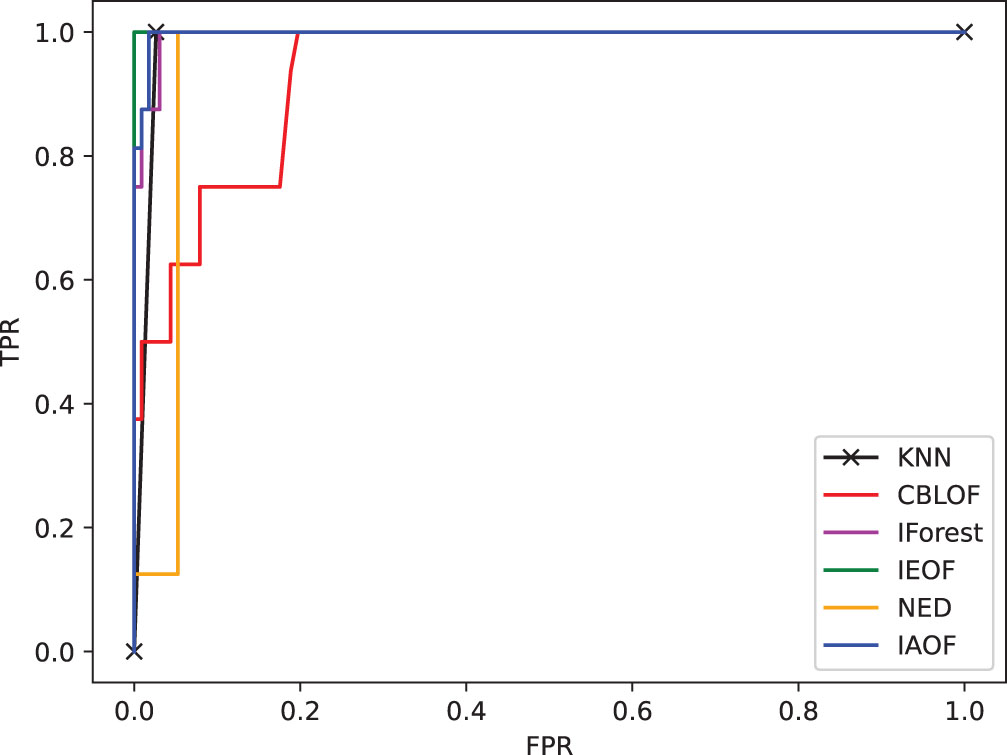
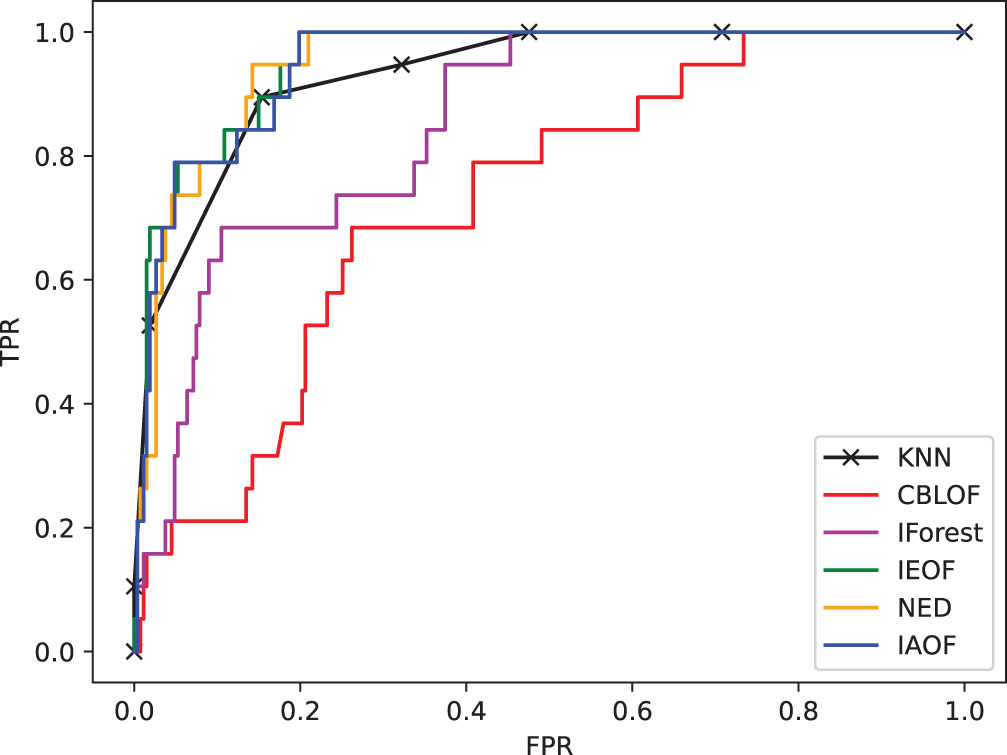
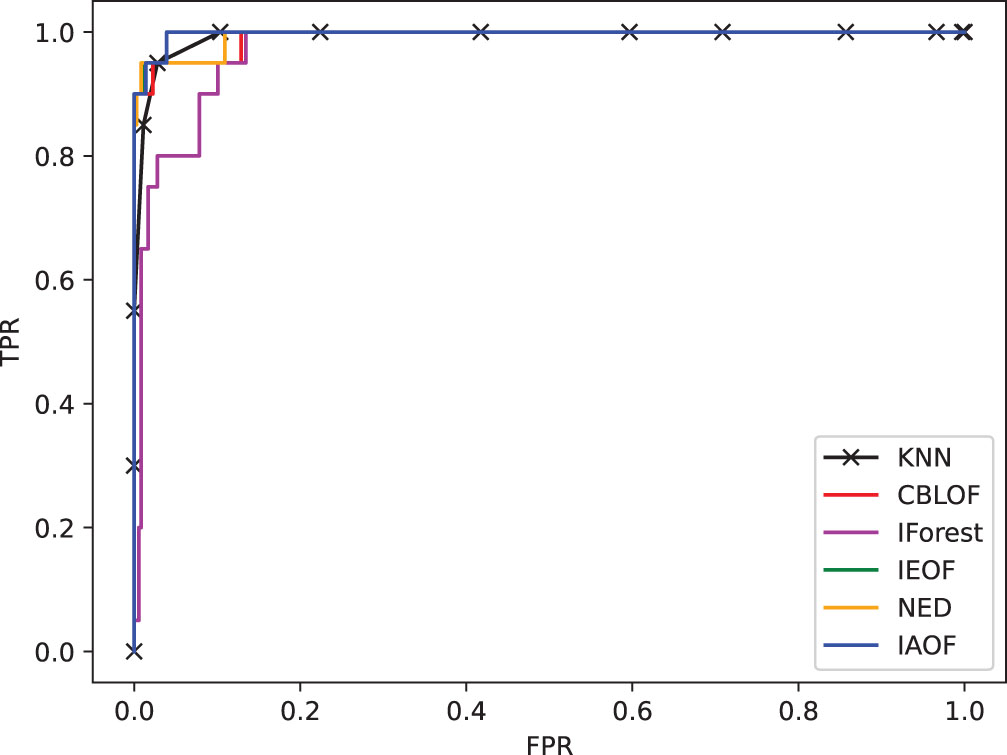
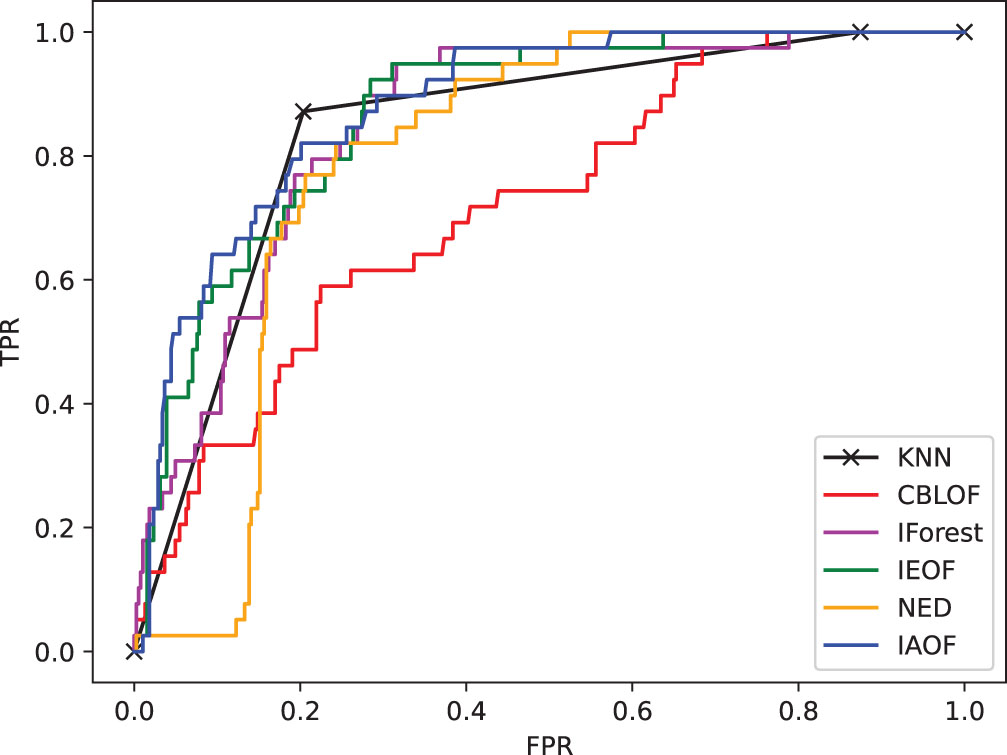
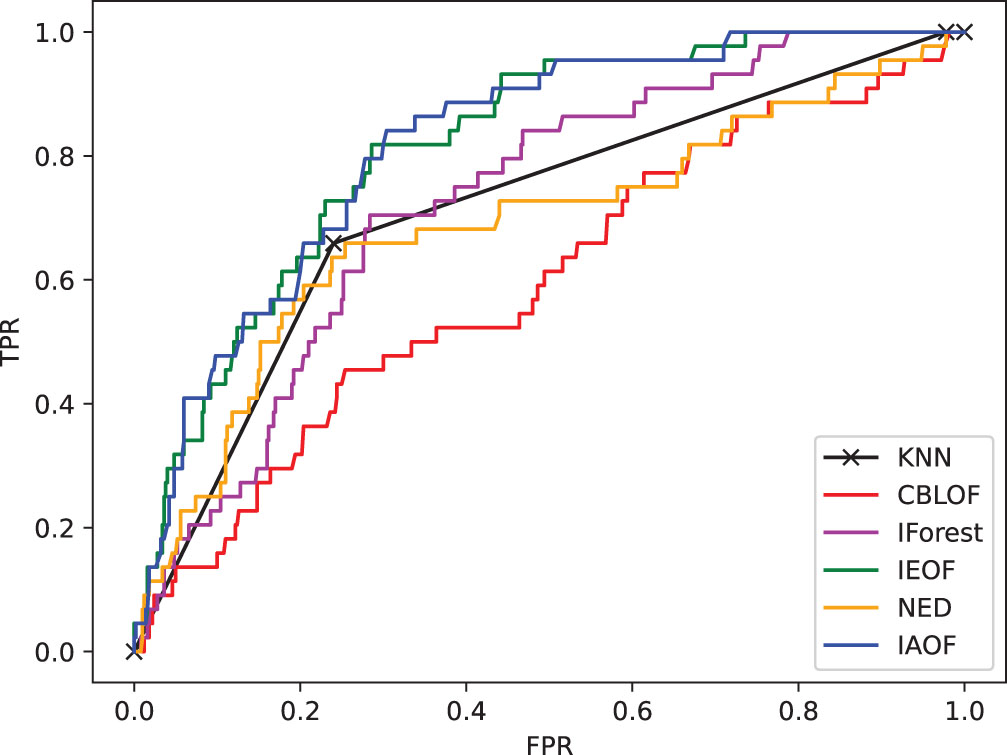
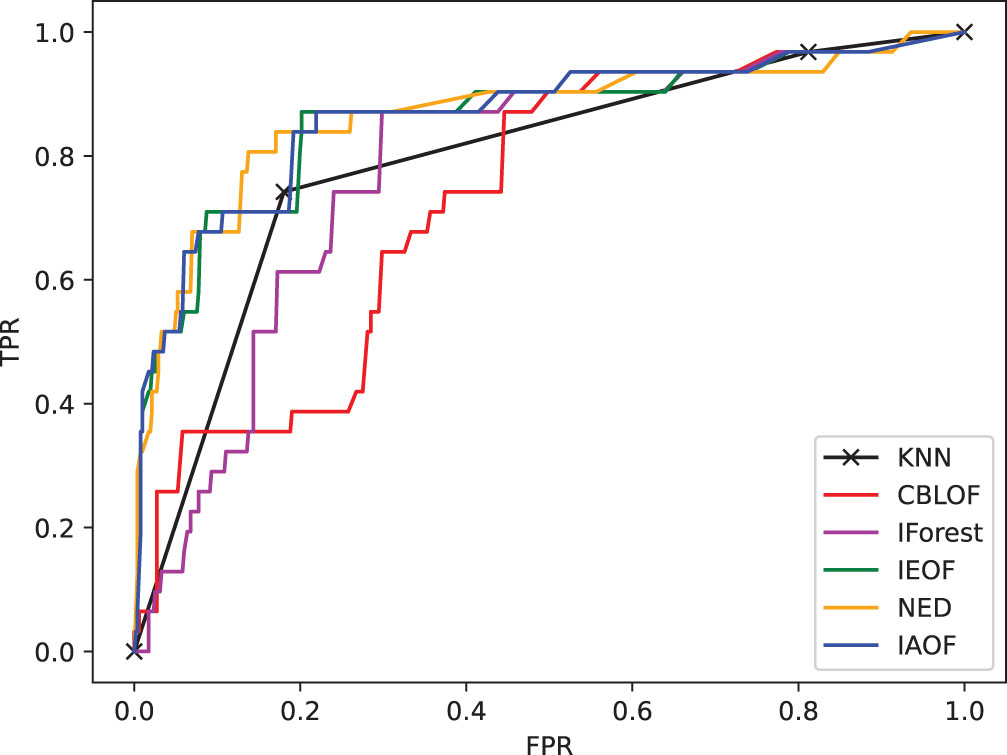
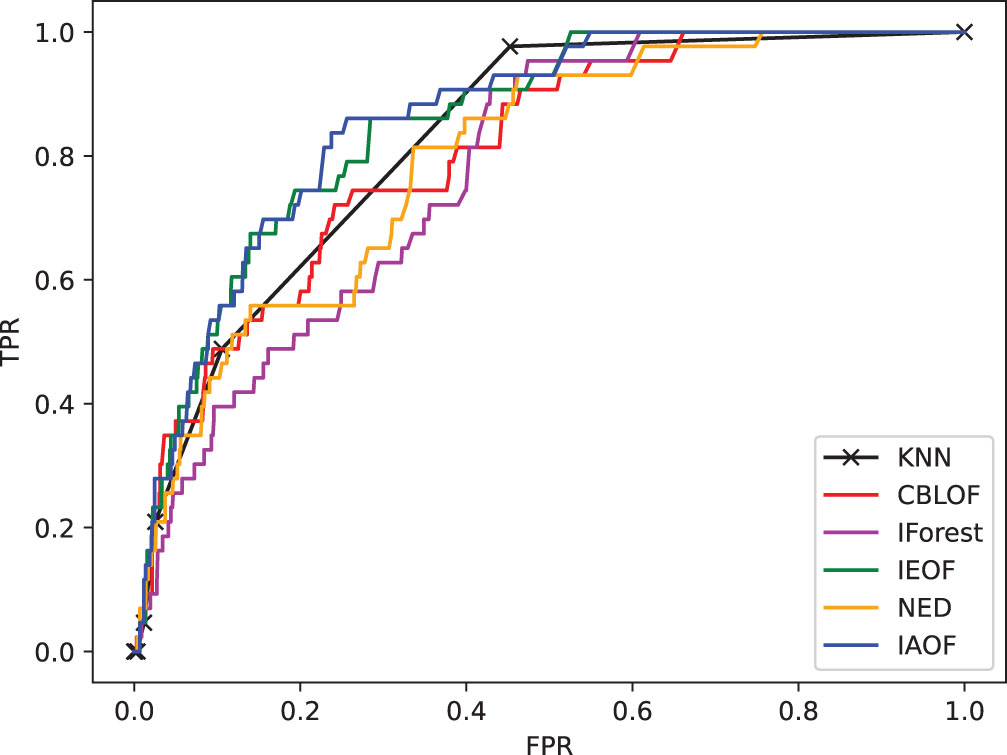
(1) From Figs. 11–18, we can also see the effectiveness of the IAOF algorithm more graphically. Figs. 15, 16, and 18 show the Aust, Pima, and Flare datasets. The IAOF algorithm is closest to the upper left corner of the first quadrant with the largest area under the curve for these datasets. On the other datasets, from Figs. 11–14 and 17, it can be observed that the IAOF is also very close to the upper-left corner of the first quadrant as compared to most of the methods. By calculating the area under each ROC curve, we get Table 7. From Table 7, we can see that the IAOF algorithm is ranked second in terms of area under its ROC curve on the Hayes, Monk, Voting, Cancer, and Mamm datasets.
The ROC curve on dataset Hayes.
The ROC curve on dataset Monk.
The ROC curve on dataset Voting.
The ROC curve on dataset Cancer.
The ROC curve on dataset Aust.
The ROC curve on dataset Pima.
The ROC curve on dataset Mamm.
The ROC curve on dataset Flare.
AUC results
(2) Table 9 sketches the variation of P (t), R (t), and F1-score with the value of t on different data sets. In all data sets except Hayes and Monk, IAOF produces the maximum average P (t) for a given t. Among the Cancer, Aust, Pima, Mamm, and Flare data sets, IAOF gets the maximum average R (t) and average F1-score, whereas they all rank second on the other data sets. For instance, on the Cancer data set, IAOF shares the same average P (t) with IEOF and NED, while the average P (t) of KNN, CBLOF, and IForest is 63.23%, 65.06%, and 52.53%, respectively. The average R (t) of the IAOF balances that of the IEOF; both get 87.14%, while the average R (t) of other methods are 83.57%, 84.29%, 72.86%, and 85%. The average F1-score of IAOF is equivalent to that of IEOF; both are 69.08%, while the average F1-scores of other methods are 65.81%, 67.16%, 56.27% and 67.81%, respectively.
Comparison results with precision, recall, and F1-score
In general, IAOF has superior detection performance compared to other methods when applied to the eight data sets. Consequently, IAOF can be efficiently employed for the purpose of detecting outliers in categorical information systems.
Since the three sets of indicator values (AUC, R (t), and F1-score) found in the previous subsection don’t follow a normal distribution, it is necessary to use a nonparametric test for multiple paired samples. This test aims to determine if there exists a statistically significant disparity between the values of the same indicator obtained from different methods. In essence, it seeks to ascertain whether there is a noteworthy variation in the detection efficacy across various methods.
The null hypothesis of the Friedman test, which is dependent on the Fisher test, is that there is barely any difference in rank across various algorithms. Let k be the number of outlier detection algorithms, n be the number of data sets, and c
i
be the average rank of the i-th algorithm on the n data sets, then the Friedman statistic commonly used is defined as
If the statistic F
F
is bigger than the critical value of F
α (k - 1, N - 1), it means the null hypothesis is rejected under the Friedman test. Then the Nemenyi test [9] for pairwise comparisons is used to further investigate which algorithm is superior in terms of statistics. The performance of the two algorithms will be very different if the average level of distance surpasses the critical distance CD
α, which is denoted as
By conducting tests on the index values of this experiment, one can derive the following conclusions based on Figs. 19–21.
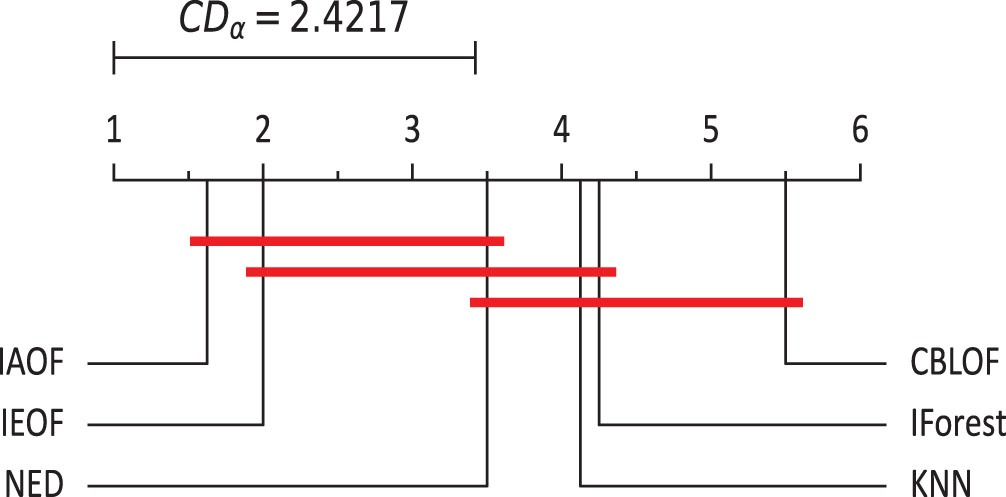
The Nemenyi test on AUC (α = 0.1).
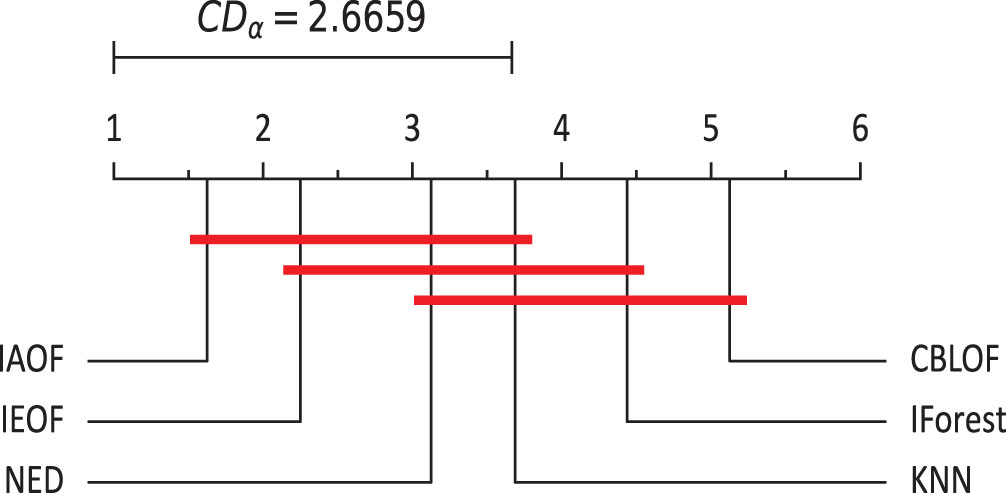
The Nemenyi test on R (t) (α = 0.05).
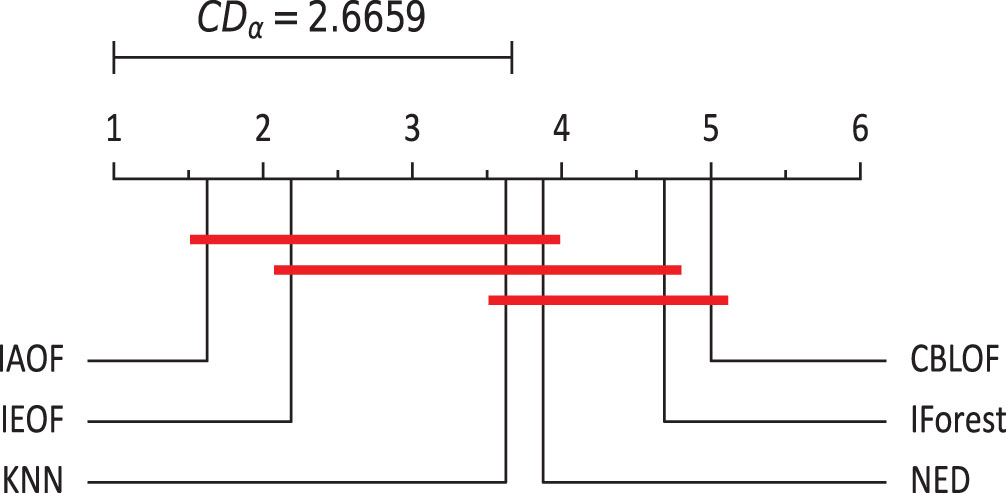
The Nemenyi test on F1-score (α = 0.05).
(1) IAOF has the greatest average rank in AUC values, indicating that it has the best outlier identification performance. Furthermore, when the significance level is taken at 10%, there are significant variations in the detection performance of IAOF and CBLOF, IAOF and KNN, and IAOF and IForest, whereas the other groups of methods have no significant differences.
(2) IAOF has the highest average rank in the values of R (t), indicating that the method has the highest recall rate for finding outliers. Furthermore, under the same experimental settings, the detection accuracy of IAOF is significantly greater than that of CBLOF and IForest, whereas the other groups of methods show no significant difference when the significance level is set at 0.05.
(3) IAOF has the greatest average rank in terms of the F1-score, indicating that this method is the best at predicting outliers and inliers. When the significance level is 0.05, the prediction effectiveness of IAOF is significantly higher than that of CBLOF and IForest, but not of the other methods.
This paper develops a novel and efficient IAOF method for identifying outliers, which is based on a thorough and rigorous theoretical framework and includes a real-world illustration of the various steps involved in outlier detection. The method finds outliers by using the information amount to calculate the degree of outlierness of an object, which is one of the uncertainty measures in rough set theory. There is no related research on the issue of outlier detection. IAOF can be used to identify outliers in both categorical and discretized numerical information systems. Using a collection of eight UCI standard datasets, we ran tests to evaluate and compare various existing outlier detection methods. The experiment results show that the suggested method is adaptable, works well, and could be useful in real life because it finds patterns more accurately in categorical datasets than other methods tested in the same conditions. IAOF expands the utilization of the information amount in measures of uncertainty and enriches the techniques for identifying outliers. Nevertheless, the method’s time cost and space complexity do not possess substantial advantages.
In the future, we will consider adopting other efficient attribute approximation methods to lower the time and space complexity of the process of IAOF in order to deal with outlier detection problems for high-dimensional data sets. What is more, applying the IAOF technique to outlier identification in other types of information systems, such as categorical information systems with missing values, numerical information systems with missing values, set-value information systems, and so on, is a future research area.
Footnotes
Acknowledgments
The authors would like to thank the editors and the anonymous reviewers for their valuable comments and suggestions, which have helped immensely in improving the quality of the paper. This work was supported by the project of Improving the Basic Scientific Research Ability of Young and Middle-aged Teachers in Guangxi Universities (2020KY14013) and the project of Natural Science Foundation of Guangxi (2020GXNSFAA159155, 2020GXNSFAA159061).