
Abstract
Cardiovascular disease is the leading cause of death and more than half million people were died around the world. However, cardiovascular health monitoring is crucial for effective heart disease diagnosis and management. In this paper, a novel deep learning-based YOLO-ECG model is proposed to ECG arrhythmia classification method for portable monitoring. Initially, the ECG signals are gathered using 12-lead electrodes in the real time and these signals are denoised using two-dimensional stationary wavelet transform (2D-SWT). In SWT, zeros are inserted between filter taps rather than decimal points to eliminate repetitions and increase robustness. The denoised ECG signals are fed into the deep learning-based YOLO network with Gaussian error linear unit (GELU) activation function for detecting the ECG abnormalities of arrythmia. ECG waveforms are analyzed for the local fractal dimension at each sample point before heartbeat waveforms are extracted within a set length window. A squeeze and excitation attention (SEAN) module is introduced in the YOLO network for selecting size of 1D convolution kernel, and the dimension is preserved during local cross-channel interactions, decrease network complexity and enhance model efficiency. The classification findings demonstrate that the proposed YOLO-ECG model performs better by ECG recordings from the MIT-BIH arrhythmia dataset. From the experimental analysis, the proposed YOLO-ECG model yields the overall accuracy of 99.16% for efficient classification of arrythmia ECG signals.
Introduction
A cardiac arrhythmia, also known as a cardiac rhythm disorder, affects 2.35% of adults worldwide and is responsible for 60% of cardiovascular deaths [1]. Although some arrhythmia is benign or isolated, insistent arrhythmias have the potential to damage organs, five times increase the risk of stroke, and potentially result in sudden cardiac death [2]. Thus, early electrocardiogram (ECG) signal detection and categorization are essential for identifying and treating arrhythmia in order to delay the onset of potentially fatal diseases [3]. An ECG analyzes the spatial chart of the heart’s time-varying electrical potentials by placing electrodes on the skin. ECG is a critical indicator signal for heart functioning analysis [4]. This ECG signal is generated by the human heart to initiate the cardiac cycle, which causes blood to circulate. Cardiovascular illnesses can be diagnosed by interpreting the ECG to indicate structural and functional abnormalities of the heart. ECG categorization into several disease groups is a challenging undertaking requiring identification of patterns [5, 6].
Computer-based ECG categorization has the potential to be an inexpensive tool for mass screening for cardiac problems and can reach high accuracy. The manual editing of long-term (24-hour) ECG recordings is necessary for the detection of aberrant heart beats [7]. Statistical analysis and mathematical models have enabled rapid automated recognition of abnormal ECG signals in recent decades [8]. Heart-rate variability, spectral examination, temporal frequency distribution, and non-linear signal processing methods are a few published approaches used to detect cardiac arrhythmia. As shown in Fig. 1, it is formed of the three fundamental elements P wave, QRS complex, and T wave.
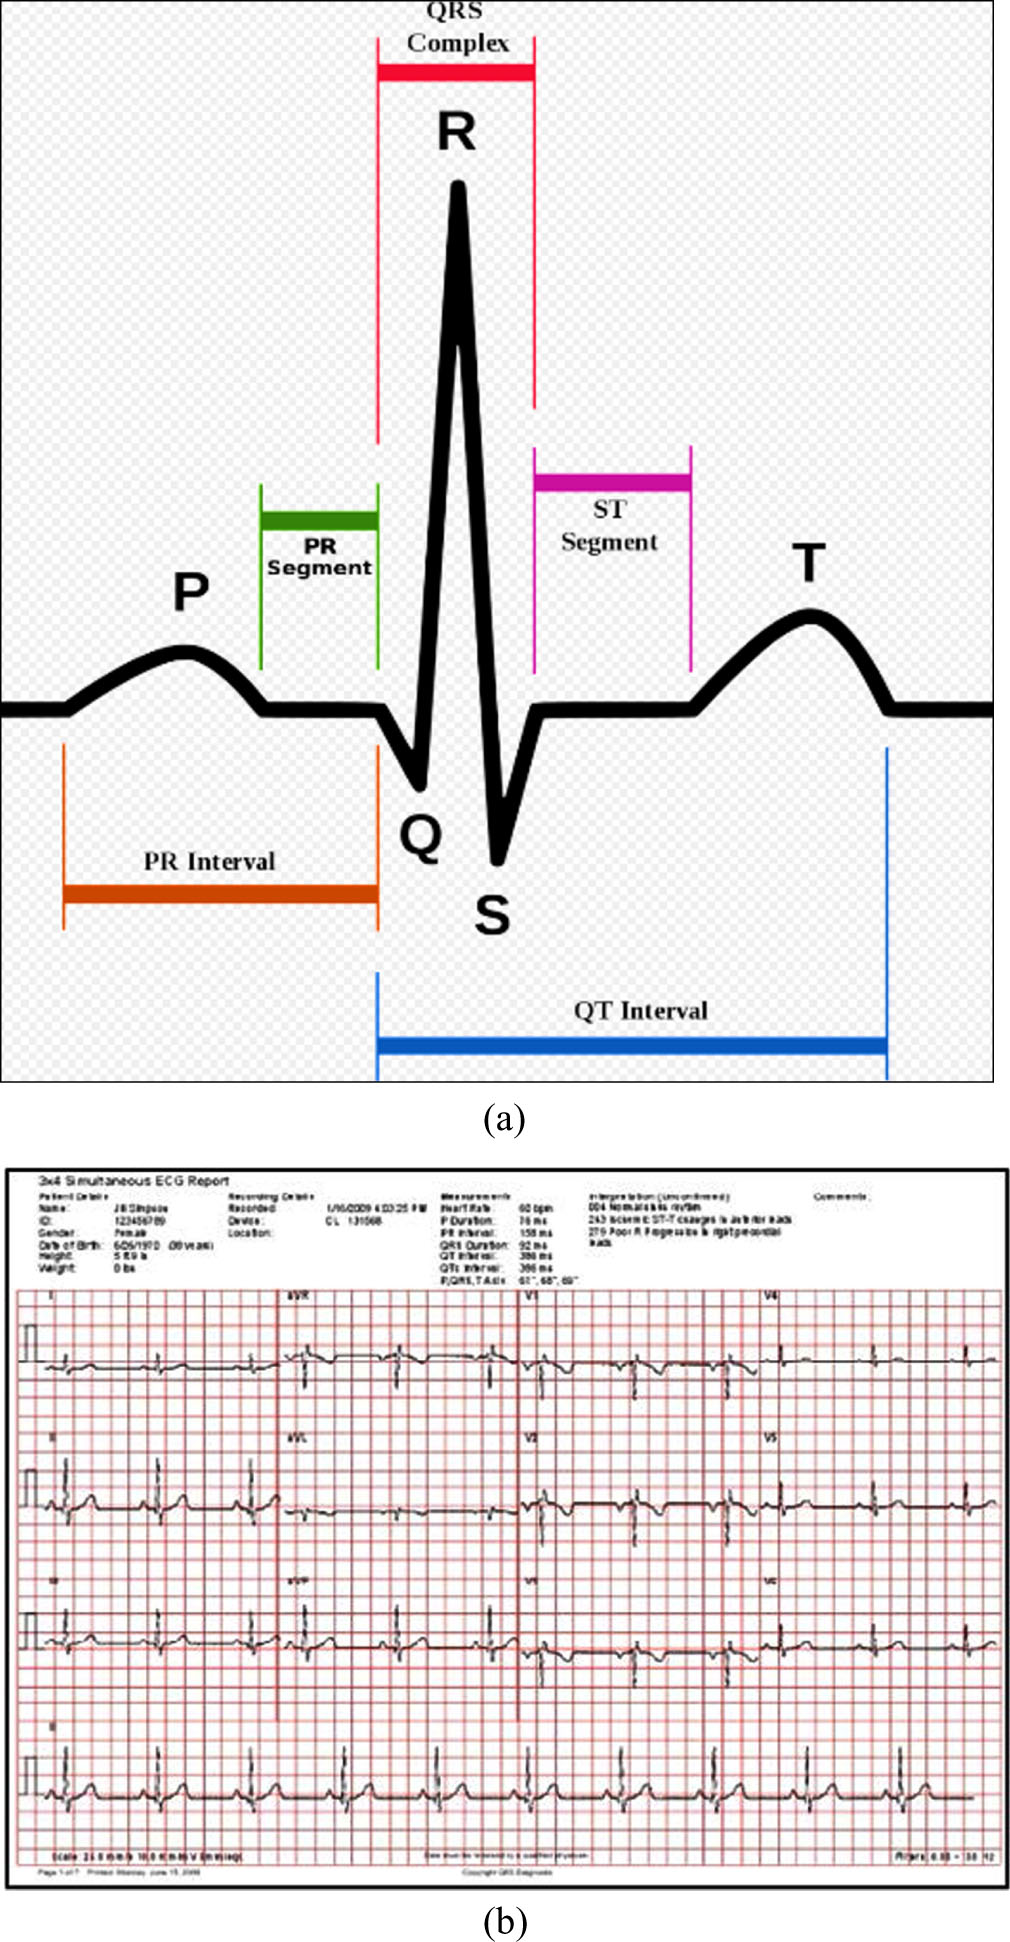
(a) ECG signal and its features (b) Sample ECG sheets for normal.
For categorization, traditional methods extract characteristics viz., the QRS complex, R-R intervals, and QRS frequency components [9, 10]. Additional techniques of computerized arrhythmia identification and classification use QRS template identical to identify ectopic beats by extracting a broad range of ECG variables, including as cross-correlation, frequency, and temporal properties of the QRS complex [11, 12]. ECG arrhythmia classification algorithms might sometimes incorrectly identify a normal rhythm as an arrhythmia (i.e., false positive) or arrhythmia as a normal rhythm (i.e., false negative). This can lead to unnecessary alarm or intervention, which can be distressing for patients and may result in additional medical tests and costs. False positives and false negatives can also create a burden on healthcare professionals who need to review and interpret ECG results, potentially leading to unnecessary follow-up procedures or treatments. These cases motivated us to work on this domain for accurate and efficient classification of arrhythmia using deep learning structure. The main contributions of the research work are summarized as follows;
This work presents a novel YOLO-ECG model for efficient categorization of ECG signals for the identification of arrythmia abnormalities.
Initially, the ECG signals are gathered using 12-lead electrodes in the real time and these signals are denoised using 2D-SWT to eliminate repetitions and increase robustness.
The time domain signals of ECG with four types of ECG beats are categorized based on their forms: normal beats (N), left bundle branch block beats (LB), right bundle branch beats (RB), ventricular premature beats (VP), and atrial premature beats (AP).
The efficacy of the proposed YOLO-ECG model has been evaluated using network metrics like accuracy, specificity, precision, recall and F1 score.
The rest of the paper was pre-structured as follows. Section-2 precises with the literature survey, Section-3 includes the detailed description of the proposed YOLO-ECG model for ECG classification, Section-4 encompasses with experimental results and discussion and lastly Section-5 encircles with conclusion and future work.
Researchers have proposed several ECG signal classification strategies for arrythmia in recent years. This section provides a brief overview of several recent machine and deep learning studies on this classification of different arrythmia signals.
In 2019 Huang., et al., [16] had established a deep convolutional neural network (DCNN) based algorithm for classifying ECG arrhythmias on a two-dimensional (2D) array. ECG spectrograms from the five different arrhythmia categories were used as input for the 2D-CNN for identifying and classifying the ECG arrhythmia types. According to the categorization findings, the suggested 2D-CNN system achieved an accuracy of 99% with ECG data from the MIT-BIH arrhythmia database. In 2D-CNN, the majority of signal characteristics are intra-component patterns rather than inter-component behaviors.
In 2019 Dang et al. [17] developed the deep CNN-BLSTM framework for identifying atrial beats with the ECG signals. Four convolutional layers, including two Bi-LSTM layers and two fully-connected layers, make up the majority of the framework. The aforementioned model provides datasets of RR intervals and P-QRS-T waves. This method performed well in the training and testing sets of set A, with accuracy values of 99.94% and 98.63%, respectively, but there is an issue with overfitting.
In 2020 Hwang., et al., [14] had devised a simple YOLO-based arrhythmia detection system. A long-duration ECG recording was simultaneously categorised as an arrhythmia and each heartbeat detected. The model exchanges the 2DCNN with 1DCNN and the bounding boxes with a bounding window when using raw ECG signals. As a result of the bounding window, many different types of arrhythmias can be predicted with different window lengths. Thus, the model can determine the ideal heartbeat window size for identifying arrhythmias. Due to its dependence on attention module, the accuracy of the suggested model decreases.
In 2020 Atal, and Singh [15] had designed an optimization based deep CNN algorithm for automatically classifying arrhythmias. Bat-Rider optimization algorithm (BaROA) was developed by combining the MOBA and ROA algorithms. DCNN-based BaROA classifiers classify the ECG signals based on their arrhythmia or no-arrhythmia status. This methodology was examined using MIT-BIH Arrhythmia Database with an accuracy of 93.19%, since the accuracy level was low in classification.
In 2020 Arumugam and Sangaiah [18] proposed three phases of scrutiny: (1) ECG noise destruction; (2) R-R and P-R intervals extraction from the ECG signals; and (3) ECG categorization. The suggested method used a specific wavelet design to precisely pinpoint the P, Q, R, S, and T sub-wave positions and amplitudes in the ECG data. The energy points of the ECG signal are at a decomposition level, according to experimental fallouts of the MIT-BIH dataset. In the ECG examination, the suggested methodology yields a positive predictive value of 95.92%. This model yields low accuracy on small data.
In 2021 Sharma, et al., [19] have presented an effective hybridized method for the categorization of ECG samples into significant arrhythmia classes to identify irregular heartbeats. In order to choose the most pertinent collection of features, the feature vectors of the QRS complex were normalized using the cuckoo search (CS) optimizer further pre-processing the signals with discrete wavelet transform (DWT). In order to propose the variation DWT, CS, Support vector machine-feed forward back-propagation neural network (SVM-FFBPNN) for categorizing signals into different classes. An optimized feature vector using the CS optimization technique and the SVM-FFBPNN attain accurate heart rate determination with 98.3% accuracy. This method requires a large amount of data to train in comparison to methods.
In 2022 Jamil, and Rahman [13] developed a new method for categorizing ECG data into 16 types of arrhythmias based on deep learning. ECG data is first preprocessed, and then transformed into a 2D signal with the continuous wavelet transform (CWT). A D-CNN offers the time-frequency domain illustration of the CWT with an attention block for extracting the spatial features vector (SFV). In order for the classifier to categorize the arrhythmia class, the reduced feature vector (RFV) was obtained through k-fold cross-validation with 99.84% accuracy. This model working on limited data but the time consumption was high.
In 2022 Madan, et al., [20] developed a hybrid deep learning-based solution for the detection and classification. Initially the denoising and extracting features were automated by converting the 1DECG data into 2D scalogram images. Afterwards, using experimental data, a hybrid model named 2D-CNN-LSTM was suggested by combining two learning models, namely the 2DCNN and the LSTM network. The comprehensive experimental research was carried out with MIT-BIH dataset for evaluating the efficiency of the 2D-CNN-LSTM method yields an average sensitivity of 98.33%. The suggested model lacks the accuracy in the detection of some signals.
From the literature survey, physical feature extraction and classification are time-consuming processes, which hinder the efficacy of the current approaches. There are numerous types of arrhythmias, ranging from relatively common ones like atrial fibrillation to rare and complex arrhythmias. There are some arrhythmias that have subtle or intermittent ECG changes which was difficult to detect, especially the ECG recordings are noisy. It is difficult to develop some deep learning algorithm for recognizing each type of ECG since each exhibits different ECG patterns. The majority of the studies mentioned above rely on ECG signals as input, which lowers performance rates. The development of automatic signal decomposition and categorization is necessary to address the aforementioned challenges. In this work, 2D SWT is used to denoised the ECG data, thereby improving the classification accuracy with the advanced deep learning YOLO structure.
Proposed methodology
In this section, a novel YOLO-ECG model for efficient classification of ECG signals for the identification of arrythmia abnormalities. The overall schematic representation of the proposed methodology is displayed in Fig. 2.
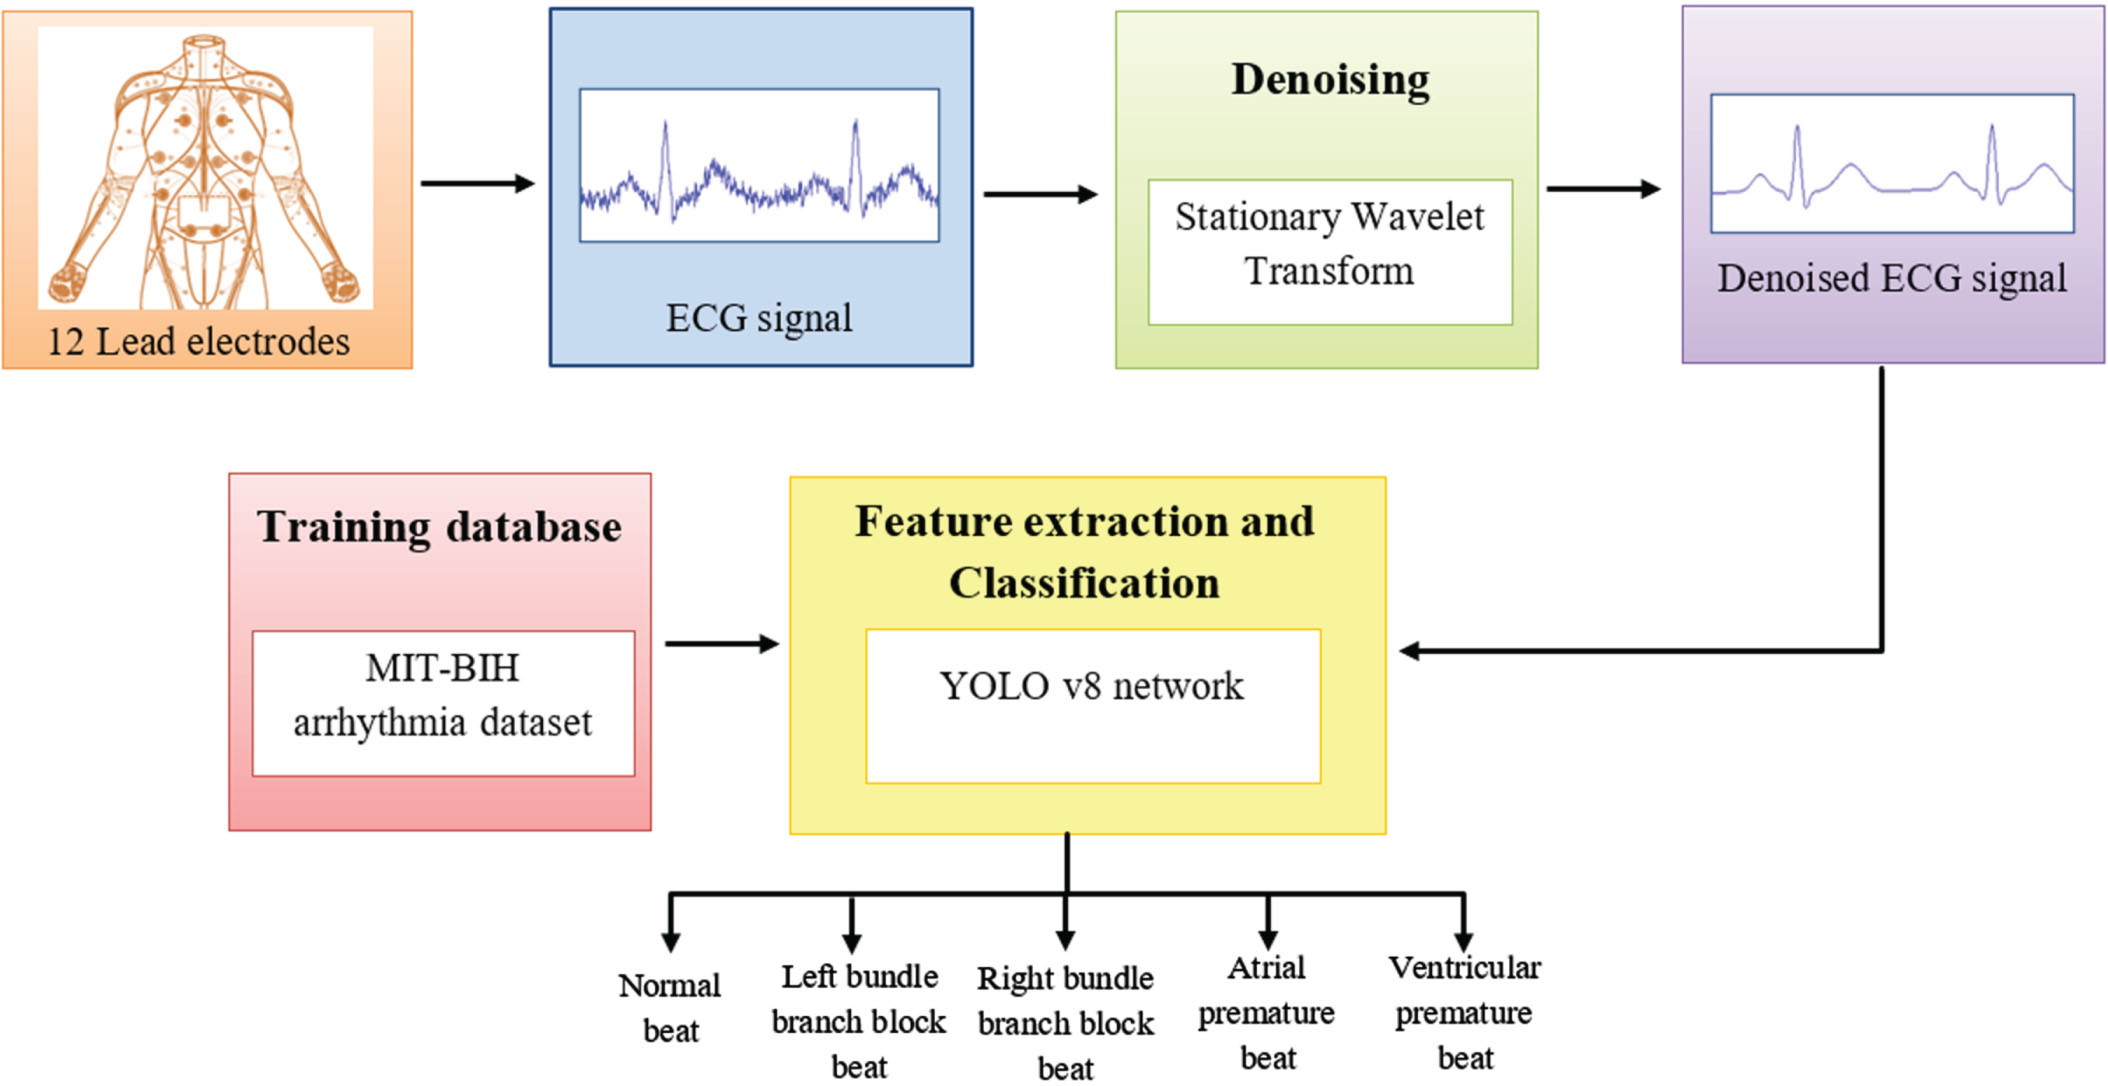
Schematic representation of proposed methodology.
This study utilizes the MIT-BIH Arrhythmia Database, which can be accessed on the Physionet website. In the database, 45 segments were atrial premature beats (AP), 171 segments were ventricular premature beats (VP), 2316 segments were normal beats (N), 240 segments were right bundle branch block beats (RB), 219 segments were left bundle branch blocks (LB), and 2316 segments were normal beats (N). A sample frequency of 360 Hz was used for recording the data using two leads. For the proposed algorithm, the waveform is divided into segments with 200 samples each. A fixed-length frame was used to extract the cardiac waveform around the maximal peak of the R-R interval. P and T waves are recovered with a window 50 samples before and 150 samples after the R-peak position. This temporal alignment of QRS waveforms is not necessary. There are differences in the average power and baseline of the ECG signals from different individuals. A normalization process is conducted before further processing to account for these impacts.
QRS duration prediction
In the DTW technique, QRS boundaries are identified by matching the on-set and off-set of each QRS in the template to the raw heartbeats. This leads to the QRS boundaries being established simultaneously with the pure ECG heartbeat acquisition. The predicted QRS duration for the chest-ECG is based on another point on the body instead of the chest. It is essential for calibrating the chest-ECG QRS period estimates in order to obtain the typical Heart-ECG QRS duration values. The proposed approach is equitably calibrated by learning the bias item through a straightforward linear regression approach.
Signal denoising
Post-processing is required to eliminate numerous abnormalities of the heartbeat. The stationary wavelet transform (SWT) addresses the lack of translation invariance in the DWT. The high pass and low pass filters produce sequences that are equal in length at each level. Due to its time-invariant properties, SWT preserves the precise sequential traits at each level of decomposition as the raw ECG signal. In SWT, zeros are inserted between filter taps rather than decimal points to eliminate repetitions and increase robustness. The input ECG signal (I) index set is measured as 2D [x, y] , I [x, y] portrays the xth column and yth row pixel.
SWT perform first level 2D-SWT on the ECG signal to obtain approximation coefficient (LL), vertical coefficient (LH), horizontal coefficient (HL), diagonal coefficient (HH) respectively. Two wavelet sub bands are extracted from the ECG signal by 2D-SWT corresponding to each sub band constant of the wavelet transform. The detailed and approximation coefficients of the 2D-SWT is signified as:
Where Ci,j and di,j signify approximation and detailed coefficients respectively. After 2DSWT decomposition, the concatenation of the four subbands always has the same size as the ECG signal at the source input.
The YOLO-ECG network receives the denoised ECG signals as input. It is an QRS complex detection network with quick detection times, high precision, and simple deployment and training capabilities. The input network, backbone network, squeeze and excitation reasoning attention networks, and detection layer are the four components that make up the proposed YOLO-ECG model. To detect the object, the YOLO ideally balances speed and precision.
A backbone of YOLO is composed of three components: the Efficient Layer Aggregation Network (ELAN), the Max-pooling (MP) structure, and the Gaussian Error Linear Unit (GELU) activation function. Controlling deeper networks with gradient paths can enable the ELAN structure to learn and converge successfully. Several kinds of convolutions are used to create the ELAN structure. During the convolution layer, the Squeeze and Excitation Attention (SEAN) Module is utilized. An adaptive SEAN module selects the size of the 1D convolutional filter, and the dimension is preserved during local cross-channel interactions, by lessening network complexity and optimizing model efficiency.
Figure 3 depicts the proposed YOLO-ECG model in broad strokes. The 36 grids that make up the ECG segments from the denoised signals each forecast two boundary windows. As a result, for each 12-second ECG segment, 72 bounding windows are predicted together with their positions and confidence scores. The majority of the bounding windows received low confidence scores, indicating that are frequently mistaken for backgrounds. The bounding windows that have ECG beats, were our primary interest. By sorting the bounding windows from high to low by their confidence scores, by eliminating those with poor values. A window with a confidence score below the predetermined level is removed. The bounding windows with the highest confidence score are retained, and multiple bounding windows displaying the same heartbeat are eliminated using non-maximum suppression.
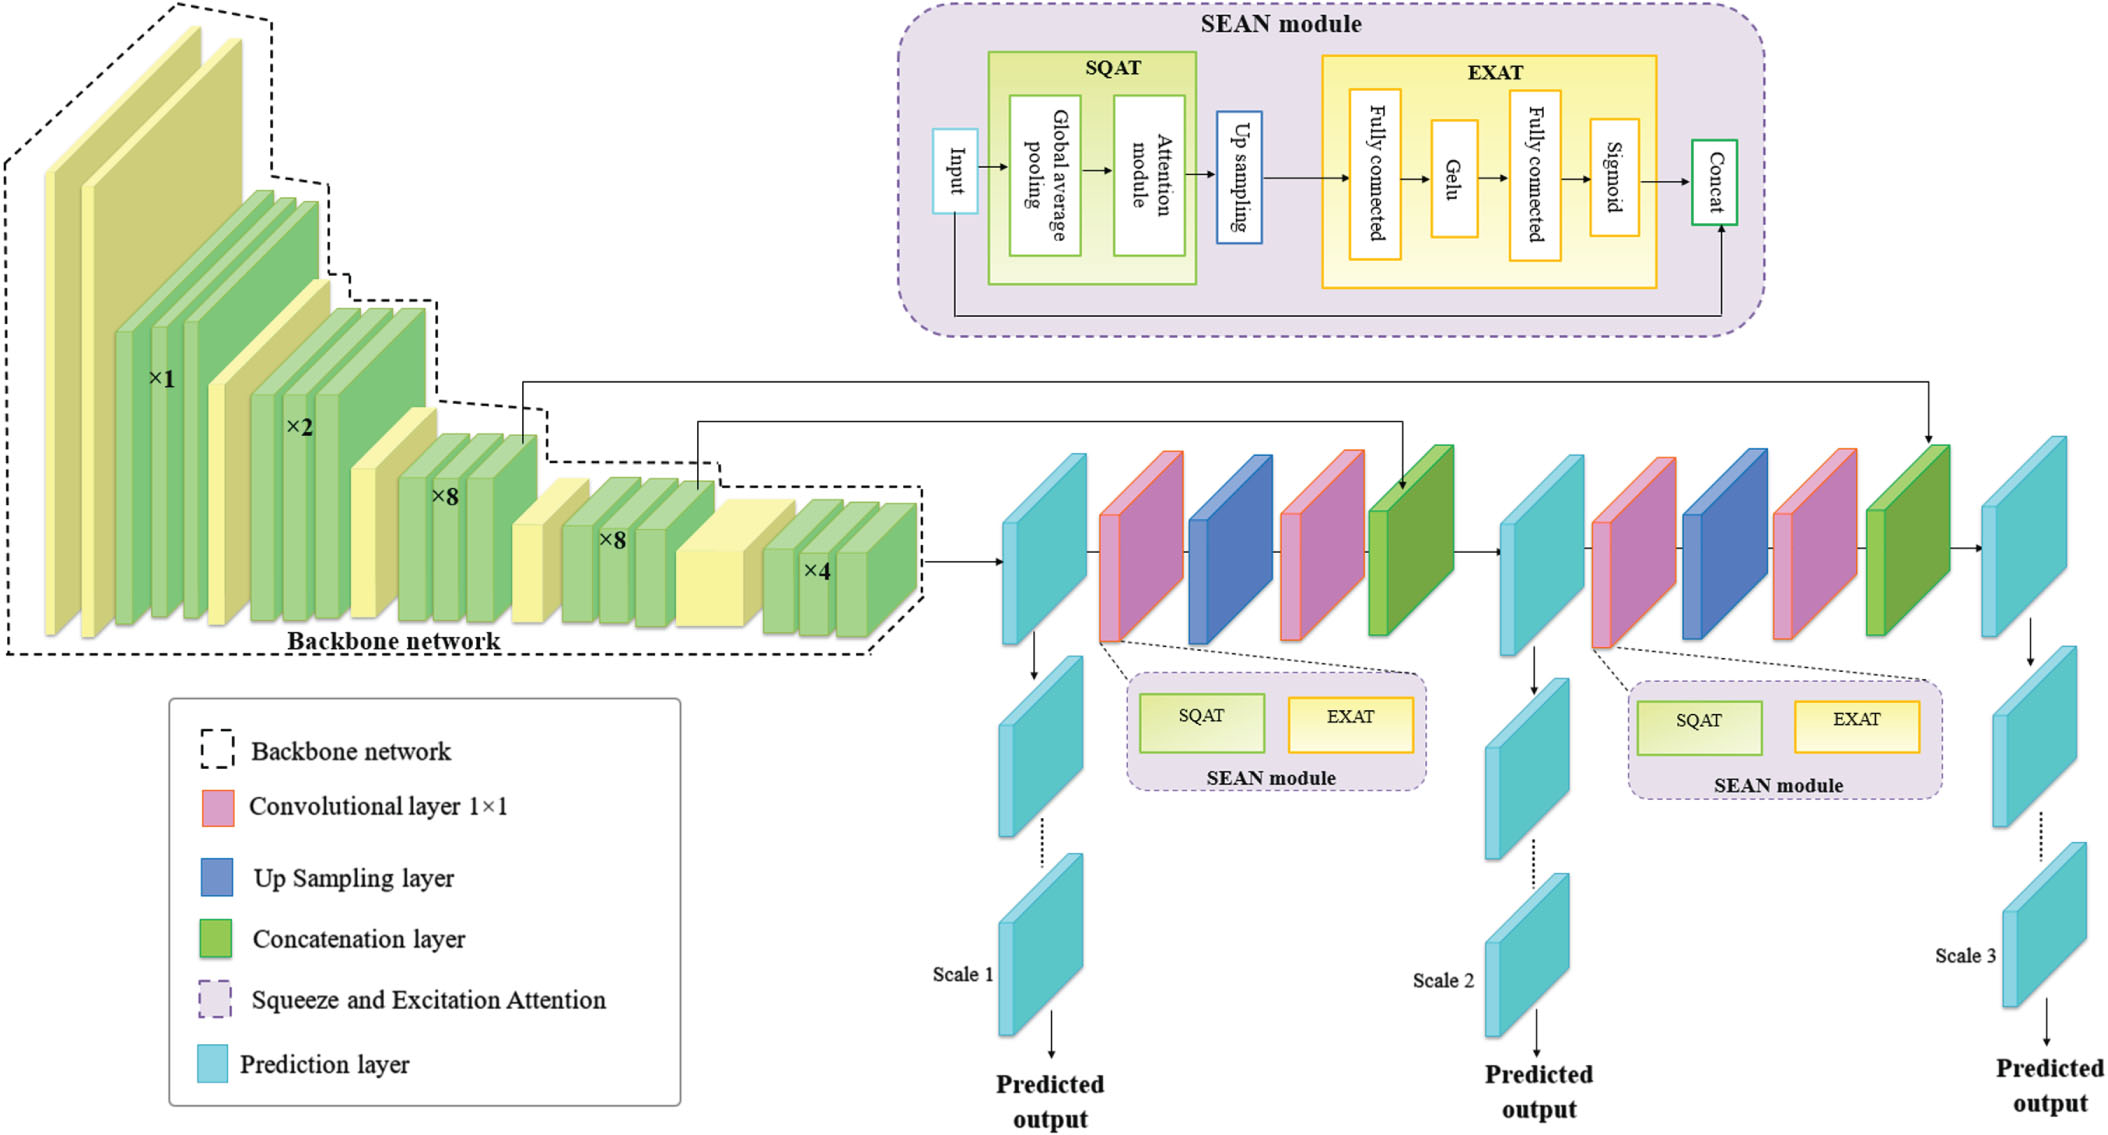
Architecture of proposed SEAN-YOLO network.
The SEAN module is integrated in the deep learning-based YOLO network for efficient extraction of signal features. An average vibration signal can be measured using general signal-based statistical metrics known as signal features, which is employed to any signal type, including time synchronized average (TSA) vibration signals. Variations in the ECG characteristics are properly indicated by the proposed system. In this module, there are two blocks namely Squeeze attention (SQAT) block for collecting the extracted features and Excitation attention (EXAT) block for selecting the relevant features. The parameters of the YOLO network are boosted by the addition of the SEA module and the attention baseline. This attention block mainly concentrates by learning signal features based on the attention mechanism.
SQAT block: Feature collection
SQAT block is used to enhance the power of the network to model the dependencies among channels of convolutional filters. The squeeze procedure is used for compressing feature maps U∑Rw×b×c2 by the use of spatial dimensions (w × b), which produces channel-wise statistics F
sq
by using global average pooling. The input of the SQAT block has a convolutional layer. Then by the usage of average pooling each channel is lessen into a single value. The GELU operation produces non-linearity which follows the dense layer. Here the gated functions act as a gating function. Additionally, the SQAT block is computationally light, which improves model performance and reduces computational load.
Where F sq (·) indicates the squeeze function, Z is the c th element of the squeezed channel, u c gives the c th feature map of the preceding convolution operation, width and height represent W and H respectively. The collected features are fed to the EXAT block for feature selection.
The information collected in the SQAT phase is used to find the dependencies among the channels that are captured completely in the EXAT phase by adopting a gating mechanism along with an activation sigmoid s as given in the Equation (6).
Where F
ex
(·) indicates the excitation function, Z is the input from previous squeeze block, δ is denoted as the GELU function. It is possible to learn the non-linear parameters w1 and w2 through the use of two fully connected layers. The channel statistics s is used to rescale the final output,
Where X c denotes the resultant output. EXAT block collect global feature descriptors in each location of raw features after they are gathered from the SQAT block. Feature maps that are more significant than their counterparts are given more attention. Following a locally connected2D layer, a sigmoid activation function is utilized to learn the weights. The accuracy is boosted by altering the hyper-parameters like epoch and learning rate for efficient classification of heart beat abnormalities.
The class loss function, the objectless loss function, and the loss function of the bounding boxes are the three elements that make up the loss function of YOLO-ECG model. The loss function of the bounding boxes is utilized to determine the prediction box’s error for the coordinate positioning error. The prediction box’s confidence error can be seen in the objectless loss function. The target category’s prediction box’s mistake in prediction is indicated by the class loss function. The C IoU loss objectless loss function is employed. The overlap rate, box scale, ground-truth box distance, and penalty term are all taken into account by C IoU , which increases the stability of the bounding box regression. The orientation between the ground-truth boxes and the prediction boxes are not taken into account when using the loss function of the bounding boxes, viz., C IoU , which causes a slow convergence rate. For this, S IoU redefines the correlation by introducing a vector angle between the prediction boxes and the ground-truth boxes.
Results and discussion
In this result section, the experimental arrangement of the study was implemented through MATLAB 2020b executed on a PC with Windows 10 OS on an Intel i3 core processor with 2.10 GHz processor and 8GB RAM system. Moreover, the assessment of the proposed YOLO-ECG model with some DL based YOLO structures is also provided. For the experimental study, the MIT-BIH dataset is separated into two subsets of images in the dataset 70% for training and 30% for testing. The MIT-BIH database was used to investigate the proposed YOLO-ECG model. There are five different types of arrhythmias that have been identified; Table 1 lists the number of beats for each category.
Number of ECG segments for each type of arrhythmia
Number of ECG segments for each type of arrhythmia
Figure 4 portrayals the experimental results of proposed YOLO-ECG model with the sample of five different ECG signals. The ECG signals is processed by portioning the particular region from the ECG sheets is displayed in column-1. The segmented ECG images are displayed in column-2 after denoising using 2D-SWT to eliminate the distortions. The denoised ECG signals are given as output to the YOLO network for identifying the abnormalities of arrythmia viz., class 0 to class 4.
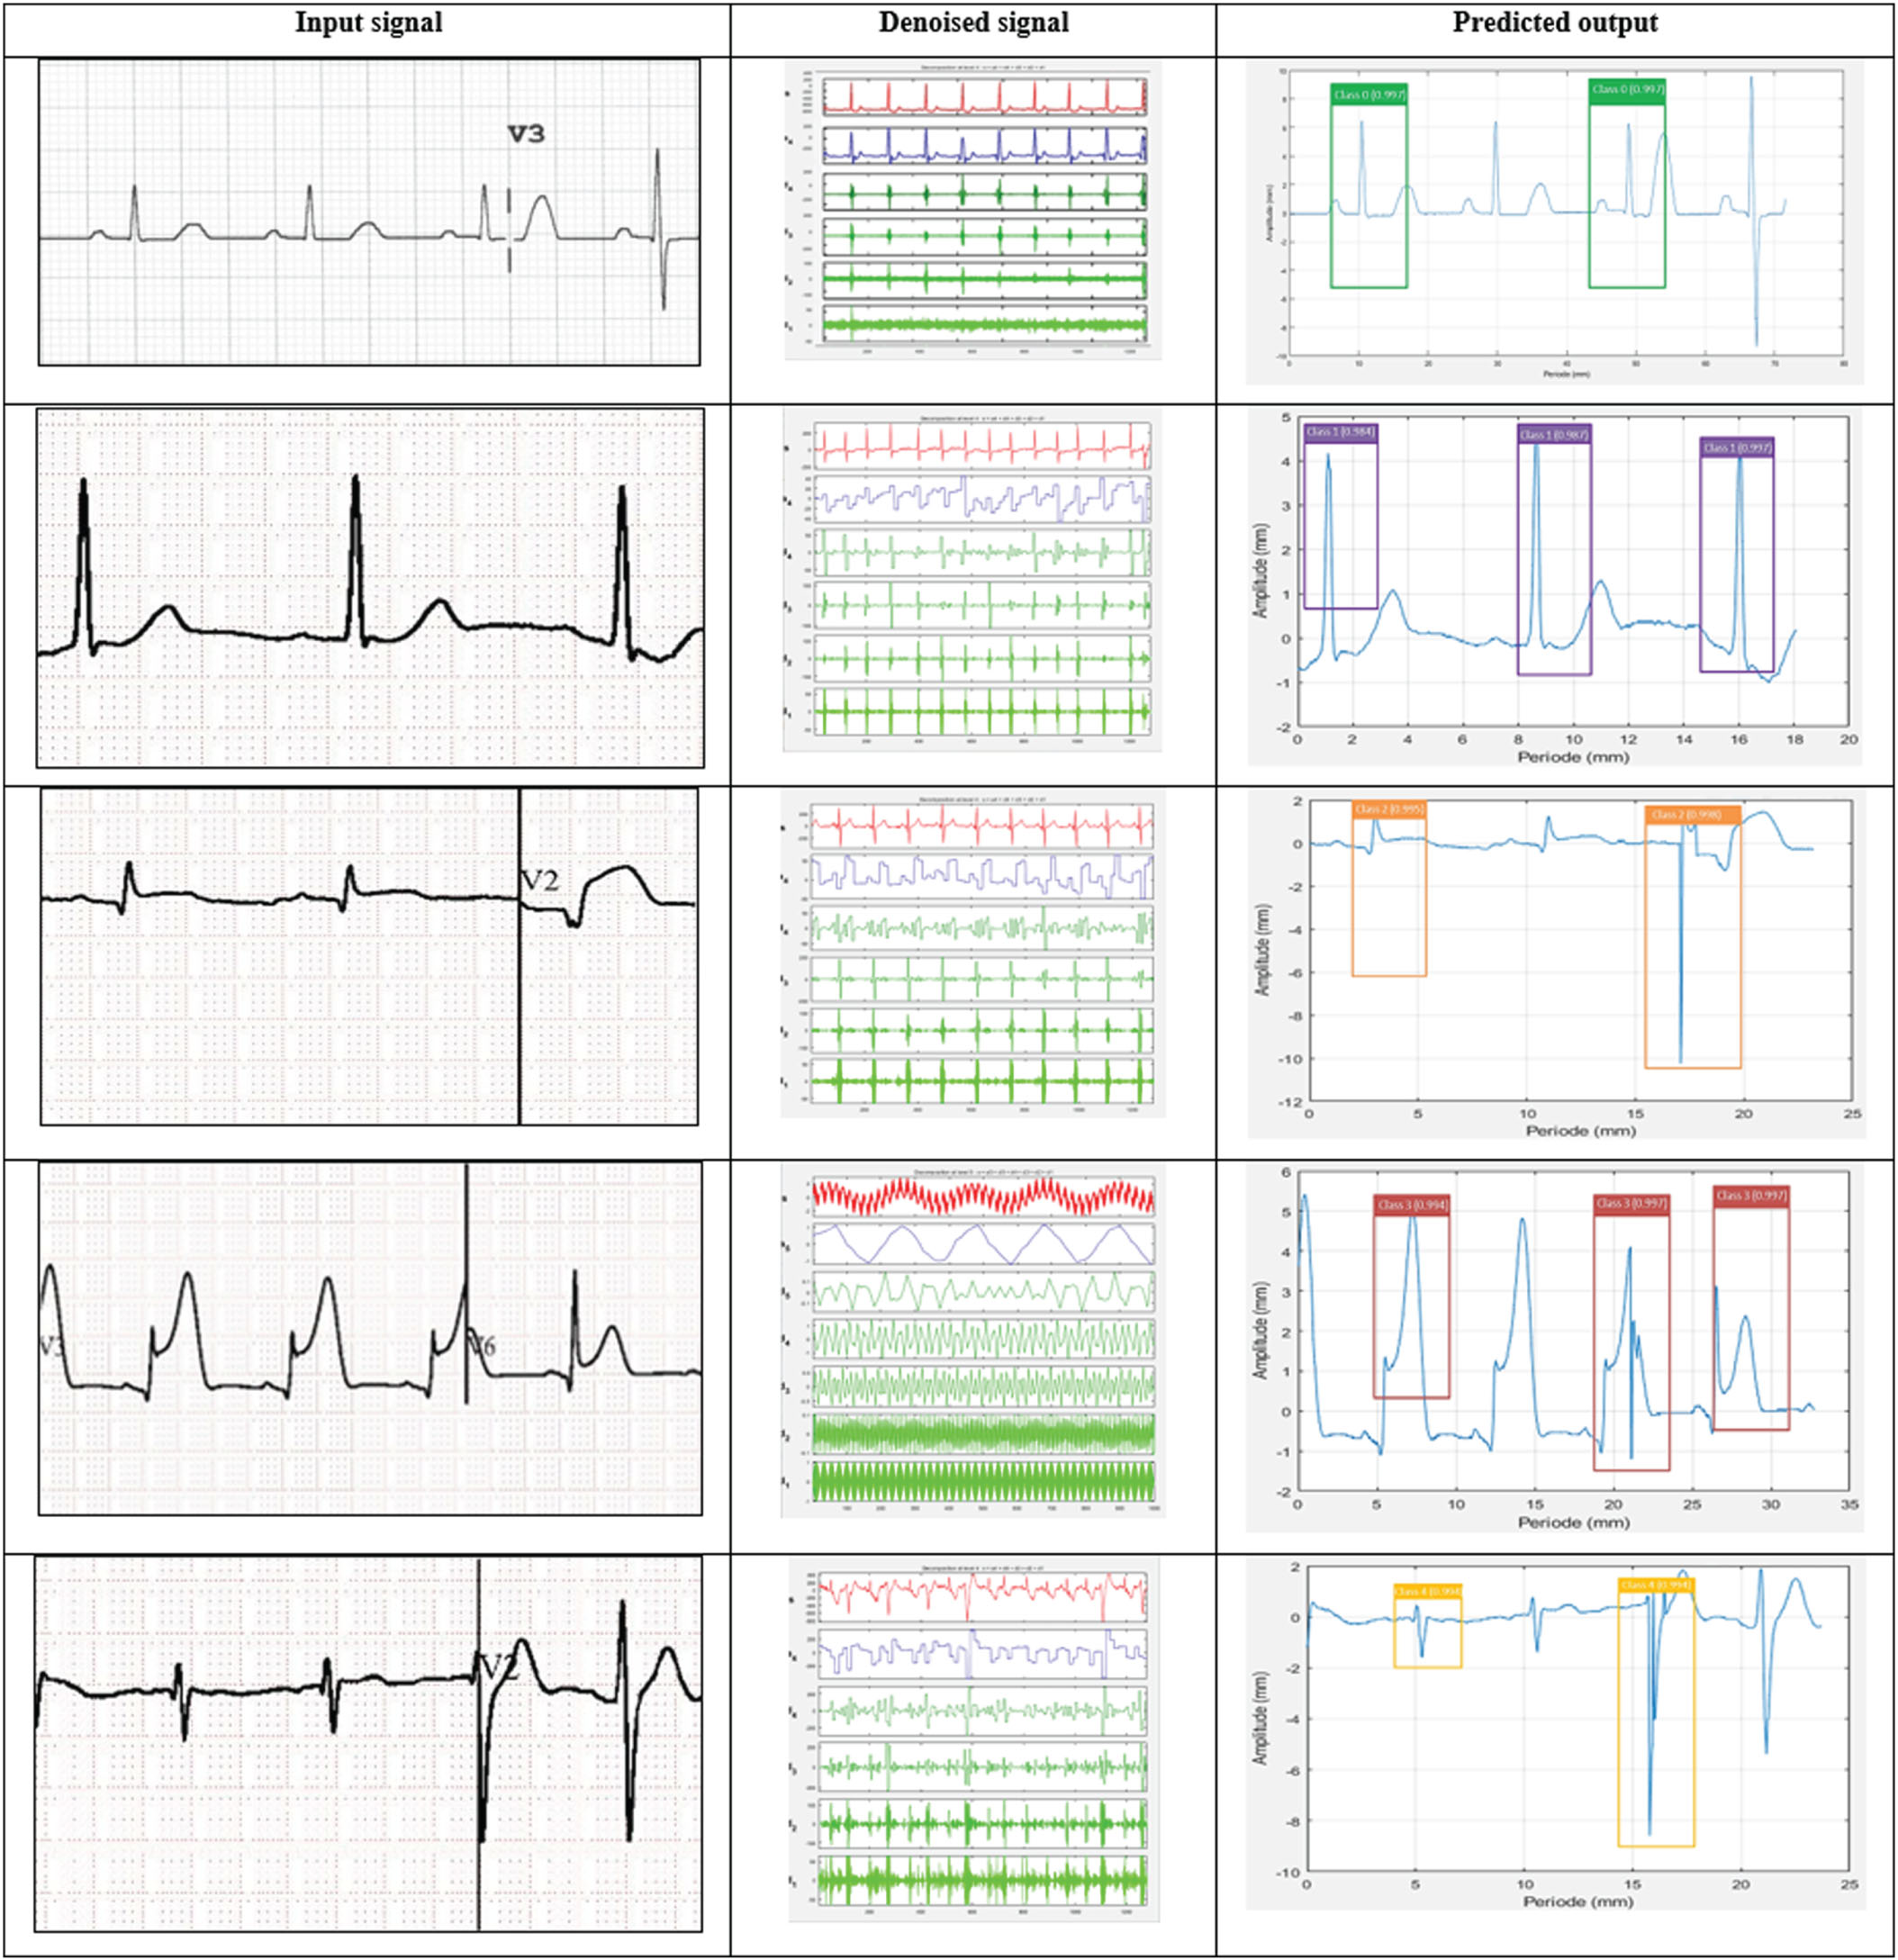
Experimental inpainting results of the proposed YOLO-ECG model.
The competence of the proposed YOLO-ECG model was estimated by some metrics accuracy, precision, specificity, recall and F1 score. The capability was assessed using true positives and negatives of the sample data along with the false positives and negatives of the sample signals. The performance analysis of the proposed YOLO-ECG model is determined based on the specified parameters for five sample images as illustrated in Fig. 5. The effectiveness obtained by the proposed YOLO-ECG model for detecting various arrhythmia such as RB beats, LB beats, VP beats and AP beats from normal beats (N). The proposed YOLO-ECG model reaches the accuracy of 98.53% for the gathered dataset and it is graphically depicted in Fig. 5. Additionally, the proposed YOLO-ECG model acquires the overall specificity, F1 score, precision, and recall of 97.41%, 97.65%, 97.82% and 97.46% respectively.
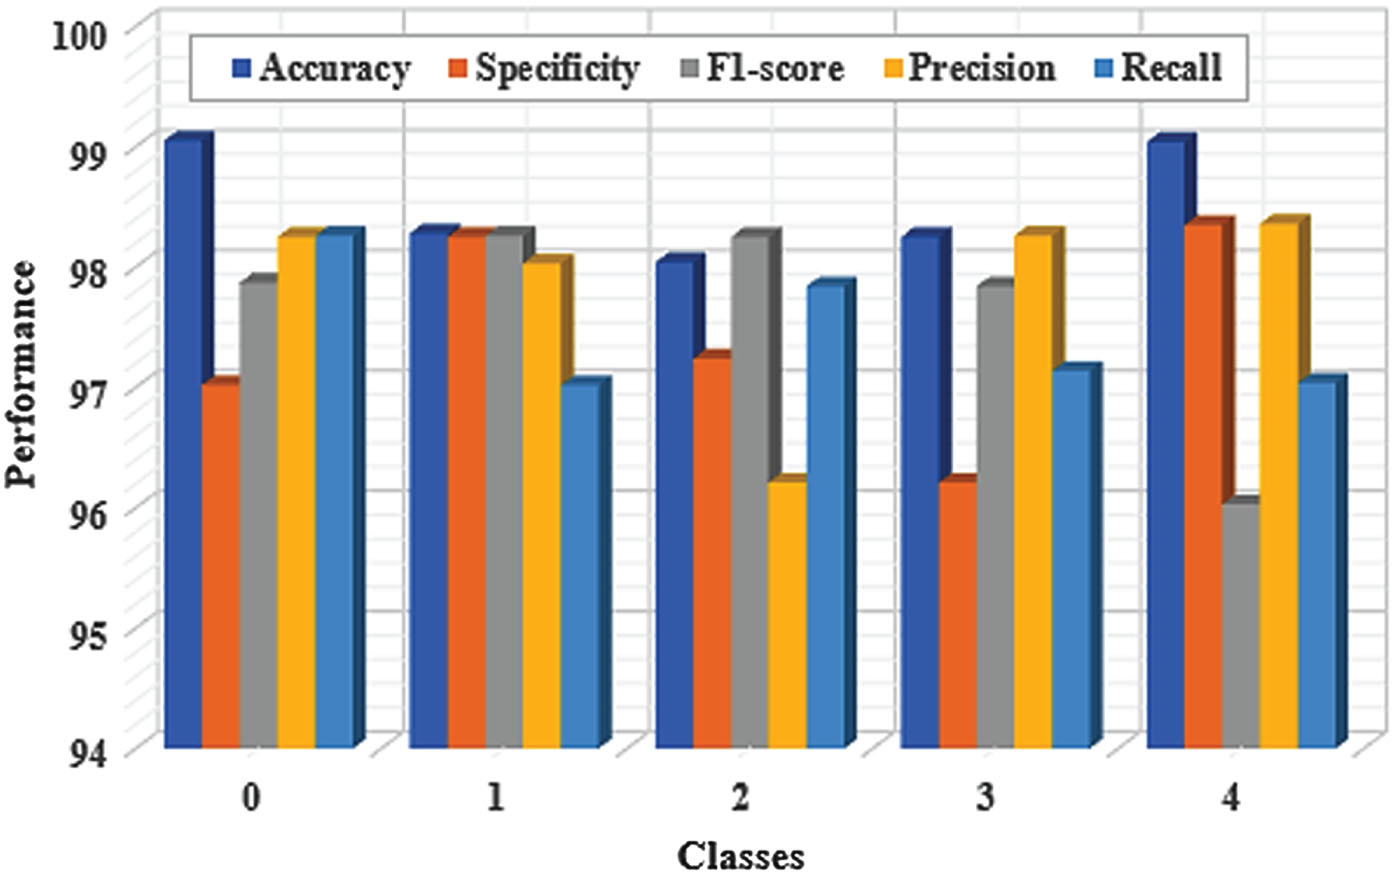
Performance evaluation of the proposed YOLO-ECG model.
Figure 5 displays the recall and precision of each form of arrhythmia. According to Fig. 5, the proposed model had an average accuracy of 98.53%, a typical precision of 97.82%, and an average recall of 97.46% when it came to identifying the five different types of arrhythmias. But the recall value of SVEB is low. This might be because AP has a smaller dataset than other types of arrhythmias. In addition, AP has a beat-to-beat feature in addition to morphological characteristics. It takes 0.02 seconds to detect 10-s ECG segments using the proposed YOLO-ECG model. As a result, the proposed model is used in real-time for efficient detection of ECG abnormalities.
The accuracy graph is presented in Fig. 6 as the accuracy value on the vertical-axis and the number of epochs on the horizontal axis. The epoch and loss range in Fig. 6 indicates that once the epochs are elevated, the loss of YOLO-ECG model declines. In terms of classifying arrhythmia, the proposed YOLO-ECG model achieves high levels of accuracy.
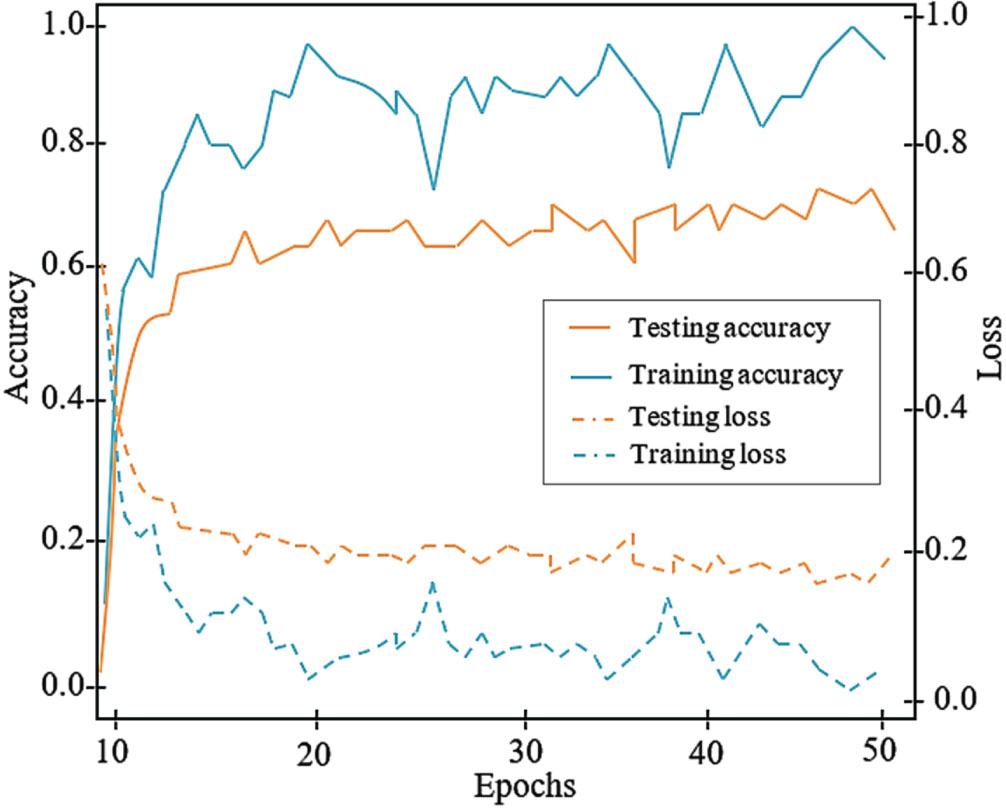
Training and Testing graph of the proposed YOLO-ECG model.
The ROC curve produced for five different classes of arrhythmia is portrayed in Fig. 7 with the suggested dataset that accomplishes a higher AUC. The proposed YOLO-ECG model achieved AUC of 0.991 for class 0 (N), 0.982 for class 1 (RB), 0.984 for class 2 (LB), 0.983 for class 3 (VP) and 0.973 for class 4 (AP) that is determined through true and false positive rate parameters.
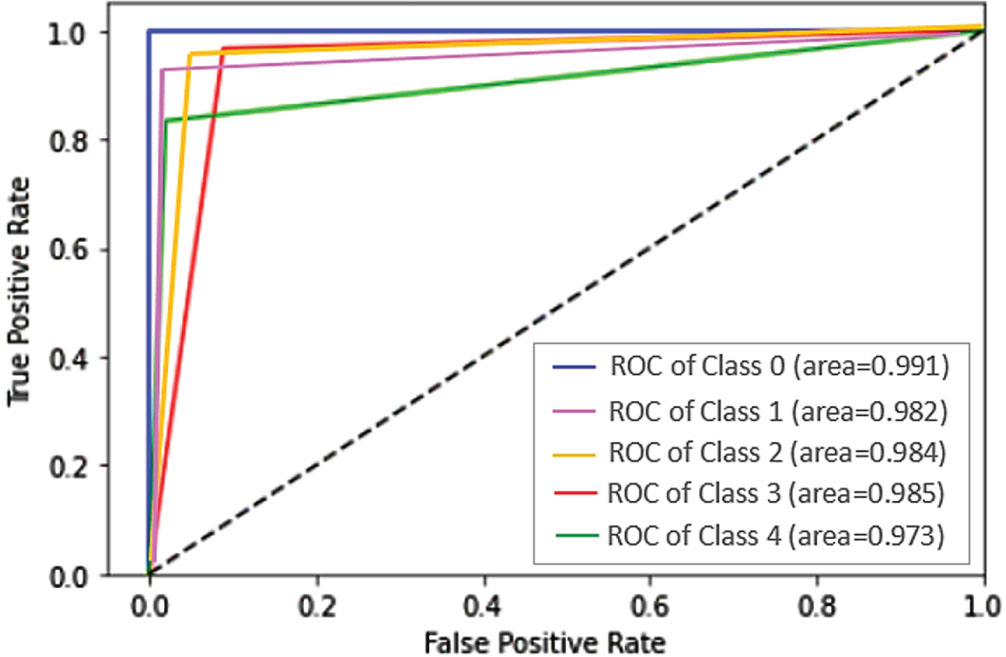
ROC curve of the proposed YOLO-ECG model.
The efficiency of traditional networks was measured for validating that the fallouts of the proposed YOLO-ECG model attain high accuracy. This assessment was conducted in contrast with the proposed YOLO network and conventional networks SSD, Fast RCNN, and Faster RCNN.
Table 2 illustrates the comparison among several conventional DL networks by determining the highest classification accuracy. However, the conventional DL networks did not achieve better fallouts when compared to the YOLO network.
Comparison of different conventional networks
Comparison of different conventional networks
Figure 8 shows the visual comparison results of the object detection networks based on ECG signals for arrhythmia abnormalities. The sample input ECG signal (row-1) and the detection results of different algorithms (row-2 to 5). From this comparison, the SSD attains low level of classification accuracy than the other networks. Additionally, the Fat RCNN and Faster RCNN yields almost similar performance in the ECG classification. However, these detection networks did not achieve best results when compared to the YOLO network for ECG arrhythmia detection.
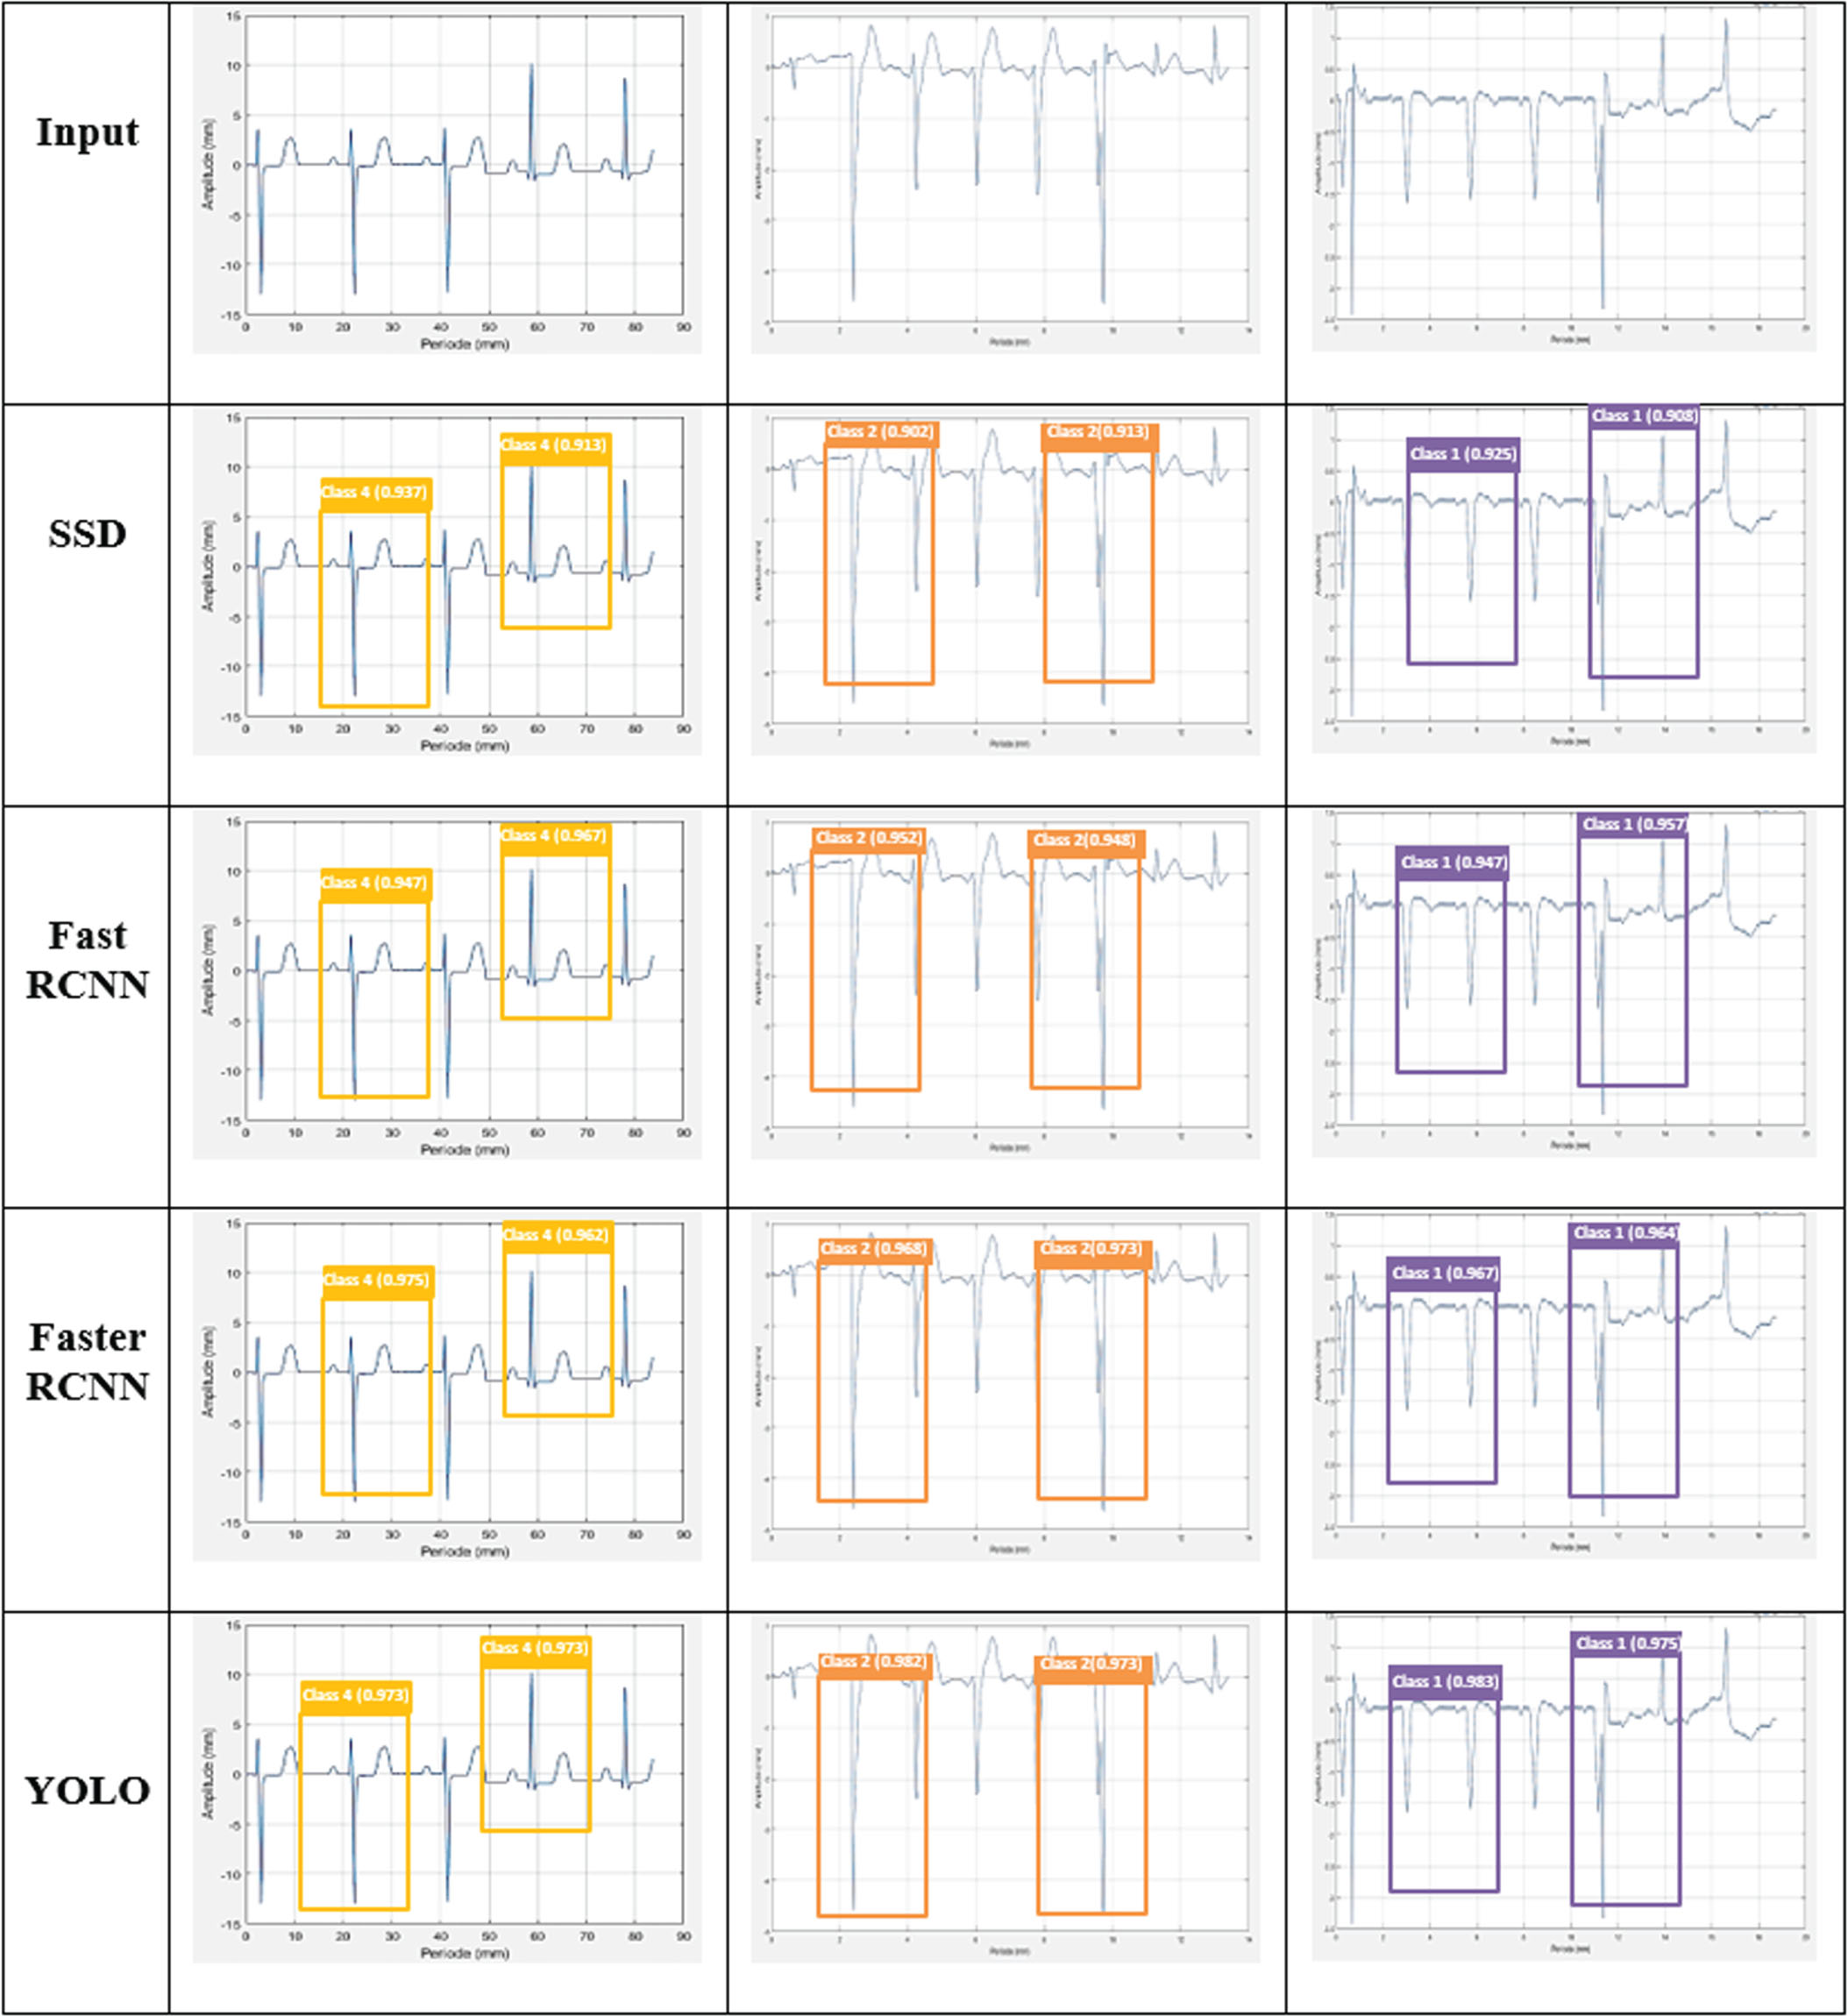
Comparison of different detection networks for ECG signals.
This comparison evaluation was executed with aforementioned network metrics, in which the attained result of YOLO is comparatively higher than the other detection networks. The proposed YOLO increases the overall accuracy by 4.07%, 3.04%, and 2.12% better than SSD, Fast RCNN, and Faster RCNN respectively.
Table 3 summarizes the experimental setup with the test samples from the gathered to estimate the efficiency of prior frameworks. A performance criterion was used to compare prior models based on classification accuracy. The YOLO-ECG model improves the overall accuracy range by 6.02%, 0.16%, 2.59%, 1.13% and 0.83% better than BaROA [15], 2D-CNN [16], CNN-BLSTM [17], SVM-FFBPNN [19] and 2D-CNN-LSTM [20] respectively. Though, the prior networks not achieved better fallouts in contrast to the proposed Yolo-ECG model. As displayed in Table, our YOLO-ECG model is superior than other methods. So, the predicted outcomes of the proposed YOLO-ECG model are highly reliable for the detection of different types of ECG abnormalities. However, the accuracy of the proposed YOLO-ECG model is slightly lower than the existing CWT+DCNN [13], it was improved in the future work.
Accuracy comparison of prior techniques and Proposed model
This paper developed a novel method for efficient classification of ECG arrhythmias based on deep learning. To increase robustness, the ECG signals were initially denoised through 2D-SWT using 12-lead electrodes. ECG abnormalities were detected by feeding denoised ECG signals into the YOLO network with GeLU activation function. To reduce network complexity and improve the performance of the proposed model, the SEAN module was deployed in the YOLO network. According to the classification results, the YOLO-ECG model performs better by using ECG records from the MIT-BIH arrhythmia dataset. From the experimental analysis, the proposed model yields the overall accuracy of 99.16% for efficient classification of arrythmia ECG signals. The proposed YOLO was contrasted with the tradition object detectors in which it increases the overall accuracy by 4.07%, 3.04%, and 2.12% better than SSD, Fast RCNN, and Faster RCNN respectively. The YOLO-ECG model improves the overall accuracy range by 6.02%, 0.16%, 2.59%, 1.13% and 0.83% better than BaROA, 2D-CNN, CNN-BLSTM, SVM-FFBPNN and 2D-CNN-LSTM respectively. The proposed YOLO-ECG model is highly parallelizable, which means it takes advantage of modern GPUs and accelerators for fast processing. It is useful for handling large volumes of ECG data efficiently. Moreover, the proposed YOLO-ECG model is adapted for ECG arrhythmia classification, allowing for real-time monitoring of cardiac activity through rapid processing of ECG data. In future, the proposed deep learning-based portable monitoring system is implemented with the FPGA setup for efficient identification of heart beat abnormalities.