
Abstract
Energy sustainability indicators are essential for evaluating and measuring energy systems’ environmental, social, and economic impact. These indicators can be used to assess the sustainability of different energy sources, such as renewable or fossil fuels, as well as the performance of energy systems in various regions or countries. The goal of this paper is to propose a new energy sustainability index based on fuzzy logic for the Amazon region. The fuzzy inference system enabled the operationalization of subjective sustainability concepts, resulting in a final index that can evaluate the performance of the states in the Legal Amazon and compare them to each other. The results indicated that Mato Grosso had the highest ranking, followed by Tocantins, Amapá, Roraima, Rondônia, Pará, Acre, Maranhão, and Amazonas in the last position. These findings demonstrate that the selected indicators and the final index are effective tools for evaluating the energy sustainability of the Amazon region and can aid public managers in making decisions and proposing sustainable regional development policies for the region.
Introduction
Natural phenomena inherent to sustainable development, when described by quantitative methods, lose information due to the complexity and subjectivity of the conceptual meaning of sustainability. The use of fuzzy logic as a scientific tool allows the modeling of mathematical systems that use both qualitative descriptions and quantitative data, through so-called linguistic rules, and can support approximate, rather than exact, modes of reasoning [1]. This is why fuzzy logic is commonly employed in mathematical modeling that presents imprecise or subjective inputs, such as the case of the concept of sustainability [2].
In this way, the problems and challenges inherent in defining sustainability are minimized, as qualitative characteristics are worked together with quantitative values [3]. Recently, different systems have attempted to work qualitatively with the dimensions of sustainability. Sustainability involves a delicate equilibrium among its social, environmental, and economic dimensions. The inherent nature of each dimension can potentially lead to conflicts. Environmental sustainability aims at preserving the essential attributes of ecosystems and their components and interactions over time [4]. Economic sustainability seeks long-term profitability stability, while social sustainability necessitates a systemic organization rooted in cultural and ethical values embraced by society and stakeholders, ensuring acceptability and continuity for organizations [5].
The methodology proposed in this paper involved selecting sustainability indicators for the Amazon region, collecting information, and analyzing data using fuzzy logic focusing on creating a new Amazon Energy Sustainability Index, which is the main objective of this paper, having an extra indicator that could help in the decision-making regarding the sustainability in the Brazilian Amazon.
The contributions of this paper are:
Creation of a methodology based on a set of indicators reviewed and established in the literature for a new Sustainability Index. Compose a final index based on an expert fuzzy system used to measure energy sustainability. Evaluate the energy sustainability in the Legal Amazon.
The remainder of this paper is as follows: In Section 2 related works are discussed. In Section 3 an explanation of the considered area is presented. In Section 4 the proposed method is presented. In Section 5 results are discussed and Section 6 presents a conclusion.
Literature review
Sustainable development and the energy challenge are fundamental components of every nation’s governance and intersect within the pathways of the energy sector [6]. These components serve as instruments for the betterment of society, and development is not an outcome but a continuous pursuit, irrespective of the specific developmental model adopted in a particular context [7].
The energy then comes very close to the concept of development, as it responds to socioeconomic activity and an energy policy [8]. Thus, environmental preservation and the current and future quality of life are the pillars of energy sustainability necessary for full human and social development [9].
The technical dimension of sustainability assesses the system’s capacity to deliver energy to society in a dependable, effective, and environmentally friendly manner, using clean and renewable resources [10]. This dimension has a direct influence on the sustainability of regional projects and focuses on the maintenance of energy services during the economic life of the initial investment.
Achieving technical sustainability involves ensuring that energy planning can fulfill both the present and future energy requirements of society. This is attainable through a dependable, efficient power supply that relies on renewable energy sources and is complemented by locally accessible support services for maintaining and implementing energy systems [11].
According to Olmos-Gómez et al. [12], Stepanova et al. [13], and Yu and Liang [14], due to the dynamic nature of sustainability, new ideas have been incorporated into the concept of sustainability over time, in line with the need to measure the phenomenon. Subsequently, the technical dimension started to be used to broaden the vision of sustainability allied to energy, which makes up five dimensions. This evaluation can be based on the assessment of rural electrification [15], energy access programs [16], and sustainable energy development [17].
According to Stefenon et al. [18], there is attention from the electric power utility to keep the energy in places hard to reach, improving access to energy. Given that energy constitutes a crucial prerequisite for the advancement of any nation’s social and economic well-being, the endeavor to attain energy sustainability represents a substantial challenge for all countries [19]. Even as the discourse regarding the precise delineation of sustainable development persists, it is undeniable that societies heavily depend on fossil energy resources [20], a practice that adversely affects both the environment and public health [21].
In this context, it is crucial to forge a partnership between energy and sustainability, aiming to aid nations in formulating sustainable energy policies. This can be achieved by utilizing sustainability indicators and indexes as instruments for conveying energy concerns within the realm of politics and to the general public [22].
Sustainability dimensions
Sustainability involves a delicate equilibrium among its social, environmental, and economic dimensions [4]. The fundamental dimensions of sustainability can sometimes introduce conflicts, stemming from the inherent nature of each element. Environmental sustainability entails the enduring preservation of essential ecosystem attributes through the responsible utilization of their elements and interactions. Economic sustainability seeks sustained profitability over time, while social sustainability is tied to a systemic framework that must encompass the cultural and ethical values of the parties involved and align with societal expectations, maintaining this alignment throughout the course of organizational activities [23]. As the dimensions of sustainability are not independent, the constant balance of sustainability makes it a dynamic rather than a static concept [24]. Although apparently conflicting, they present characteristics of close interdependence, so that they have the same degree of importance for the search for a balance between them [25].
Case study
The Amazon biome covers more than seven million km2 and occupies 50 percent of all South America, resulting in the largest set of tropical forests on the planet. It is spread over Brazil, Bolivia, Colombia, Ecuador, Guyana, French Guyana, Peru, Suriname, and Venezuela, with Brazil having more than half of the Amazon and 1/3 of the remaining rain forests on the planet [26]. In Figure 1, we can visualize the location of the Legal Amazon in relation to Brazil.
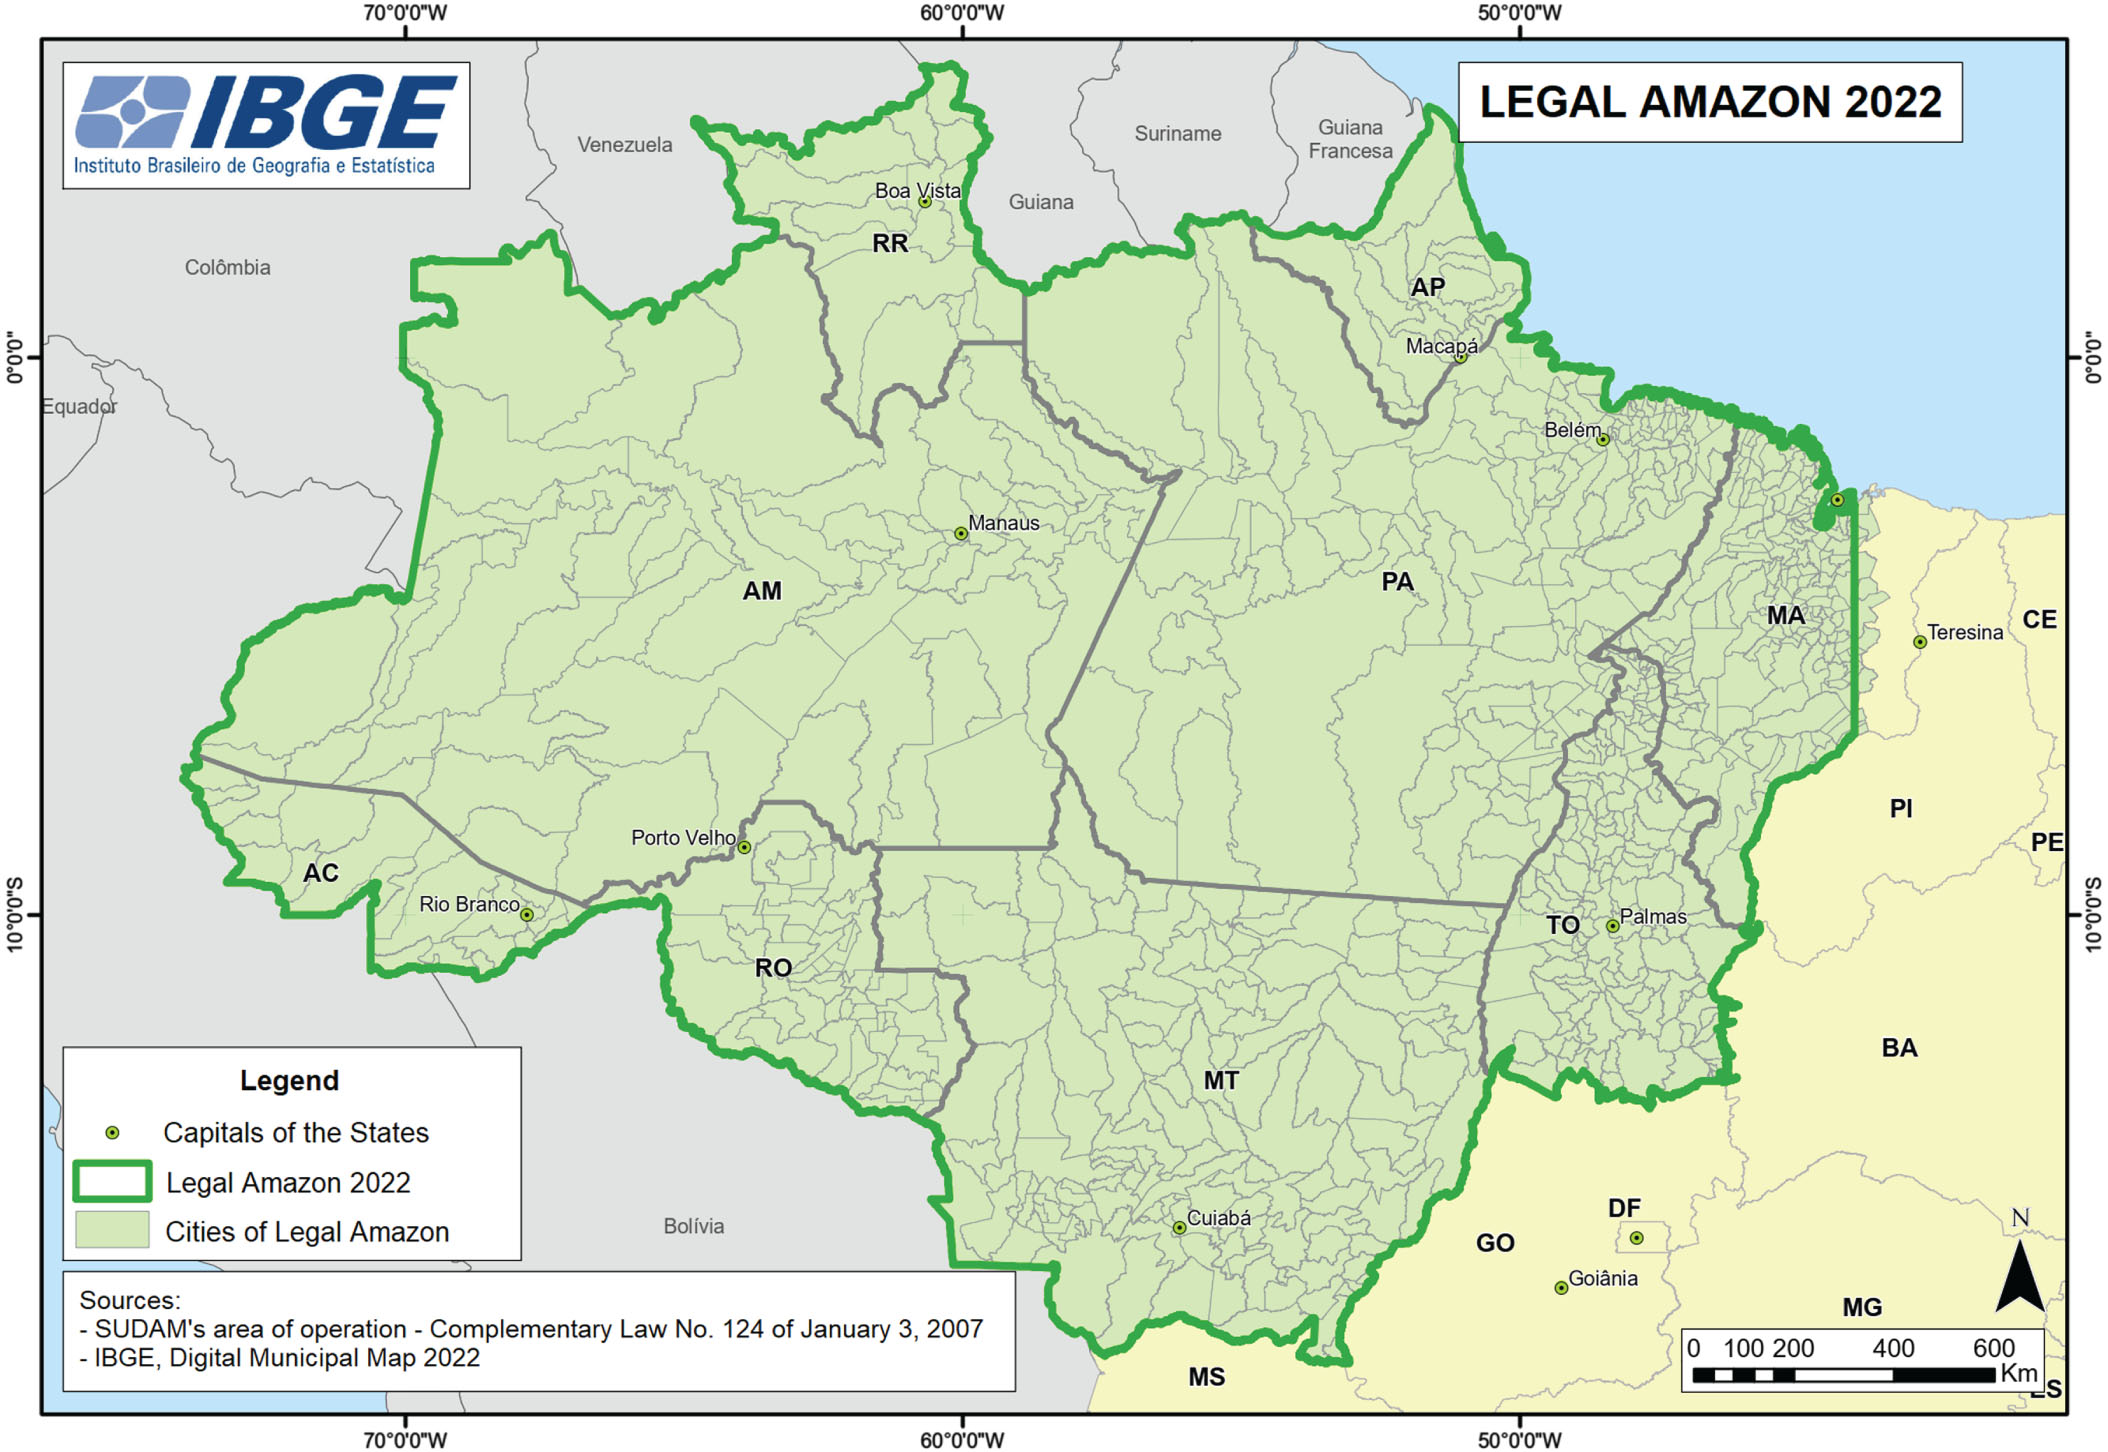
Legal Amazon - IBGE (Brazilian Institute of Geography and Statistics).
The study area comprises the region known as Legal Amazon, which is distributed over 9 Brazilian states (Maranhão, Pará, Amapá, Roraima, Amazonas, Acre, Rondônia, Mato Grosso, and Tocantins) and encompasses the entire Northern Region, and the Centre-West and Northeast regions partially. The Legal Amazon corresponds to approximately 59 percent of the national territory and covers an area of approximately 5 million km2 [27].
In Brazil, there is a National Interconnected System [28] which is responsible for transmitting energy in almost all regions of the country. Only a few isolated systems can be found which are under the responsibility of the government. The high density of transmission lines in the South and Southeast regions [29], as opposed to the low density or inexistence of transmission lines in the North Region [30]. That’s why it’s important to guarantee the supply of energy to these places, as this is also a way of measuring social development.
There are several researchers evaluating the possible way to improve the security and continuity of energy supply in Brazil [31–33]. According to Stefenon et al. [34], the power grids are subject to environmental variations that may reduce system reliability. The sustainable development of the system is been studied, since sometime the proper maintenance of the network may not require the use of new components [35].
Considering that the electrical system is very large in Brazil [36], and that the electrical grids can be in difficult access [37], visual maintenance by unmanned aerial vehicles has been used to reduce the environmental impact [38]. The use of covered (insulated) nets reduces the need for tree pruning, reducing the influence of humans on nature [39]. As presented in [40–42] the inspections are been carried out to enhance the assurance of energy supply. These, among other points, have been studied to improve electric power supply and sustainability in Brazil.
Initially, a bibliography review of energy sustainability indicators and indexes was carried out. From this review, ten base indicators were chosen to compose the final energy sustainability index for Amazonia. The proposed method is based on the dimensions of sustainability.
The framework of the five dimensions of sustainability is represented by the economic (ECO), environmental (ENV), social (SOC), technical (TEC), and institutional (INS) dimensions [17]. These five dimensions offer a more comprehensive representation of the multidimensionality of energy sustainability and provide a acceptable starting point for defining sustainable access to energy and its efficient use by society.
The five dimensions of sustainability highlight a continuous flow of energy from natural resources, which comprises the environment, from fossil to renewable energy sources, in the production of primary energy through technological processes and energy converters, which prepare primary energy for use by society, and in turn, moves the economy, which allows a return to the environmental flow through the extraction and use of natural resources. The five dimensions are interdependent on each other [43].
As the concept of sustainability is subjective and the social-environmental systems are dynamic and complex, fuzzy logic was chosen to model the final index, as it works with linguistic variables (qualitative approach) besides the numerical data (quantitative). In this paper, the fuzzy logic framework from Matlab software was used.
The fuzzy logic framework is appropriate for designing, simulating, and implementing fuzzy logic systems. It provides an interface to create, modify, and analyze fuzzy inference systems, which are used to model and control complex, uncertain, or non-linear systems [44]. In this framework, there are the following features and functions:
The fuzzy system modeled the final index, with a primary stage made through five fuzzy systems, corresponding to each of the five dimensions of sustainability. The considered data and the indicators to apply the proposed method are presented in the next subsections.
Database
Energy data used here is from the National Energy Balance 2019 (base year 2018) [46], and from the Electricity Statistical Yearbook 2019 (base year 2018) [47]. This date was chosen because it preceded the pandemic period caused by COVID-19 [48], which resulted in changes in consumption and energy generation and affected the economic and social data in Brazil, especially in the North Region, in an atypically.
In the second stage, the final index was calculated through the five sub-indices as input variables, coming from the five Fuzzy Inference System (FIS) of the first stage, which resulted in a final index named Amazon Energy Sustainability Index (AESI). The Mamdani inference method was chosen because each rule should be a fuzzy set and not a numerical value.
The data on greenhouse gas emissions were obtained from the Greenhouse Gas Emissions and Removal Estimating System (SEEG Platform), which makes available interactive the specific scope of emissions for the energy sector and for the final waste disposal sector [49].
For the purposes of calculating deforestation due to energy consumption, the data referring to the area of the reservoirs of the hydroelectric plants in the Legal Amazon were obtained from a spreadsheet used by the agents of the National System Operator (ONS), which presents data from all hydroelectric plants above 30 MW of installed power in operation in the country.
The location of the power plants to identify which belong to the Legal Amazon was obtained from the National Electric Energy Agency (ANEEL)’s web page of the register of generation undertakings in the country. The energy generation and consumption used as input for the evaluation presented in this paper are presented in Table 1.
Brazilian Energy Generation and Consumption Considering the Base Year of 2018 (GWh)
Brazilian Energy Generation and Consumption Considering the Base Year of 2018 (GWh)
The socioeconomic data such as population, gross domestic product, and income inequality index were obtained from the IBGE, by the Continuous National Household Sample Survey (PNAD). The interactive web page of IBGE Cidades was also accessed. This data is presented in Table 2. The data used are presented in Table 3, with the meaning of each variable and its unit.
Social and Environmental Data Considering Different Regions and States of Brazil
Acronym for the used data and their respective units
This stage comprised the choice of data and the selection of the base indicators of energetic sustainability according to the tools reviewed. The step ended with the data treatment through the normalization technique with the calculation of the range (reach) of the base indicators.
The selection of indicators was guided by the comparative and qualitative analysis in the review stage. Two indicators were chosen for each dimension, totaling ten base indicators, which comprise a table of indicators used to cover the concept of energy sustainability. Table 4 shows the dimension of the base indicators, their names considered in this paper, and their significance.
Base Indicators for Sustainability
Base Indicators for Sustainability
Based on the description of Tables 3 and 4, the indicators are calculated according:
In the technical dimension, the TEC1 base indicator is used to measure the rate of fossil fuel consumption relative to total final energy consumption, and TEC2 measures the rate of renewable generation relative to total primary generation.
In the economic dimension, ECO1 measures the primary energy use required to generate one unit of GDP, while ECO2 is used to measure productivity per inhabitant.
The social dimension presents the SOC1 base indicator as the social use of energy through the measurement of residential energy consumption per inhabitant, with the SOC2 base indicator measuring social inequality through the so-called GINI index.
In the environmental dimension, ENV1 is used to measure the deforestation caused by energy generation and ENV2 represents carbon intensity through carbon emissions in energy generation and final waste disposal.
The institutional dimension uses the base indicator INS1 to measure the rate of energy import/export dependence, while INS2 measures the rate of energy consumption to produce one unit of GDP.
After calculating the base indicators, a normalization process was carried out to facilitate comparing and combining the different indicators, assigning a value of one to the best performance and zero to the worst. The method of Maximums and Minimums was used, applied by the United Nations to calculate the Human Development Index, and consolidated in the literature on indicators.
The method consists of identifying two normalization scenarios, for indicators where the highest value means better performance, it was used
On the other hand, for indicators where the lowest value corresponds to the best performance, it was used
It was also necessary to define a speech universe (range) for each basic indicator, considering the maximum and minimum historical values reached by each variable used to calculate the respective basic indicators. This historical series was obtained by the data source itself for each variable. The universe of discourse found serves as a beacon to determine the limit values of the performance of each base indicator and to calibrate the scale of the fuzzy inference system used in the subsequent step. Table 5 provides a summary of the type of normalization applied in this paper and the respective range of each base indicator.
Base Equations and Range for the Indicators
The modeling of the final index occurred in two stages, which resulted in two fuzzy inference systems (FIS). In the 1st stage, for each dimension worked, it was used five FIS with two input variables each, corresponding to each of the ten base indicators chosen. Because of this stage, a subindex was calculated for each dimension, in a total of five sub-indices, technical dimension, environmental dimension, social dimension, economic dimension, and institutional dimension.
In the second stage, the final index was calculated through the five sub-indices as input variables, coming from the five FIS of the first stage, which resulted in a final index named AESI (Amazon Energy Sustainability Index). The Mamdani inference method was chosen because each rule should be a fuzzy set and not a numerical value. In Figure 2, the complete architecture of the final index AESI is presented.
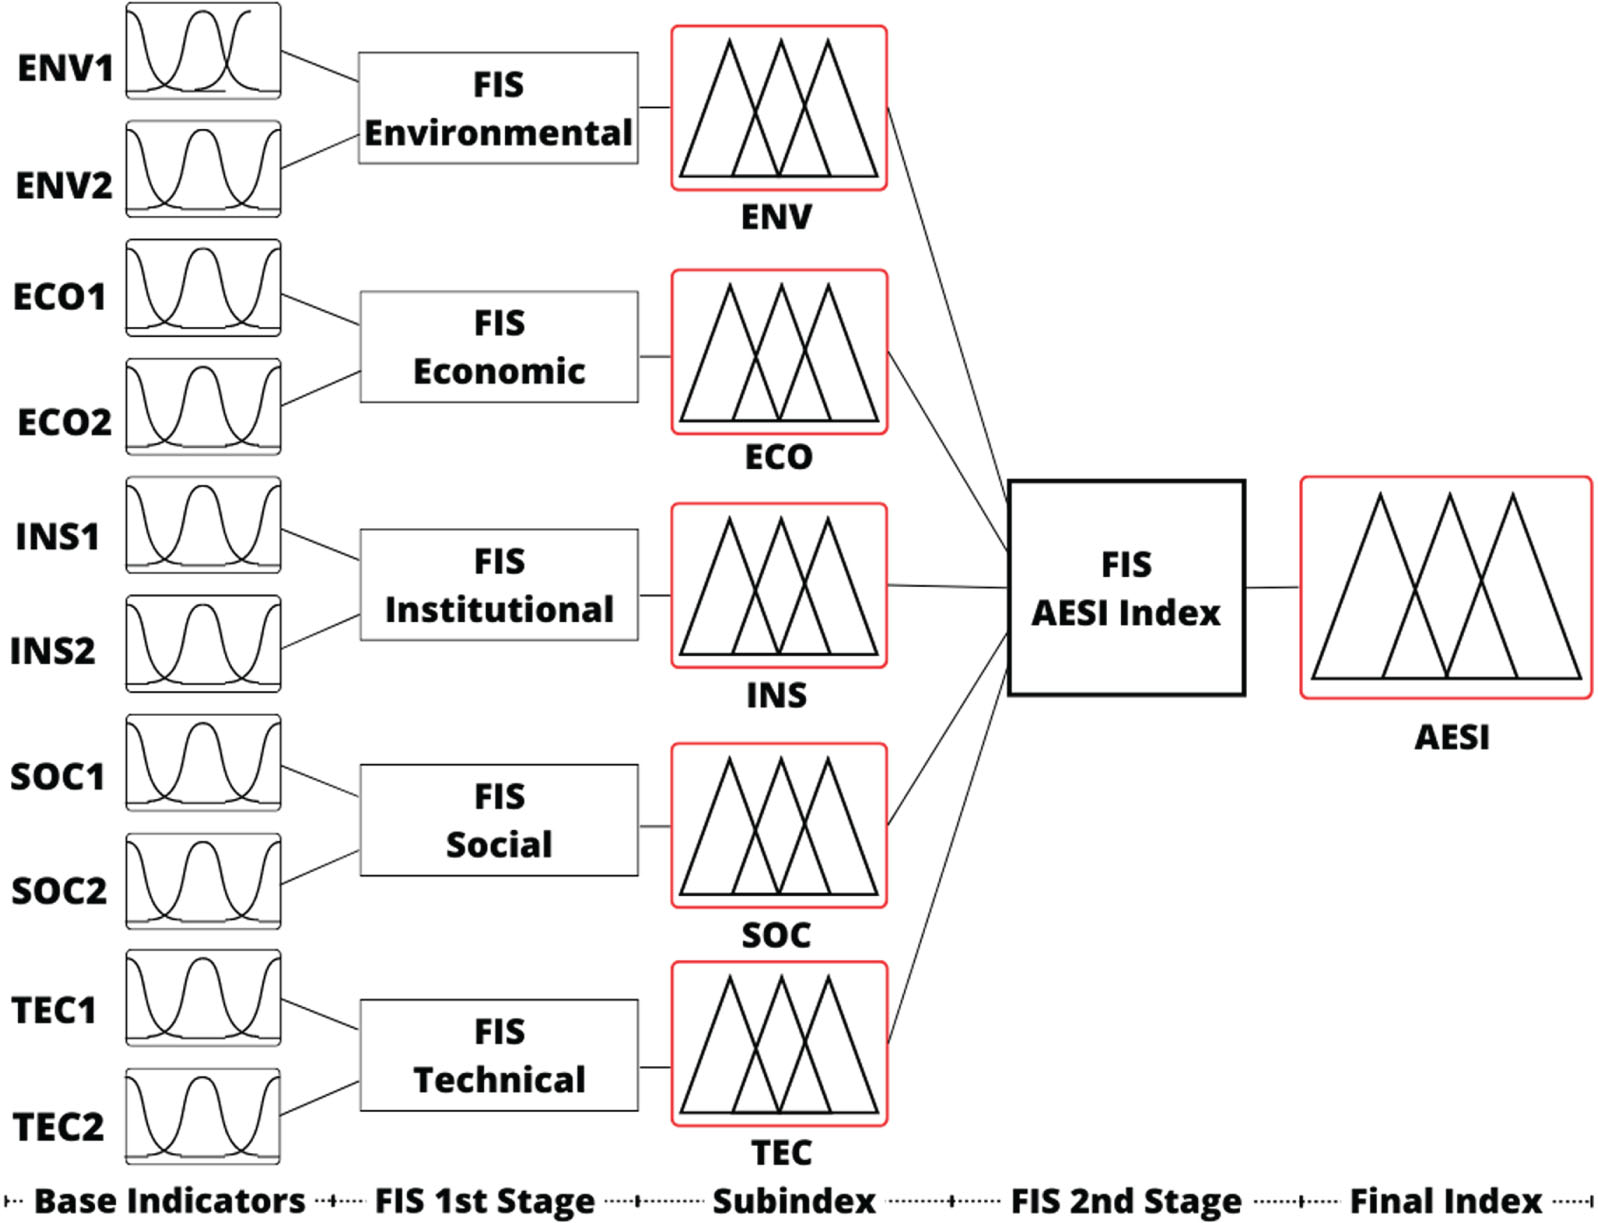
Fuzzy architecture of the AESI index.
With the normalized values and the calculated reaches of the base indicators, the updated values were related to distinct sustainability levels through the pertinence function, which corresponds to three linguistic rules and was named Strong, Medium, and Weak.
The pertinence function of the composite indexes and of the final index was associated with five linguistic rules, named Very Bad, Bad, Regular, Good, and Excellent. In Table 6, the linguistic rules of the membership functions of the first and second stages of the fuzzy system are presented.
Applied Membership Function and Linguistic Rules
In Figure 3, the output membership function of the final index AESI is presented, the result of the fuzzification of the 1st stage sub-indices ENV, TEC, SOC, ECO, and INS.
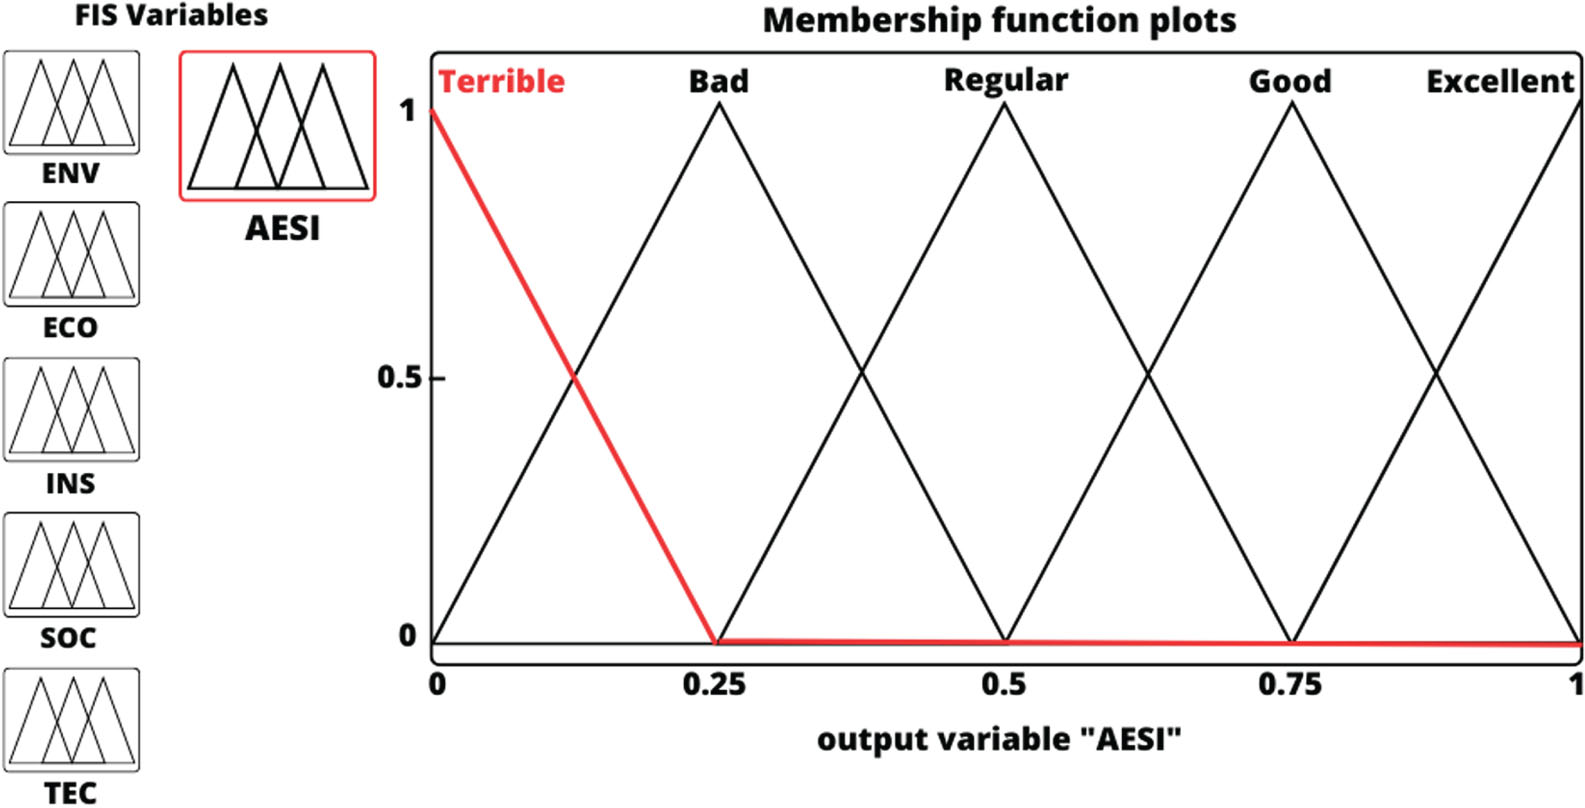
Output pertinent function of the final index AESI.
To assemble the rule base, the calculations were performed through pertinence rules of the form "if (input1) and (input2) then (output)". For the fuzzification of the first stage, there are nine pertinence rules that are the results of the combination of two input variables (base indicators of each dimension) and three linguistic rules.
To calculate the final AESI index, the rule base considered the five input variables referring to the first stage indicators, combined with the five linguistic rules of Table 6, which resulted in 243 pertinence rules.
The five FIS of the first stage were calculated with equal weights since it follows the theoretical assumption addressed in which sustainability is a search for balance among the dimensions that compose it.
To compute the final index, a group of experts in energy planning and sustainability in the Amazon was consulted, where the result of the weight of each sub-index was calculated by the weighted average of the answers given by the consulted experts.
In this section, the results of the use of the proposed method will be addressed. An evaluation of indicators is presented in Table 7 where it is considered the sub-indices (TEC, ECO, SOC, ENV, and INS) and AESI final index.
Results of the Sub-Indices and Final Index
Results of the Sub-Indices and Final Index
From the AESI final index, a comparison among the sub-indices and final index in relation to Brazil, Legal Amazon, North Region, and each State is presented in Figure 1. This visualization highlights the higher indexes in Mato Grosso, followed by Tocantins. Meaning that sustainability is higher in these states considering these indexes.
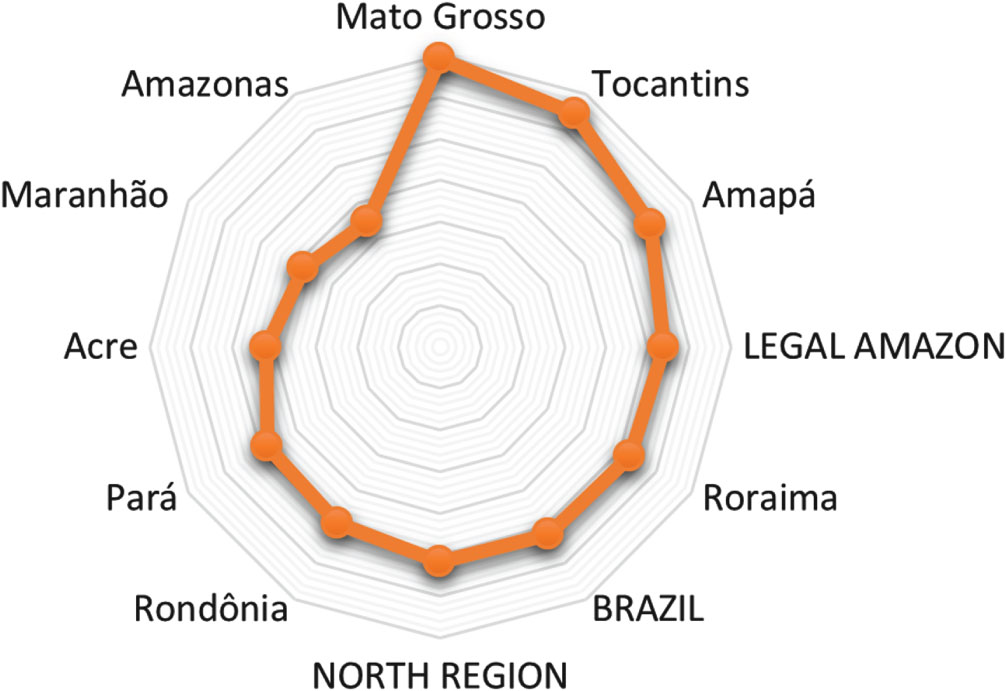
Results of the AESI final index.
Based on a radar graph it is possible also evaluate the difference between the indexes for each area under evaluation, as presented in Figure 2. The major difference in the indexes is when comparing the North and Legal Amazon to Brazil, which highlights this case the INS and ECO are higher considering the entire area of Brazil. This result is expected since the variation in the vegetation is considerably high given the size of the country.
The sustainability of the North and South regions of Brazil can vary significantly due to a range of factors including economic development, environmental conditions, infrastructure, social indicators, and government policies.
Considering these differences in regions, the comparison of them shows that an evaluation considering multiple indexes can more interesting than observing only one.
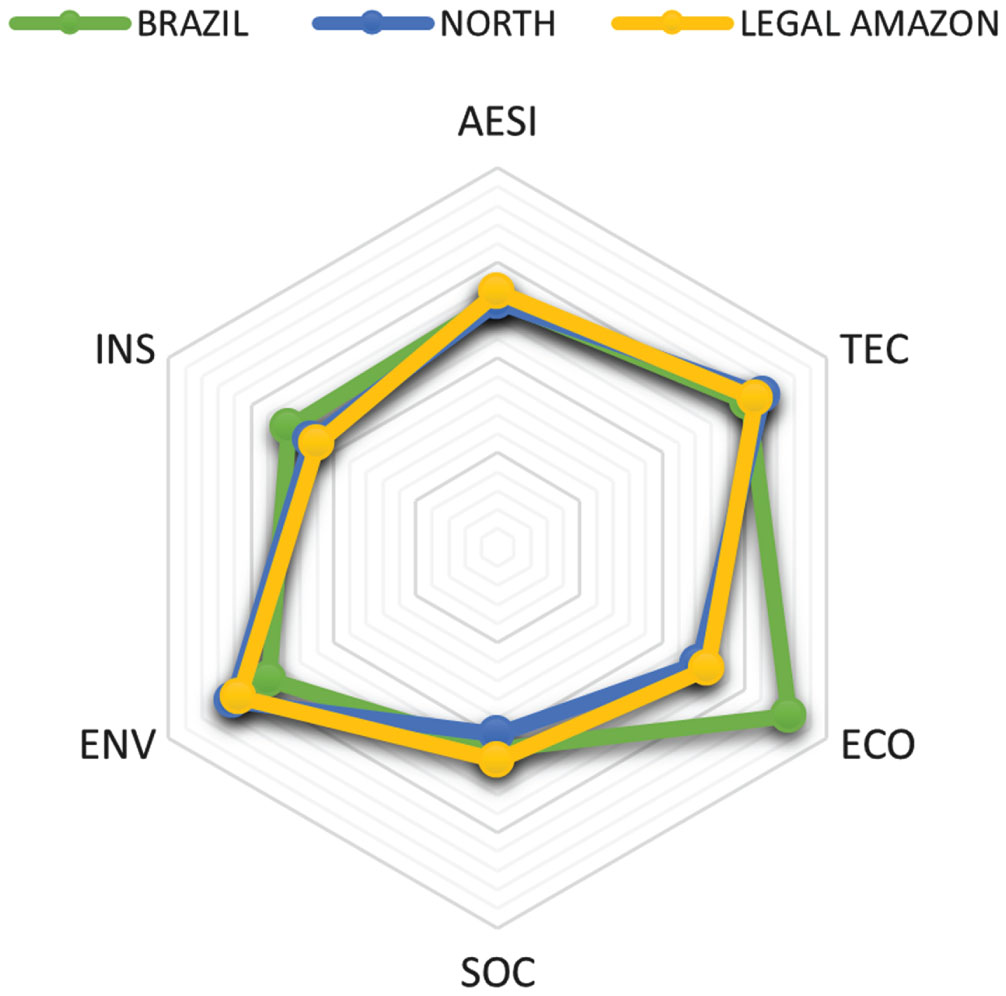
Sub-indices and the AESI index in relation to Brazil, the North, and the Legal Amazon.
When the values are standardized in percentage it is possible to compare which has a major variance for each State, as presented in Figure 6. Compared to other indexes the AESI index presented less variation when comparing different States.
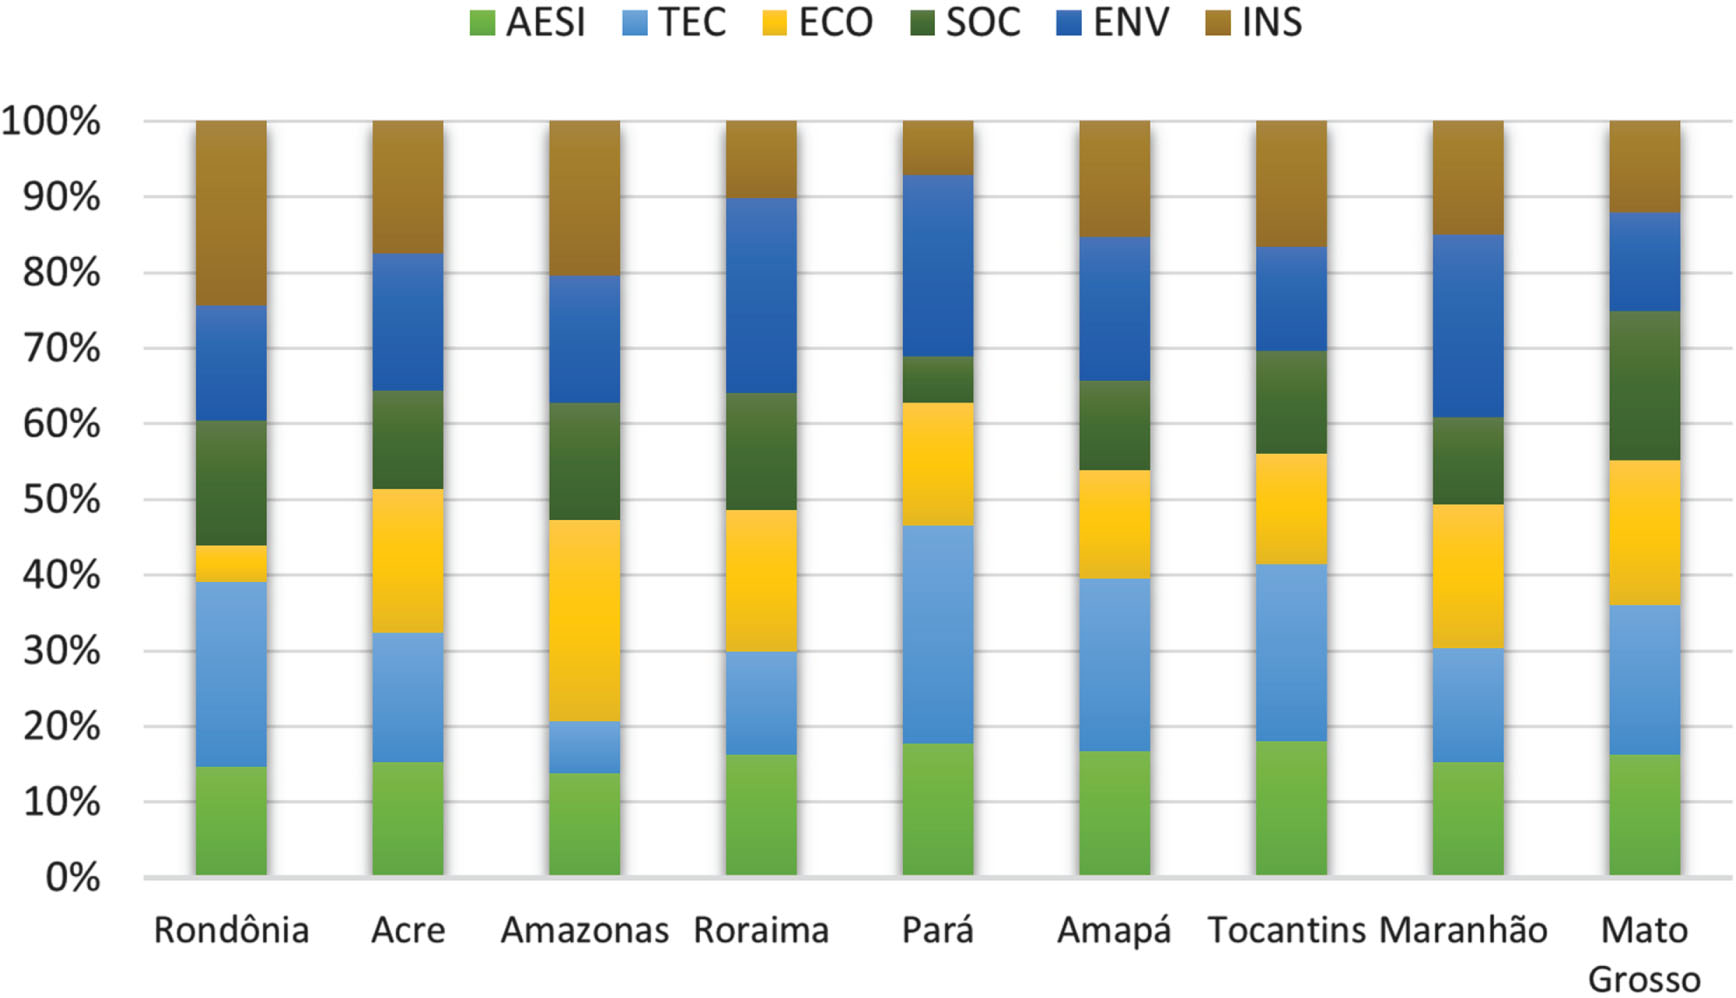
States of the Legal Amazon region, in relation to the sub-indices and final AESI index
An outcome that needs to be noticed is the suitability indexes results were different depending on the considered measure. Since there are differences between the compared States more than one index needs to be considered because a specific index may be good for a State, however, other indexes may be not. Again showing that a compete evaluation needs to take into account more indexes.
Evaluating the dependence on fossil fuels in the Legal Amazon region, the state of Amazonas has a high dependence on this resource since there are 265 thermoelectric plants in the Amazon region, 170 of these are in the state of Amazonas and use diesel for electric power generation.
As seen in the radar graph in Figure 7, there is a disadvantage in the state of Amazonas in relation to Pará in the technical indicators but this does not reflect much on the environmental aspect and indicators since deforestation does not interfere in this generation because diesel is used, which is a mineral resource.
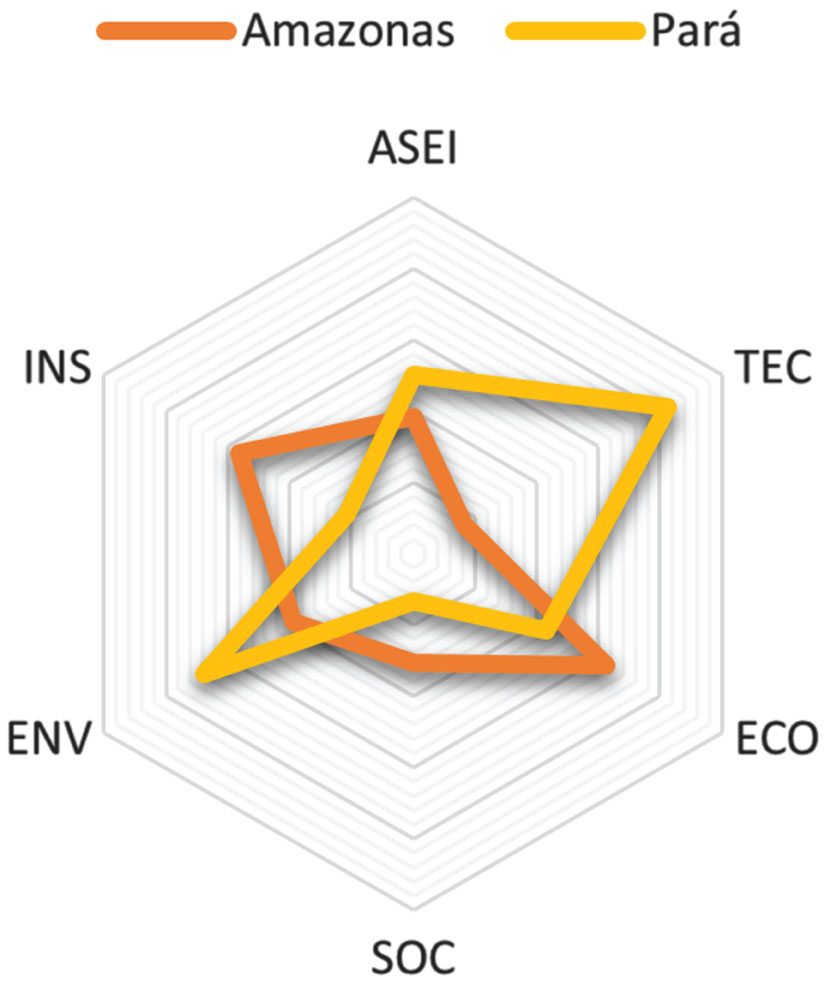
States of Pará and Amazonas, in relation to sub-indices and final index.
When comparing the economic and institutional relationship between the states of Pará and Amazonas, the Manaus Industrial Sector in the state of Amazonas employs approximately 100,000 workers in the areas of electronics, computers, and motorcycles, increasing economic and energy productivity due to the production of these technological complex products, helping to improve the INS2 and ECO2 indicators. Beyond the agricultural productivity and specialized labor with large-scale agriculture, Mato Grosso is responsible for 31 million tons produced in 2019 of the 39 million tons of the entire Brazilian Legal Amazon [50], justifying the similarity in the economic indicators of the states of Pará and Maranhão presented in Figure 7 in which the final economic index achieved were 0.432 and 0.413 and at the final social index with 0.133 and 0.286 in these 2 states respectively.
The agricultural productivity contributes to establishing renewable power plants producing ethanol in Mato Grosso which had 12 Ethanol Mills at the end of 2021 increasing renewable energy generation in relation to primary total generation [51], one of the technical indicators (TEC2) considered in this paper.
Regarding the economic and social aspect, which highlights the great advantage of Mato Grosso over Pará presented in the radar graph of Figure 8, this is mainly associated with the agricultural activity in the Legal Amazon region of Mato Grosso, which corresponds to 32% of the total, while the state of Pará has a share of only 13%, losing out to Maranhão in this regard with 19.4 %.
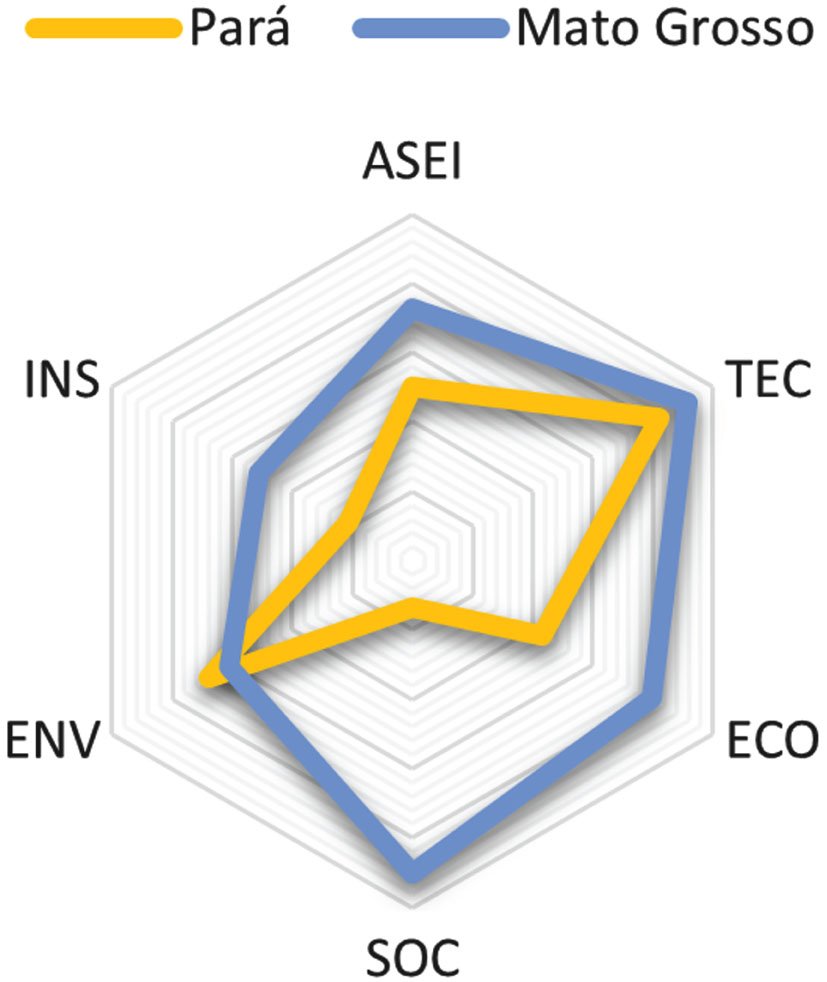
Comparison Pará with Mato Grosso.
From the radar graph comparing the states of Maranhão and Pará (Figure 9), there is a similarity in environmental and social aspects, which can be correlated with another study on deforestation, which saw similar reductions in the two states analyzed, although the state of Pará had a larger deforested area according to Reydon, Fernandes, and Telles [52]. In their work, it is proposed governance models so that there would be effective regulation of land ownership in the State of Maranhão within the Legal Amazon region.
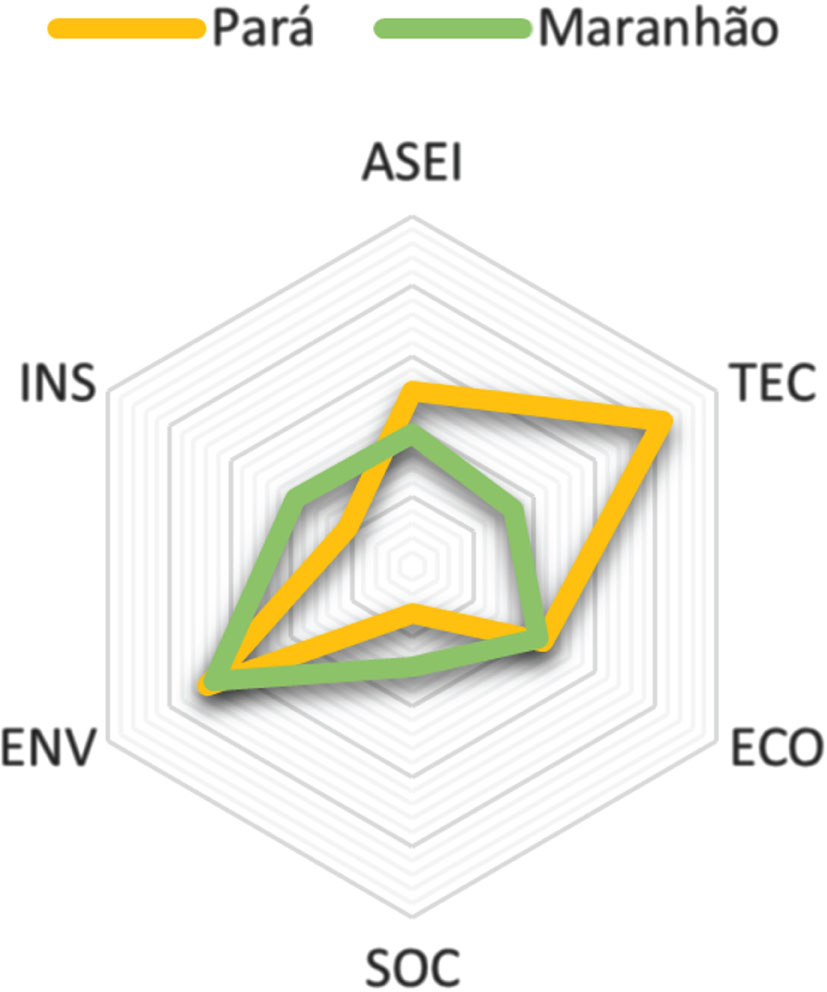
Comparison Pará with Maranhão.
Since public lands in this area that are not registered are subject to private appropriation at no cost, there is a high level of positive disparity in the state of Pará in the technical and economic spheres, as can also be seen from the fact that the Pará Land Institute was created in 1975, while the Maranhão Institute for Colonization and Land was only created in 1995, i.e. 20 years later, showing that within the institutional contexts, The state of Mato Grosso created and founded its institution in the same year as Pará, having more similar characteristics in these indicators to Pará than Maranhão within this analyzed sphere, which is shown in the comparative radar graph between the states of Mato Grosso and Pará [52].
Comparing the results to Rorato et al. [53], they found through a vulnerability assessment in the Legal Amazon, concluding that the states of Pará, Roraima, and Maranhão have the highest vulnerability index in indigenous lands, 16 of the 19 indigenous areas in the state of Maranhão were classified with a high vulnerability index because these areas are more exposed to the arc of deforestation according to a spatial analysis by INPE and data from SisArp and FUNAI, and which could also be used as a sub-indicator in future work on this study, which was not allocated.
It is essential to acknowledge that while fuzzy logic offers valuable advantages, its successful implementation hinges on the quality and accuracy of the input data, as well as the robustness of the chosen fuzzy inference system. Regular updates and refinements to the model will be necessary to keep pace with evolving conditions and emerging data sources.
Theoretical implications
An extra Energy Sustainability Index gives more insists for decision making in the evaluation of sustainability, besides the use of Fuzzy logic which has additional features considered for a broad evaluation.
Conclusions
The use of fuzzy logic in the evaluation of Amazon’s energy sustainability presents a promising approach that addresses the inherent complexities and uncertainties associated with such a multifaceted and dynamic issue. The Amazon, as one of the world’s most ecologically diverse and significant regions, demands a comprehensive and adaptable assessment methodology, which fuzzy logic provides by allowing for the integration of imprecise, vague, and uncertain data.
By incorporating fuzzy sets, membership functions, and fuzzy inference systems, the evaluation process can account for the intricate interplay between various environmental, social, and economic factors that contribute to Amazon’s energy sustainability. Fuzzy logic’s ability to handle subjective and qualitative information enables a more holistic understanding of the sustainability landscape, while its flexibility supports scenario analysis and sensitivity testing.
The result of 0.539 using the AESI index for Brazilan Legal Amazon is higher than the North region of Brazil and several states, indicating the sustainability of Brazilan Legal Amazon needs to be observed since is higher than other compared places. Furthermore, fuzzy-based evaluations can enhance decision-making by providing decision-makers with quantifiable insights into the trade-offs and synergies between different sustainability dimensions. This, in turn, can guide the formulation of more balanced and effective policies and strategies that align with the unique challenges and opportunities present in the Amazon region.
In essence, the utilization of fuzzy logic in assessing Amazon’s energy sustainability underscores the need for innovative and adaptive approaches in tackling complex environmental challenges. By embracing fuzzy logic’s capacity to handle uncertainty and imprecision, stakeholders can foster a more nuanced and comprehensive understanding of energy sustainability in the Amazon, thus contributing to better-informed decisions and actions that safeguard this vital global ecosystem for generations to come.
The future application of fuzzy logic to sustainability indices presents a promising avenue for enhancing the precision and flexibility of sustainability assessments. Fuzzy logic, known for its ability to handle imprecise and uncertain data, offers a means to more accurately capture the intricate and evolving dimensions of sustainability.
The fuzzy logic holds the potential to create adaptive, context-aware sustainability indices that better reflect the complex, multifaceted nature of sustainability challenges. As we strive to navigate a rapidly changing world, leveraging fuzzy logic in sustainability indexing may provide a valuable tool for measuring progress and guiding policy toward a more sustainable future. Additionally of what was proposed in this paper, in future works other inputs can be used to evaluate the sustainability index, such as a time series that will show the variation of this index over time.
Conflict of interest
The authors declare that they have no conflict of interest.
Acknowledgments
Special thanks to researchers Stefenon, S.F. and Lopes, M.N.G., for their important contributions to this research. The authors would like to thank the Coordination for the Improvement of Higher Education Personnel (CAPES) for the scholarship number 88887.808258/2023-00, and Council for Scientific and Technological Development (CNPq) for the grant number 310447/2021-6.