
Abstract
With the ongoing evolution of the novel coronavirus pathogen and continuous improvements in our social environment, the mortality rate of COVID-19 is on a decline. In response to this, we introduce an adaptive control strategy known as intentional control, which offers cost-efficiency and superior control effectiveness. The classical SEIR model faces limitations in accurately representing close contacts and sub-close contacts and fails to distinguish their varying levels of infectivity. To address this, our study modifies the classical model by incorporating close contact (E) and a sub-close contact (E2) while reworking the infectious mechanism. Once the model is formulated, we employ various statistical methods to identify crucial parameters, including R2, adjusted R2, and standard deviation. For disease control, we implement an intentional control program with four distinct grades. We develop and apply a scheme in MATLAB for our proposed model, generating diverse simulation results based on realistic parameter values for discussion. Additionally, we explore a range of strategy combinations to differentiate their effectiveness under various social conditions, aiming to identify an optimal approach. Comparing the intentional control strategy to random control, our findings consistently demonstrate the superiority of intentional control across all scenarios. Furthermore, the results indicate that our approach better aligns with the characteristics of the novel coronavirus, characterized by an “extremely low fatality rate and strong infectivity,” while offering detailed insights into the transmission dynamics among different compartments.
Introduction
The epidemic COVID-19 is a highly contagious respiratory infection caused by the SARS-CoV-2 virus and was firstly identified in Wuhan, China. Till date, the disease infected 586.53 million people around the globe, accounting for 7.6% of the world’s total population. The total number of death cases is 6.43 million. It has a profound impact on the politics, economy, and culture of the world. The most effective way to prevent the epidemic from having a worse impact on society is to control its spread. The core of control is to focus on the three elements of the infectious source, the transmission routes, and the susceptible. Facilitating the recovery of the infected persons is one way to get rid of the infection’s source, although this is frequently a difficult process. An effective technique of reducing the transmission routes is to wear masks and to conduct effective quarantine, which is proven to be feasible. A possible way to protect people from the infection is by giving them vaccines and keeping an eye on their health regularly.
In 2019, Brilhante, Gomes and Pestana simulated a dynamic extreme event model and the model was obtained by adding some aspects of the infection to the Verhulst model, notably by including backtracking related characteristics [1]. Bergström et al. [2] deeply learned about human heritable variation and the population history of 929 different genomes. Beare and Toda [3] studied the power law problem in distribution of COVID-19 cases. In 2020, Behr et al. [4] introduced a statistical method that provides robust statistical assurances. This method is designed to assess the relationship between response variables and a stable tree structure at all levels of the hierarchy with a high level of sensitivity, all the while considering and controlling for the overall false-positive error rate.Barnard et al. [5] predicted potential dynamics of SARS-CoV-2 infections, hospital admissions and deaths in Great Britain to December 2022 by modeling mid-stage dynamics of the disease due to the Omicron. Bastard et al. [6] pointed out that an autosomal recessive IFNAR1 deficiency is a rare congenital immunity error, with the basis on susceptibility to attenuated live vaccine and wild viruses. Choi et al. [7] proposed a rumor spreading multi-stage SIR model. Cássaro et al. [8] predicted the occurrence of COVID-19 cases through a simple growth model. Lin et al. [9] pointed out that strategic COVID-19 vaccine distribution can simultaneously elevate social utility and equity. Maximilien et al. [10] showed that the Blursday database provided quantitative insights on the effects of lockdown (stringency and mobility) and subjective confinement on time perception (duration, passage of time and temporal distances). According to Karlen [11], a new population modeling framework built on a discrete-time difference equation can be used to characterize the broad characteristics of the disease’s spread. Dell’Anna et al. [12] studied a simple realistic model for describing the diffusion of an infectious disease in a population and predicted the dynamics of COVID-19 in Italy. Freire-Flores et al. [13] studied COVID-19 in Chile by adopting a multi-group SEIRA model. In 2022, Rosenfeld and Tomiyama proposed that investigating the relationships between morality and the act of comparing oneself to others in a more advantageous social position (upward social comparison) may help explain the causes of vaccination reluctance [14]. They arrived to this finding through a well-planned research that includes pre-registered and unvaccinated persons in the United States.Alison et al. [15] established a stochastic SIS model and rigorously analyzed it for stability. Hellewell et al. [16] studied the controlling of COVID-19 outbreak by isolation of cases and contacts through a stochastic model. Lees et al. [17] pointed out that social norms can be an effective way to promote public health awareness and encourage healthy behaviors of individuals. In 2022, Joel et al. demonstrated how variations in cumulative reported cases and deaths, categorized by country, state, and date, illustrate the concept of Taylor’s law of fluctuation scaling [18]. Farias and Pilati [19] used the theory of planned behaviors as a framework to predict intentions of noncompliance with social distancing during the COVID-19 pandemic and in parallel, assessing the predictive role of intolerance of uncertainty and sociodemographic variables. In 2020, Kraemer et al. conducted a study examining the impact of human mobility and control measures on COVID-19 in China [20]. Kosmicki et al. [21] emphasized that COVID-19 did not exhibit significant connections with infrequent protein-coding variations characterized by observable impact sizes, considering the sample sizes available at that time. Matt et al. [22] predicted the development state of COVID-19 in Great Britain in 2021 by using a model. Liang [23] analyzed the spreading rules through mathematical model analysis of infection kinetics for COVID-19, SARS and MERS. Goldberg et al. [24] pointed out the intentions of COVID-19 vaccination of young people. Hagger et al. [25] predicted social distancing intentions and behaviors during the COVID-19 pandemic through an integrated social cognition model. Tang et al. [26] studied the effect of social norm interventions in changing the clinical behaviors of healthcare workers. Agranov, Elliott and Ortoleva [27] studied how individual decisions were affected by those of other members of the society in the process of COVID-19 vaccination. Cariou et al. [28] highlighted that the COVID-19 pandemic was attributed to SARS-CoV-2, a newly identified coronavirus that originated from a bat reservoir and subsequently spread to humans. Tigist and Christl [29] assessed the impact of repeated rapid test strategies on the effectiveness of at-home antiviral treatments for SARS-CoV-2. Rabb et al. [30] found a strong relationship between perceived vaccination social norms and vaccination intentions when controlling for real risk factors (e.g., age), as well as dimensions known to predict COVID-19 preventive behaviors (e.g., trust in scientists). Perc et al. [31] showed forecasts obtained with a simple iteration method. Pairo-Castineira et al. [32] revealed the genetic mechanism of COVID-19 by studying genomes of 2,244 critically ill patients with COVID-19 from 208 UK intensive care units. Nakov et al. [33] constructed an information system to fight COVID-19 disinformation. Victoria et al. [34] demonstrated the power of multi-omics pandemic tracking and genome analysis in the aspect of revealing distinct epidemiologic, genetic, and biological associations for those at the highest risk. Edyth et al. [35] highlighted via research that regional connectivity and travel by land were driving factors of viral transmission in the Middle East. Effective travel restriction plans should include both the dangers associated with cross-border land travel as well as those associated with cross-border air travel.Han et al. [36] studied the trust in government regarding COVID-19 and its associations with preventive health behaviors and prosocial behaviors during the pandemic. Schaback [37] revealed how the disease spreads, the current state and what needed to be done by creating a mathematical model. Arias-Carrasco et al. [38] proposed a new tool (Outbreak) for studying and visualizing epidemiological data to guide and help health authorities to intervene and minimize the effects of outbreaks. Reitsma et al. [39] tracked COVID-19 disparities and developed equity-focused public health programming that mitigated the effects of systemic racism and could help improve health outcomes of California’s populations of color. Joren et al. [40] disclosed that backward traced contacts required fewer tests and shorter quarantine in COVID-19, and thus the efficiency was higher. Alexey [41] established an SIRS-model with dynamic regulation of the population. Sonnino, Giorgio [42] established a differential equation governing the evolution of COVID-19 with a high prediction effect. Sinclair and Agerström [43] studied the influence of social norms on young people’s willingness to take COVID-19 vaccine. Rudert and Janke [44] highlighted the power of descriptive norms in increasing compliance with pandemic-related regulations and promoting future prosocial behaviors. Tian et al. [45] investigated transmission control measures during the first 50 days of COVID-19 epidemic in China. Cruwys et al. [46] demonstrated that perceived COVID-19 risk was attenuated by ingroup trust through three empirical studies. Verhulst [47] studied the population increase law. Vespignani et al. [48] revealed the transmission mechanism of COVID-19 and the work needed in the future by creating a mathematical model. Wright [49] proposed a non-linear difference-differential equation. Bruin et al. [50] studied the relationship between vaccination coverage in social circles (including family, friends and acquaintances), self-vaccination behaviors and potential intermediaries. Worldometer [51] disclosed countries where COVID-19 had spread. Xu and Kraemer [52] showed a way to obtain epidemiological data of COVID-19. Wang et al. [53] verified the effectiveness of measures such as testing, contact tracking and case quarantine in curbing the spread of COVID-19. Chen and Sokolova [54] studied what people pay more attention to during the epidemic via topics of posts.
To manage and control an epidemic within a theoretical framework, we have two different types of approaches: the random control and the intentional control. In the inspection of epidemic, the utility of a random sampling technology is almost the same as that of comprehensive inspection, so that a system formed by the epidemic is actually a scale-free system. Under random control, the epidemic is robustness. This means that in the random control, some of the variables are subject to stochastic processes and the system has an inherent uncertainty which forms the system uncontrollable. The intentional control on the other hand, is a deterministic one and involves planned and deliberate decisions to control the system. As in the intentional control, we have a clear goal in mind and thus it makes an epidemic vulnerable. Furthermore, random control means that people with a relatively large probability should be controlled, on the contrary, intentional control means that the most important or serious people should be controlled.
Because of complexity of intentional control, there are many studies focus on random control. Niño-Torres et al. [55] developed a stochastic epidemiological SEIR model with random perturbations and analyzed the dynamics of the COVID-19 pandemic in the city of Bogotá D.C., Colombia. The model governs the dynamics of COVID-19 impacted by social behaviors and allows for projecting the number of infected, recovered, and deceased individuals considering the confinement and partial relaxed restrictions as control measures. Li et al. [56] introduced a stochastic model that describes the transmission dynamics of COVID-19 while considering the social distance, musk wearing, and other human behavior as control strategies. Both of these studies assume an objective functional which take into consideration both the limitation of social distance. The former research studying the control from a pure mathematical point of view while the later minimizes the infected population by just solving the problem numerically.
The theory of random control of epidemic has a rich literature and numerous researchers have discussed random control measures such as suspension of urban public transport, closure of entertainment venues, and prohibition of public meetings, case quarantine and contact tracking. Although we have achieved certain results by implementing random control, critics believe that its cost is too high, and its effect is too poor. Thus, the epidemic should be controlled by means of intentional control. Eraso and Hills [57] used a mixed method analysis and studied the intentional and unintentional non-adherence to social distancing measures during COVID-19. Their findings suggest that government partnerships with local communities are essential to enhance unintentional and intentional non-adherence, fostering trust in social distancing measures. Tailored messaging targeting young adults should emphasize the importance of protecting others while clarifying the risks of transmission. Collaborating with environmental health officers is crucial to ensuring COVID-secured environments. The previous studies are very successful, but there is one question that needs to be considered: Is the virus transmitted to others non-selectively or selectively? Additionally, it’s important to consider whether the epidemic is spreading within populations with specific levels of physical fitness. If this hypothesis is true, we can see that virus transmission has a great relationship with the social network structure of person-to-person communication. If this assumption is correct, we need to analyze the characteristics of viruses under intentional control and deliberate control(s) according to the control theory within a complex network, and give more accurate control strategies, which is the main goal of this paper.
At present, the most favorable model to describe how the virus propagates among the individuals is the SEIR model.However, the classic SEIR model cannot reflect the problem in a realistic way because the exposed individuals have one type of infectivity, whereas, the close contacts and sub-close contacts have different types of infectivities. Motivated by the above facts, we propose the following hypothesis:
In the present work, we have the following major contribution and thus the novelty of the manuscript could be noticed. The work aims to compare the intentional and stochastic control strategies for reducing the spread of COVID-19. On the basis of comparative analysis, the research will provide insights into the most efficient and cost-effective strategies for mitigating the disease.The traditional models are based on homogenous spreading of the virus within a population; however, this work introduces the concept of selective/non-selective transmission of the virus. With the help of such identification of the virus, we can follow the social network structure of person-to-person contacts and thus the disease could be easily and effectively controlled. The control strategies being adapted may not be fixed and could vary with time particularly when the disease persist for long time within the population. One possible solution for overcoming this issue is to use adaptive control strategies as such policies may vary with time as the characteristics of the epidemic varying. Therefore, the proposed adaptive control strategies based on the dynamic change of the epidemic’s destructive power is another novel aspect of the present study. Finally, the traditional SEIR models are not considering the close contacts and sub-close contacts of the exposed population and here we have included this phenomenon which accurately reflects the dynamics of COVID-19.
As of August 4, 2022, the new diagnosed cases of COVID-19 were 295,082,519;among these 951,540 are the new deaths and 0.3225% new deaths have been recorded globally. Compared with the current global average mortality rate of 1.0964%, the new mortality rate has decreased hugely since the outbreak. In the face of this reality, we modified the classical SEIR model and further, we established four distinct scenarios, each with varying degrees of medical and health conditions, personnel mobility control measures, transmission rates, and improved vaccination conditions–ranging from high to low levels. In each scenario, we assessed various degrees of deliberate control measures and examined the impact of distinct intentional control strategies within each specific condition. Our objective was to determine the effective scope of intentional control measures for each condition.Finally, the scale and investment of intentional control and stochastic control were discussed and compared under the same effectiveness, and a conclusion is drawn.
Modified SEIR model for evolution of COVID-19
The SEIR model is mainly used for those diseases where an individual could passes from the four stages, namely; S (Susceptible), E (Exposed), I (Infectious) and R (Recovered). The susceptible refers to healthy persons who lack immunity and are vulnerable to infection after making contact with the infectious; the exposed refers to persons who made contact with the infectious but is not infectious; the infectious refers to clinically diagnosed infected person; and the recovered refers to persons who have immunity after recovery. If an infectious disease has the lifelong immunity upon recovery, it cannot come back to the S, E or I. If the immune period is limited, it can be changed into S again, and then could be re-infected. Diagrammatically, this flow of individuals is shown in Fig. 1.

Schematic diagram of SEIR model.
According to the relationship between the four groups, we can mathematically capture the dynamics of these compartments by the following recursive relations:
The variables S n , E n , I n , R n shows the number of susceptible, exposed, infected and recovered individuals at state n and likewise, the sizes of these populations in the previous state n–1 are described by Sn-1, En-1, In-1, Rn-1. The disease spreads in the community whenever the susceptible individuals S n –1 come into contact with the infected I n –1 and exposed E n –1 population at constant rates β1 and β2. All such contacts will not lead toward infection, instead, a fraction r1 and r2 of these contacts will yields the infection. The exposed population will move to the infected compartment at a rate a and hence the term aE n –1 should be subtracted from the equation governing the dynamics of the exposed population and the same should be added to equation describing the dynamics of the infected class. The parameter c denotes the recovery rate of the exposed class and thus the term cE n –1 will be subtracted from the equation for the exposed population and will be added to the equation for R class. Likewise, the notion g is the recovery rate of the infected compartment and in the same analogy gI n –1 will be subtracted from the I compartment and will be added to the recovered compartment. The total deaths due to the infection are accumulated in the term dI n –1 and hence should be subtracted from the class describing the dynamics of the infected population. The immunity to the infection is not permanent, that is, a recovered person could be vulnerable to the infection again. Therefore, we subtracted the term hR n –1 from the equation responsible for the dynamics of the recovered class. The total population is denoted by N which the sum of all four compartments is at any stage. The biological interpretations of the rest of the parameters used in the model are presented in Table 1.
Explanation of variables of SEIR
Explanation of variables of modified SEIR
Model (1.1)–(1.4) is very simple model although it can be used for modeling various infectious diseases. However, in case of COVID-19, close contacts and sub-close contacts have certain types of infectivity in addition to I. Further,the infection COVID-19 is not only a linear model of S⟶E⟶I, but a multi-line mode of S⟶E⟶I caused by I and S⟶E⟶I caused by E, while the classic SEIR model does not reflect such infectivity. Second, the close contacts and the sub-close contacts are inconsistent in infectivity, the close contacts have the higher infectivity than the sub-close contacts, and the classic SEIR model cannot reflect the difference between the close contacts and the sub-close contacts.Thus, it is genuine to update the classic SEIR model, and the original E (exposed) of the model is divided further into E (close contacts) and E2 (sub-close contacts).
The modified SEIR model has the following three advantages. Firstly, E is split into two levels of E and E2 to effectively simulate the close contacts and the sub-close contacts respectively, so that the two different populations are distinguished, and a base is provided for subsequent precise intentional control. Secondly, the different infectivities of E and E2 are distinguished. Thirdly, due to the extremely low fatality rate at present, the death population is not directly calculated. In summary, the modified SEIR model better holds the characteristics of “extremely low fatality rate and high infectivity” of the novel coronavirus at present time, conducts more detailed simulation on the transmission relationship among the susceptible, the sub-close contacts, the close contacts and the infectious, and makes the implementation of a precise and possible intentional control strategy. The movements among the compartments are shown grammatically in Fig. 2.
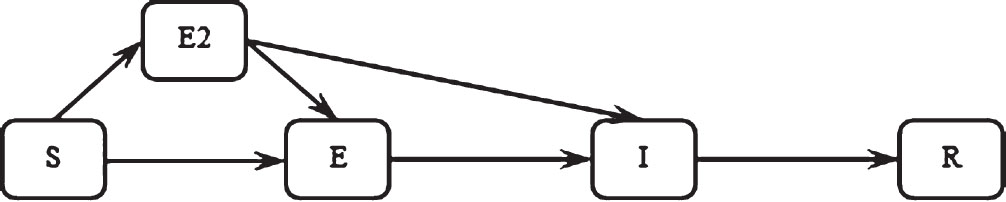
Schematic diagram of modified SEIR model.
Theoretically, at any stage n, we have the total population N = S n + E n + E2 n + I n + R n . Given the exceptionally low mortality rate, we are not currently factoring in the scenario involving deceased individuals. With the help of these assumptions, we have the following recursive relations describing the dynamics of the next subject to a known previous state of the variables:
The variables S n , E n , E2 n , I n , R n shows the number of susceptible, exposed (close contacts), exposed (sub-close contacts), infected and recovered individuals at state n and likewise, the sizes of these populations in the previous state n–1 are described by S n –1, E n –1, E2 n –1, I n –1, R n –1. The disease spreads in the community whenever the susceptible individuals S n –1 come into contact with the infected I n –1, E n –1 and E2 n –1 populations. Here, we assumed the constant contact rate β. Here again, not all such contacts will lead toward infection, instead, a fraction r of these contacts will yields the infection. The population E n –1 will move to the infected compartment at a rate a and hence the term aE n –1 should be subtracted from the equation governing the dynamics of the exposed (close contact) population and the same should be added to equation describing the dynamics of the infected class. Likewise, the population E2 n –1 will move to the infected compartment at a rate aa. The death rate due to the infections is negligibly small and thus we have ignored the disease-induced mortality rate. The notion g is the recovery rate of the infected compartment and thus gI n –1 will be subtracted from the I compartment and will be added to the recovered compartment. The total population is denoted by N which the sum of all four compartments is at any stage.
If the regional reason is not considered, we have chosen the following values of the parameters.
When the population is walked randomly, the average population number in contact per person per day would be higher than the case that population is asked to stay at home, and is represented by r here, which is 20; the population has certain possibility to be close contacts, and the probability is β, which is 0.1; the probabilities that different grades of contacts are transformed to the infectious are unequal, and the probability of the close contacts transformed into the infectious is set to be a which is 0.13; the probability of recovery, denoted as g, is computed based on the global average fatality rate of 0.011, and the probability of recovery is 0.141 after adding a 7-day healing period; c is a radius of intentional control, 0 represents no intentional control, 1 represents intentional control only over the infectious, 2 represents intentional control over the infectious and the close contacts, and 3 represents intentional control over the infectious, the close contacts and the sub-close contacts; and p is the execution level of intentional control, since different countries (regions) are different in execution capability and medical and sanitary inspection capability and are not completely the same in inspection and tracing capability for close contacts and sub-close contacts, the concept of the execution level is introduced here, 0 represents complete and proper execution, in which found target populations can be controlled every day, and 50% represents that 50% of targets that need to be controlled are recognized and controlled. The scheme was developed for the model in Python and sample solution curves were generated as shown in Fig. 3.
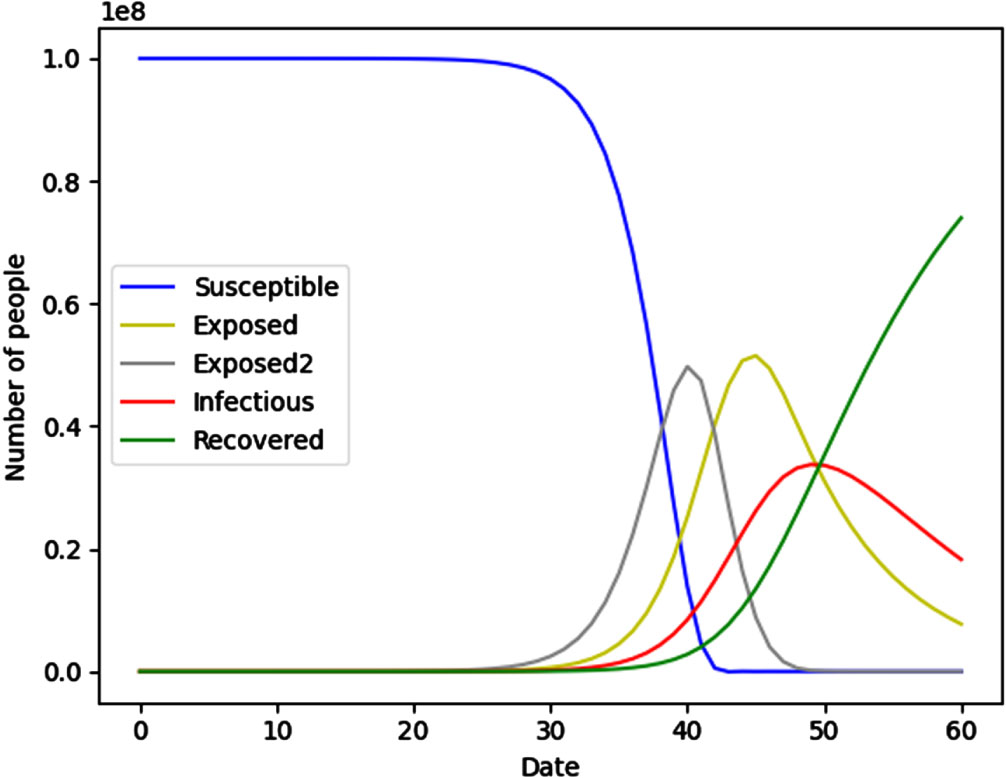
Modified SEIR model.
In the following sections, we compare data obtained through simulations using the modified SEIR model with the confirmed data for the United States during the initial four months of 2022, as illustrated in Fig. 4. It is apparent that, by comparison, a curve of the modified SEIR model (a curve of Infections in Fig. 3) and a curve of Result of America in Fig. 4 are substantially consistent in trend. Both the actual data from the United States and the simulated data have undergone residual analysis, as presented in Table 3. The Multiple R value, which stands at 0.9044, is relatively high, indicating that the model is generally suitable and can be considered reliable.
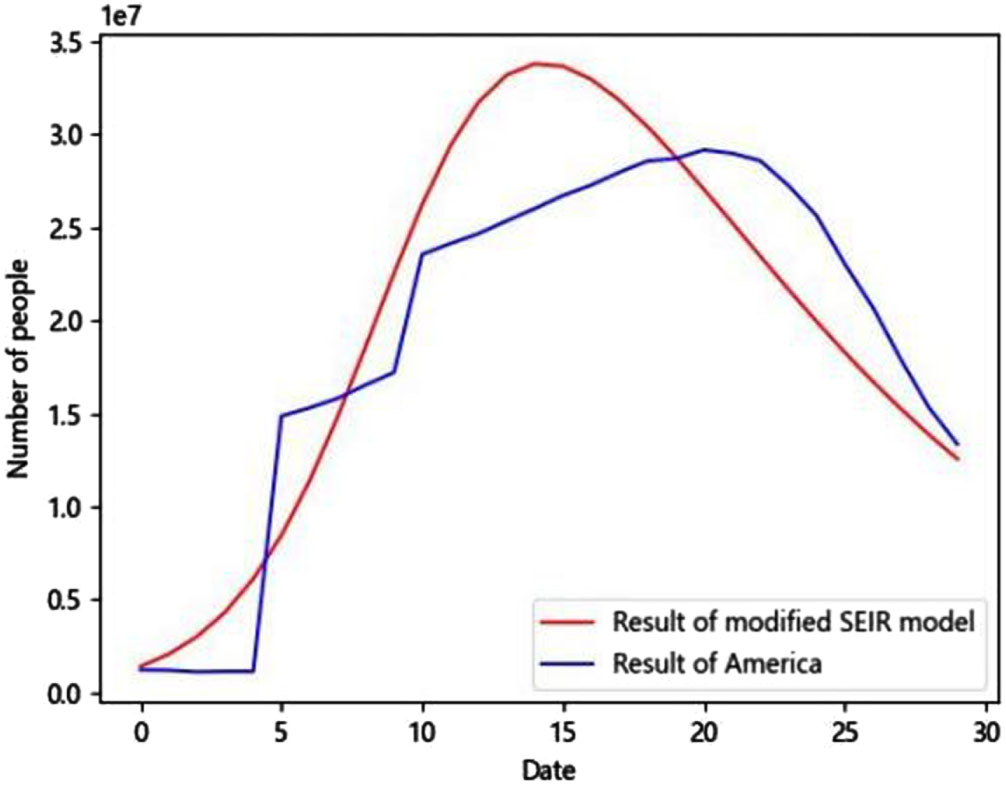
Results of modified SEIR model and America.
Explanation of variables of modified SEIR
Controlling the transmission routes of infection has consistently been a crucial concern. This is because, at the infection source, our primary approach involves treatment, which is closely associated with both medical and sanitary conditions, and it correlates with the variable “p,” representing the level of intentional control implementation. The transmission route of viruses from one person to another is realized through the transmission of air particles, if the contact probability between persons can be controlled, such contact probability can be effectively reduced, the susceptible can also be effectively protected, and therefore, the transmission of viruses can be effectively changed from the perspective of personnel flow, and cutting off the transmission route is mainly related to r (personnel flow) and β (propagation rate condition); and the best strategy to protect the susceptible is vaccination, which is directly related to a (the probability of close contacts transformed into the infectious).
In our study, we evaluated four distinct policy measures, each reflecting varying medical and sanitary conditions, personnel flow control measures, transmission rates, and improved vaccination strategies. We approached these measures from three key angles: eliminating transmission sources, interrupting transmission pathways, and safeguarding vulnerable populations. For each policy measure, we explored three scenarios, representing high, medium, and low conditions. Within each scenario, we examined different levels of intentional control, aiming to assess its effectiveness. Our analysis led us to identify effective ranges for intentional control within each unique condition.
Compared with random control, intentional control is a control that aims to rescue all those individuals which are at the highest risk and has precision and directivity. Four grades of intentional control are set in total: Grade 0 represents no control of any population, Grade 1 represents control over the infectious, Grade 2 represents control over the infectious and close contacts, and Grade 3 represents control over the infectious, close contacts and sub-close contacts.
As the level of intentional control increases, we observe a broader scope of control, stricter control measures, and subsequently, improved control outcomes.
Control strategy under different medical and sanitary conditions
Under different medical and sanitary conditions, the rescue capability for patients with COVID-19 is different. Correspondingly, countries (regions) with good medical and sanitary conditions can provide more resources for rescuing the patients, so are strategies that can be used; while countries (regions) with poor medical and sanitary conditions provide relatively few resources, so are strategies that can be used. Herein, simulation was conducted by adopting high sanitary capability (p = 0.2), medium sanitary capability (p = 0.5) and low sanitary capability (p = 0.8), the population was set to be 0.1 billion, the number of initial cases was 3, r was set to be 20, β was set to be 0.1, a was set to be 0.1 whereas, the value of g was taken to be 0.141.
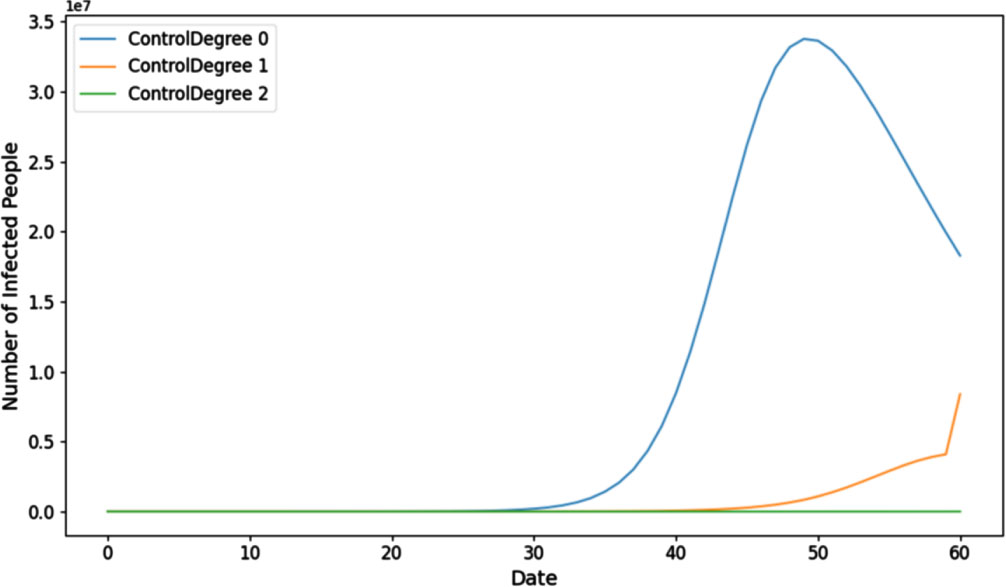
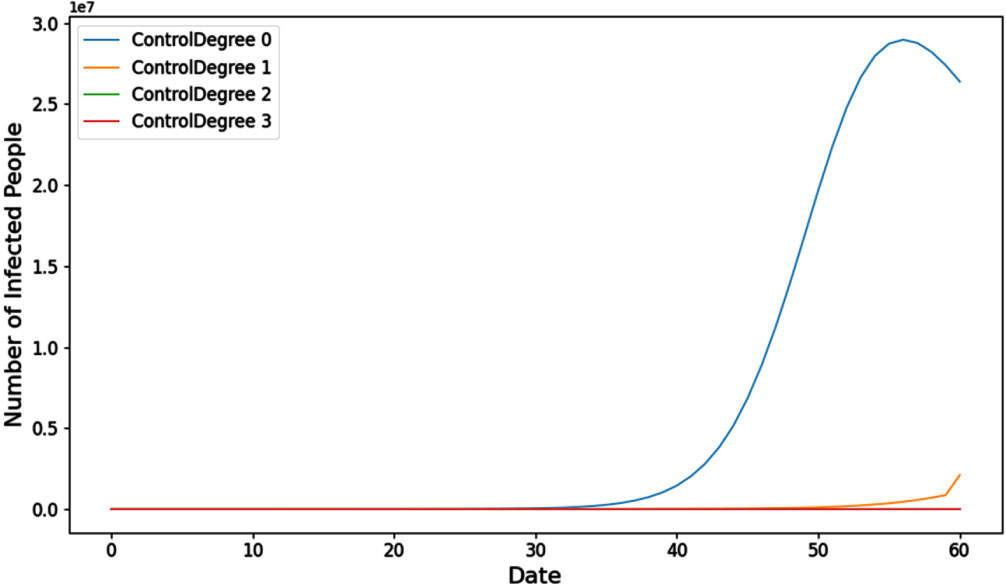
Organizing intentional control at grade 2 and grade 3 proves challenging in the context of low sanitary conditions. Therefore, we can only simulate intentional control at grade 1 in this scenario. The details of this situation are depicted in Fig. 5.
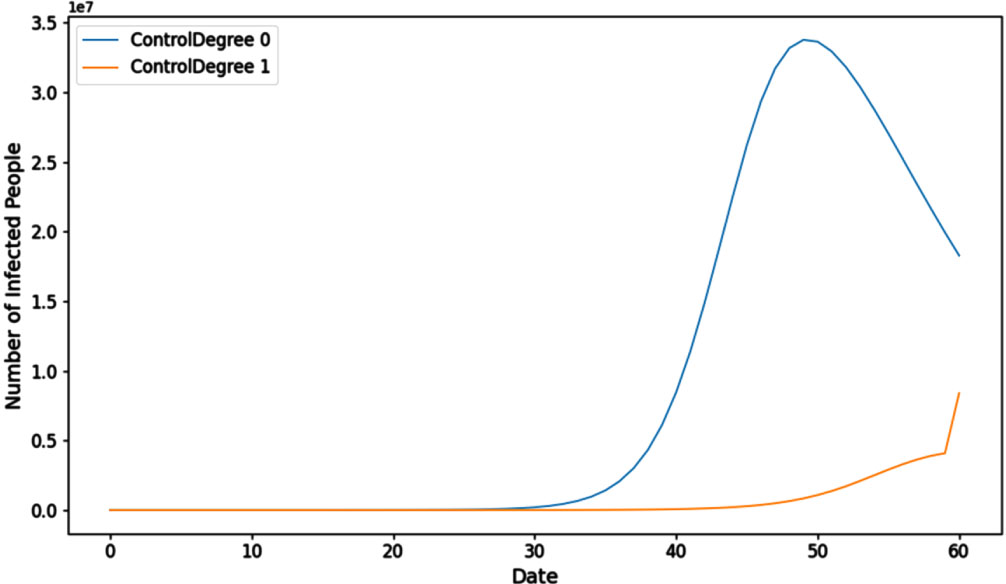
Multiple control strategies under low sanitary conditions.
Under the low sanitary condition, the epidemic broke out intensively on the 40th day (27,403,375 and 10,835,986 people were infected under the two strategies respectively). In this case, it is difficult to control the epidemic without external intervention after the outbreak. For instance, in early 2020, Wuhan harnessed the collective efforts of the entire nation to contain the epidemic’s spread. It’s important to note that this reference to low sanitary conditions does not imply that Wuhan had inadequate sanitary conditions; rather, it underscores the significance of coordinated efforts during a critical period.
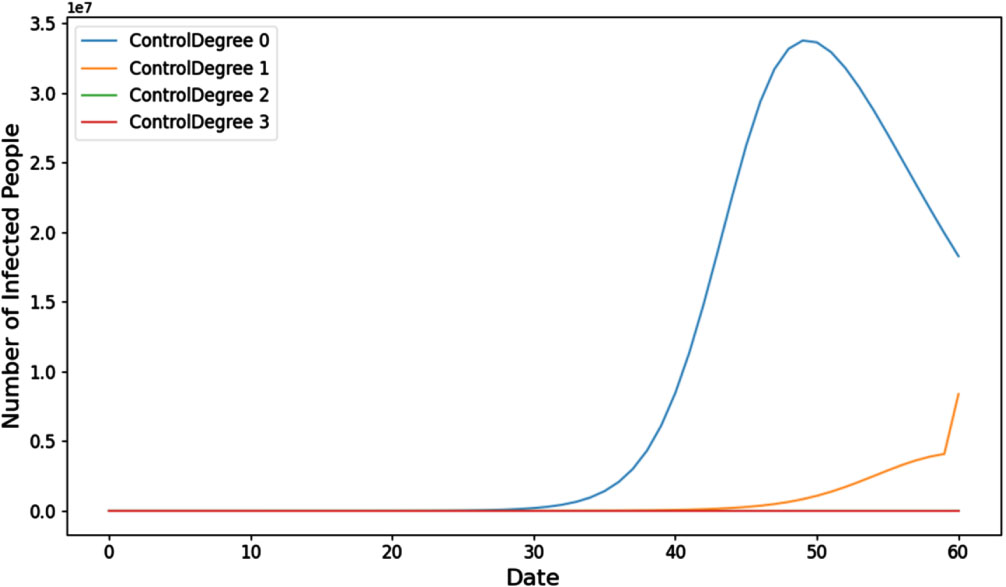
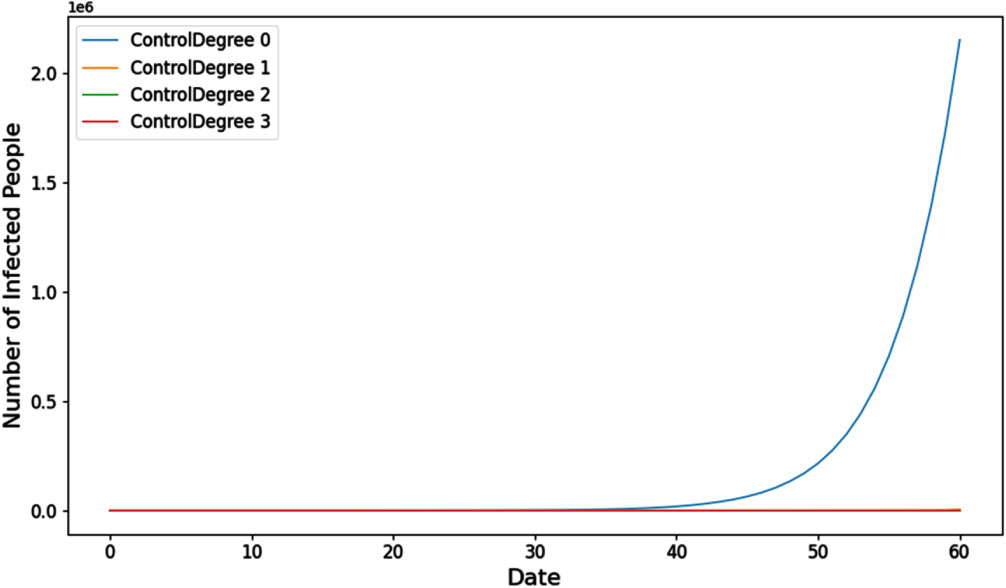
Intentional control of grade 3 is difficult to organize under the medium sanitary condition, therefore, only intentional control of grade 1 and grade 2 can be simulated, and the results are shown in Fig. 6.
Multiple control strategies under normal sanitary conditions.
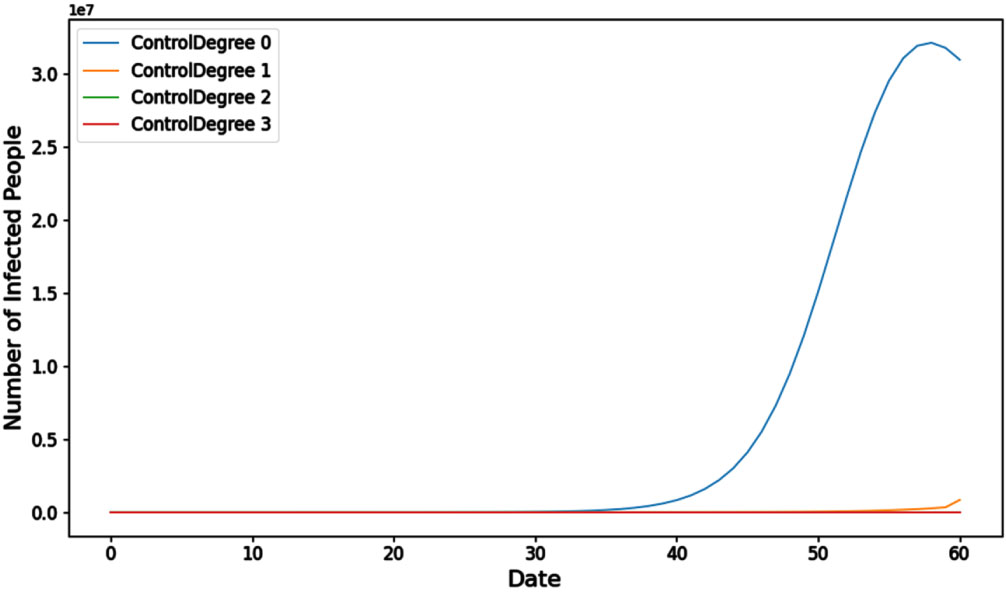
Under the medium sanitary condition, the epidemic broke out intensively on the 40th day (27,403,375, 860,683 and 88 people were infected under the three strategies respectively). The expected goal can be achieved by implementing intentional control of grade 2, and the better effect of epidemic prevention and control can be achieved through intentional control of the higher grade, but it is difficult to organize intentional control of grade 3 under the medium sanitary condition. Hence, if the scale of the epidemic outbreak remains relatively limited (within the capacity of intentional control at grade 2), it is possible to contain the epidemic using grade 2 control measures. However, in such cases, there is a narrower window of time available for epidemic suppression. If the time limit is exceeded, the epidemic will continue to expand, intentional control of grade 2 cannot effectively suppress the epidemic, and the situation can only be solved by relying on external forces. Figure 7 shows the compartment I subject to high sanitary conditions.
Multiple control strategies under high sanitary conditions.
In the context of high sanitary conditions, an intense outbreak of the epidemic occurred on the 40th day. Specifically, under the four different strategies, the following numbers of individuals were infected: 27,403,375, 144,860, 2, and 0 people, respectively.The best state can be achieved by implementing intentional control of grade 2, and the better effect of epidemic prevention and control can be achieved through intentional control of the higher grade. Under this condition, different intentional control strategies can be adopted according to the scale of the epidemic, intentional control of grade 2 can be adopted for a small scale, and intentional control of grade 3 can be adopted for medium-large scales.
From the above verification of multiple conditions, the transmission of the epidemic can be completely and effectively suppressed by executing intentional control of grade 3, in most cases, the epidemic can be suppressed by executing intentional control of grade 2, and if it is beyond the range, the epidemic must be overcome through total tranquility and comprehensive nucleic acid inspection. By increasing the sanitary conditions, there are high chances that source of infection could be eliminated, and ultimately, one requires more intentional control to deal with the epidemic. Table 4 shows results of multiple control strategies subject to various sanitary conditions.
Results of Multiple control strategies under different sanitary conditions
There is a social circle structure among people, that is, the activities of every person is limited to some space and has its own scope, which cannot be reflected through random control. In general, the faster the flow speed, the greater the population density, and as a result, the more likely the susceptible is in contact the infectious and the exposed, and the greater the probability of infection; and on the contrary, the smaller the chance of contact, the smaller the probability of infection. From the model, this feature is mainly represented by the parameter r.
Herein, simulation was conducted by adopting high population mobility (20 people), medium population mobility (15 people) and low population mobility (10 people), the population was set to be 0.1 billion, the number of initial cases was 3, β was set to be 0.1, a was set to be 0.13, g was set to be 0.141, and p was set to be 50%.
Under high population mobility (20 people), 19,935,002 people, 8,168,786 people, 2,886 people and 0 people were finally infected under the four strategies respectively. It is evident that by implementing grade 3 intentional control measures with the highest level of population mobility, it is possible to achieve the complete eradication of the epidemic, as depicted in Fig. 8.

Multiple control strategies under high population mobility.
Under medium population mobility (15 people), 31,772,967 people, 682,679 people, 93 people and 0 people were finally infected under the four strategies respectively. It can be seen that under the medium population mobility, the goal of suppressing the epidemic can be achieved by executing intentional control of grade 2, and the goal of eliminating the epidemic can be achieved by executing intentional control of grade 3, as shown in Fig. 9.
Multiple control strategies under normal population mobility.
Under low population mobility (10 people or below), 4,375,149 people, 5,839 people, 2 people and 0 people were finally infected under the four strategies respectively. Observations indicate that when population mobility is low, executing grade 1 intentional control measures can help maintain control over the scale of the epidemic within a specific range. While complete suppression of the outbreak may not be achieved, considering various other factors can further enhance the effectiveness of these measures. The goal of eliminating the epidemic out of the population can be completely achieved by executing intentional control of grade 2 and grade 3 as suggested by Fig. 10:
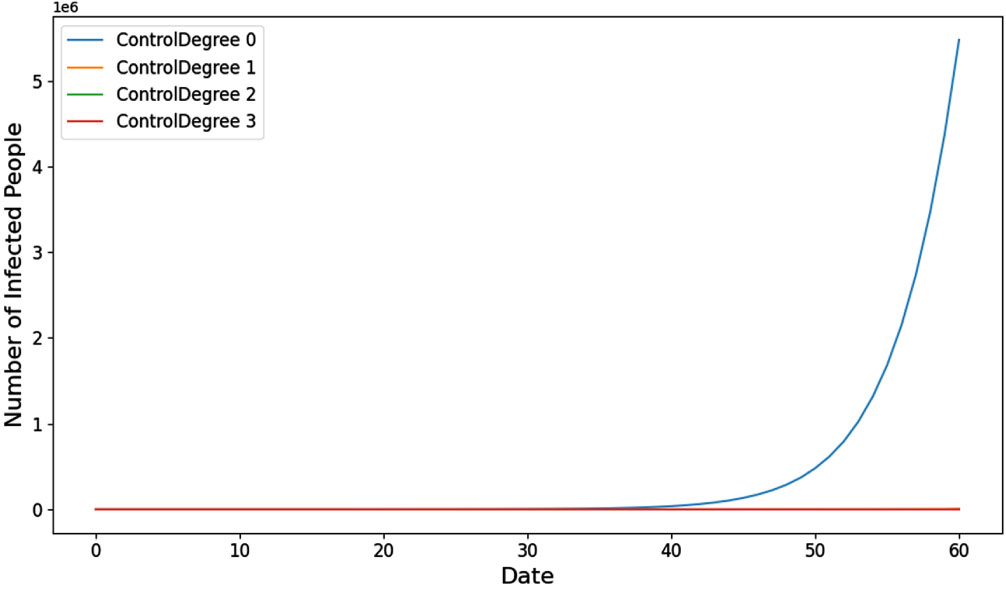
Multiple control strategies under low population mobility.
For economic development and social progress, personnel mobility cannot be completely restricted, which will cause more serious social and economic issues. Therefore, it can only be partial restriction or even no restriction. The following conclusions are drawn: Under the high population flow rate, the epidemic broke out intensively on the 30th day, reaching the peak on the 45th day, and the best state could be achieved by executing intentional control of grade 3; Under the medium population flow rate, the epidemic broke out intensively on the 45th day, executing intentional control of grade 2 had certain effects, and the better effect of epidemic prevention and control could be achieved through intentional control of the higher level; Under the low population flow rate, the epidemic broke out intensively on the 60th day, executing intentional control of grade 1 was effective, and the better effect of epidemic prevention and control could be achieved through intentional control of the higher level.
As the population flow rate increases, the available options for implementing intentional control measures to address the epidemic become more limited, as illustrated in Table 5.
Results of Multiple control strategies under different population mobility
According to disclosed literatures, “COVID-19 can be transmitted through cold chains, aerosol and other channels”, that is, COVID-19 has a faster infection rate under low temperature and high humidity conditions. Therefore, different conditions such as temperature, humidity, health and physical fitness (the average level of such indicators in a certain region and a certain period of time is basically fixed and balanced) make COVID-19 have different propagation rates. This rate is mainly determined by β.
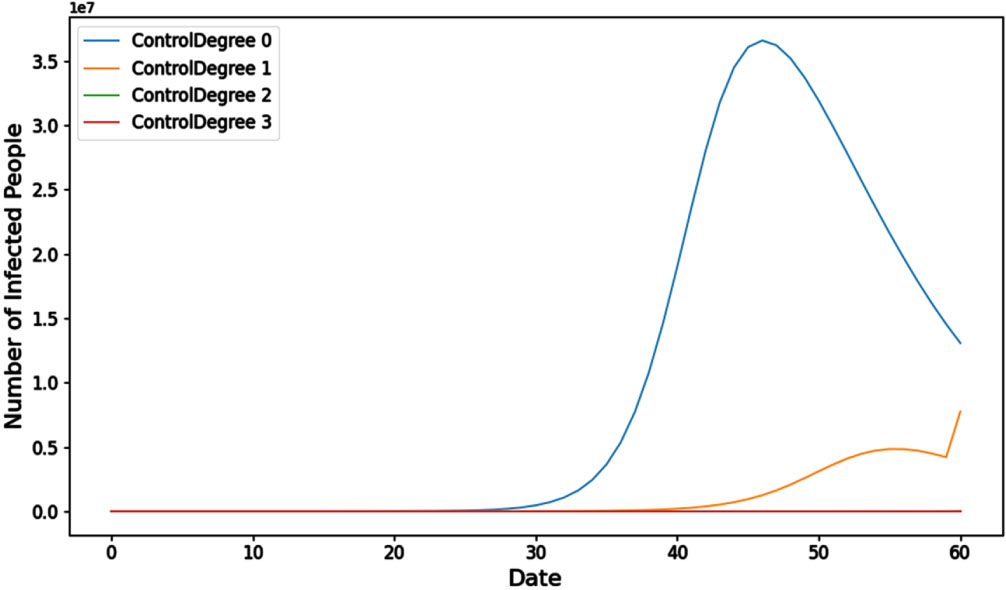
Different propagation rates were verified below via β, simulation was conducted by adopting a high propagation rate (0.10), a medium propagation rate (0.075) and a low propagation rate (0.05), the population was set to be 0.1 billion, the number of initial cases was 3, r was set to be 20, a was set to be 0.13, g was set to be 0.141, and p was set to be 50%.
The situation under the high propagation rate (0.10) is depicted in Fig. 11.
Multiple control strategies under high propagation rates.
As shown in Fig. 11, 19,935,002 people, 8,168,786 people, 2,886 people and 0 people were finally infected under the four strategies respectively. It is evident that when the propagation rate is at its highest, executing grade 3 intentional control measures can lead to the complete eradication of the epidemic.
The scenario under a medium propagation rate of 0.075 is depicted in Fig. 12.
Multiple control strategies under normal propagation rates.
As shown in Fig. 12, 31,772,967 people, 682,679 people, 93 people and 0 people were finally infected under the four strategies respectively. It can be seen that under the medium propagation rate, the scale of the epidemic can be effectively controlled by executing intentional control of grade 2, and the goal of completely eliminating the epidemic can be achieved by executing intentional control of grade 3.
The situation under a low propagation rate of 0.05 is illustrated in Fig. 13.
Multiple control strategies under low propagation rates.
As shown in Fig. 13, 4,375,149 people, 5,839 people, 2 people and 0 people were finally infected under the four strategies respectively. It can be seen that under the low propagation rate, the scale of the epidemic can be effectively controlled by executing intentional control of grade 1, and the goal of completely eliminating the epidemic can be achieved by executing intentional control of grade 2 and grade 3.
Based on the above simulations, we can draw the following conclusions: Under the high propagation rate, the epidemic broke out intensively on the 30th day, reaching the peak approximately on the 50th day, and the best state could be achieved by executing intentional control of grade 3; Under the medium propagation rate, the epidemic broke out intensively on the 40th day, reaching the peak approximately on the 60th day, the epidemic could be suppressed by executing intentional control of grade 2, and the better effect of epidemic prevention and control could be achieved through intentional control of the higher level; Under the low propagation rate, the epidemic broke out intensively on the 60th day, executing intentional control of grade 1 was effective to control the epidemic, and the better effect of epidemic prevention and control could be achieved through intentional control of the higher level.
Furthermore, it is apparent that as the propagation rate increases, the task of controlling the epidemic becomes more challenging, as indicated in Table 6.
Results of Multiple control strategies under different propagation rates
According to literatures, COVID-19 vaccine can effectively increase human body immunity and lower the probability of being infected with the novel coronavirus, thus achieving the function of protecting the susceptible. That is, the probability that the incubative is transformed into the infectious is lowered. The different vaccination rates are inconsistent in lowering degree for infection with the novel coronavirus.
Simulation of the vaccination rate of COVID-19 vaccine is mainly verifying the situation of a. Simulation was conducted by adopting a high vaccination rate (a = 0.05), a medium vaccination rate (a = 0.1) and a low vaccination rate (a = 0.15), the population was set to be 0.1 billion, the number of initial cases was 3, r was set to be 20, β was set to be 0.1, g was set to be 0.141, and p was set to be 50%.
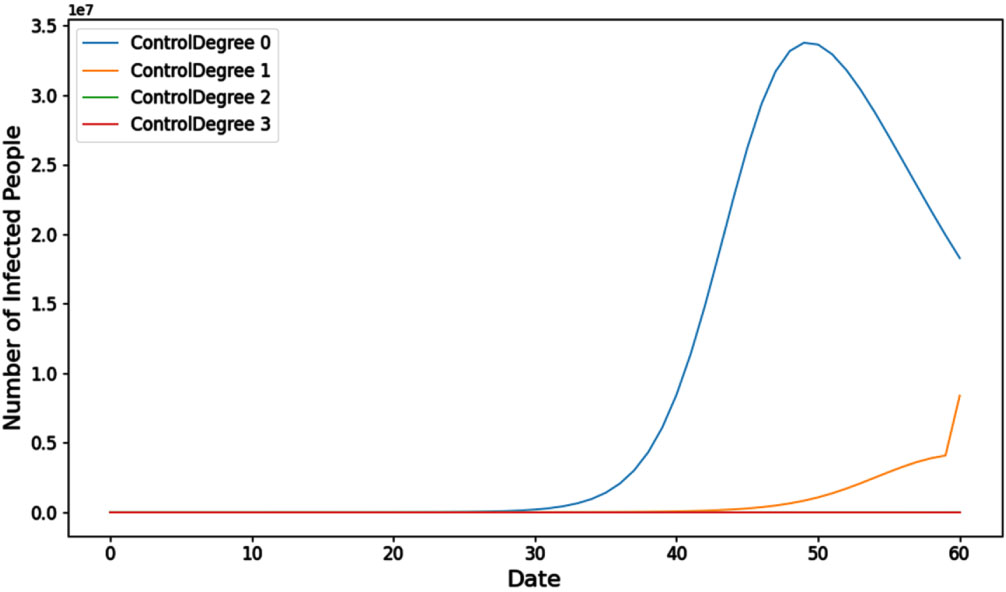
The scenario under a low vaccination rate (a = 0.15) is depicted in Fig. 14.
Multiple control strategies under low vaccination rate.
As shown in Fig. 14, 14,552,162 people, 8,409,378 people, 16,335 people and 0 people were finally infected under the four strategies respectively. It can be seen that under the low vaccination rate, the goal of completely eliminating the epidemic can be achieved by executing intentional control of grade 3.
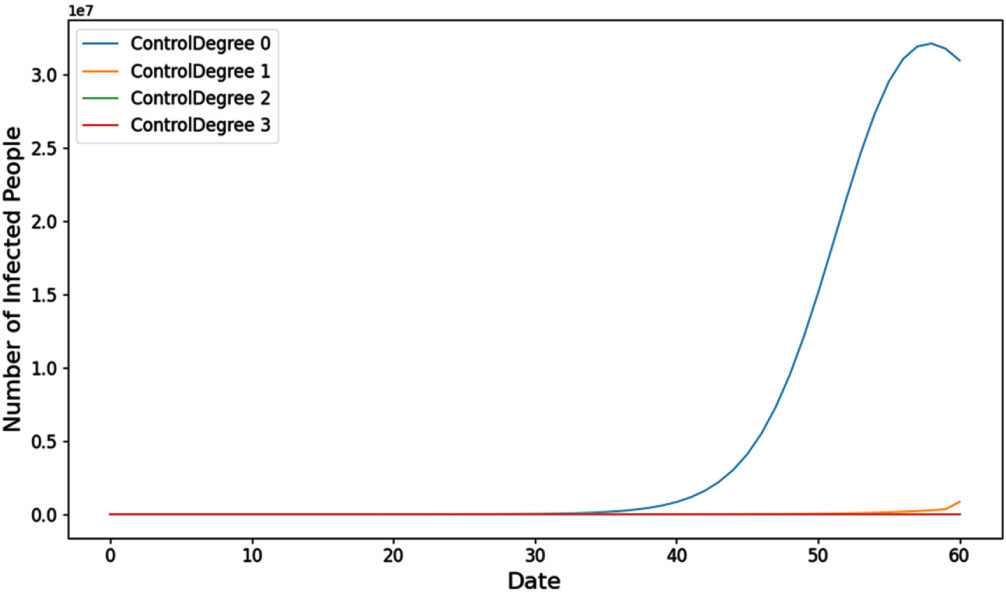
The scenario under a medium vaccination rate (a = 0.10) is illustrated in Fig. 15.
Multiple control strategies under normal vaccination rate.
As shown in Fig. 15, 27,403,375 people, 1,721,367 people, 177 people and 0 people were finally infected under the four strategies respectively. It can be seen that under the medium vaccination rate, the scale of the epidemic can be effectively suppressed by executing intentional control of grade 2, and the goal of completely eliminating the epidemic can be achieved by executing intentional control of grade 3.
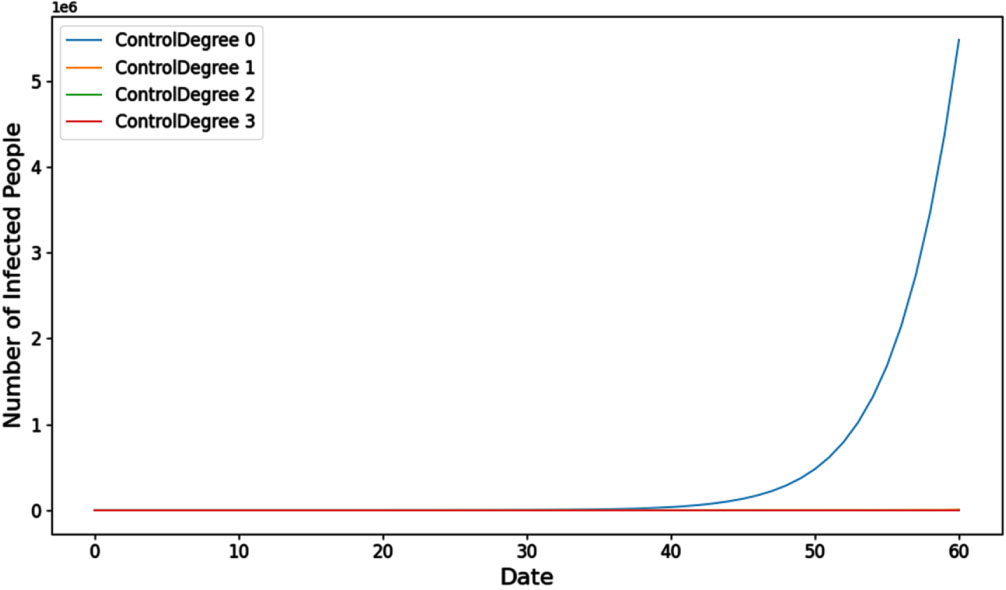
The situation under a high vaccination rate of a = 0.05 is shown in Fig. 16.
Multiple control strategies under high vaccination rate.
As shown in Fig. 16, 1,736,976 people, 4,321 people, 1 people and 0 people were finally infected under the four strategies respectively. It can be seen that under the high vaccination rate, the scale of the epidemic can be effectively suppressed by executing intentional control of grade 1, and the goal of completely eliminating the epidemic can be achieved by executing intentional control of grade 2 and grade 3. Based on this strategy, we have the following results and conclusions: Under the low vaccination rate, the epidemic broke out intensively on the 30th day, reaching the peak on the 45th day, and the best state could be achieved by executing intentional control of grade 3; Under the medium vaccination rate, the epidemic broke out intensively on the 40th day, reaching the peak on the 55th day, the epidemic could be effectively suppressed by executing intentional control of grade 2, and the better effect of epidemic prevention and control could be achieved through intentional control of the higher level; and Under the high vaccination rate, the epidemic broke out intensively on the 60th day, executing intentional control of grade 1 was effective to control the epidemic, and the better effect of epidemic prevention and control could be achieved through intentional control of the higher level.
Additionally, as the vaccination rate rises, human immunity strengthens, making it increasingly feasible to control the epidemic, as indicated in Table 7.
Results of Multiple control strategies under different vaccination rate
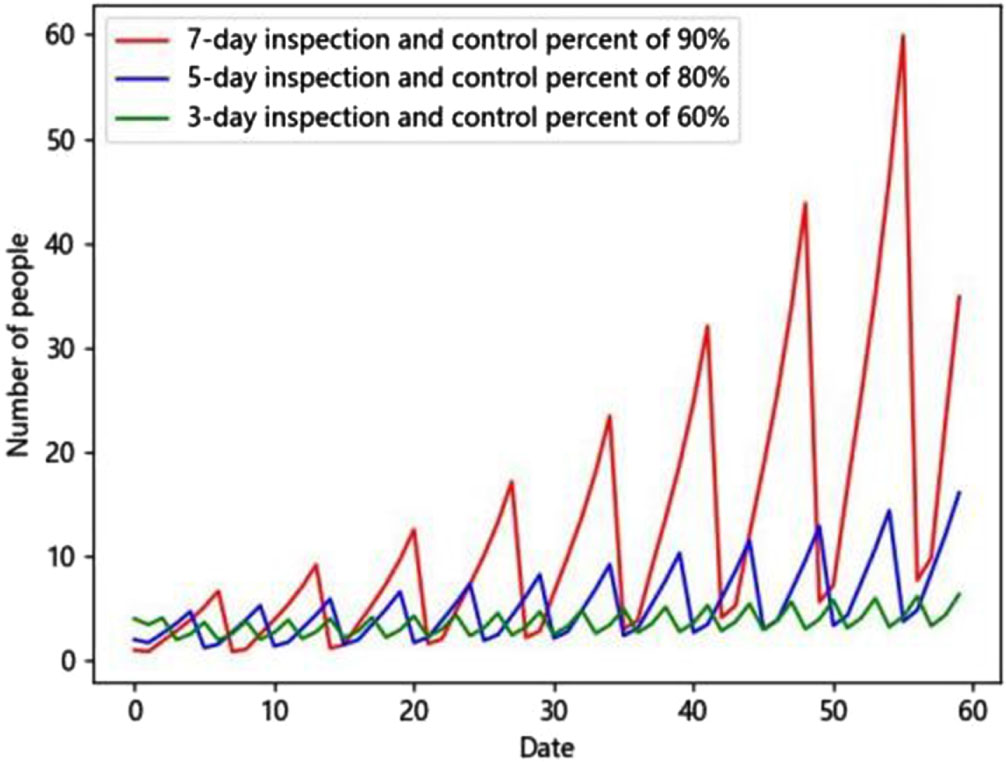
Under the average level condition in the world (the population is set to 0.1 billion, the number of initial cases is 10, r is set to be 15, β is set to be 0.075, a is set to be 0.1, g is set to be 0.141, p (control degree) refers to the degree of random control, 100% represents that all personnel is controlled, and 50% represents that only 50% of personnel is controlled), through random control, three control strategies are proposed:
Strategy I, a mode of one inspection every 7 days with the control percent of 90%, there are still 34 cases after a 60-day period, and
Strategy II, a mode of one inspection every 5 days with the control percent of 80%, there are still 16 cases after a 60-day period, and
Strategy III, a mode of one inspection every 3 days with the control percent of 60%, there are still 6 cases after a 60-day period, and
As shown in Fig. 17, with the shortening of the inspection period, the effect of random control is continuously improved, and if the time period continues to extend, the spread of the epidemic is difficult to control through strategy I and strategy II, so strategy III is the best strategy in random control. However, this approach comes with a significant consequence: the need to control a growing number of individuals, with the population under control reaching a staggering 1.2 billion, which is 12 times the total population. This necessitates an unimaginable amount of human resources, material resources, and financial resources.
Modified SEIR model under stochastic control.
To achieve the same effect of controlling the number of cases within 10, different intentional control strategies are set respectively according to the difference of r, β and a, and the comparison is as follows (other indicators are still 0.1 billion of population, 10 initial cases and 0.141 of g):
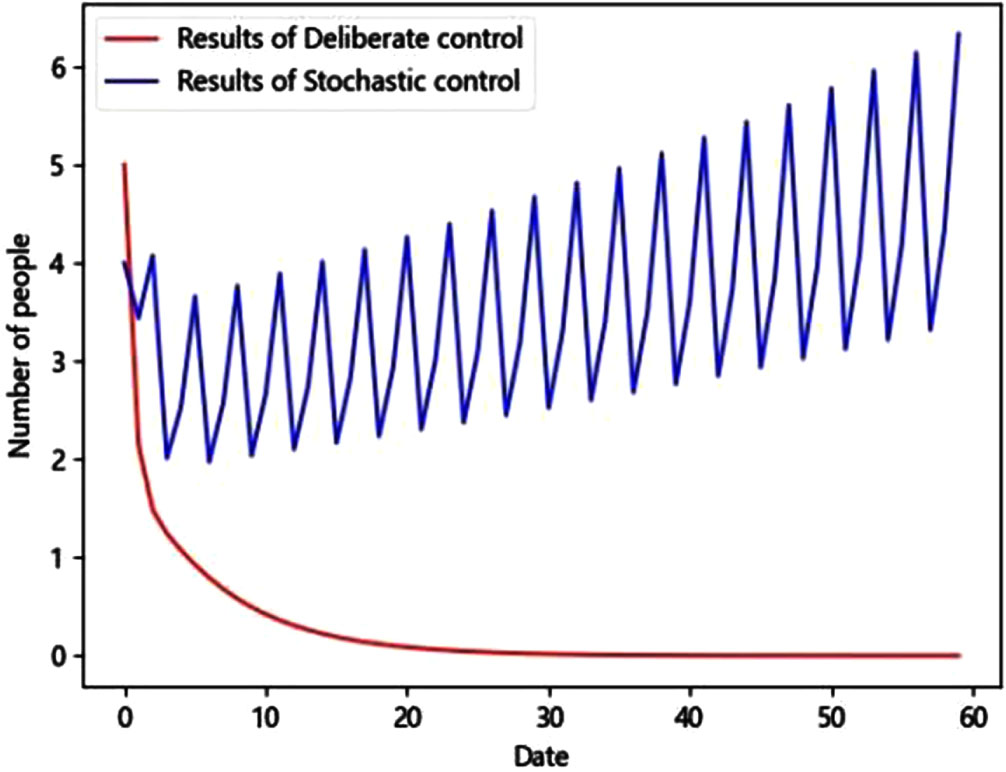
This case, characterized by high population flow rates, high propagation rates, and a low vaccination rate, represents a particularly challenging epidemic scenario. Simulation is conducted by using intentional control of grade 3, the final number of cases is 0, and in the process, 31 infected persons, 109 close contacts and 427 sub-close contacts are controlled, 567 persons in total as supported by Fig. 18.
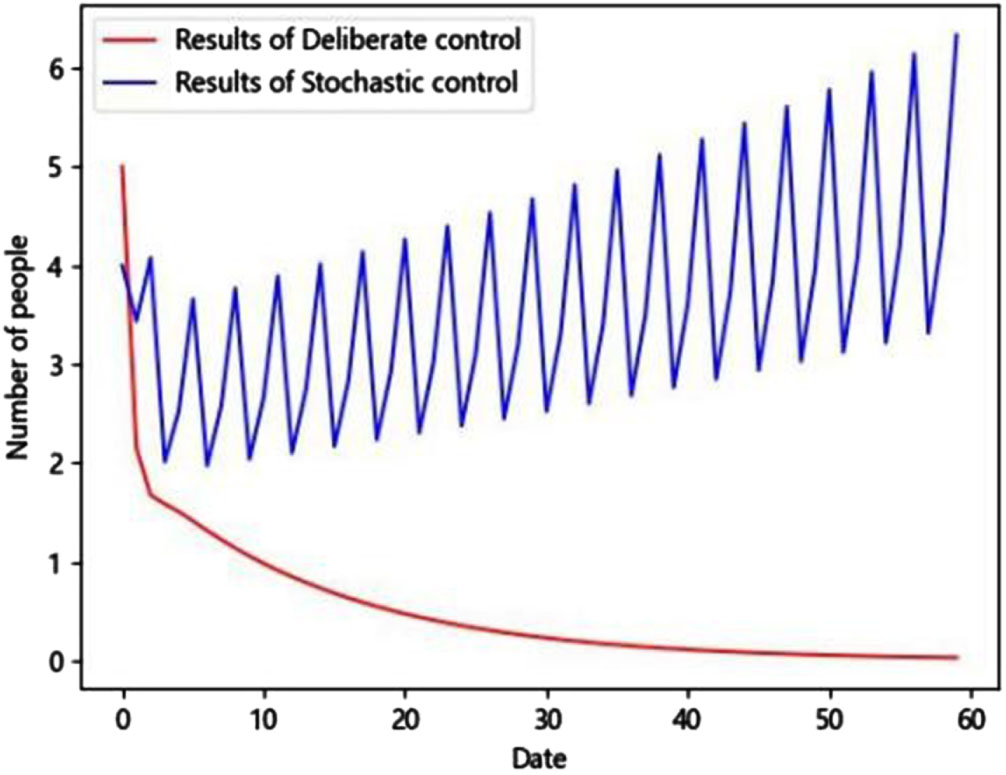
Results of intentional(Deliberate) control at high-high-low case and stochastic control.
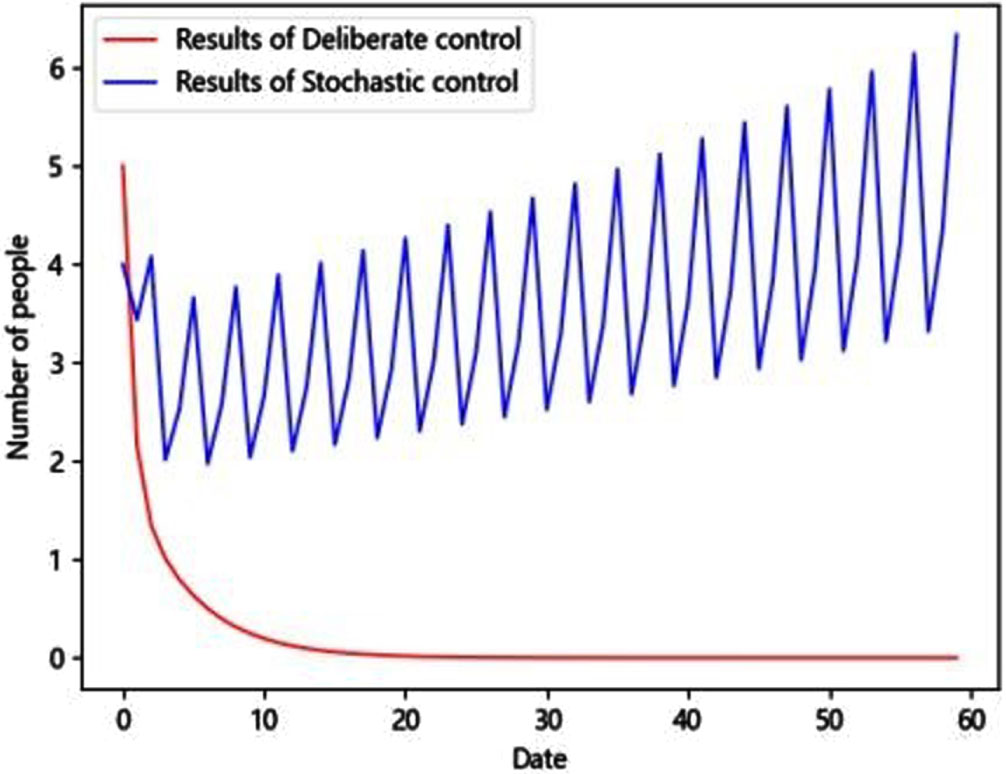
The medium-high-low case scenario, characterized by moderate population flow rates, high propagation rates, and a low vaccination rate, is relatively less severe compared to Case I.As shown in Fig. 19, simulation is conducted by using intentional control of grade 3, the final number of cases is 0, and in the process, 17 infected persons, 45 close contacts and 132 sub-close contacts are controlled, 194 persons in total.
Results of intentional (Deliberate) control at medium-high-low case and stochastic control.
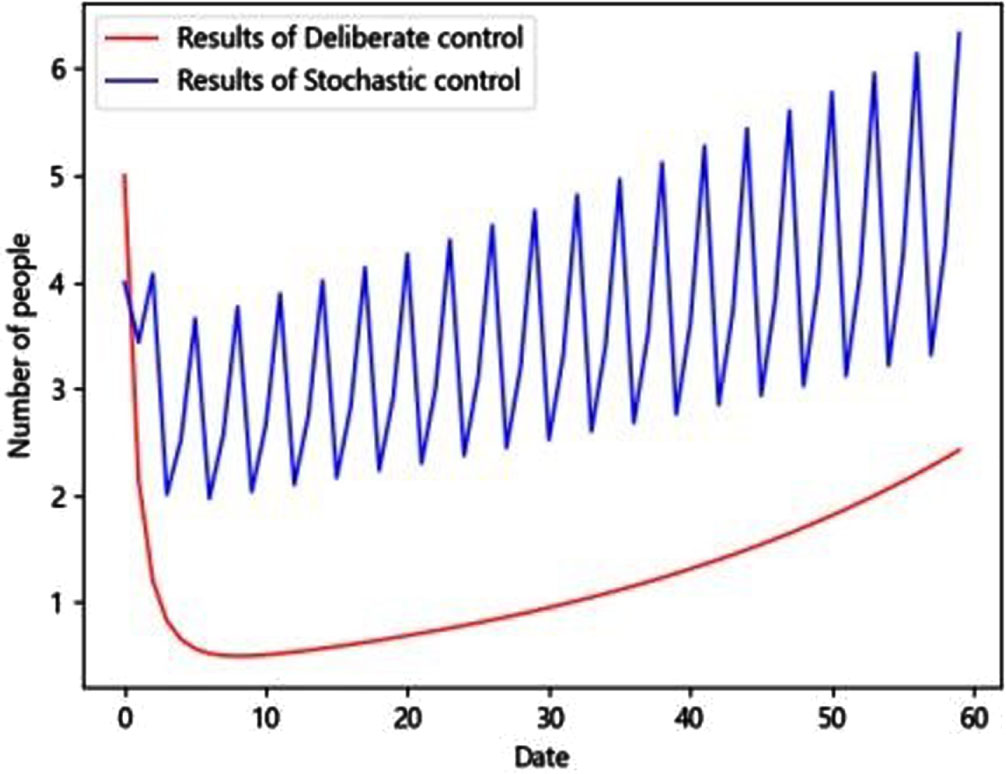
The medium-medium-low case scenario, featuring moderate population flow rates, medium propagation rates, and a low vaccination rate, is even less severe than Case II. As shown in Fig. 20, simulation is conducted by using intentional control of grade 3, the final number of cases is 0, and in the process, 13 infected persons, 26 close contacts and 57 sub-close contacts are controlled, 96 persons in total.
Results of intentional (Deliberate) control at medium-medium-low case and stochastic control.
Medium-medium-medium case (medium population flow rate, medium propagation rate and medium vaccination rate, which is further less harsh than case III, and is consistent with the case in random control above). As shown in Fig. 20, simulation is conducted by using intentional control of grade 2, the final number of cases is 2, and in the process, 71 infected persons and 137 close contacts are controlled, 208 persons in total. The outcomes can be even more favorable when implementing a grade 3 intentional control strategy, the final number of cases is 0, and in the process, 9 infected persons, 8 close contacts and 8 sub-close contacts are controlled, 25 persons in total.
Results of intentional (Deliberate) control at medium-medium-medium case and stochastic control.
In all of the above four cases, it can be noticed that the intentional control is much more superior to random control both from the actual effect of controlling the infection and the number of people to be controlled.
The classic SEIR model does not account for the infectivity issue related to close contacts and sub-close contacts, nor does it differentiate between their varying levels of infectivity.Therefore, under the general background of the extremely low fatality rate of COVID-19 at present, to solve this problem, the classic SEIR model is modified. In the model, the exposed (E) is changed to close contacts (E) and sub-close contacts (E2), and the model is improved according to the different infectivities of the two and evolution paths between the two and S and I to form the modified SEIR model. The modified SEIR model effectively accounts for both close contacts and sub-close contacts, allowing for the distinction between their varying levels of infectivity. This adjustment better aligns the model with the characteristics of the current novel coronavirus, which exhibits an extremely low fatality and strong infectivity rates. The research based on the modified SEIR model conducts more detailed simulations, considering the transmission relationships among susceptible individuals, sub-close contacts, close contacts, and infectious individuals.This expansion of the model includes three transmission modes: S⟶E⟶I, S⟶E2⟶I, and S⟶ E2⟶E⟶I and hence the study provides a more realistic representation of the COVID-19 transmission process. The classic SEIR model seems to be relatively rough, only random control can be conducted on this basis, and effective intentional control is unavailable, because population at risk and infectivity cannot be distinguished. Since the modified SEIR mode has high directivity and precision, the infectious, the close contacts and the sub-close contacts can be effectively determined, which provides possibility and feasibility for intentional control with clearer directivity.
The choice of the control strategy should depend on the situation at that time, facing the new situation, and considering that the group activities of personnel are regional and fixed, which leads to the spread and outbreak of the epidemic with a certain degree of regional, and random control cannot well reflect this, so we put forward the thought of intentional control. When compared to random control measures, such as managing population mobility, restricting gatherings, and implementing regular global nucleic acid testing, intentional control places greater emphasis on managing specific high-risk or key populations. It diverges from universal or random sampling control strategies.Intentional control can more effectively reflect the spread of the epidemic among people in different regions. The internal spread of a relatively closed region has little impact on the outside world, if a whole region is stochastically controlled because of the outbreak of the epidemic in this relatively closed region, it is obviously unscientific, and it not only cannot control the epidemic as it should, but also brings various adverse influences to the politics, economy, culture and life and production in other districts and even the whole region. Intentional control can solve this problem. Once some people have certain risk, intentional control is carried out immediately, which can effectively eliminate the infectious source, cut off the transmission route and effectively protect the susceptible. It can be seen from the above verification under various conditions that, in the face of epidemic control, even under adverse conditions, intentional control strategies are better than random control strategies, not to mention cost input and economic effects.
It is obvious that the effect of intentional control is better than that of random control. Nevertheless, in the face of a multitude of intricate social factors and challenges encompassing social development, economic functioning, and public sentiment, it becomes imperative to contemplate the utilization of diverse intentional control strategies tailored to specific circumstances.Obviously, there are many kinds of intentional control strategies that can be used at a high level of medical and health care, from a lower grade to a higher grade, and which one to use depends on the current conditions and environment; the grade of the intentional control strategies should also be increased correspondingly when population mobility and the propagation rate are accelerated; and with the increasing of the vaccination rate, the anti-viral ability of people will be continuously enhanced, and then the grade of the intentional control strategies can be appropriately lowered and the activity of people can be appropriately increased. Simply from the perspective of the effect of intentional control on the epidemic, the higher the grade of intentional control under the same conditions, the better the epidemic will be controlled, and the fewer people will be controlled. Hence, districts with varying degrees of economic and social development can opt for intentional control strategies tailored to their unique needs, considering factors such as local medical and sanitary standards, population mobility rates, propagation rates, and vaccination statuses.
However, in practice, the ability of intentional control depends more on the timeliness and effect of execution of such measures as epidemiological investigation and traceability of personnel contact. The timeliness of execution directly leads to the lag of intentional control measures, and the effect of execution determines the accuracy of intentional control. Therefore, in order to better control the development of COVID-19 through intentional control, in addition to constantly improving medical and sanitary conditions, we should also develop 5G, AI, BIGDATA and other communication and computer technologies, and constantly improve the accuracy and thoroughness of intentional control. Furthermore, to more accurately account for the stability and regional aspects of population settlements, implementing intentional control can yield improved results, especially when coupled with comprehensive monitoring of mobile populations through information technology.
Declarations
Data availability statement
The datasets used and/or analyzed during the current study are available from the corresponding author on reasonable request.
Conflicts of interest
The authors declare no conflict of interest.
Funding
This research received no external funding.