
Abstract
Traditional sonar image target detection analysis has problems such as long detection time, low detection accuracy and slow detection speed. To solve these problems, this paper will use the multi-feature fusion sonar image target detection algorithm based on the particle swarm optimization algorithm to analyze the sonar image. This algorithm uses the particle swarm algorithm to optimize the combination of multiple feature vectors and realizes the adaptive selection and combination of features, thus improving the accuracy and efficiency of sonar image target detection. The results show that: when other conditions are the same, under the particle group optimization algorithm, the sonar image multiple feature detection algorithm for three sonar image detection time between 4s-9.9s, and the sonar image single feature detection algorithm of three sonar image detection time between 12s-20.9s, shows that the PSO in multiple feature fusion sonar image target detection with better performance and practicability, can be effectively applied to the sonar image target detection field.
Keywords
Introduction
Target detection(TD) in sonar images is an essential issue in fields such as ocean exploration and underwater engineering. Traditional sonar image(SI) object detection (OD) methods often only rely on a single feature for detection, which cannot fully mine the feature information of the image, resulting in problems such as false detections and missed detections in the detection results. Therefore, how to effectively utilize various feature information in SIs to improve detection accuracy and performance has become a hot and difficult research topic. SI OD methods based on deep learning (DL) have received widespread attention. These methods have high accuracy and performance, but require a large amount of training data and computing resources, and have high requirements for real-time and robustness.
Due to the fact that SIs are an important ocean exploration technology widely applied in sectors such as marine resource exploration and marine environmental monitoring, many achievements have been made in their research. Among them, robust TD in SIs is an key mission for underwater detection, navigation, and surveying. Tueller Peter focused on the field of feature extraction-based detection, which was developing towards a robust framework for TD, and reported the performance of various feature detectors in simulated environments and the performance of one feature detector in real SIs. The results indicated that the presented way achieved a good balance based on the importance of selecting feature extractor parameters under current environmental conditions [1]. Sung Minsung proposed a method of synthesizing real SIs using generative adversarial network. The sonar simulator generated the simulated image into a real SI based on the style conversion algorithm of the generative adversarial network. Without the need for sea trials, real training images from various angles and environments can be synthesized, making TD simple [2]. To segment different kinds of targets in SIs accurately and quickly, Wang Zhen proposed a new convolutional neural network model. This method had fewer computational parameters, making it easy to deploy in underwater mobile detection equipment in the future [3]. However, these studies are all about the analysis of SIs and lack a scientific algorithm for verification.
Particle swarm optimization(PSO) can be applied to image correlation problems, that is, identifying and matching the same objects or scenes in two or more images. Its application in the field of images has become a research topic for many scholars and has produced a large number of results. Among them, Yanxia Cai briefly introduced the model of optimal threshold calculation. Then the image segmentation was simulated and analyzed in MATLAB (matrix laboratory) software. The improved PSO was found to perform better from the subjective point of view and the images segmented by the improved PSO had higher regional consistency and shorter time from the point of view of quantitative objective data through the calculation of both algorithms [4]. The method of linear time-varying frequency error calibration was sensitive to the signal-to-noise ratio based on the entropy minimization principle, and its calibration capability decreased significantly at low signal-to-noise conditions. For this reason, Kang Hailong proposed a method for robust calibration. The method searched for the global OS using a particle swarm algorithm. This method can also work well under low signal-to-noise ratio condition [5]. Bacanin Nebojsa The particle swarm optimization (PSO) algorithm is used to complete the selection process of the minimum energy device in the edge network. This proposed unloading scheme helps to process the data in the 5G network very effectively. It adopts the multi-stage unloading mechanism to retain the workload energy [6] of the Internet of Things and MEC 5 G network. Ji Yingjun Considering a width bias prediction problem, we propose a hybrid Mgh method based on machine learning and genetic algorithm in order to obtain the prediction model. Genetic algorithms and generalized linear regression were innovatively combined to select a representative variable from each cluster and develop a predictive model [7]. Petrovic Aleksandar Due to the strong dependence of AI model performance on the correct choice of hyperparameters, the enhanced version of the particle swarm optimization (PSO) algorithm was specifically introduced to adjust the hyperparameters of the model used in this study, and found that the introduced enhanced PSO (BPSO) performed better than the contemporary optimizer [8]. The above research demonstrates the applicability of PSO in the field of images, providing a theoretical basis for combining it with Multi-feature Fusion (MFF) SI TD for analysis.
The following issues should be resolved by the institute of multi-feature fusion sonar image object recognition and analysis based on particle swarm optimization algorithm: How can I use the sonar image to extract useful information for identifying and analyzing targets?2. How can the target detection model’s parameters and feature weights be optimized using the particle swarm optimization approach to boost detection performance?
The following components of the study’s primary contribution can be summed up: 1. Based on sonar pictures, a target detection and analysis technique is proposed. This technique specifies the attributes of the target from various perspectives and sizes. This can enhance the target’s various characteristics and increase the target detection’s accuracy and speed.2. Particle swarm optimization algorithm for parameter tuning: Researchers employ the particle swarm optimization approach to refine the target detection model’s parameters, discover the weights of the features, and boost picture detection recall rates.
This paper is to study the multi-feature fusion sonar image object detection method based on PSO, mainly divided into the following structures: The first chapter is mainly an introduction, which introduces the background and importance of research and the contribution of research, while also summarizes previous studies. The second chapter is to introduce the sonar image multi-feature detection algorithm based on the PSO, which mainly introduces the applied technology and the PSO algorithm, using the PSO algorithm for various image processing. The third chapter is introduced the feature fusion sonar image target detection experiment analysis, mainly introduces the experimental background, at the same time using sonar image feature detection algorithm and sonar image single feature detection algorithm of fish, submarines and stone image detection, to verify the PSO algorithm can improve the accuracy and speed of target detection. The last one is the summary.
Research on multi-feature detection of sonar images based on PSO
SIs utilize the characteristics of acoustic waves propagating underwater to obtain information in the underwater environment, where the generation and reception of acoustic waves are accomplished through sonar equipment [9, 10]. The sound waves emitted by sonar equipment propagate underwater and are reflected back. The receiving equipment receives these reflected sound signals and converts them into SIs. SIs are commonly used for underwater TD, recognition, and positioning applications, and are an indispensable part of underwater detection technology [11, 12].
The SI MFD algorithm based on PSO can utilize multiple different feature vectors. Through the optimization of PSO algorithm, the weight and threshold of feature vectors can be adaptively adjusted, reducing the error and uncertainty caused by human selection [13, 14].
Testing methods
(1) SI TD technology
SI TD technology is a technique that utilizes sonar signals to obtain target position and morphology information in the ocean [15, 16]. The basic principle is to transmit sound waves of a certain frequency and waveform to the ocean. When the sound waves encounter a target object, some of the energy would be reflected back, forming an echo signal. By receiving the echo signal and performing signal processing, something about the position and shape of the target object can be obtained.
Common SI TD technologies include conventional SI processing, side scan SI processing, and multi-beam SI processing [17, 18]. Among them, conventional SI processing is the most basic SI processing method. By processing the sonar echo signal and extracting the feature information of the target object, TD is achieved. Side-scan SI processing is a technology that obtains target object information through lateral scanning, which can obtain more precise target images, but its cost is relatively high. Multi-beam SI processing is a technique that overlays multiple acoustic beam signals, which can improve the accuracy and resolution of TD [19, 20].
SI OD technology based on DL has also been widely applied. By utilizing DL models for feature extraction and TD in SIs, the accuracy and robustness of TD in SIs can be significantly improved [21, 22].
(2) MFF technology
MFF technology refers to the fusion of multiple different types or data information of the same type but with different features. In the field of OD, MFF technology can increase the accuracy and robustness of OD by fusing information from different features. Among them, the DL method is widely used in the field of TD. Through the DL model such as convolutional neural network, the information of different features is fused, and good results are achieved.
In SI TD, the feature information of the target usually includes various aspects such as the shape, size, reflectivity, etc. of the target. However, due to the influence of marine environment on SIs, there are problems such as noise and clutter, which make it difficult for a single feature to accurately describe target information. Therefore, using MFF technology to fuse information from different features can enhance the accuracy and robustness of OD. At the same time, MFF technology can also automatically learn and extract information from different features through methods such as DL, thereby further improving the performance of SI OD [23].
PSO algorithm
PSO is an optimization algorithm, whose inspiration comes from simulating the swarm intelligence behavior of birds, and realizing the goal by simulating the movement process of particles in the colony. In PSO, for a population of M and population M (a1, a2, …, a M ), it is first initialized as a set of random solutions, then adjusted to its latest position based on two extreme values, and then searched for the optimal solution (OS) in the feasible space. In terms of the global version, the two extreme values correspond to the individual OS qbest and the group OS hbest. However, in terms of the local version, the two extreme values correspond to the individual OS qbest and the nearest neighbor OS zbest.
If a community composed of M particles continuously searches in an F-dimensional target space, then an F-dimensional vector of the o-th particle can be represented as:
Where, A o represents the vector of the o-th particle.
The “flying“ speed of the o-th particle is also a vector of a dimension, which can be expressed as:
So far, the optimal position searched by the o-th particle becomes the individual extreme value, which can be expressed as:
The global extreme value of the optimal position of the particle swarm to its current position can be expressed as:
Where, qhF is the global extreme value of the vector of particles in the F dimension.
The particle updates its speed and position when these two optimal values are found. For the global version of PSO, the particle evolution formulas can be expressed as:
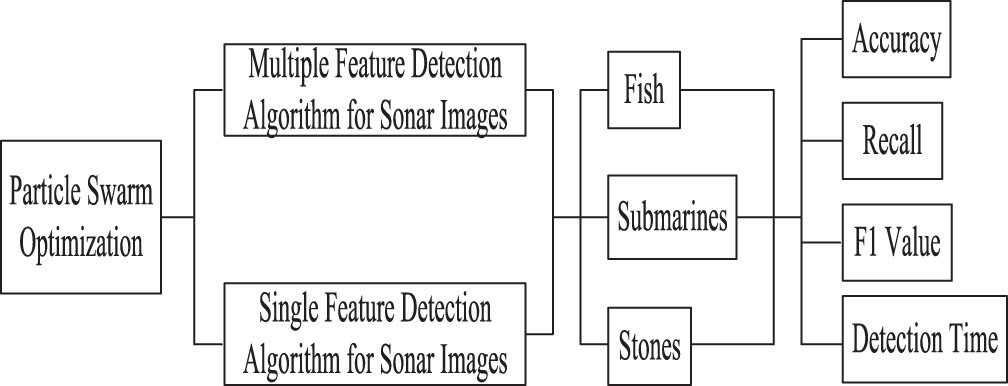
Among them, the inertia weight coefficient of α is used to control the search speed of particles, usually using a linear decreasing method, so that the population has better search ability in the initial stage and conducts a more refined search process near the possible OS; v1 and v2 are two independent acceleration constants; t1 and t2 are random numbers between (0,1); t is the current number of iterations; Q o = (Qo1, Qo2, . . . , Q of ) represents the OS found by the o-th particle, called qbest, and Q h = (Qh1, Qh2, . . . , Q hf ) represents the OS found by the entire population, called hbest. The flow chart of the sonar image detection model constructed based on the PSO is shown in Fig. 1.
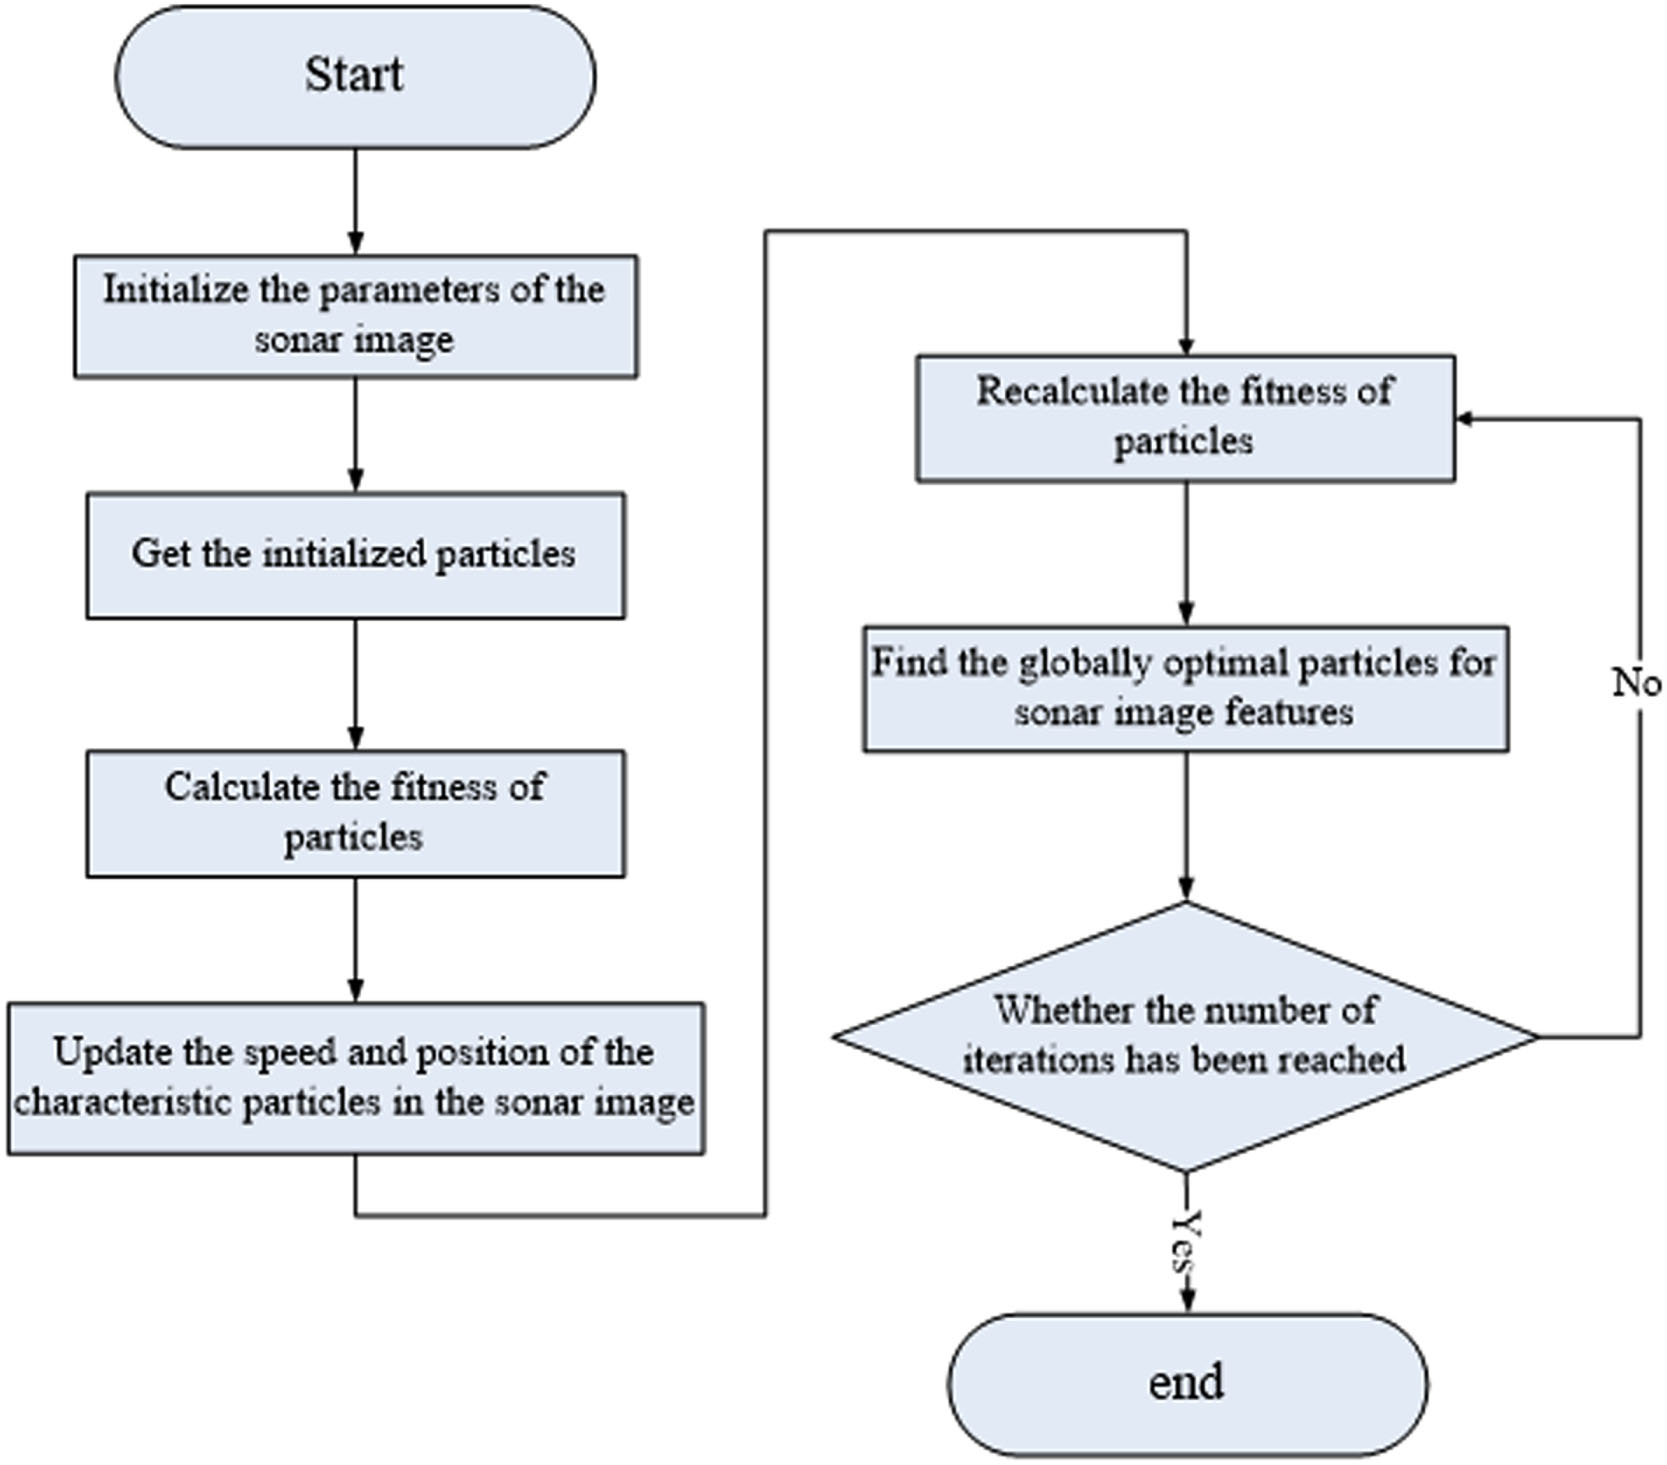
Flow chart of the sonar image detection model based on PSO.
Target detection of multi-feature fusion sonar image is studied using particle swarm optimization algorithm: 1. Global search capability: the particle swarm optimization algorithm has strong global search capability and can explore multiple local optimal solutions in the search space. In the target detection of multi-feature fusion sonar image, the features of the target may involve multiple dimensions and multiple regions, and a global search is needed to find the best feature combination and weights. 2. Multi-feature fusion: Particle swarm optimization algorithm is naturally applicable to the multi-feature fusion problem. Sonar image target detection often requires combining multiple features to improve the detection accuracy, such as the target shape, texture, echo intensity and so on. Through the particle swarm optimization algorithm, multiple features can be weighed and fused to find the optimal feature combination. 3. Parameter optimization: There are often many parameters that need to be optimized, according to the target detection, such as feature weight, threshold, etc. The particle swarm optimization algorithm can automatically search for the optimal parameter combination through iterative optimization, thus improving the performance and accuracy of target detection. Overall, the particle swarm optimization algorithm has the advantages of global search ability, suitable for multi-feature fusion problem, parameter optimization ability, robustness and interpretability, so it is widely used in the study of multi-feature fusion sonar image target detection.
(1) Image preprocessing
1) Image grayscale
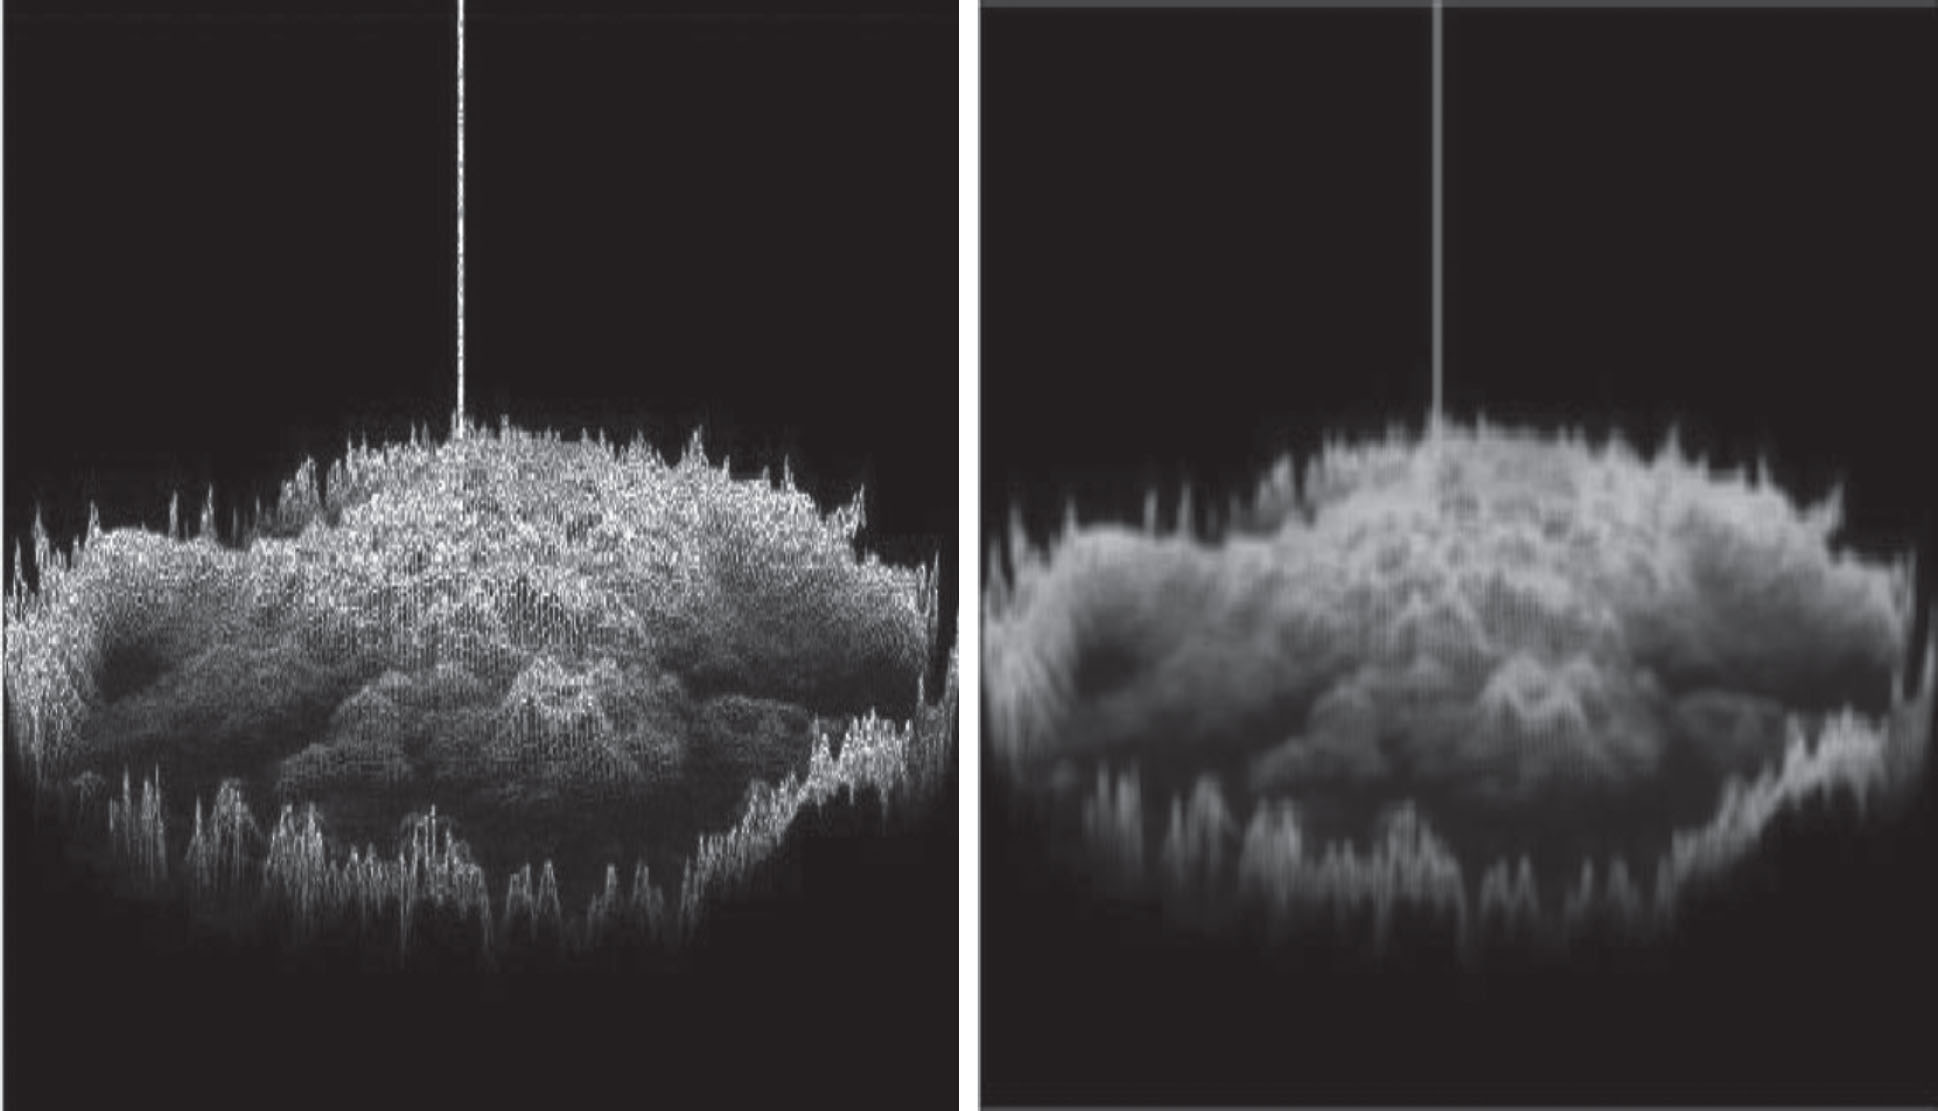
Color image pixels are generally RGB (red, green, and blue) images. The GVs of these three colors range from 0 to 255. When the GVs of R, G, and B are equal, they are grayscale. When the pixels have grayscale values of 0 and 255, the image appears in two colors: black and white, while the image corresponding to grayscale values between 1 and 254 appears in two colors between black and white. The grayscale methods are component method, maximum value method, average method, and weighted average method. This peper would use the maximum value method to preprocess SIs to obtain their grayscale, as shown in Fig. 1:
Taking the gray value (GV) of the largest of the three components of the color pixel as the GV of the image, it can be expressed as:
Where, T (o, k) , H (o, k) , Y (o, k) represent the gray values of the three components in the shaded pixel.
2) Mean filtering algorithm
The mean filtering algorithm is the simplest spatial filtering algorithm, which uses the average of the grayscale values of pixels and all neighboring pixels to give the corresponding pixel’s grayscale. The formula for filtering at the center pixel (a, b) of the filtering window is:
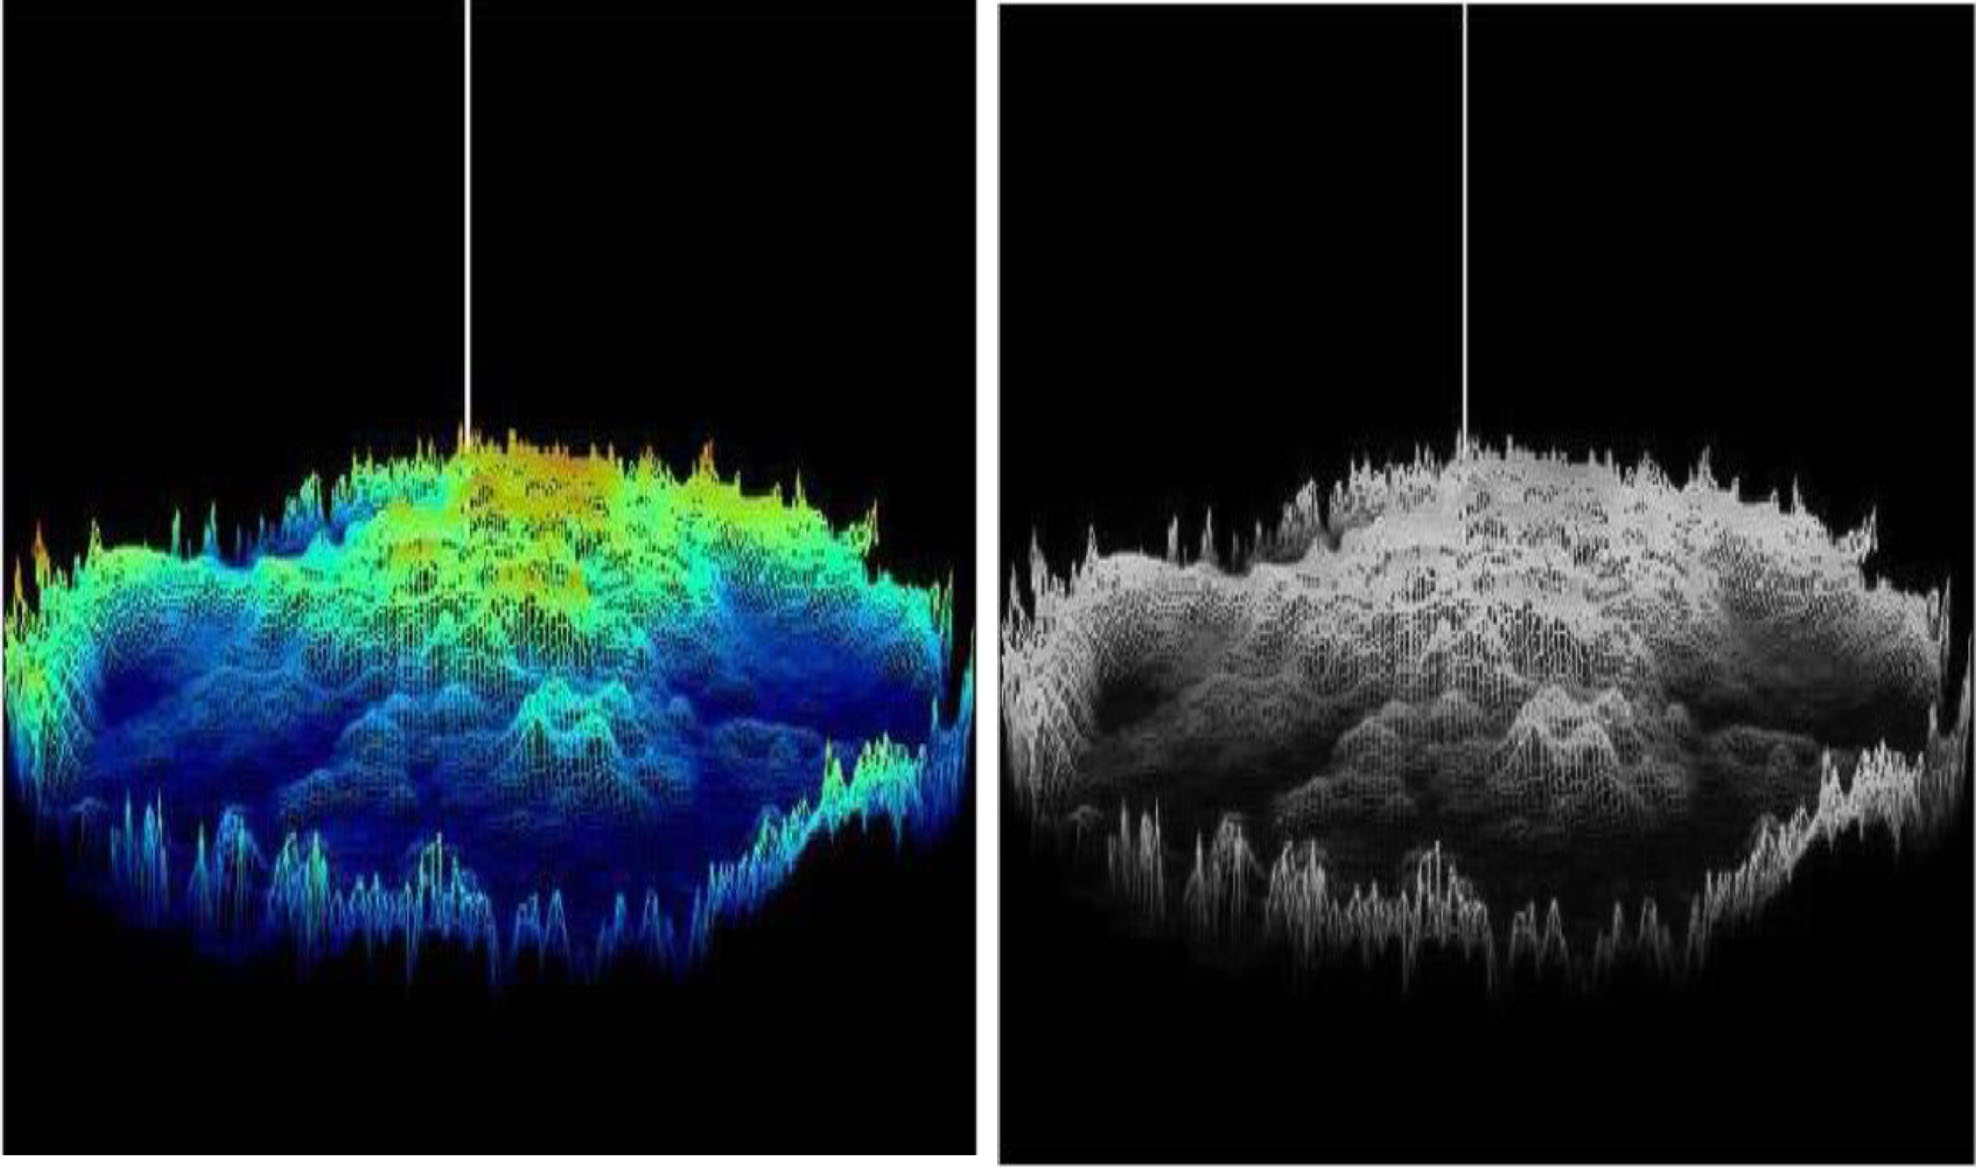
Among them, d represents a rectangular filtering window with a center of (a, b) and a size of n · m. The denoising results of the SI are shown in Fig. 2:
(2) Canny’s edge processing
Grayscale image of SI.
Determination of fitness function of particle swarm:
Generally speaking, the selection of threshold has a significant impact on the effectiveness of image edge detection. If the threshold is too large, the effective information of the obtained image is relatively small. On the contrary, a smaller threshold would result in a lot of useless information interfering with people’s judgment. The selection of threshold is crucial. Usually, there are many ways to determine the threshold. In most images, it is usually inseparable from calculating the mean and standard deviation (SD) of the corresponding pixel values in the image. Due to PSO searching for the global optimal value, this article uses two functions, the mean and SD of local image pixel values, as the objective functions, namely the fitness function.
The average value of an image is an embodiment of the central tendency of GV.
Where
The variance of an image is the sum of the squares of all values in a series of data minus their arithmetic mean, and then the mean is taken. The variance calculated by this method is to reflect the degree to which the observed values in this series of data are discrete from each other. If the object is an image, its variance is the sum of the squares of the grayscale value of each pixel minus the average grayscale value of the image divided by the total number of pixels. This variance can represent the degree of dispersion between pixels and the degree of fluctuation across the entire image range.
For image D, the SD of each 3 × 3 sub image pixel is calculated. The pixel SD of sub 3 × 3 images centered on (o, k) is:
When the SD of pixels in an image is smaller, it indicates that the fluctuation of pixels in the region is smaller, and the corresponding mean is also closer to the true pixels of the image to be detected. The edge detection results of the SI are described in Fig. 3:
SI denoising image.
In SI MFD algorithms, PSO is used to train and adjust feature weights to find the optimal feature combination. Specifically, this algorithm calculates the weight of each feature during the feature fusion process, determines the contribution of each feature, and ultimately fuses multiple feature maps to obtain the final TD result. For example, when using conventional SIs for fish TD, PSO can be used to find the optimal feature weight combination. At the same time, PSO can also be used to optimize other parameters in OD algorithms, such as thresholds, filters, etc., to further enhance the performance of OD.
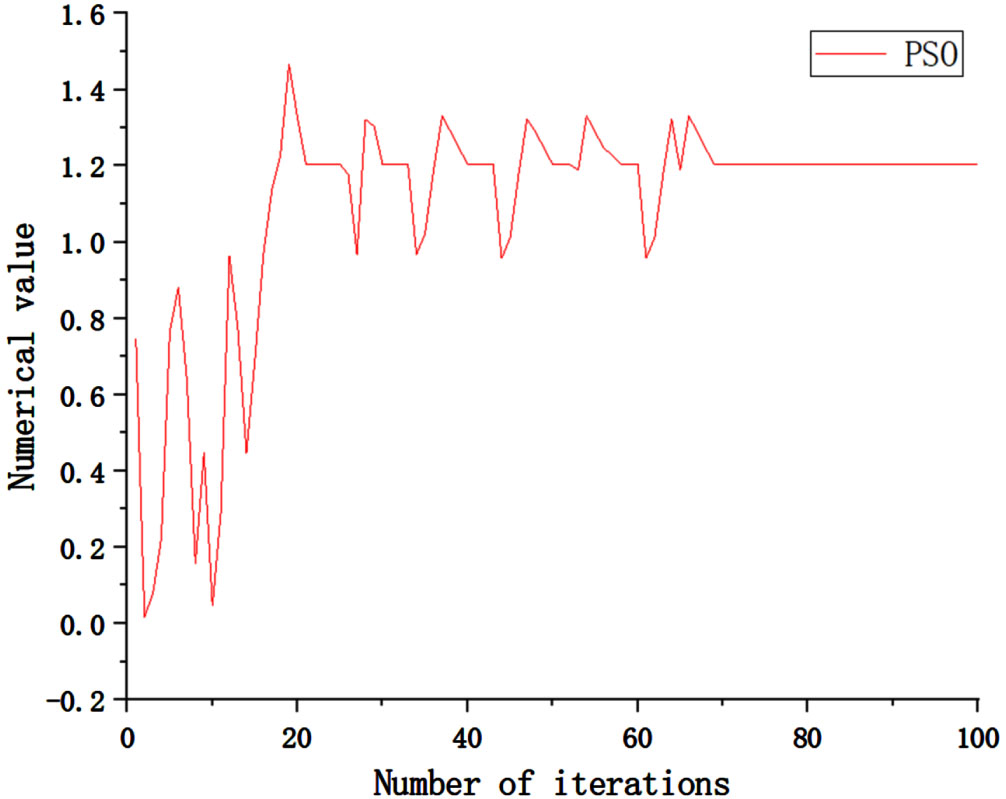
It can be seen that PSO plays a key role in this algorithm, achieving adaptive optimization of TD by flexibly adjusting feature weights. PSO is an indispensable part of SI MFD algorithms. Therefore, SI OD technology and PSO can be combined to improve the accuracy and robustness of OD. The rate of convergence to the PSO is shown in Fig. 5.
As shown in Fig. 5, the PSO algorithm converges very fast, with the convergence speed value obtained after 21 iterative experiments, and the convergence is completely smooth after the 68th experiment.
Experimental background and purpose
In response to some challenges and difficulties in the current field of SI TD, such as noise interference, motion blur, and changes in the marine environment, the aim is to construct an efficient and accurate SI TD system by utilizing MFF technology combined with PSO. The aim of the experiment is to verify the feasibility and effectiveness of the algorithm proposed in this article, understand its practical application effect, and explore its improvement space.
Experimental process
(1) Data collection and preprocessing
This article uses a representative dataset of ocean SIs, which includes SIs of multiple different types of targets, such as fish, submarines, rocks, etc. In the data acquisition, this paper first ensures the relative stability of the ocean environment, while minimizing the influence of noise and clutter to ensure data quality. Data preprocessing includes operations such as denoising, enhancement, and image coordinate normalization to ensure the effectiveness and accuracy of subsequent processing.
(2) Comparative experimental steps
As PSO is a computing method based on swarm intelligence, its main idea comes from simulating the behavior of groups such as birds or fish when searching for targets. The SI MFD algorithm is a method that utilizes multiple feature vectors for SI OD. Therefore, in the SI MFD algorithm, PSO was used to optimize the weights and thresholds of multiple feature vectors, which can maximize the value of the fitness function and improve the accuracy and robustness of TD. To demonstrate the relationship between the two, this article would set up a comparative experiment to compare the SI MFD algorithm and the SI single feature detection algorithm under PSO. The specific steps are shown in Fig. 4:
(3) Performance evaluation and analysis
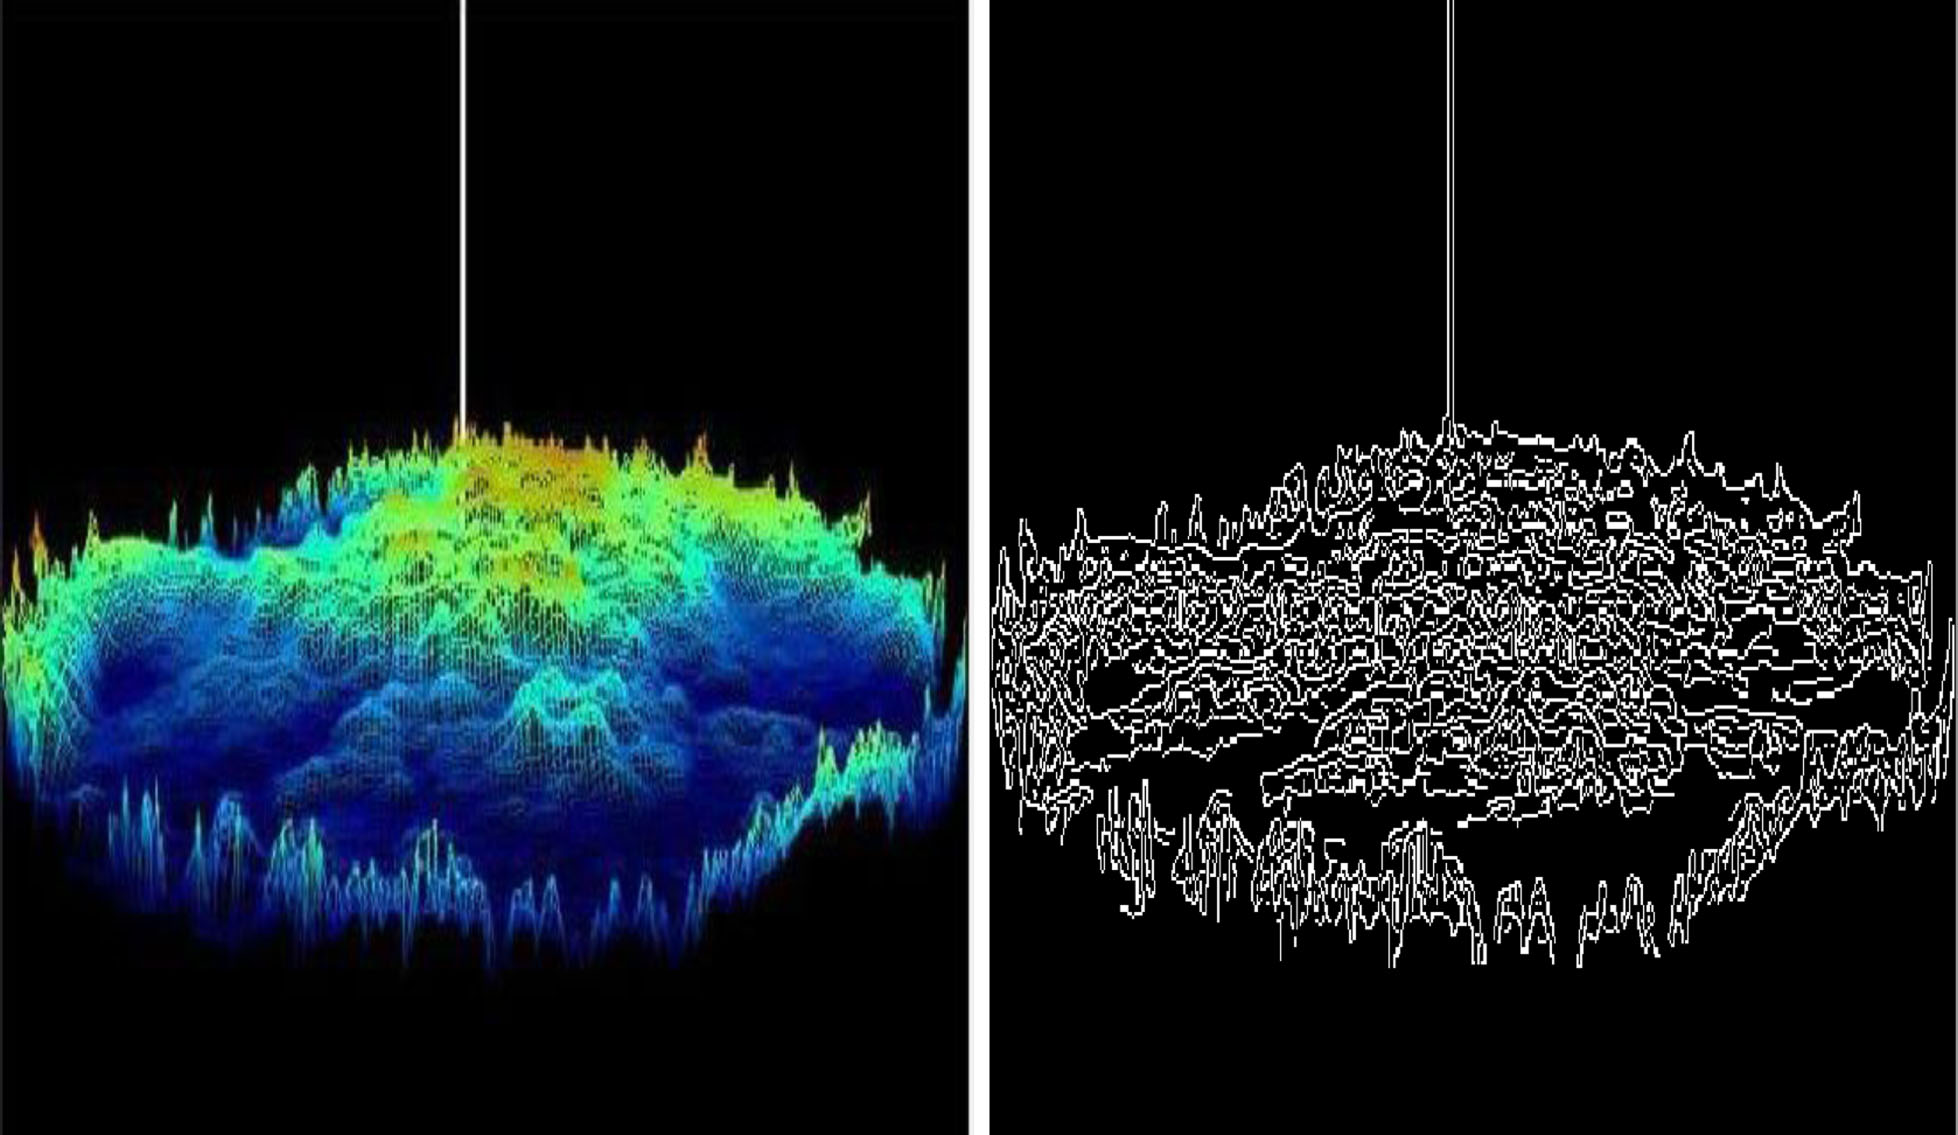
Edge detection of SIs.
To study the proposed algorithm, this article adopted commonly used performance indicators such as accuracy, recall, F1 value, test time, etc. By comparing experimental results, it was shown that the relationship between PSO and SI MFD algorithms was positively correlated. Through the optimization of PSO algorithm, the adaptive selection and combination of multiple feature vectors were achieved, making the effect of SI OD better.
(4) Experimental environment
For the MFF SI TD experiment, a good experimental environment was required, including operating system, processor, memory, and programming language. The specific situation is shown in Table 1:
Assuming there were a total of 1000 targets in this experiment. Among them, 500 were fish; 300 were submarines; 200 were rocks. The experimental data is shown in Table 2. Under the SI MFD algorithm and SI single feature detection algorithm, PSO was used for SI OD. For the sake of time rigor, the number of detections was set to 10, and the accuracy, recall, and F1 value of each test were recorded.
Specific information on the experimental situation
Specific information on the experimental situation
Experimental data situation
(1) Accuracy
The accuracy rate is the percentage of the number of samples correctly forecast by the sample of the model to the total number of samples. The higher the accuracy, the higher the correctness of the model’s data classification results. The detection outcomes of accuracy are described in Fig. 5:
PSO convergence rate.
From Fig. 5 (a), it can be seen that in 10 detections, the minimum and maximum detection accuracy values for fish were 96.11% and 96.98%; that for submarines were 97.23% and 97.91%; that for stones were 98.14% and 98.93%. From Fig. 5 (b), in 10 detections, the minimum and maximum detection accuracy values for fish were 90.14% and 90.84%; that for submarines were 92.13% and 92.95%; that for stones were 94.13% and 94.91%. From Fig. 5, for the three detection targets, the performance of the SI MFD algorithm was significantly greater than that of the SI single feature detection algorithm, indicating that under PSO, the SI MFD algorithm had higher accuracy.
Specific steps of the experiment.
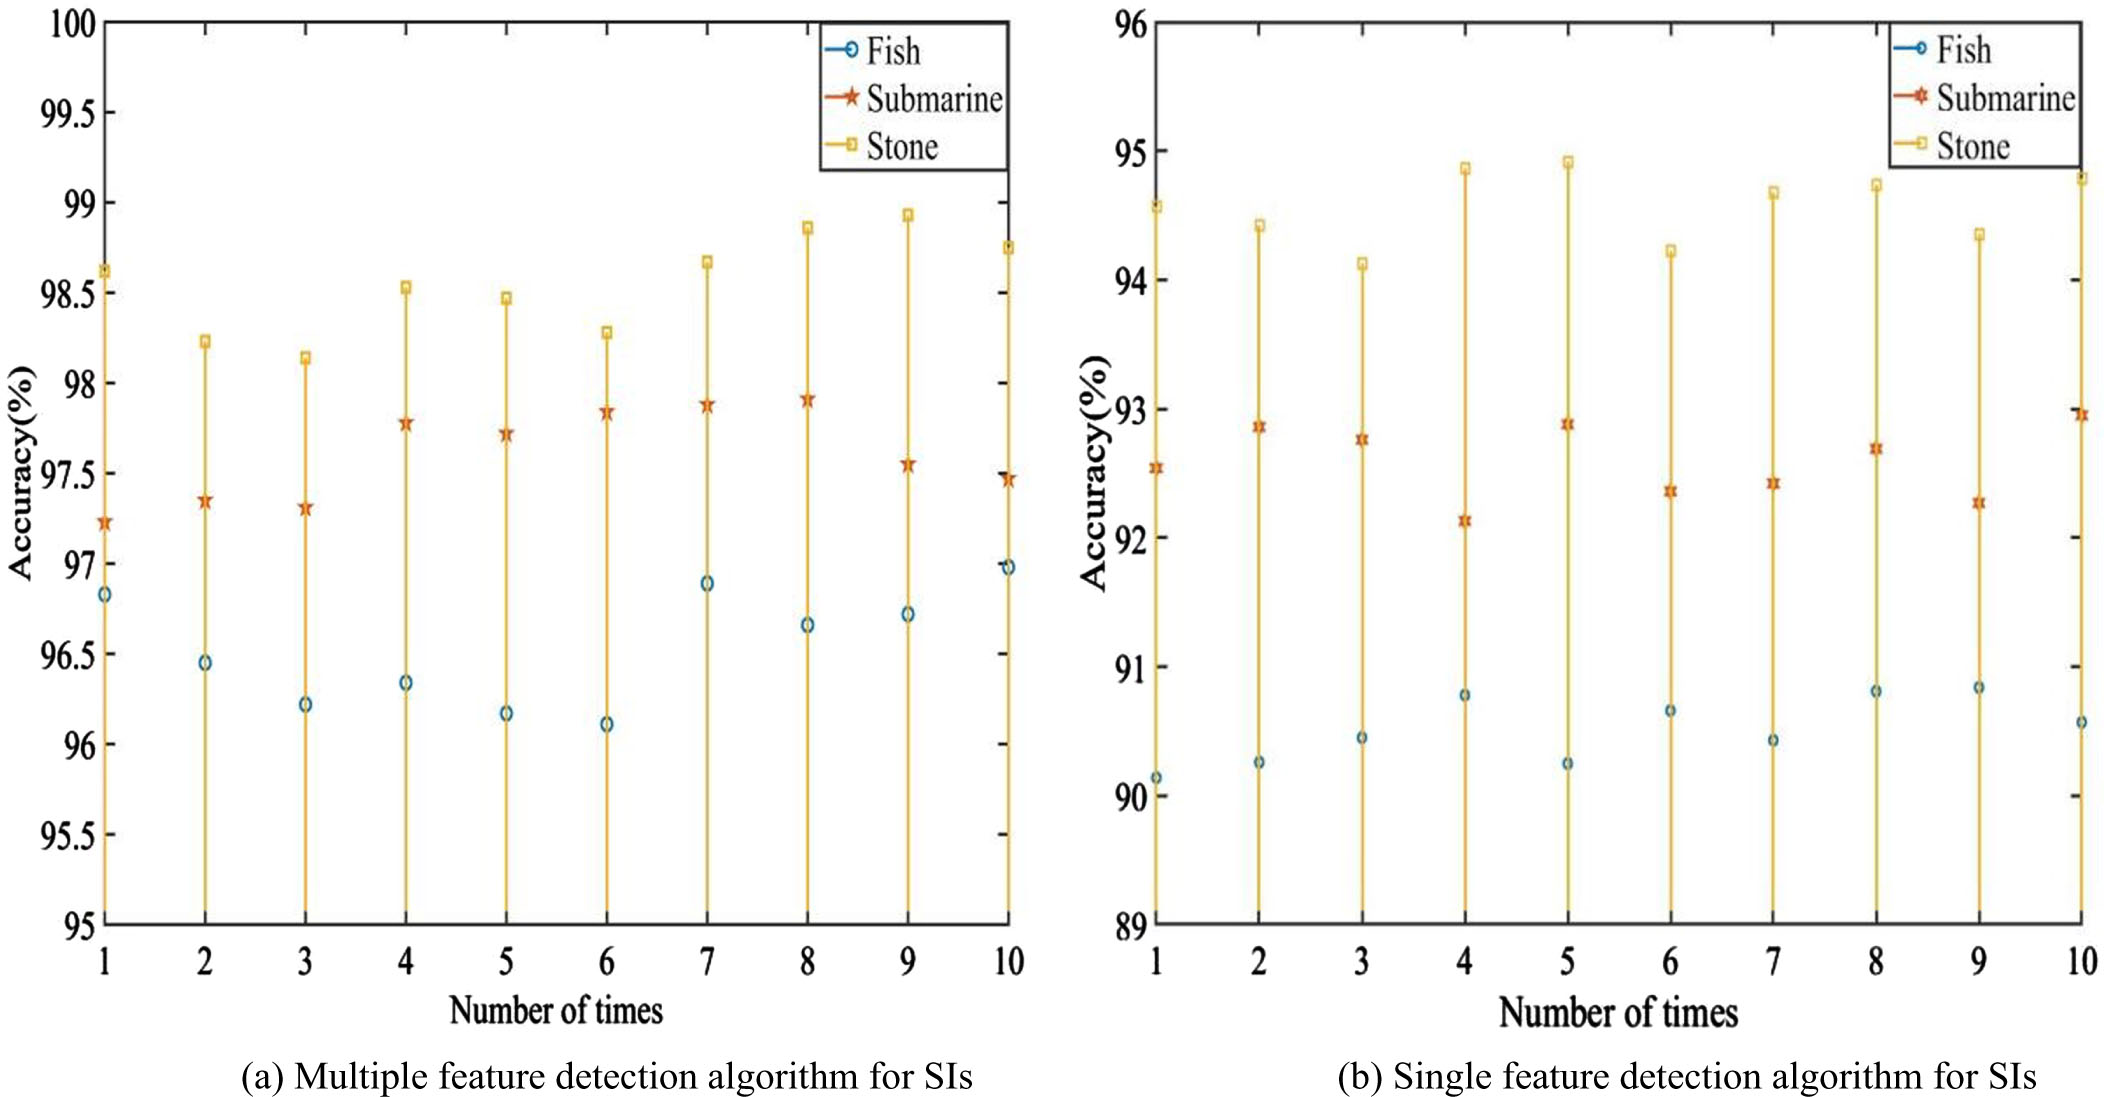
Accuracy of two algorithms under PSO.
The model sonar image target detection model constructed based on the PSO algorithm was compared with the image target detection model based on the feature fusion algorithm, and the three image targets of fish, submarine and stone were detected. A total of 10 experiments were conducted, and the accuracy of the obtained experiments was compared, as shown in Fig. 8.
As shown in Fig. 8, the target detection model built based on PSO, the total detection accuracy of three targets is much higher than that of the model based on the feature fusion algorithm. The detection accuracy of the target detection model built based on PSO is above 93.14%, while the model detection accuracy of the model based on the feature fusion algorithm is below 91.75%. Moreover, the average accuracy of the target detection model built by PSO for 10 experiments is 95.007%, which is 4.907% higher than that of the average of the model detection based on the feature fusion algorithm. The target detection model constructed based on PSO had the highest accuracy of 96.24%, and the lowest accuracy of only 93.15%, with the median value concentrated around 94.5%.
(2) Recall rate
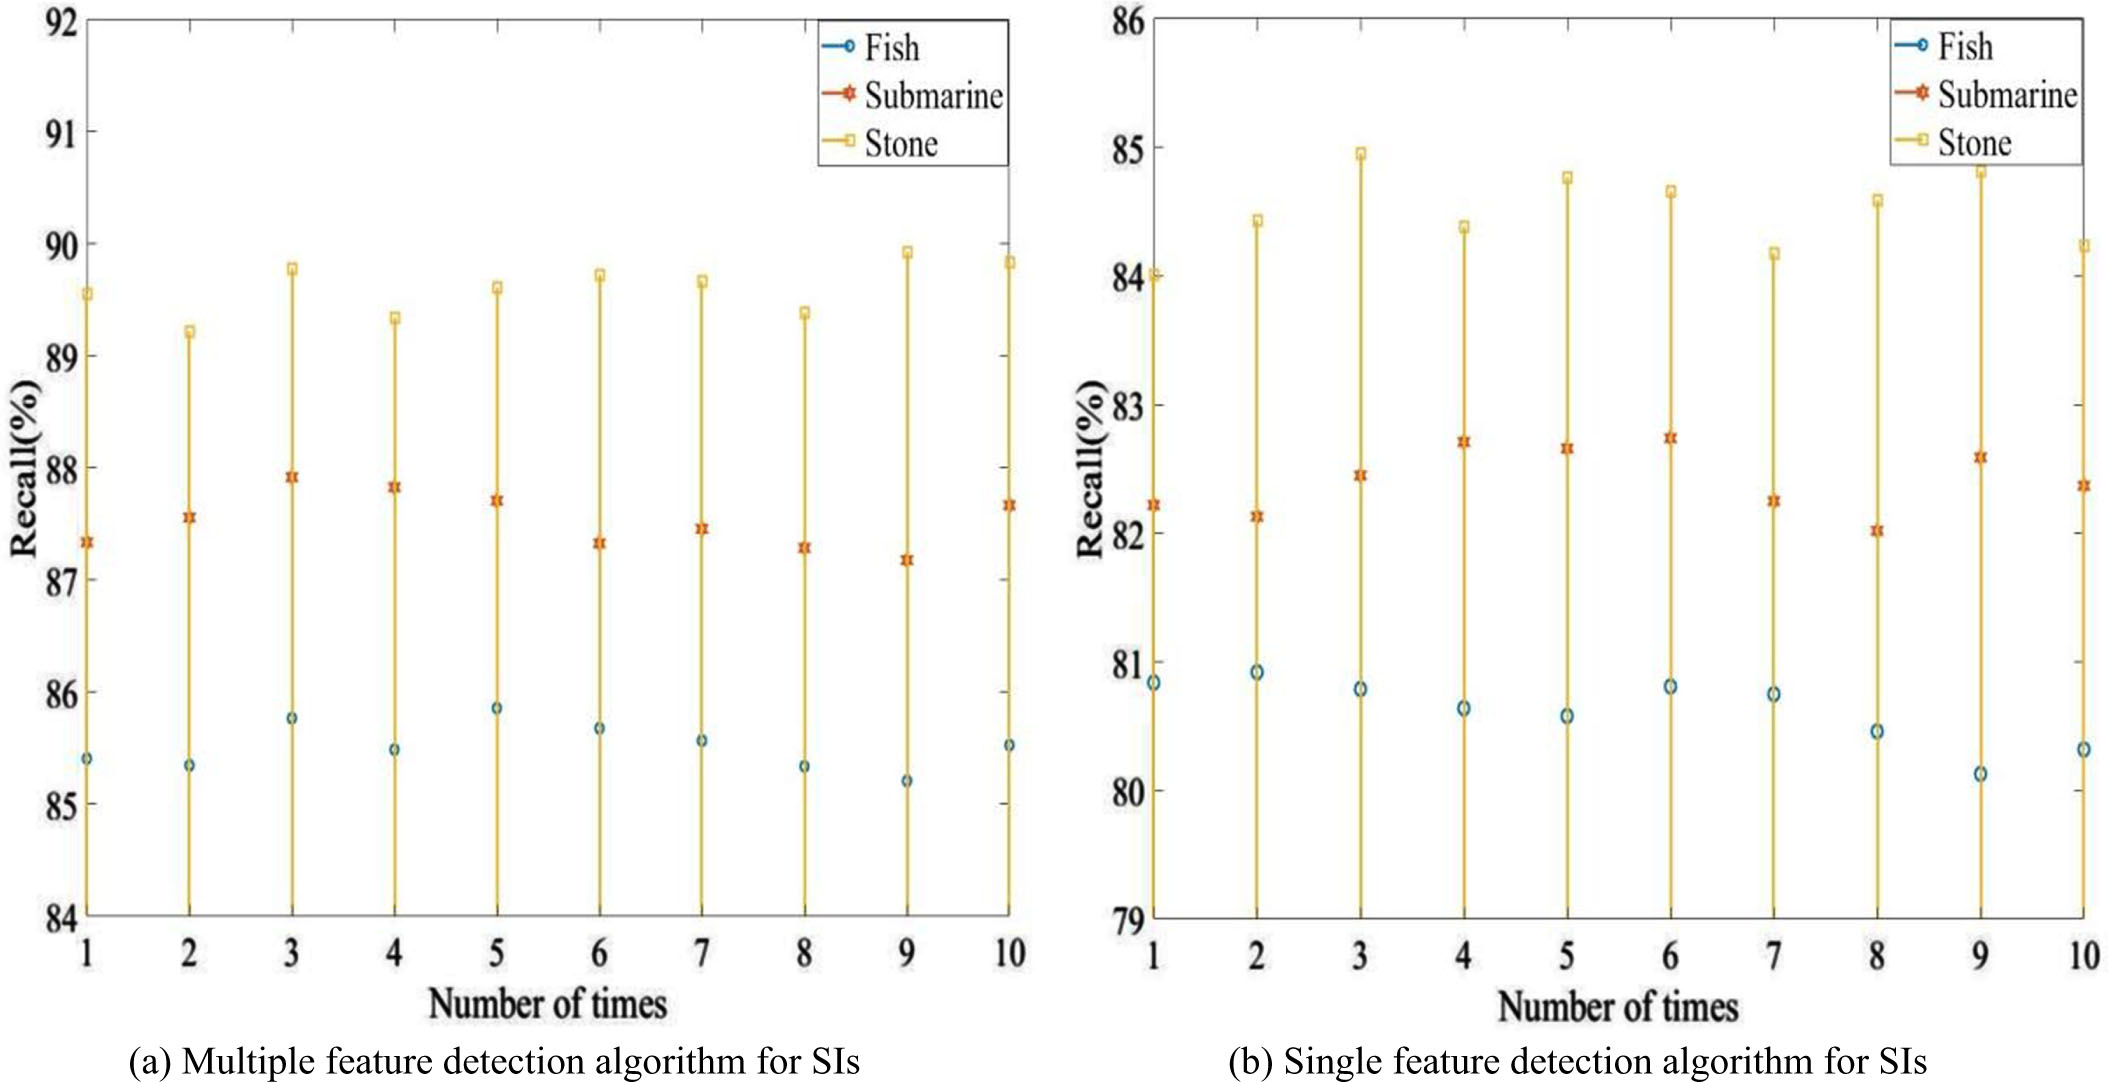
The recall rate is the proportion of the number of samples correctly predicted by the model as positive examples to the actual number of positive examples. The higher the recall rate, the stronger the model’s ability to recognize positive examples. The detection results of recall rate are shown in Fig. 6:
From Fig. 6 (a), in the 10 detections, the minimum and maximum recall rates for fish were 85.21% and 85.86%; that for submarines were 87.18% and 87.92%; that for stones were 89.22% and 89.93%. From Fig. 6 (b), in the 10 detections, the minimum and maximum recall rates for fish were 80.13% and 80.92%; that for submarines were 82.02% and 82.74%; that for stones were 84.01% and 84.95%. From Fig. 6, it can be seen that for the three detection targets, the SI MFD algorithm performed significantly better in recall than the SI single feature detection algorithm, indicating that under PSO, the SI MFD algorithm had a higher recall rate.
(3) F1 value
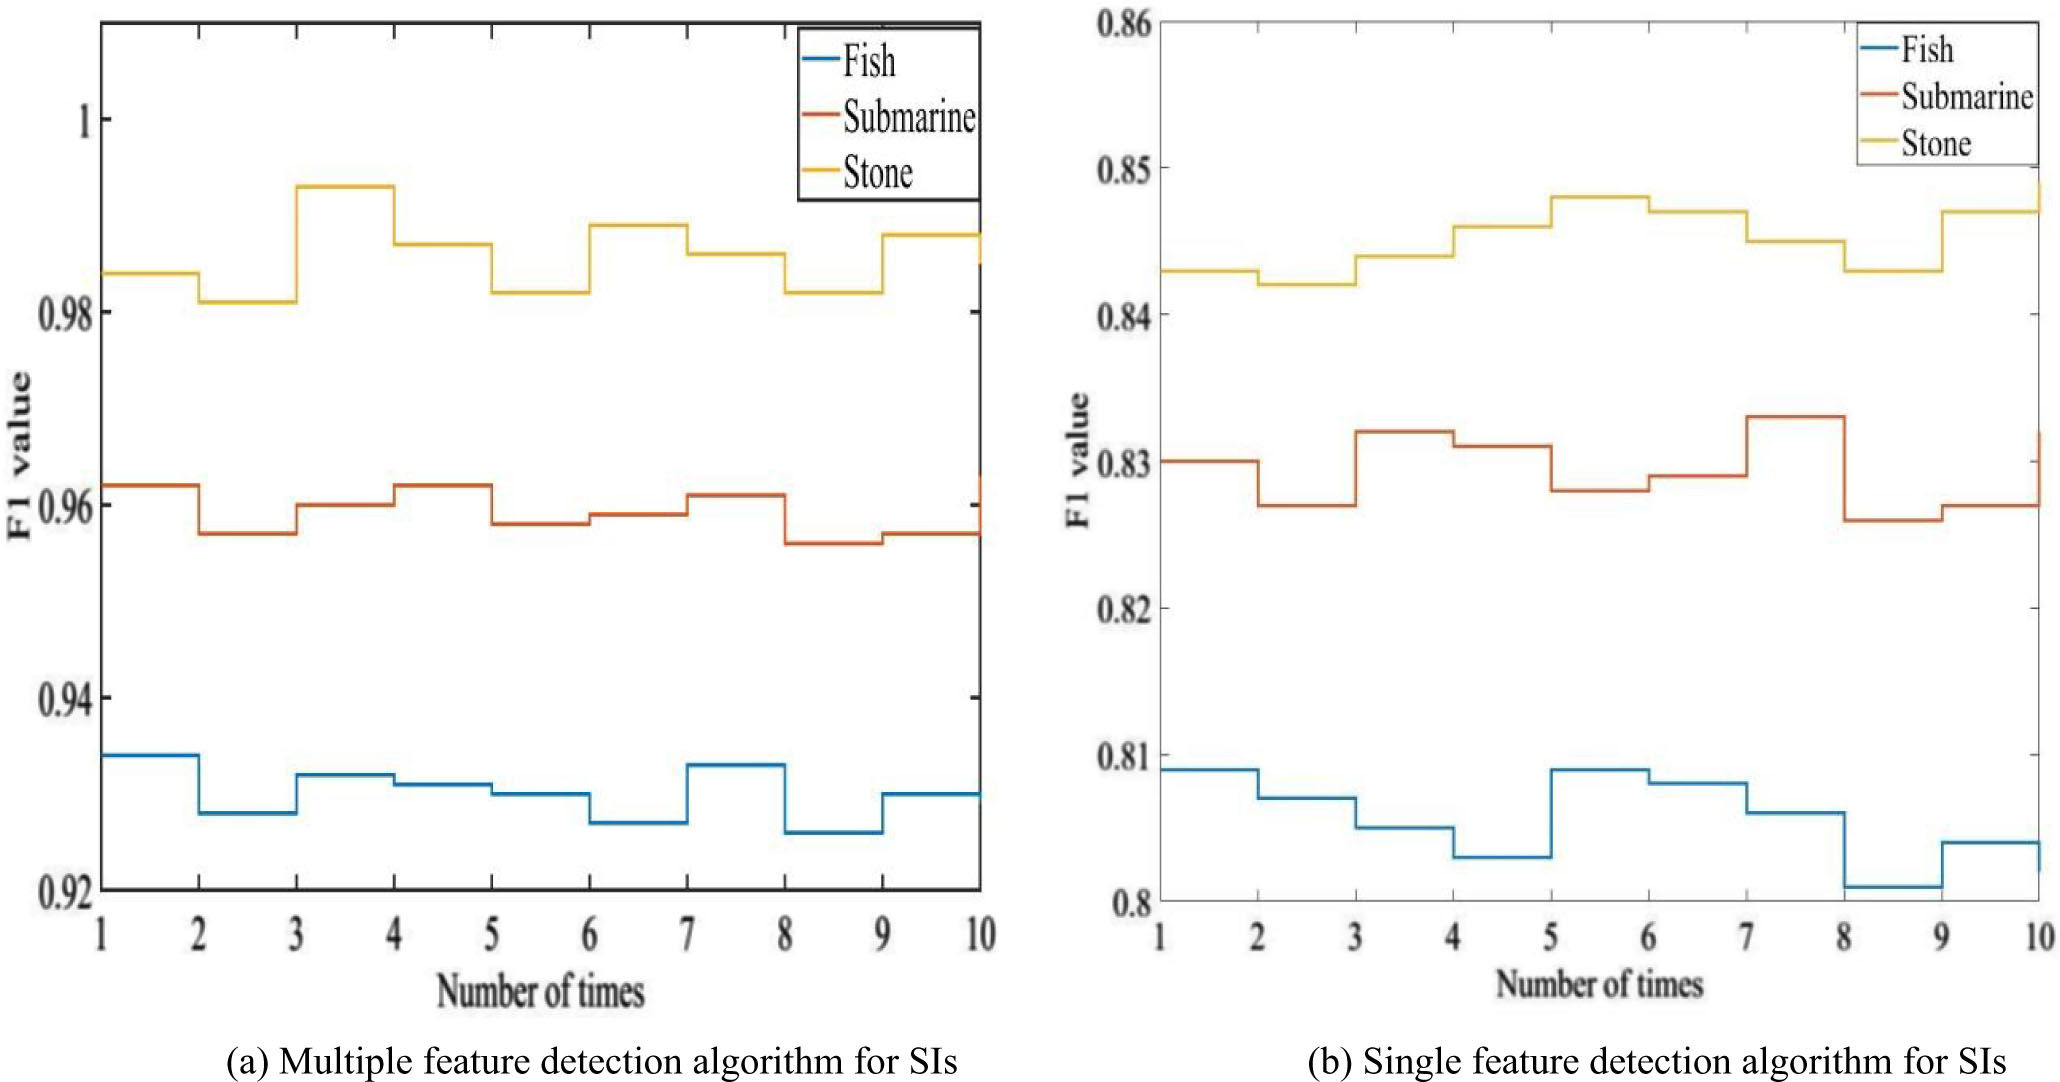
The F1 value is a comprehensive evaluation of accuracy and recall. The higher the F1 value, the better the algorithm performs in data classification. The detection results of recall rate are shown in Fig. 7:
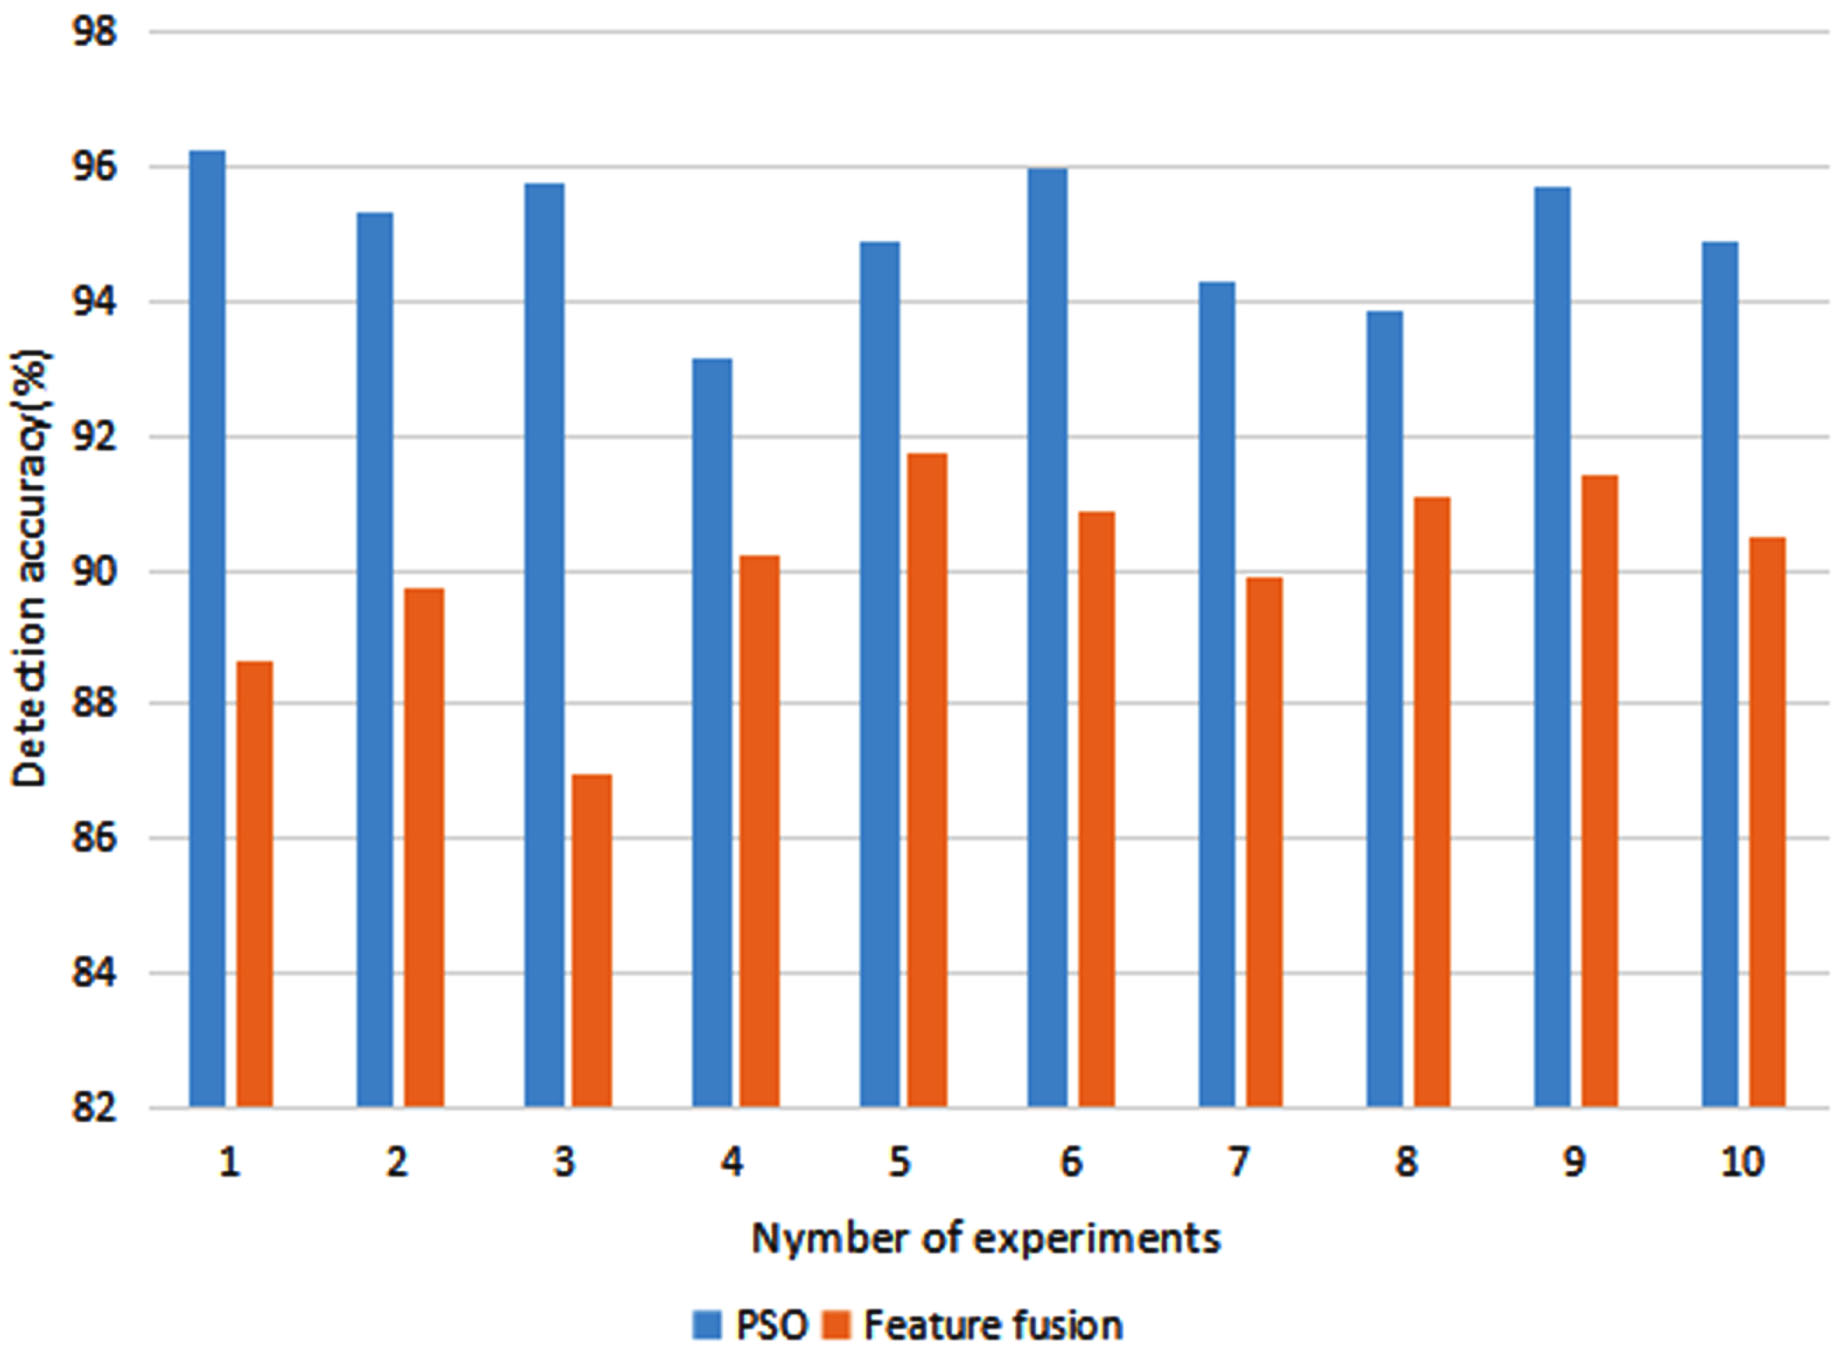
Comparison of the detection accuracy for the different models.
From Fig. 7 (a), in 10 tests, the minimum and maximum F1 values for fish were 0.926 and 0.934; that for submarines were 0.956 and 0.963; that for rocks were 0.981 and 0.993. From Fig. 7 (b), in 10 tests, the minimum and maximum F1 values for fish were 0.801 and 0.809; that for submarines were 0.826 and 0.833; that for rocks were 0.842 and 0.849. From Fig. 7, for the three types of detection targets, the performance of the SI MFD algorithm at F1 value was still much better than that of the SI single feature detection algorithm, indicating that under PSO, the SI MFD algorithm had higher data classification performance.
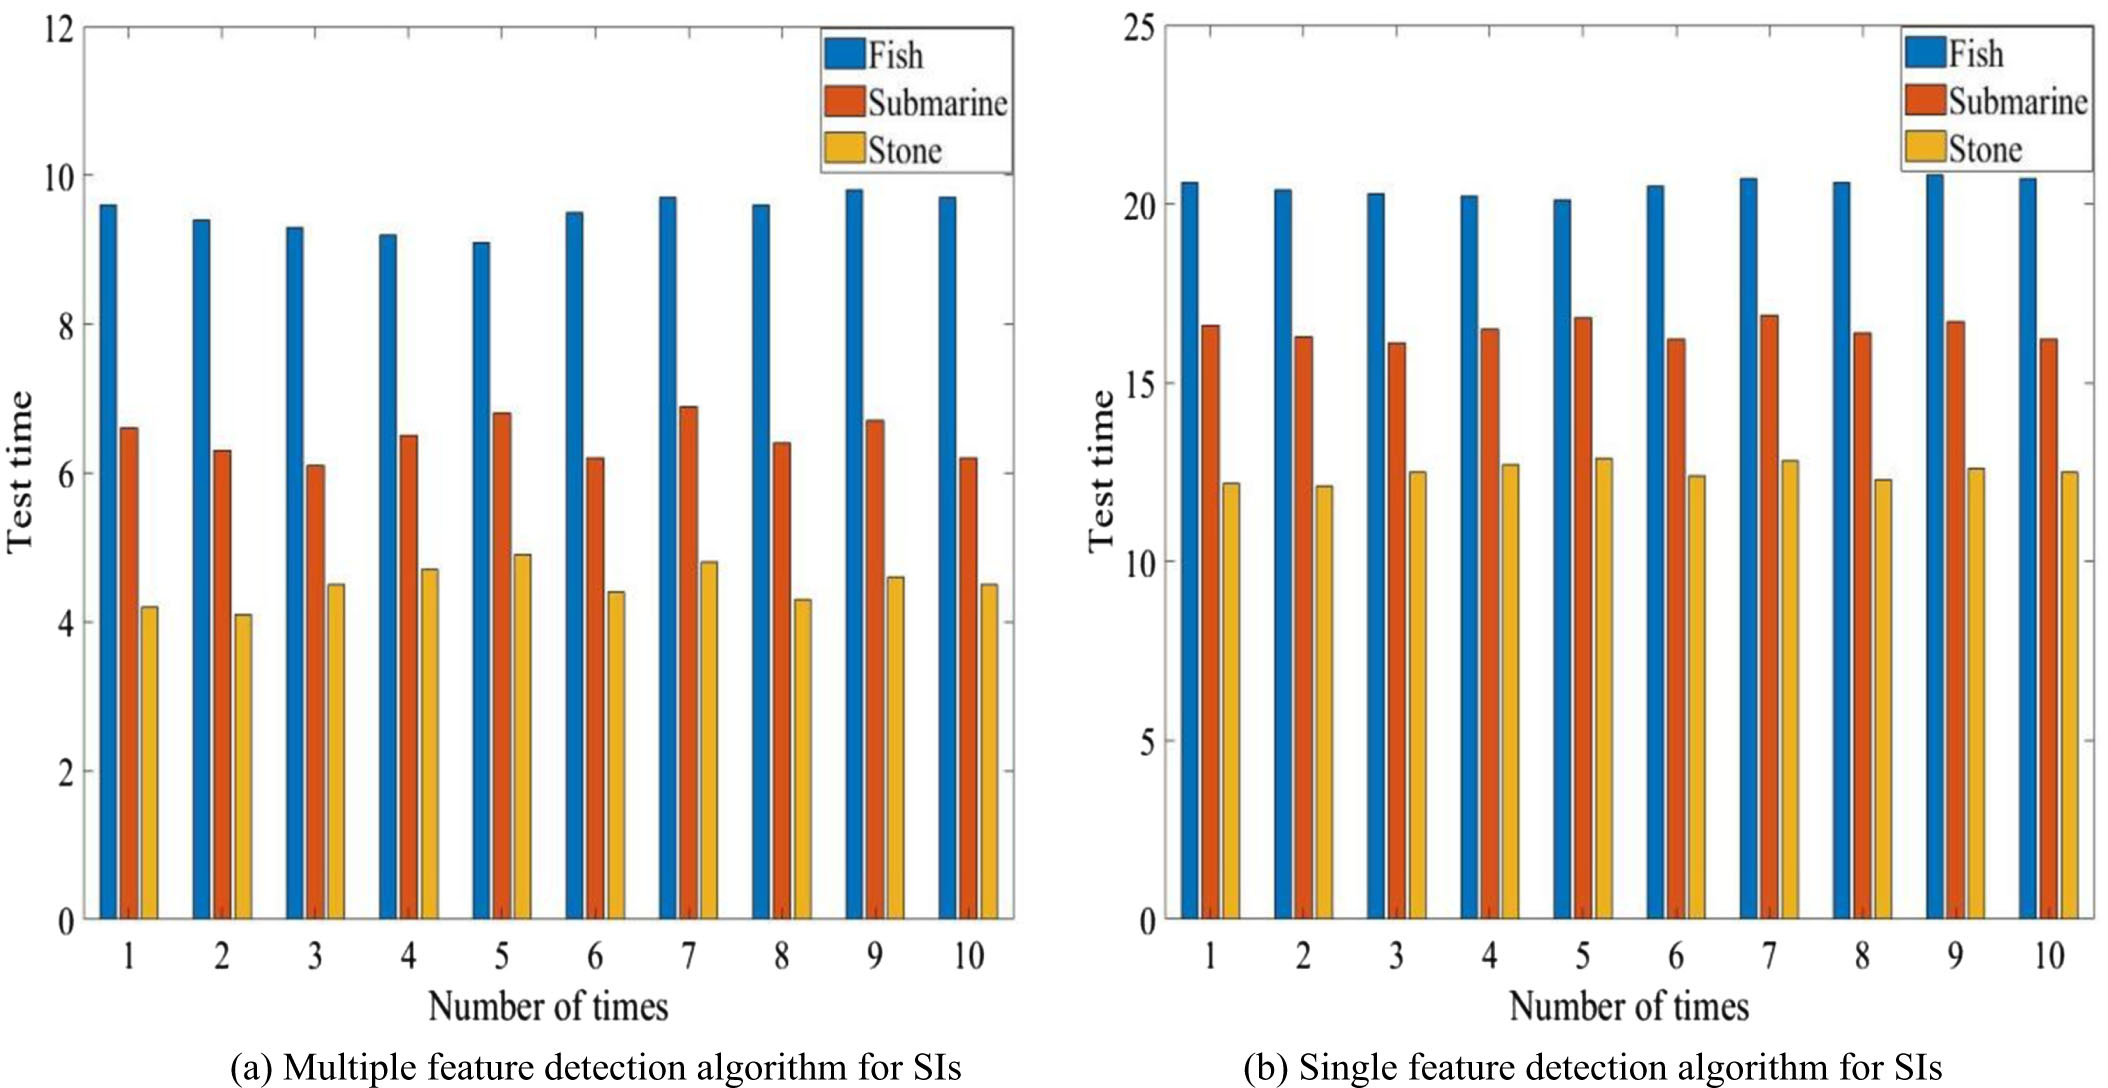
Due to the fact that detection time refers to the time spent evaluating algorithm performance, including training time and testing time, which were usually recorded and calculated in seconds to measure the efficiency and practicality of the algorithm, this article calculated the time required to test the accuracy, recall, and F1 value of fish, submarines, and rocks. The results are shown in Fig. 8:
From Fig. 8 (a), it can be seen that in 10 detections, the detection time for fish was between 9.0s and 9.9s; the detection time for submarines was between 6s and 7s; the detection time for rocks was between 4s and 5s. From Fig. 8 (b), in 10 detections, the detection time for fish was between 20s and 20.9s; the detection time for submarines was between 16s and 17s; the detection time for rocks was between 12s and 13s. From Fig. 8, the detection time of the SI MFD algorithm for three types of SIs was between 4s and 9.9s, while the detection time of the SI single feature detection algorithm for three types of SIs was between 12s and 20.9s. This indicated that the detection time of the SI MFD algorithm was much shorter than that of the SI single feature detection algorithm for fish, submarines, or rocks. This also indicated that under PSO, SI MFD algorithms had higher efficiency.
Recall rates of two algorithms under PSO.
F1 values of two algorithms under PSO.
Detection time of two algorithms under PSO.
This article would explore the effectiveness of PSO in TD in MFF SIs, and evaluate its performance in experiments. The experimental results showed that compared with the single feature fusion algorithm for SIs, the MFD algorithm for SIs performs better in accuracy, recall, and F1 values, indicating that the MFF method can achieve more accurate TD. In addition, the algorithm proposed in this article has a relatively short training and testing time, indicating good efficiency and practicality. These can all indicate that the algorithm proposed in this paper has certain generalization ability and is suitable for different types of SI OD tasks. In summary, the MFF SI OD method based on PSO proposed in this article has broad application prospects and practical value, and can provide an effective solution for SI OD. Future research can further explore optimization strategies and application scenarios for MFF methods, improving their performance and application scope.
The following features are among the constraints of the multi-feature fusion particle swarm optimization algorithm-based object detection analysis of sonar images: Multi-feature fusion sonar image target detection must choose the proper features to characterize the target, and the choice of features has a significant impact on the algorithm’s performance. 2. Difficulties in parameter adjustment: The particle swarm optimization algorithm must modify a number of parameters, including the weight factor, the inertia weight, and others. The choice of these parameters significantly affects how well the algorithm performs. In conclusion, the multi-feature fusion sonar image object recognition analysis based on particle swarm optimization technique has various drawbacks that should be judiciously addressed and improved in accordance with particular issues in actual application. In addition, various algorithms or hybrid algorithms may be taken into account to enhance the effectiveness and performance of target detection.
Declaration of conflicting interests
The authors declare that there is no conflict of interest regarding the publication of this work.
Data availability statement
The data of this paper can be obtained through the email to the authors.
Funding
This work was supported by the Research on the application of Bim in the whole life cycle of Urban Rail Transit (Foundation of Guizhou science and technology cooperation [2019] No. 1420). The special projects for promoting the development of big data of Guizhou Institute of Technology. And that also funded by Geological Resources and Geological Engineering, Guizhou Provincial Key Disciplines, China (ZDXK[2018]001).