
Abstract
In reliability analysis, the structure-function is a commonly used mathematical representation of the studied system. A signature vector is used for systems with independently and identically distributed (i.i.d.) component lifetimes. Each element in the signature represents the probability that the failure of the corresponding component will fail the entire system. This paper aims to provide a comprehensive understanding of assessing the performance of two complex systems for optimal communication design. The study compares two systems with the same components using signatures, expected cost rate, survival signature, and sensitivity to determine which system is preferred. It also provides several sufficient conditions for comparing the lifetimes of two systems based on the usual stochastic order. The results are applied to two communication systems that have the same components. The mathematical properties presented in the study have been proven to enable efficient weighting of the optimal design.
Introduction
Reliability theory is crucial in selecting the optimal design for various engineering systems. Dynamic formulations of this theory help analyze and compare working systems in real-time. A coherent system requires essential components; improving any component would not cause failure. Coherent systems appear naturally and are present in various engineering systems, such as series and parallel systems, as well as complex systems. When evaluating the performance of used systems, it is often challenging to accurately determine their residual lifetimes and related characteristics [1–5].
Numerous engineering literature books and articles delve into the theoretical and practical aspects of complex systems, networks, and reliability theory [6]. When evaluating the performance of two complex systems, it is essential to consider a range of criteria. Navarro and Rychlik [7] noted that expected lifetimes are a widely used criterion. Additionally, stochastic precedence ordering of random variables is another comparison criterion, as explained in [8, 9]. When comparing two random variables, it is essential to establish a total ordering over the space of coherent system lifetimes. However, due to the randomness of these lifetimes, total ordering criteria only reflect some average statistics of the systems, such as the mean lifetime, and are, therefore, quite limited. Instead, this article proposes a partial ordering criterion that captures the stochastic property of system lifetimes using the usual stochastic order concept frequently found in reliability studies. Although this criterion cannot provide a complete ranking of systems, it can provide helpful information about the reliability of competing systems. In the field of reliability engineering, this is a critical performance characteristic that can benefit significantly from a more detailed comparison approach [10–12].
Early studies focused on k-out-of-n systems with specific component lifetime distributions. For a thorough review, refer to [13]. More recent literature has expanded to include general system structures. There are two proposed methods for general coherent systems. Navarro and del Aguila [14] suggest using distortion functions to compare reliability. Using this method, one must construct the distortion function from the reliability function. An alternative approach, suggested by Navarro [15], is centered on minimal or maximal signatures. By obtaining mixture representations of the system reliability function, he established the necessary and sufficient conditions for stochastic order, hazard rate order, and likelihood ratio order between the lifetimes of various systems. Although these conditions are distribution-free, verifying their validity in practical situations may be challenging. Thus, there is a need to develop a direct and efficient method to compare the performance of coherent systems based on specific stochastic orders.
The “system signature” is a powerful tool for studying system reliability and comparing system performance. This concept was first introduced in [16] to describe the structure of a coherent system. The ordering properties of the signatures, including stochastic ordering, hazard rate order, and likelihood ratio ordering, are preserved by the corresponding systems’ lifetimes, mainly when the systems consist of independent and identically distributed components. Kochar et al. [17] demonstrated this through their research. Since the signature does not depend on the distribution of components’ lifetimes, this provides a distribution-free method for identifying systems with good performance. The signature-based approach is more manageable than other methods in the literature. The advantage of the signature-based approach is that it is generally easier to verify the properties of primary indices of a complex system than the properties of the system as a whole. For more information on signatures and comparative findings [18–22].
At a particular stage of degradation, failure of the system is unavoidable. Analyzing the cost rate helps determine if preventive or corrective replacement is needed. Raghav et al. [23] have devised a multi-objective approach to enhance device availability while lowering costs. Kumar et al. [24] utilized the Universal generating function approach to assess system performance. They employed Owen’s and Boland’s techniques to determine the expected time Barlow-Proshan index, tail signature, and signature of the complex system. Mutar [25] applies the Path Tracing Method to calculate the system’s reliability and its minimal signature, tail signature, signature, Barlow-Proschan index, expected time, expected cost, and Sensitivity.
Signatures can be used as a tool when comparing the performance of systems with expected component lifetimes. However, when the systems have heterogeneous components, the signature is no longer distribution-free and cannot be used to establish the mixture representation to address the comparison problem. Coolen and Coolen-Maturi [26] introduced the survival signature metric, effectively solving the problem. They derived a mixture representation of the reliability function for systems with heterogeneous components, and Samaniego and Navarro [27] used this to obtain a distribution-free condition, called the domination of survival signatures, which verifies the existence of the usual stochastic ordering between competing systems’ lifetimes. One significant advantage of this result is that it applies to systems with multiple types of components, and the sufficient condition is distribution-free.
In addition, this study considers the results from Kochar et al. [17] as a specific example where both systems only have one type of component, and r = 1. However, assuming that one system’s survival signature dominates another’s is a strong assumption that may only happen sometimes. That is why it is crucial to find weaker conditions to compare the reliability of coherent systems [28–30]. This article offers relatively weaker conditions for comparing systems with independent ordered components. Ding et al. [31] analyze systems with various components, comparing their ordered structures using survival signatures. They explore scenarios where systems have the same size and those with varying sizes. Rusnak et al. [32] utilized a derivative for survival signature approach to develop a novel method for analyzing the reliability of systems in the event of component breakdowns based on the types of components involved.
The impact of system input on output change can be determined through sensitivity assessment, also known as the Birnbaum measure [33]. Reliability engineers and network engineers can build more dependable networks by conducting sensitivity analysis on networks. Sensitivity analysis is crucial in reliability analysis as it helps measure the contribution of components (edges) in the system. Navarro [34] imposed the reliability, MTTF, and Sensitivity in a complex system with two calculated subsystems –P and Q with n-out-of-k: G and calculated m-out-of-r: G, respectively. Bisht and Singh [35] compared the failure time distributions of two systems by measuring the contribution of components in the system through sensitivity analysis. Mutar [36] demonstrated the effectiveness of using mathematical detection tests to evaluate the Sensitivity of complex system reliability.
This paper aims to determine the optimal design for the interconnection of components in a complex system by measuring some mathematical properties depending on the reliability function. The minimal path matrix algorithm constructs the reliability function for complex systems. Comparing two complex systems with identical component configurations can be done by using various metrics to evaluate their lifetimes. These measures include signature, expected cost rate, survival signature, and Sensitivity. Our approach utilizes the typical stochastic ordering method to derive these measures. By analyzing a system’s design, we can provide valuable insights into the impact of system structure on reliability. Our method is based purely on the system’s design and is more effective than the dual distortion function method. This paper has several sections. Section 1 reviews the literature on coherent binary systems and discusses concepts in reliability theory. Section 2 delves into the theoretical foundations of coherent binary systems and summarizes important concepts in reliability theory, such as signature, expected cost rate, survival signature, and Sensitivity, as identified in the literature. Section 3 presents an applied comparison of two communication models in the form of complex systems in order to choose the optimal design based on mathematical properties. Finally, Sections 4 and 5 detail the study’s results, discussion, and conclusion.
Preliminaries
Reliability of the system
In order to ensure optimal functionality, it is essential to have a system that has a coherent and monotonic structure where every component is crucial. The states of a system’s essential components determine each component’s states. Specifically, Equation (1) represents the random binary variable x
i
, which takes the value 1 for a functional state and 0 for a damaged state of component x
i
.
The system state vector, represented by
When a system has n components in Equation (2), its structure function φ is a map from {0, 1}
n
to { 0, 1 }. The order of the system is denoted by n, while random variable
The system reliability, denoted as
When (r1, r2, …, r
n
) are independent and identical, Equation (is referred to as the reliability polynomial. On the other hand,f (r1, r2, …, r
n
) are independent but not identical, then Equation (4) is known as the multivariate reliability polynomial [5]. The system’s unreliability
With q i = 1 - r i . Based on Equation (5), it can be observed that when the number of components increases, the system’s unreliability also increases. This information is helpful in identifying which components are more prone to failure [1, 2].
Graphs are a standard tool utilized in engineering to represent and define various systems. G = (V, E) is a graph that comprises a nonempty set V, which includes “nodes,” and a set E containing pairwise connections between those nodes. Both the probability of nodes and edges being operational is taken into consideration. This analysis assumes that all nodes are trustworthy. Thus, edge failure methods will suffice. Two-terminal reliability is the probability of data transfer from source to sink. The system’s reliability is the probability that minimal paths (or minimal cuts) of a reliable and operational edge link these two nodes. It is possible to use a minimal path deduction algorithm to calculate all minimal paths of a system based on its communication matrix [37–39]. To compute each minimal path using the proposed algorithm in MATHEMATICA software (Appendix), generate the incidence matrix (IM) as follows:
The rows of the matrix will be formed by minimal paths, with the components representing columns, and e
ij
= 1 iff x
j
∈ P
i
, otherwise e
ij
= 0 and i = 1, 2, …, k, j = 1 ;2, …, n. With a parallel arrangement of each minimal path included in these rows, the
Where Pr (x j ) = r j , ∀ x j ∈ P i .
Reliability theory focuses on comparing binary coherent systems in terms of their probability of functioning correctly. This comparison can be done for systems with independent or dependent components. This study will cover some fundamental theorems related to this topic.
Usual stochastic order (denoted by Hazard rate order (denoted by likelihood ratio order (denoted by
It is well known that
The proposition below includes the distribution-free comparison results for binary systems, obtained in [14, 40]. This ensures completeness and accuracy in our analysis.
Assuming that the component lifetimes are independent and have the same distribution can yield more comparison results. For additional information regarding these orders [27].
Consider a coherent system composed of n components, each with its lifetime
The system’s signature Step1: Compute the polynomial reliability function with Taylor expansion centered on r = 1 by:
Step2: Determine the tail signature Step2: Determine the signature of a system using Equation (10) as:
A helpful method for evaluating the efficacy of systems is through a mixture representation, as established by Kochar et al. [17] in their preservation results. This approach allows for a fair and thorough comparison of performance among different systems of interest.
If If If
Note that we simply have proper signature-based conditions for specific stochastic orders to hold in the avoiding hypotheses. These rules can be effective even if the signatures are not ordered [6, 41].
On the other hand, the expected cost rate is an essential factor in comparing systems. The expected cost rate can be determined by evaluating the expected lifetime of a system with i.i.d. components, with a mean (μ=1).
Finally, the expected cost rate (
This property can be used to indicate the probability of a system when making comparisons between two engineering systems [43, 44].
The concept of a survival signature as a logical extension of a signature was initially proposed by Coolen and Coolen-Maturi [26]. Considering a system consisting of two states and different component types is essential. The system includes n components, where n
k
represents the number of types K2 components that k∈ { 1, 2, …, K } and
The survival signature of a system that functions with exact l
k
of its components of type k is denoted as
Calculating a modular system’s survival signature with parallel or series subsystems can be a complex process. However, Coolen et al. [45] have developed explicit formulas that simplify this task. Furthermore, Reed [46] has proposed an efficient computational method for determining large and complex systems’ system and survival signatures. Additionally, Patelli et al. [47] have suggested a simulation method for analyzing system reliability using the survival signature. These studies provide valuable tools for evaluating system performance. For more details about the applications of survival signature in reliability engineering and networks [28–30].
When comparing two systems with independent components, it is important to consider their respective lifespans and survival signatures. Let the first system have a lifetime
In order to make an informed decision when comparing different systems, it is crucial to consider the sensitivity of their components [31]. This sensitivity is measured by their logic derivative, a concept initially introduced for reliability analysis in [10, 36]. The purpose of this measurement is to gain insight into how a change in a component’s state can affect the system’s overall performance. The formula for calculating the sensitivity
The rate of output change due to network input is measured with the aid of sensitivity assessment. It is also called the Birnbaum measure [33].
System description
Some reliability practitioners suggest that series and parallel management adequately represent the reliability networks of mechanical systems. However, this view cannot apply to all engineering systems, especially those with more complex reliability networks that cannot be described only in terms of series-parallel arrangements.
Consider two communication systems where messages are sent from identical sources to identical receivers using two transmitters (as shown in Fig. 1). A combination of series and parallel arrangements cannot represent the reliability of two systems. To illustrate the possible connections of the message from sources, transmitters, and receivers, the diagram in Fig. 1 consists of a complex interconnection [48, 49]. Minimal paths connecting node (s) and node (t) through all operational components are necessary to function both communication systems properly.
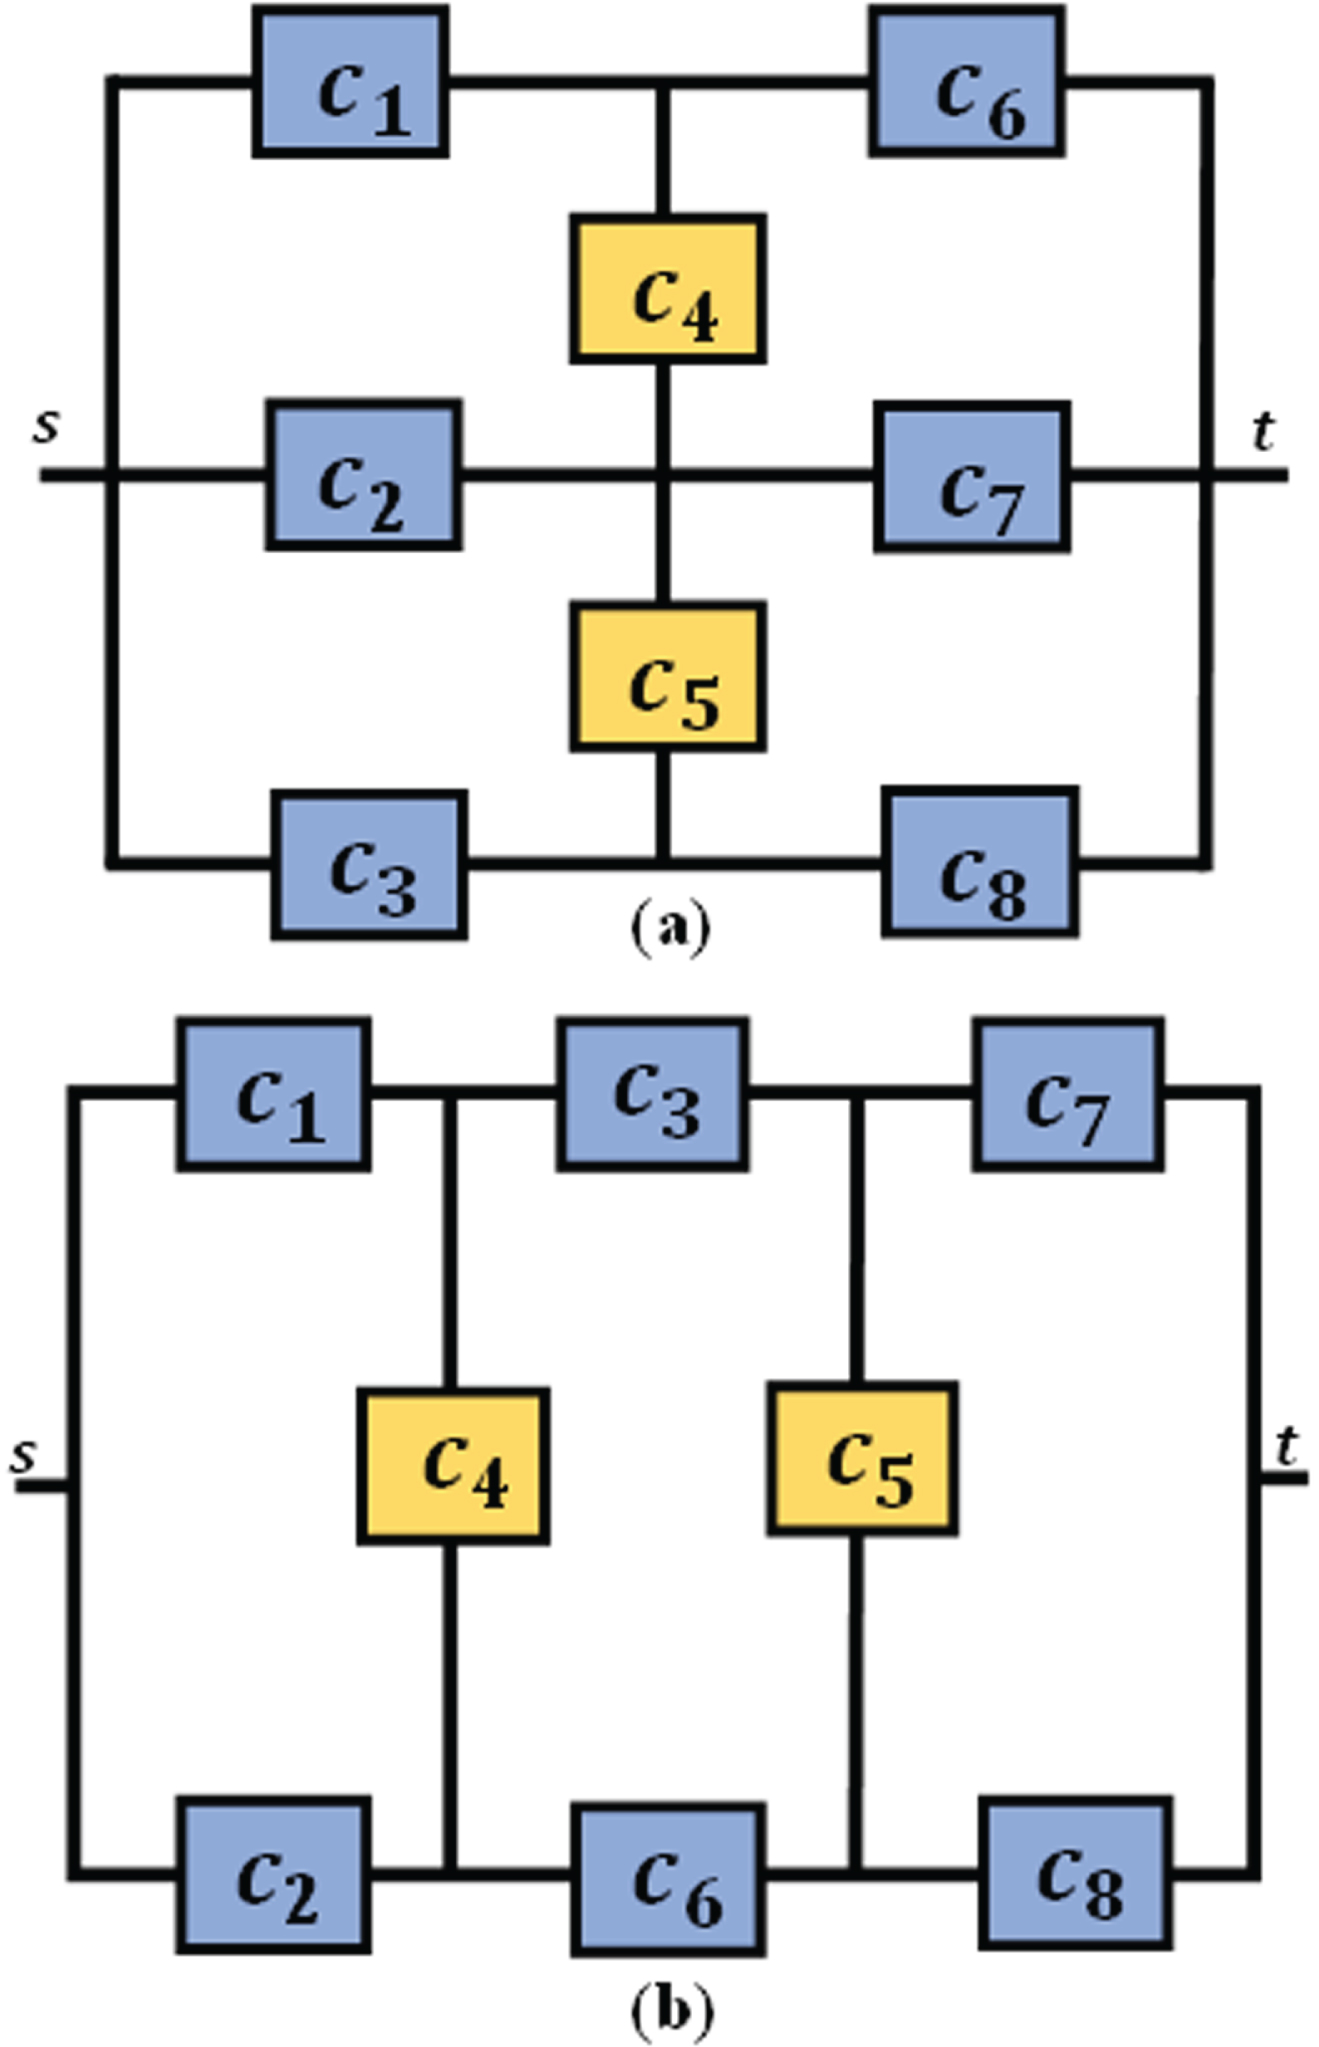
A block diagram of two communication systems has eight-components.
Calculating the reliability of the two-terminal graph is crucial in determining the probability of successful data transfer between source and sink nodes. Figure 1 can be represented by mathematical notation graphs in Fig. 2,
The two complex systems possess an order represented by the n-component and denoted as a mapping φ :{ 0, 1 }
n
→ { 0, 1 }. For our illustration, the order of the systems is 28 = 256. The focus is on evaluating the minimal paths since they provide insight into the system’s current state and energy deficiency. In order to determine the minimal paths matrix in Equation (6) for the two systems depicted in Fig. 2, utilize the provided algorithm. The minimal paths of system (a) are represented by matrix
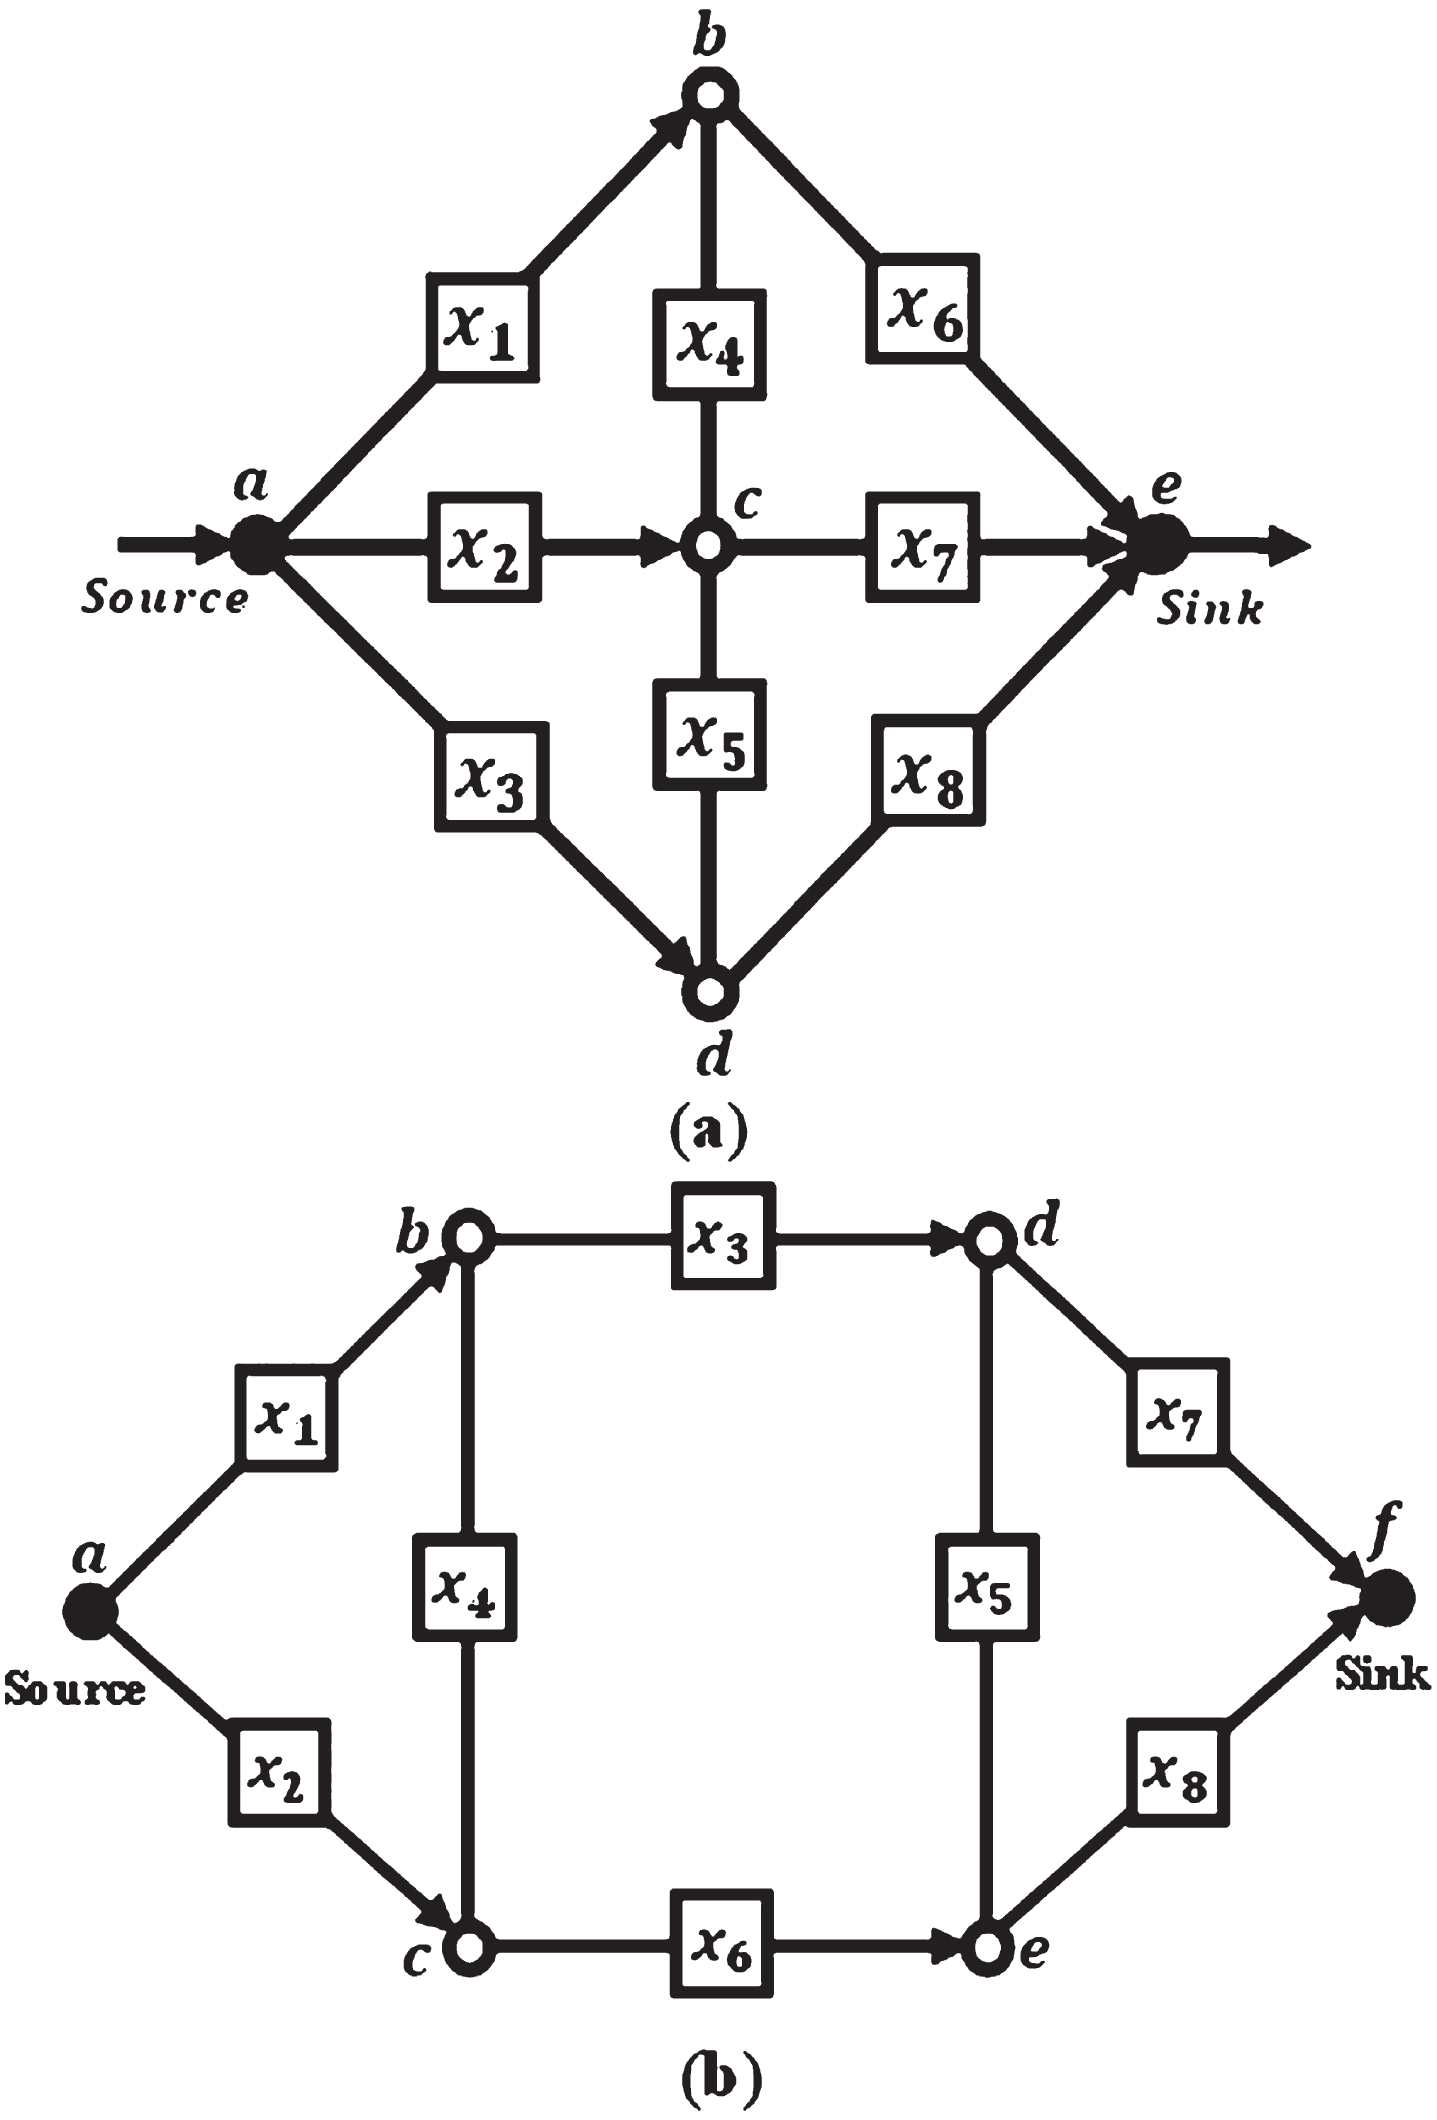
A graph of two communication systems.
Therefore, nine minimal paths of system (a) can be obtained.
And
The all-minimal paths of system (b) are
In order to determine the reliability of both systems (a) and (b), it is recommended to formulate a multivariate polynomial by input the minimal paths in Equation (7) as follows:
For i. i. d. reliability of components, Equations (23) and (24) becomes as follows:
By factoring in the reliability of various components, it is possible to determine the reliability of two systems, as shown in Table 1 and Fig. 4.
The reliability values for system (a) and system (b)
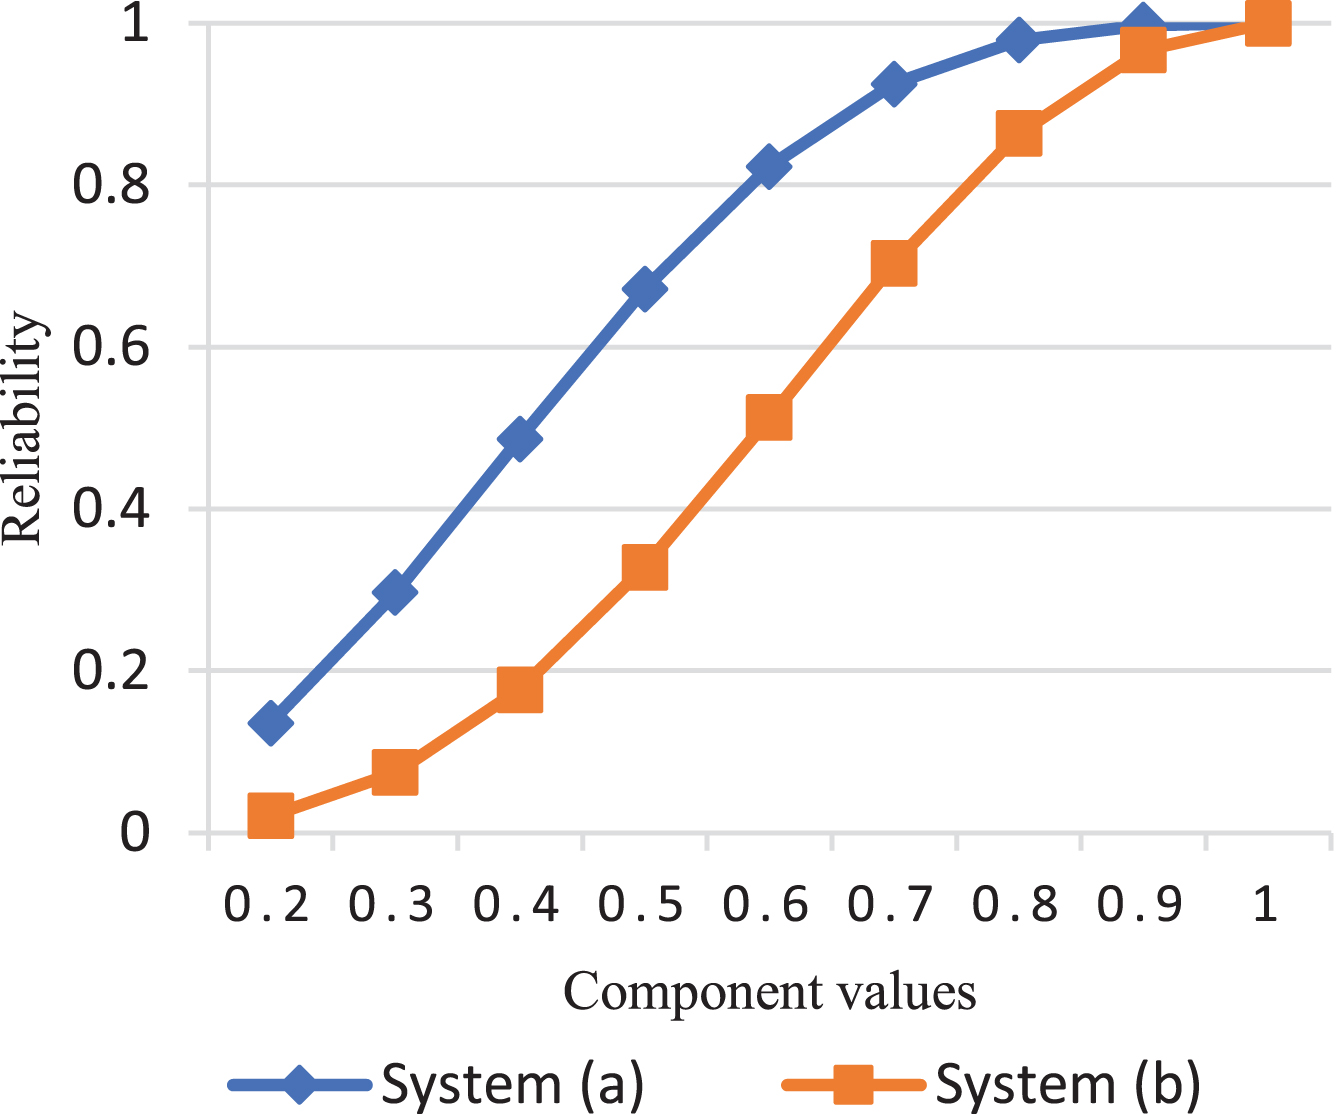
Compares system (a) and system (b) reliability.
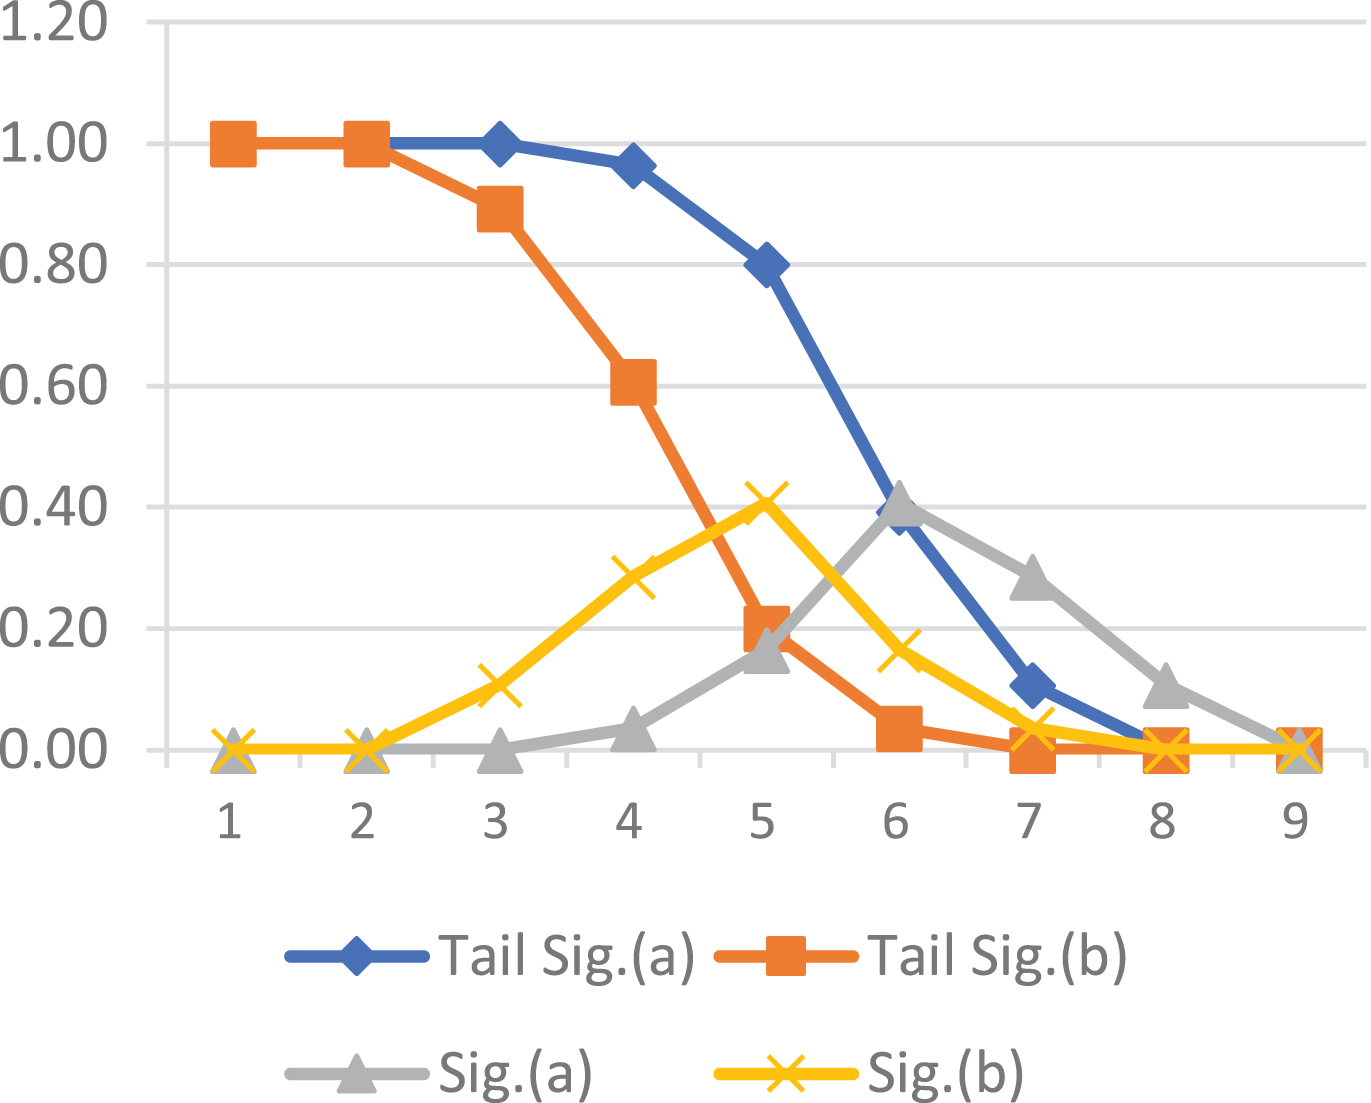
The comparison of the tail signature and signature of system (a) with system (b).
The two complex systems shown in Fig. 2 are difficult to distinguish, and it is hard to tell which is better. The difference between multivariate polynomials
Consider comparing the two systems pictured in Fig. 2. Since the difference polynomial in Equations (25) and (26) has alternating signs, identifying the better-performing system is cumbersome. However, a comparison of the signatures of these systems readily yields annswer.he steps of the method mentioned in subsection 2.4 are used to determine the signatures of the two systems. Now, substitute Equations (25) and (26) into Equation (10), respectively, the two polynomials function of the reliability function are as follows:
Consequently, the proposed method is used to display the tail signature and signature identification of both systems in Table 2.
The tail signature and signature comparison between system (a) and system (b) reliability
By examining the fourth and seventh columns in Table 2, it is evident that the inequality
To see the uniform superiority of one of these systems, let us consider the comparison of the expected cost rate between the two networks pictured in Fig. 2. To obtain the minimal signature of two systems, Equations (25) and (26) are utilized, such as:
Moreover, the expected lifetime for the two systems is computed using Equation (13) as follows:
Consider two complex systems (a) and (b) in Fig. 2, with lifetimes T
a
and T
b
, respectively. Both systems have six components (x1, x2, x3, x6, x7, x8) of type (1) and two components (x4, x5) of type (2). Components of type (1) have i.i.d. lifetimes with reliability function
The tail survival signatures and sensitivity comparison between system (a) and system (b) reliability
The tail survival signatures and sensitivity comparison between system (a) and system (b) reliability
Table 1 displays the survival signatures φ
a
(l1, l2) and φ
b
(l1, l2) for systems (a) and (b). By examining the fourth and fifth columns, we can observe that φ
a
(l1, l2) ≥
st
φ
a
(l1, l2), indicating that
Reliability and system engineers can create more dependable systems by performing sensitivity analysis on the considered systems. In order to accurately determine the contribution of each component in the system, sensitivity analysis is crucial in reliability analysis. Utilizing Equation (20) will allow for obtaining the sensitivities of the two systems. The results of this study indicate that system (a) is highly sensitive to components, while system (b) is most sensitive to components. In order to analyze multiple sensitivity measurements, the system must also consist of i.i.d. components. Table 4 displays the calculated sensitivity measurements.
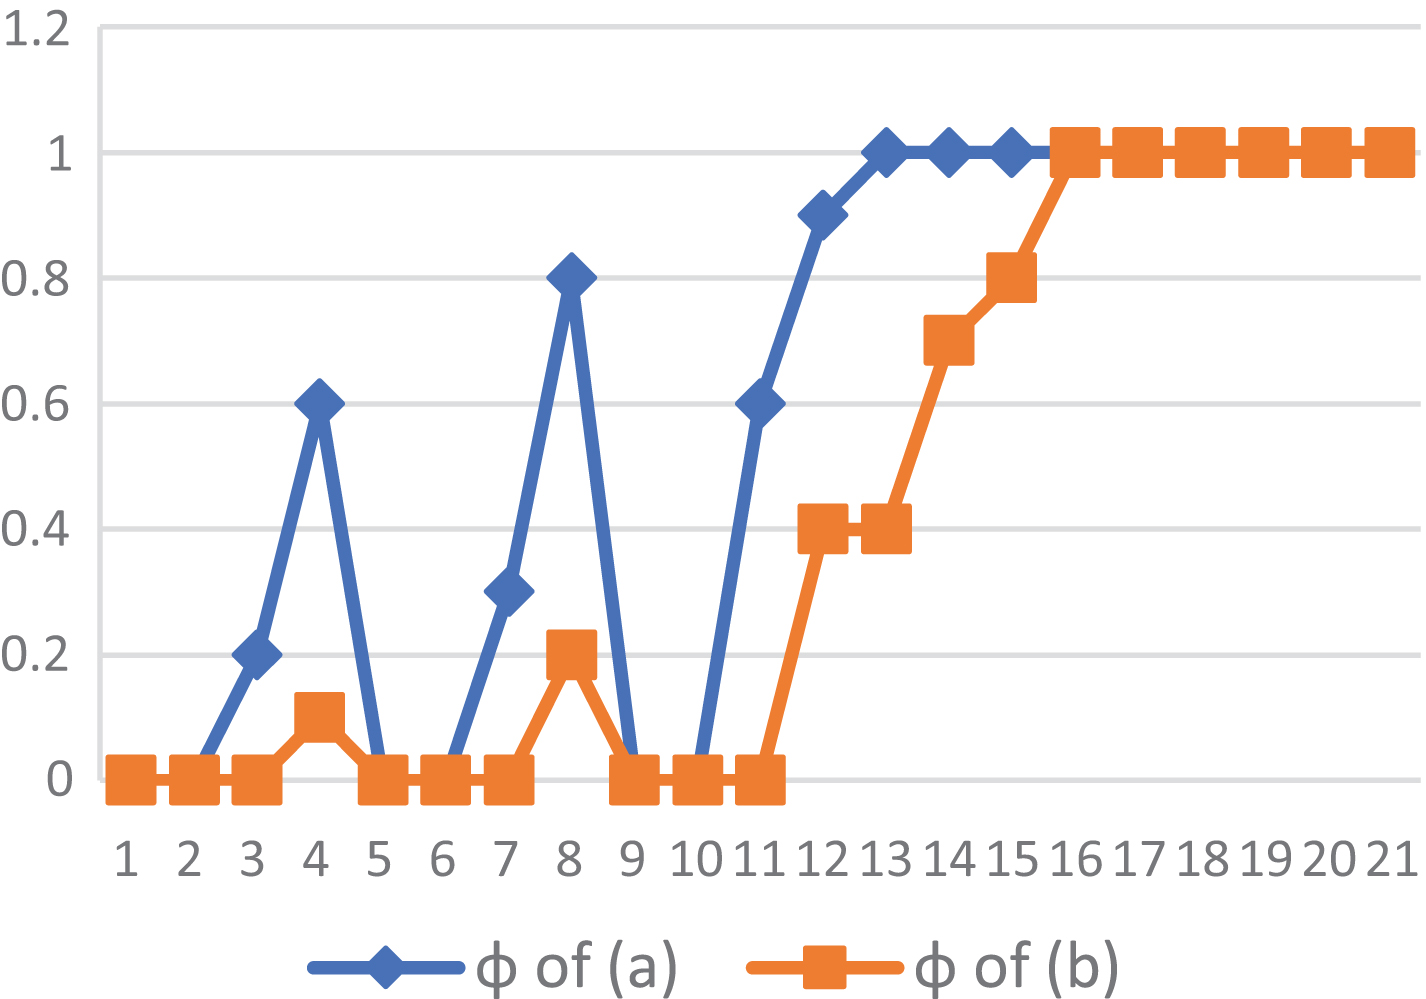
The comparison of the survival signatures of system (a) with system (b).
The tail survival signatures and sensitivity comparison between system (a) and system (b) reliability
Based on the analysis of Table 4 and Fig. 6, it is clear that t sensitivity of the two systems differs depending on their respective components. It was observed that when the reliability values of the components are increased, System (a) exhibits lower sensitivity compared to System (b).
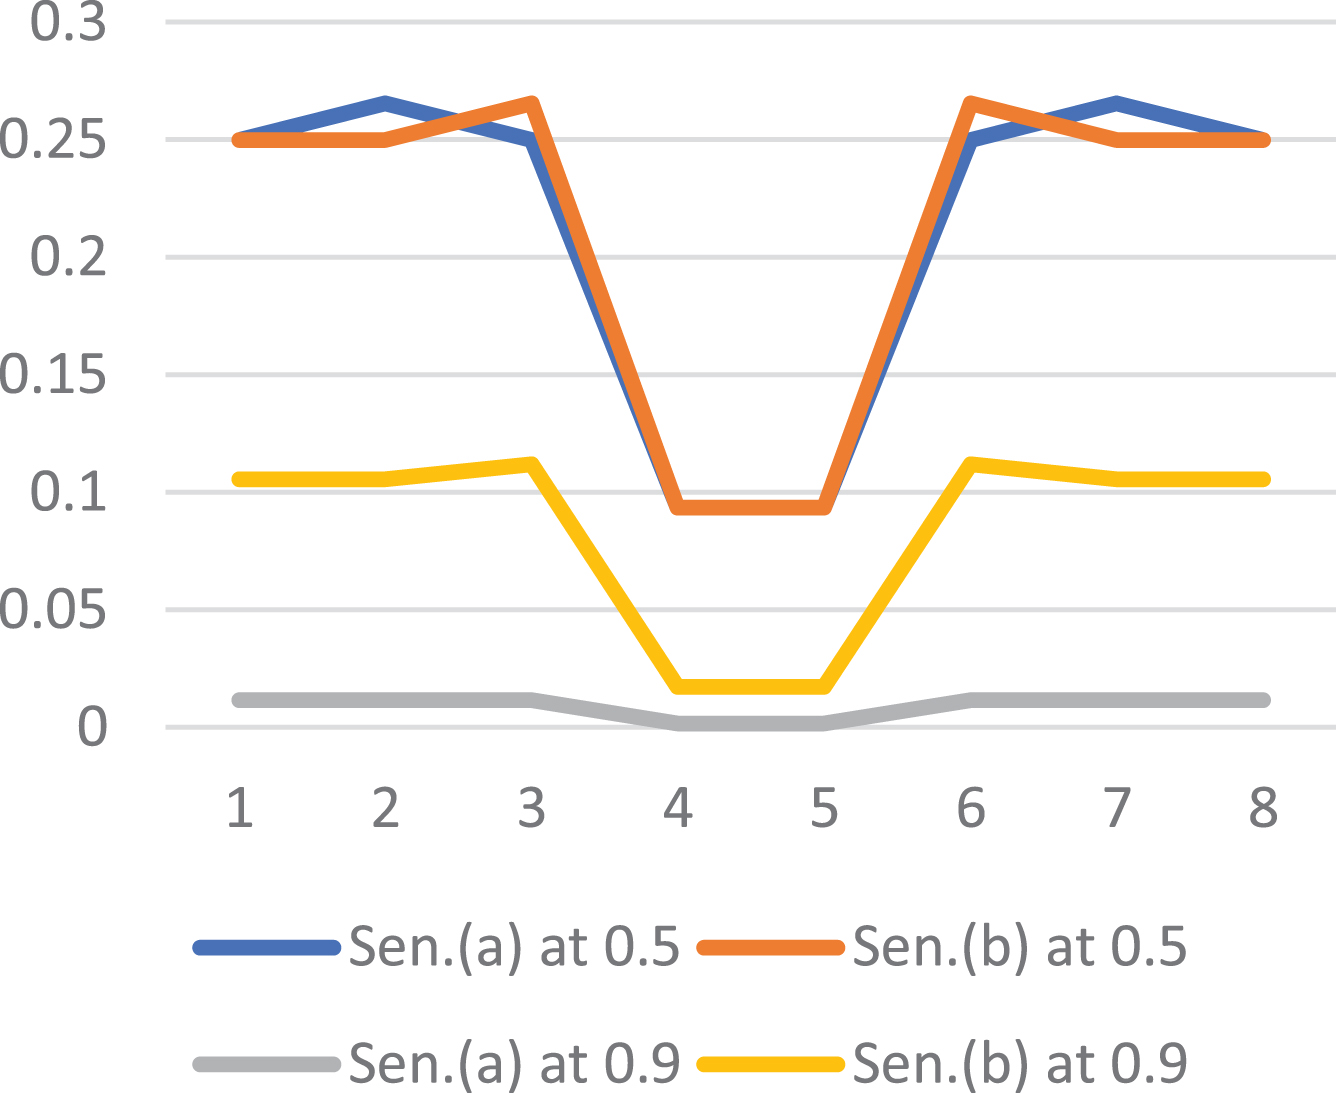
Comparing sensitivity between two systems, (a) and (b), by testing various component values.
The complexity of the process presented in this work relies on two primary calculations, namely, the first calculation of the signature and the expected cost rate based on the analysis of the polynomial reliability function. The multivariate reliability polynomial function analysis calculates survival signatures and sensitivity. Component connectivity is the critical factor in determining the most effective system design. The Tail signature is created depending on Equations (25) and (26) of two systems with identical components. System (a) is superior to system (b) because its components have a lower failure rate, as indicated in Table 2.
Moreover, system (a) has a superior component lifetime, as evidenced in Fig. 4 and the seventh column of Table 2. Importantly, system (a) ‘s expected cost rate was vastly more economical than system (b), making it the preferred option. On the other hand, by comparing the survival signatures depending on Equations (25) and (26) of two systems with different types of components, Table 3 demonstrates that system (a) has a significantly longer lifetime, as shown in the sixth column. Table 4 shows the sensitivity of each component in systems (a)and (b). Experience has shown that system (a) is the best design for the communication system based on the mathematical properties of system lifetime, cost rate, and component sensitivity.
Conclusion
This article discusses reliability concepts used to determine the reliability function of complex systems. It also presents a straightforward algorithm for calculating the minimal paths of these systems, which significantly speeds up the process of finding their reliability function. Additionally, the article provides theoretical foundations for comparing equivalent systems based on their lifetime. In order to choose the optimal design for a system where all components are the same type, Table 2 showcases the application of signature and expected cost rate principles in determining the most suitable design alternative. On the other hand, Tables 3 and 4 use survival signature and sensitivity concepts to determine the optimal system design when components are of different types. This method can assemble a system for maximum reliability and applies to a structure with n positions. Our results assume independent component lifetimes and further research into the effects of dependent component lifetimes would be theoretically and practically valuable. In real-world scenarios, system failures often occur due to the degradation of components. Our study aimed to identify the optimal design for two communication systems of equal component quantity (depicted in Fig. 2). We found that the design of system (a) has interdependence of components yield superior efficiency and reliability compared to system (b). This design also improves system longevity and resilience. However, in coherent systems, component workloads can vary depending on location and environment, leading to different degradation rates. Component reallocation and workload adjustment strategies have been introduced to minimize potential system failure costs and resource waste. It would be interesting to investigate if these strategies can be combined with signature and sl signature analysis to improve the reliability of cerent systems. Further research in this direction is needed.