
Abstract
The proliferation of artificial intelligence (AI) devices has generated an increasing demand for reliability in their utilization. Nevertheless, the significant concern persists regarding the absence of suitable assessment and testing techniques to evaluate the performance of these intelligent systems in real-world conditions. In response to these issues, this paper conducts research on the reliability testing and assessment of AI visual perception systems under vibration stress. The paper introduces the working mechanism of the visual perception system and the various testing methods for AI devices. Based on this, a reliability assessment method for intelligent devices is proposed, which uses the Fréchet distance as the measurement function and environmental adaptability as the reliability metric. Additionally, a vibration test platform for the visual perception system is established, which offers a cost-effective and reliable solution to the high cost issue of field testing for AI devices. Finally, the reliability level of the visual perception system under various vibration conditions is tested through vibration testing. The research findings indicate that the reliability of AI models decreases as the degradation caused by vibration increases, following a normal distribution.
Keywords
Introduction
With the advancements in artificial intelligence (AI) technology and the maturation of intelligent manufacturing technology, the application field of intelligent equipment and unmanned systems is constantly expanding. Applications of artificial intelligence can be seen in a wide range of industries, including autonomous vehicles, drones, telemedicine, smart delivery, and smart factories. At the system level, the intelligent unmanned system is composed of many intelligent components and conventional components. The autonomous perception of external environments can be achieved by tightly integrating artificial intelligence with external sensors and data communication technology. For intelligent systems, which involve task decision, control, and execution, the autonomous perception systems serve as the “eyes and ears” of the entire equipment at the component level. Due to its first-principle and broad application potential, the autonomous visual perception scheme has become a hot academic topic in environmental perception research.
However, intelligent equipment is inevitably plagued by issues with reliability, adaptability, and safety. In harsh environments such as low light, rain, fog, strong wind and sand, the visual perception capacity and task performance of equipment will be severely constrained. Many studies [1–4] have shown that adverse weather poses a serious threat to the execution of intelligent unmanned system tasks. At the same time, the equipment can be affected by the vibration of the platform, temperature, voltage and other factors during operation. For the visual perception system, it is inclined for AI algorithm to lose control and make mistakes if the visual signals obtained are distorted, interfered or missing. In extreme conditions, this may lead to task failure and human casualties. Therefore, the complex external environment has a high requirement on the reliability and task performance of intelligent equipment. It is crucial to conduct adequate and scientific environmental adaptability test to ensure the safe and reliable operation of equipment in challenging environments.
At the component level of AI visual system, the structure vibration of equipment, the turbulence in the atmosphere, the pavement vibration, and the tidal can affect the visual imaging. For imaging hardware, if the optical element or object is displaced due to vibration during the exposure interval, the image will be blurred or distorted [5, 6]. After the optical information is acquired by the imaging hardware, the image signal processor (ISP) converts it into a digital image signal. In the detection and decision-making, AI models are too sensitive to vibration environment, which is an significant factor affecting the task performance of visual perception system.
The reliability test of hardware equipment is generally through the shaker, temperature chamber, humidity chamber, and other test equipment to load the stress directly to the equipment. The researchers evaluate the reliability of equipment through acceptance or rejection of the test. However, the reliability of AI devices is closely related to the operating scenarios in addition to the hardware. AI devices with identical hardware configurations may show different operating performances in different scenarios. It is highly necessary to conduct thorough research into the reliability of AI visual perception devices in challenging scenarios, and to propose more feasible and reliable assessment metrics.
This research aims to address the problem that AI visual perception devices often fail to operate reliably under vibration stress, which can adversely impact the overall reliability of intelligent equipment. After reviewing various testing and assessment methods in current research, we propose reliability assessment metrics and methods specifically for AI devices based on the Fréchet distance. We design a reliability testing platform for AI visual perception systems based on the new reliability metrics. Through experimental validation using the proposed assessment strategy, we verify the environmental reliability of the AI visual perception system under adverse conditions.
The structure of this paper comprises several parts. The “Related Work” section provides a detailed description of previous studies, highlighting their results and shortcomings. The “Problem Formalization” section presents the structure of the visual perception system and imaging mechanism. The reliability assessment metrics and methods of AI systems are in the “Reliability Assessment of Artificial Intelligence Device” section. The “Vibration Test Platform” section describes the design of the reliability test platform under vibration stress. The proposed methodology is validated, and test data is obtained in the “Test” section. Finally, the “Conclusion” section presents the conclusions of this research.
Related work
Test method
In the field of reliability and safety assessments, test methods are commonly differentiated into field testing and laboratory testing. Laboratory testing, which simulate environmental stresses, is deemed to be more convenient and implementable compared to field testing. At the same time, digital simulation is also employed as a scientific approach for some functional testings.
Despite this, some manufacturers of autonomous vehicles still persist in using field testing to evaluate the autonomy of self-driving vehicles [7]. Field testing and verification can assess the environmental performance of AI equipments in real-world scenarios, but the testing is inefficient and uncontrollable, a large number of scenarios are required to meet the assessment requirements. At the system level, Carlson et al. [4] analyzed the main factors contributing to the failure of unmanned ground vehicle (UGV) during field testing and proposed a new fault classification method. It is found that the main causes of UGV failure are narrow operating environment and unstable center control unit. In order to improve the reliability of unmanned vehicles in field conditions, further adequate testing is needed. Hong et al [8] analyzed driving reliability using publicly available data on autonomous vehicle mileage. Nonetheless, it should be acknowledged that data related to the reliability of AI systems remains relatively scarce and sensitive. At the component level, researchers are primarily focused on the perception system. To evaluate the impact of camera vibration frequency on image quality on unmanned aerial vehicle (UAV) platform, Huang et al [9] utilized the field test method to gather a large number vibration images with noise to test image processing algorithm. However, the limitations of field testing are also obvious, including limited test scenarios, unpredictable environmental factors, and a restricted sample size.
Field testing of intelligent equipment in complicated and dangerous environments presents a formidable challenge. Given the presence of extreme conditions such as fire, ice, snow, and vibration, it is imperative to assess the adaptability, for which laboratory testing is a suitable alternative. At the system level, there are few researches on the energy management of UAVs in extreme environments. Li et al. [10] studied the flight performance and battery performance of UAVs in an environment test chamber with wide temperature conditions, including extremely high and low temperatures. The environment test chamber simulates the real temperature outside. In the controlled indoor scenarios, the MIT research team [11] tested the hardware prototyping and performance of algorithms for multirobot systems. At the component level, Hasirlioglu et al [12, 13] investigated the adaptability of the environmental perception module of an autonomous vehicle to extreme environments such as rainfall and dense fog. Zhao et al [14] employed the hardware-in-the-loop to simulate and test different models of intelligent cameras, and proposed a new assessment method to advance the development of intelligent camera technology. Reway et al [15] utilized above method by Zhao et al [14] to evaluate the performance of vision-based autopilot assistance system algorithms in different scenarios, including daytime, fog, late night, and dusk, and provide a qualitative description of the algorithm performance in these environments.
The system complexity presents a significant challenge in the testing of intelligent devices that depend on sensors. Given the constraints of cost and time, it is practically unfeasible to conduct a comprehensive hardware test in real-world driving. As an alternative, digital simulation methods can be employed to test control systems and frameworks at the software level. However, these simulations do not account for the impact of external factors, leading to significant discrepancies between simulated and real results when external sensor data is disturbed or the hardware structure of the sensors is flawed. Elgharbawy et al [16] developed a new method to inject faults into the simulation system to test the response ability of the system to sudden failures. Szalai et al [17] introduced a mixed reality simulation environment, which combines real test vehicle with a virtual environment, and includes the capability to handle real and virtual obstacles, traffic simulations, and visualization of all elements. Tuncali et al. [18] presented a closed-loop virtual test framework to evaluate autonomous vehicles with machine learning (ML) components using test case generation and requirement falsification methods to identify problematic scenarios. Zhao et al. [19] presented a Conservative Bayesian framework to assess autonomous vehicle safety incorporating prior knowledge and failures. They apply software reliability growth models (SRGMs) to Waymo [20] disengagement data, showing models can forecast reliability if recalibrated against observations. Despite these advancements, it should be acknowledged that the digital simulation method can help researchers test the internal software, but for the complex system of software and hardware coupling, the digital simulation has obvious limitations.
Optical imaging and vibration
The adaptability of visual perception devices to maintain functionality in the presence of vibration needs to be taken into account when intelligent systems are utilized in various field applications. Despite attempts to stabilize the camera through the use of tripods or stable platforms, shock and random vibration cannot always be avoided [21]. Some scholars research the relationship between optical imaging and vibration. Nishi et al. [21] proposed a new method for measuring camera vibrations such as camera shake and shutter shock to detect the vibration trajectory and transient waveforms from the camera image. The vibration of the UAV platform can have a detrimental effect on the structural detection process [9]. Li et al. [22] studied the diffraction efficiency of binary optical element (BOE) and analyzed the effect of the incident angle on its diffraction efficiency. They constructed the displacement-image shift model caused by the vibration of the platform. Zhou et al. [23] found the impact of vibration on quality of aerial camera imaging, and established a mathematical model connecting structural vibration response and imaging quality. Xue et al. [24] presented an image-based and easy-to-implement method for linear array cameras to directly measure the motion of images captured by the camera. Wang [25] and Li [26] et al. proposed a novel method for vibration measurement based on motion blurred images, and calculate vibration amplitude from a single blurred image based on machine vision. Bschaden et al. [27] proposed a method for determining the time constants of micro electro mechanical system (MEMS) thermal actuators by analyzing blurred still camera images of high frequency motion and observing the response of the actuators to harmonic excitation, which decreases with increasing frequency. Hoang and Kang [28] proposed a convolutional neural network based approach to diagnose rolling element bearing faults using vibration images as input. This achieves high accuracy without requiring feature extraction and is robust to noisy environments.
Assessment methods of AI system
Performance evaluation of an AI system refers to the ability of the AI model to produce the correct output for a prescribed input. In the case of classification, object detection, or instance segmentation models, the model learns the pattern of inputs and outputs and assigns the new inputs to prescribed categories. According to international standard organizations, reliability is defined as the property of an item expressed by the probability that it will perform a required function under stated conditions for a stated period of time. With that standard definition, it is imperative that intelligent systems and AI models also undergo a reasonable assessment of their reliability using appropriate metrics to ensure reliable operations in complex environments. To quantitatively evaluate the AI models, various evaluation metrics have been proposed, including Accuracy, Precision, and Recall. Receiver operator curve (ROC) and Area Under the ROC (AUC) are also used in machine learning and AI competitions for measuring the quality of AI models. Tian and Zeng et al. [29] addressed the problem that deep learning models are too complex in the evaluation process and different algorithms should rely on different frameworks. A scalable deep neural network (DNN) model evaluation toolbox called EvalDNN is proposed to evaluate the robustness of models under adversarial samples. Tremblay and Halder [30] et al. studied the robustness of visual perception models under challenging weather and qualitatively analyze the effects of rain and fog on the performance of object detection and instance segmentation algorithms, though this analysis did not provide interpretable patterns of performance variation. Hong [8] et al. analyzed a new nonparametric model based on monotonic splines to quantify uncertainty and test for heterogeneity in event processes based on available reliability data of AI systems. Li et al. [31] investigated the correlation between the amplitude of high frequency vibration and model performance in simulation-based vibration blurred images and the linear correlation is obtained. Kim [32] et al. proposed eco-friendly low resource security surveillance framework that accelerates the active participation of low resource devices, the devised method is performed by expanded simulations and the achieved result is evaluated. Cai et al. [33] proposed an AI reliability assessment method combining Bayesian neural networks and differential evolution algorithms to accurately evaluate product life with small samples. The method is verified by an accelerated life test of a subsurface electronic control unit.
Problem formalization
Visual perception system
The visual perception system (VPS) is the carrier of autonomous vision scheme of intelligent equipment, and constitutes a crucial aspect of the overall environmental perception mechanism. The VPS consists of two fundamental components: the scene acquisition unit (SAU) and the algorithm processing unit (APU), as depicted in Fig. 1. The optical lens, zoom mechanism, body, image sensor and image signal processor are in SAU, which convert optical signals into digital signals, while the digital signals are handed over to APU for further processing. The performance of the intelligent perception model is contingent upon the efficiency of the algorithm model, learning framework, and the operating environment. The VPS employs hardware, such as cameras, to convert visual information into digital signals, which are then transmitted to the central processor for further processing. The intelligent perception model within the VPS is capable of transforming raw image signals into distinguishable image features and producing processed task objects and recognition results. Overall, the VPS enables intelligent equipment to autonomously perceive and interpret complex visual inputs, through its integration of specialized hardware for image capture and advanced algorithms for recognition and understanding.
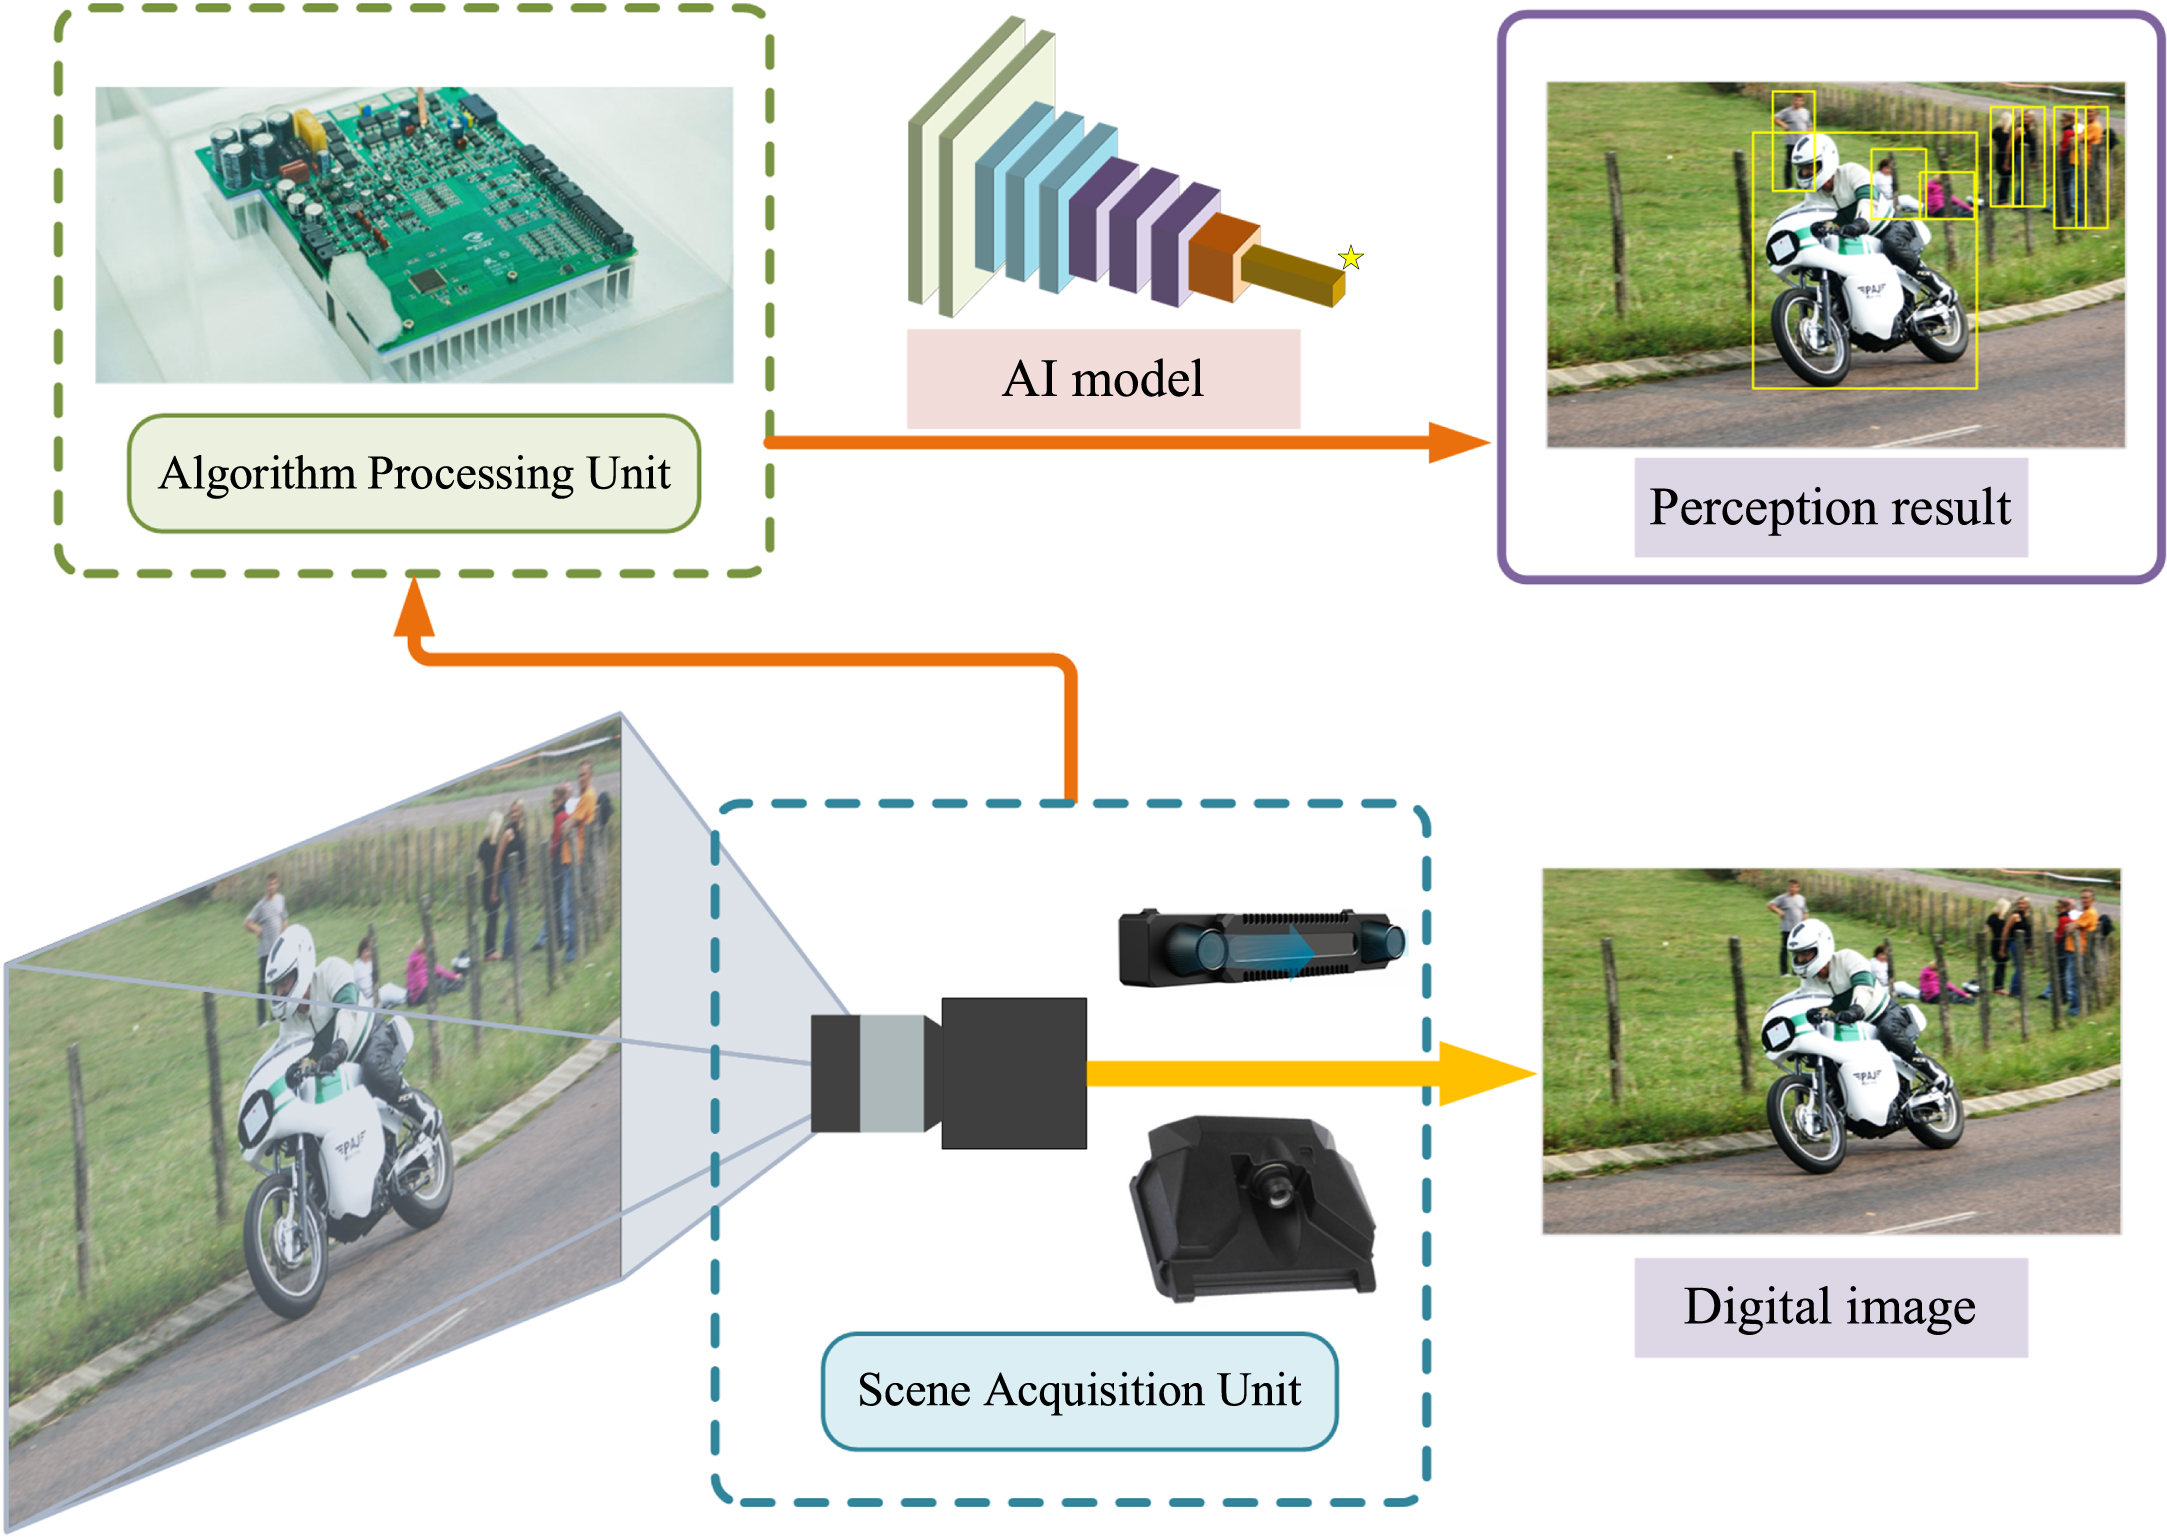
The physical implementation of visual perception system.
The VPS employs an intelligent perception model that functions in two distinct stages. In the initial stage, referred to as the training stage, the intelligent model needs to extract training data from the environment to obtain the knowledge required for the vision task, resulting in the generation of the model parameter vector. The data used for this training process is referred to as the training set and the environment where the data is collected is referred to as the training environment. The subsequent stage is referred to as the task stage, in which the model completes the prescribed visual perception task based on the acquired knowledge. In the task stage, the model’s performance is evaluated through testing and validation using task scenarios. The data obtained from the task environment during this stage is called the test set, and this environment is referred to as the task environment.
The general principle behind the intelligent perception model is that the environment in both training and testing stages is consistent. That is to say, the training and test data of the AI model are independent of each other and follow the same distribution
The acquisition of clear images is a complex process that depends on a number of factors, including suitable lighting, a stable platform, and a well-focused optical lens. However, in field conditions that are often characterized by challenging weather and high-speed equipment, these conditions are not always met, resulting in blurred images. The image acquisition process involves a series of steps that culminate in the generation of each image. The process begins with the rapid opening of the shutter during the exposure interval, which allows photons to pass through the optics and shutter and be projected onto the vision sensor. It is assumed that the object being imaged remains stationary during this time. Once the optical information has been collected, the vision sensor converts the optical signal into a digital signal, as shown in Fig. 2. However, if the object moves relative to the optical lens during the imaging process, the result is a blurred image with overlapping and scattered pixels.
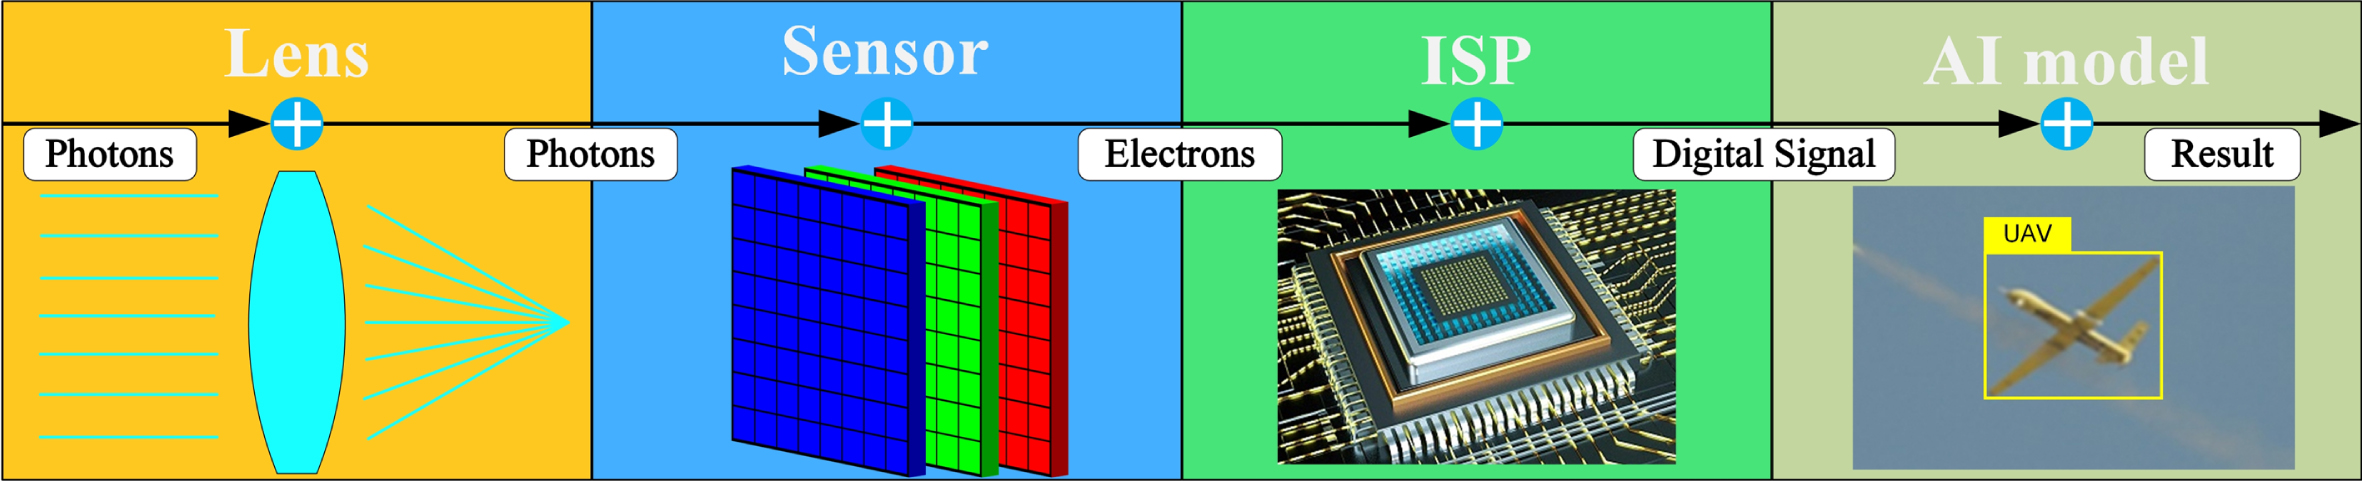
Overview of electronic imaging pipeline.
It is assumed that the reflective surface of an object is an ideal diffuse reflective surface and the light intensity is uniform. Under these conditions, the number of photons that reach the image sensor surface through the lens set from a point on the object does not change with the motion condition of the object. According to the optical imaging principle, sufficient photons must be collected to form the image. The digital image I generated by the camera is proportional to the integral of the number of photons η s (x,y) that reach the image sensor surface during the exposure interval and can be expressed as
Where t
e
represents the exposure interval of SAU. The imaging point is denoted as (x,y), and η
s
(x,y) represents the number of photons collected at time dt for a static object during the exposure interval, which can also be referred to as the light intensity. The constant K represents the sensor gain. When the object and SAU are in relative motion during the exposure time, the physical imaging point of the object moves from A0(x0,y0) to
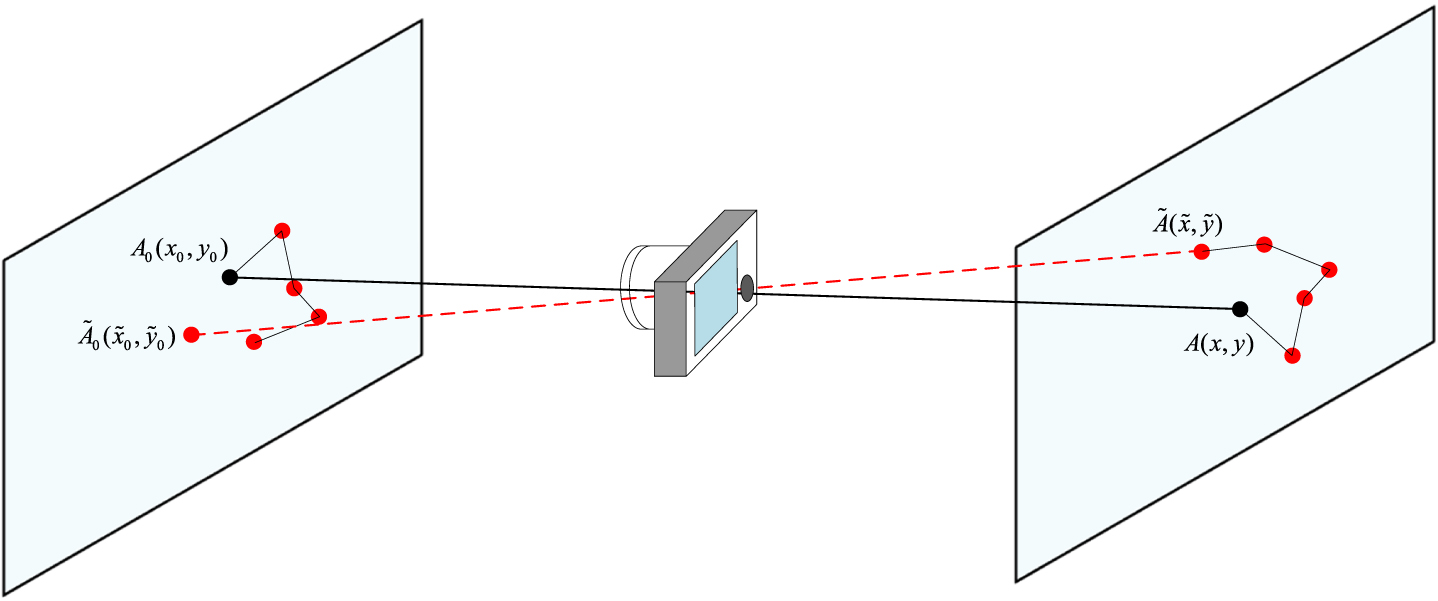
The geometric display for spatial point and imaging point under motion.
During the exposure interval, the number of photons entering the shutter remains constant, so when A(x,y) moves to
Where d
x
(x,y,t) and d
y
(x,y,t) represent the displacement of point
η s (x,y) represents the light intensity of clear imaging point A(x,y) of the static object at time dt, so Eq. (3) can be expressed as
The physical imaging model of the acquired blurred image can be expressed as
Where t s represents the lens opening time of the shutter and G(x,y,t s ,t e ) denotes the imaging point model of each blurred image with exposure interval t e when the lens opening time of shutter is t s .
Measure of data distribution
A feasible approach involves finding the effect of model performance degradation through explore the difference of data distributions. The Fréchet distance (FD) metric is commonly employed in adversarial neural network (GAN) training to quantify the similarity between two distributions. The objective of GAN training is to minimize the difference between the real and generated data distributions. Therefore, a lower FD value indicates a better GAN model performance. Conversely, an increase in FD value corresponds to an increase in discrepancy between the two distributions. As the similarity between the two distributions approaches zero, the FD value tends toward infinity.
Where the expectations of the measurable sets
A pretrained inception layer is utilized to transform the image data inputs x into vision features for the AI model. The coding unit functions are then considered as the polynomials f(x), and the discrepancy distance between the probability distributions of the current and initial data can be obtained.
In reliability theory, the environmental effects that have a significant impact on the equipment are primarily vibration, temperature, and humidity. These effects can directly influence the physical structure of the equipment, causing structural failure, aging, and fatigue. On the other hand, the performance of AI equipment is affected not only by the physical entity but also by the AI model. If there is a domain discrepancy between the training environment and the real task environment, the model performance will inevitably deteriorate. For highly intelligent equipment that includes numerous intelligent models, it is critical to consider reliability as an issue. Environmental adaptability and discrepancy can be the new metrics that are used to describe the reliability of AI models of equipment.
The ability of an AI model of device that has been trained and tested under the data distribution of initial environment
Environmental adaptability serves as a measure of model reliability in an intelligent system, indicating the probability that the model will complete the stated task within the performance threshold. Degradation of environmental adaptability implies a gradual deviation of the model’s task performance from the rated performance as the discrepancy between the data distribution of the actual task environment and the initial training data distribution increases.
The measurement of the difference between the data distribution
The discrepancy can be expressed as
Where φ represents the distribution measure function of discrepancy. If the discrepancy between the two distributions is measured using FD, Eq. (8) can be rewritten as
The failure of a model can be considered to have occurred when its performance degrades below a predetermined critical level. This critical level is referred to as the model failure threshold, denoted by D f . The model’s failure discrepancy K represents the discrepancy in the actual performance degradation trajectory D(k) when it reaches the critical level D f . To evaluate the environmental adaptability of the model under different conditions, the environmental adaptability function can be expressed as
Where E(k) denotes the environmental adaptability. The environmental failure function G(k) is the complement set of E(k), and if the distribution discrepancy threshold K exists a probability density function, E(k) can be expressed as
The derivative of Eq. (11) with respect to k can get
Degradation refers to the phenomenon of progressive performance deterioration in systems, equipment, or software. In natural conditions, the performance of AI models is inevitably influenced by the environment, which results in actual performance degradation from the rated performance. Evaluation and monitoring of models based on degradation data can provide more information than assessment methods based on failure data. Moreover, the results of modeling based on degradation data are closer to the results of the first principle of the model performance degradation mechanism.
For an individual model, the degradation trajectory of the model in the operating environment relative to the discrepancy k can be described by D(κ), κ>0. Based on the initial data distribution
Where i = 1, 2, …, n, j = 1, 2, …, m. D
i
(κ
ij
, λ1i, λ2i, …, λ
ki
) represents the degradation trajectory of the i-th test environment with discrepancy k
ij
from the initial data distribution
As the degradation level of the same model varies under different environments and different discrepancy levels, the degradation trajectory shows randomness. A random distribution can be used to describe the performance degradation of AI model. Assuming that the performance degradation D(κ) of the AI model follows a random distribution family of location and scale parameters, the reliability modeling of the performance degradation distribution based on the discrepancy κ can be expressed as follows.
Assuming that the performance degradation follows a normal distribution, the location and scale parameters of performance degradation distribution under all testing environments and discrepancy k j are represented as μ (κ j ) and σ (κ j ), respectively. The point estimation of the population mean of the degradation is
Using the minimum variance unbiased estimator (MVUE), the point estimation of the location parameter σ (κ j ) under discrepancy k j is
The point estimations of the mean
Where r and s represent the numbers of parameters.
In the normal distribution, when D(κ)≥D f , the model performance failure and the degradation trajectory is monotonically increasing, and the environmental adaptability function of the AI model is represented as
When D(κ)≥D f , the model performance failure and the degradation trajectory is monotonically decreasing, and the environmental adaptability function of the AI model is represented as
The field testing of AI devices is faced with some challenges such as the limited number of sparse test scenarios and unpredictable environmental factors, as well as high costs. Although digital simulation methods are useful in testing software and algorithms, they are unable to address the issues of signal distortion, faults, and uncertainty of hardware under different scenarios. In this paper, we present a hardware-in-the-loop AI visual perception system vibration test platform, aimed at verifying the functional retention capability of AI devices under vibration stress. The vibration test, which has a similar effect as a field testing, simulates the vibration environment that the product is exposed to during transportation, installation, or operation, by subjecting it to specific frequencies of a shaker. This test is widely used to evaluate the reliability of hardware products.
Structure of test platform
The complete test platform consists of three essential parts: the task scene manager, the vibration output system, and a prototype of the visual perception system. The Raspberry Pi 4B is the control hub of the entire test platform as a microcomputer that performs the tasks of controlling and managing the output of the task scenes and driving the visual perception system.
The task scene manager is capable of outputting a variety of task scenes to the display screen. In the event that the task scene is dynamic, the manager can push real-time controlled video streaming to the display screen. When the task scene is static, the display screen can also provide high-fidelity images. The display screen utilized in this system is a 27-inch Philips OLED with a high color gamut, serving as the actuator for the task scene manager.
The vibration output system encompasses the control computer, vibration controller, power amplifier, vibration sensors and a shaker. The vibration control computer is responsible for controlling the input and setting of vibration stress. The vibration controller and power amplifier convert the vibration commands into excitation signals. The shaker is the actuator of vibration output system, consisting of a dynamic generator, control and measurement devices and other auxiliary devices, which can be used to drive the shaker connected to the coil to obtain mechanical vibrations using electric or hydraulic power. The vibration sensors are mounted on the fixture above the shaker and can feed back output vibration stress in the form of a signal to the vibration controller.
The visual perception system consists of a scene acquisition unit and an algorithm processing unit. The SAU is the hardware, which is fixed to the shaker by the fixture. The software framework of APU is MMDetection [34] and the operating system is Linux Ubuntu 20.04. A variety of AI models such as object detection and instance segmentation can be tested.
The structure of the test platform is depicted in Fig. 4.
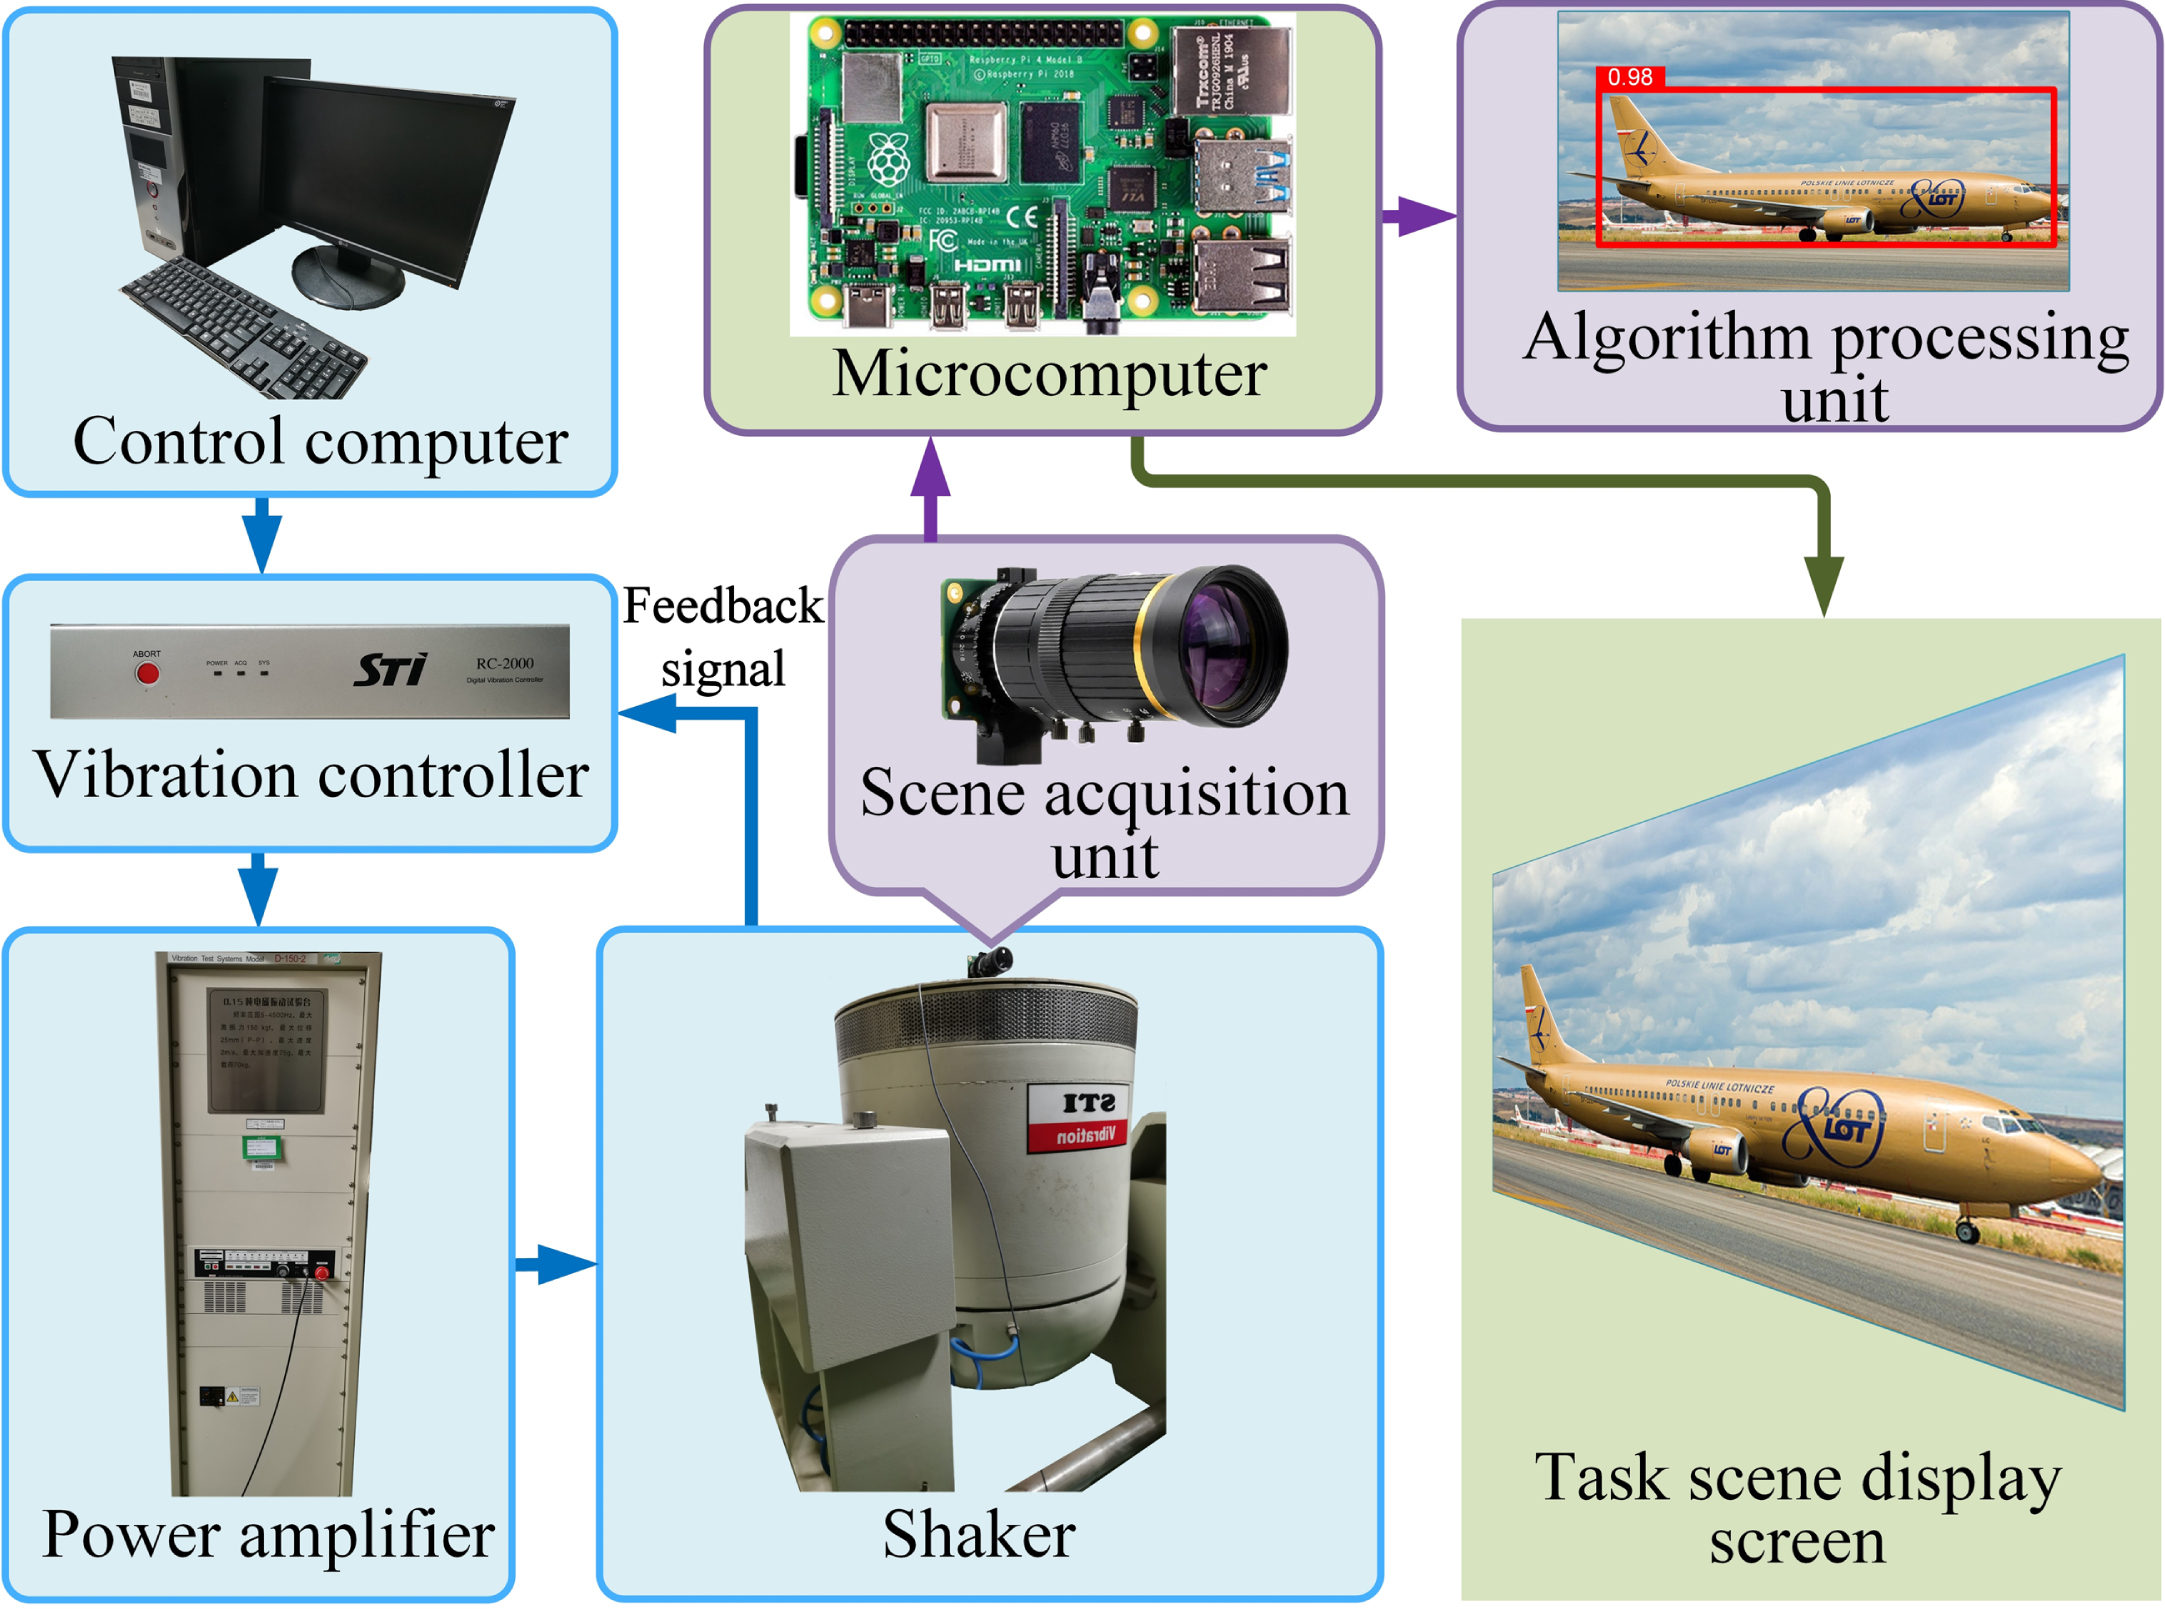
The structure of vibration test platform.
Vibration output system
For different test standards and vibration scenes (e.g. transportation or operation scenes), the vibration output system can be set up in different modes. Before the test, the vibration control computer, vibration controller, power amplifier and the shaker should be turned on, respectively. The operator sets vibration commands (such as sinusoidal command, random command, etc.) on the vibration control computer, and then the command is pushed to vibration controller. The vibration controller and power amplifier convert vibration command into excitation signals, and the shaker generates practical vibration after receiving the excitation signals.
Task scene manager
For field testing, it is practically infeasible to execute all possible test scenarios. Even for simple tasks, the testing cost of this method is also very expensive. To leverage the benefits of laboratory testing, it is necessary to utilize a system that allows for the testing of various visual perception systems with customized test scenarios. Task scene manager can suit the specific requirements and functions of the system being tested. This can include the implementation of standard datasets, such as those utilized in common image classification tasks or face recognition tasks, as the task scenes within the testing environment. On the other hand, for tasks such as object detection or instance segmentation, particularly in the testing of visual perception systems for autonomous vehicles, commonly used image datasets include COCO, KITTI [35], and Cityscapes [36]. In our test platform, the microcomputer is capable of customizing the output of image data scenes, in addition to the virtual scenes from the simulation system or the marked test video as dynamic scenes. The scene signals are then transmitted to the task scene display screen in real-time. The common LCD screen, after being irradiated to the relevant color filter, is equipped with color information. On the other hand, OLED screens emit color directly from the light-emitting material, enabling the OLED display screen to provide more information about optical characteristics, such as saturation and contrast.
Visual perception system
The SAU is affixed to the top of the shaker through the use of a fixture. The shaker remains in a fixed position. To ensure the effective recognition capabilities of the visual perception system and eliminate any unnecessary disturbances during the testing procedure, the positioning of both the scene display screen and camera are carefully adjusted. This is to ensure proper calibration of the optical image, reducing the possibility of data loss or misinterpretation. Prior to the initiation of the test, the camera is installed in the front of the task scene display screen in such a manner that the screen is accurately matched and calibrated to the area of interest of SAU. This is achieved by ensuring that the centerline of the lens is perpendicular to the screen. It is imperative to evaluate whether the image acquisition capabilities of the SAU can meet the test requirements under non-vibrational conditions. The task scene display screen must display the same scene as the sequence acquired by the SAU.
The collected scene images are subjected to processing by the microcomputer. The segments of the collected scene that fall outside the region of interest should be trimmed. The processed image of the region of interest, as depicted in Fig. 5, demonstrates the results of this processing.
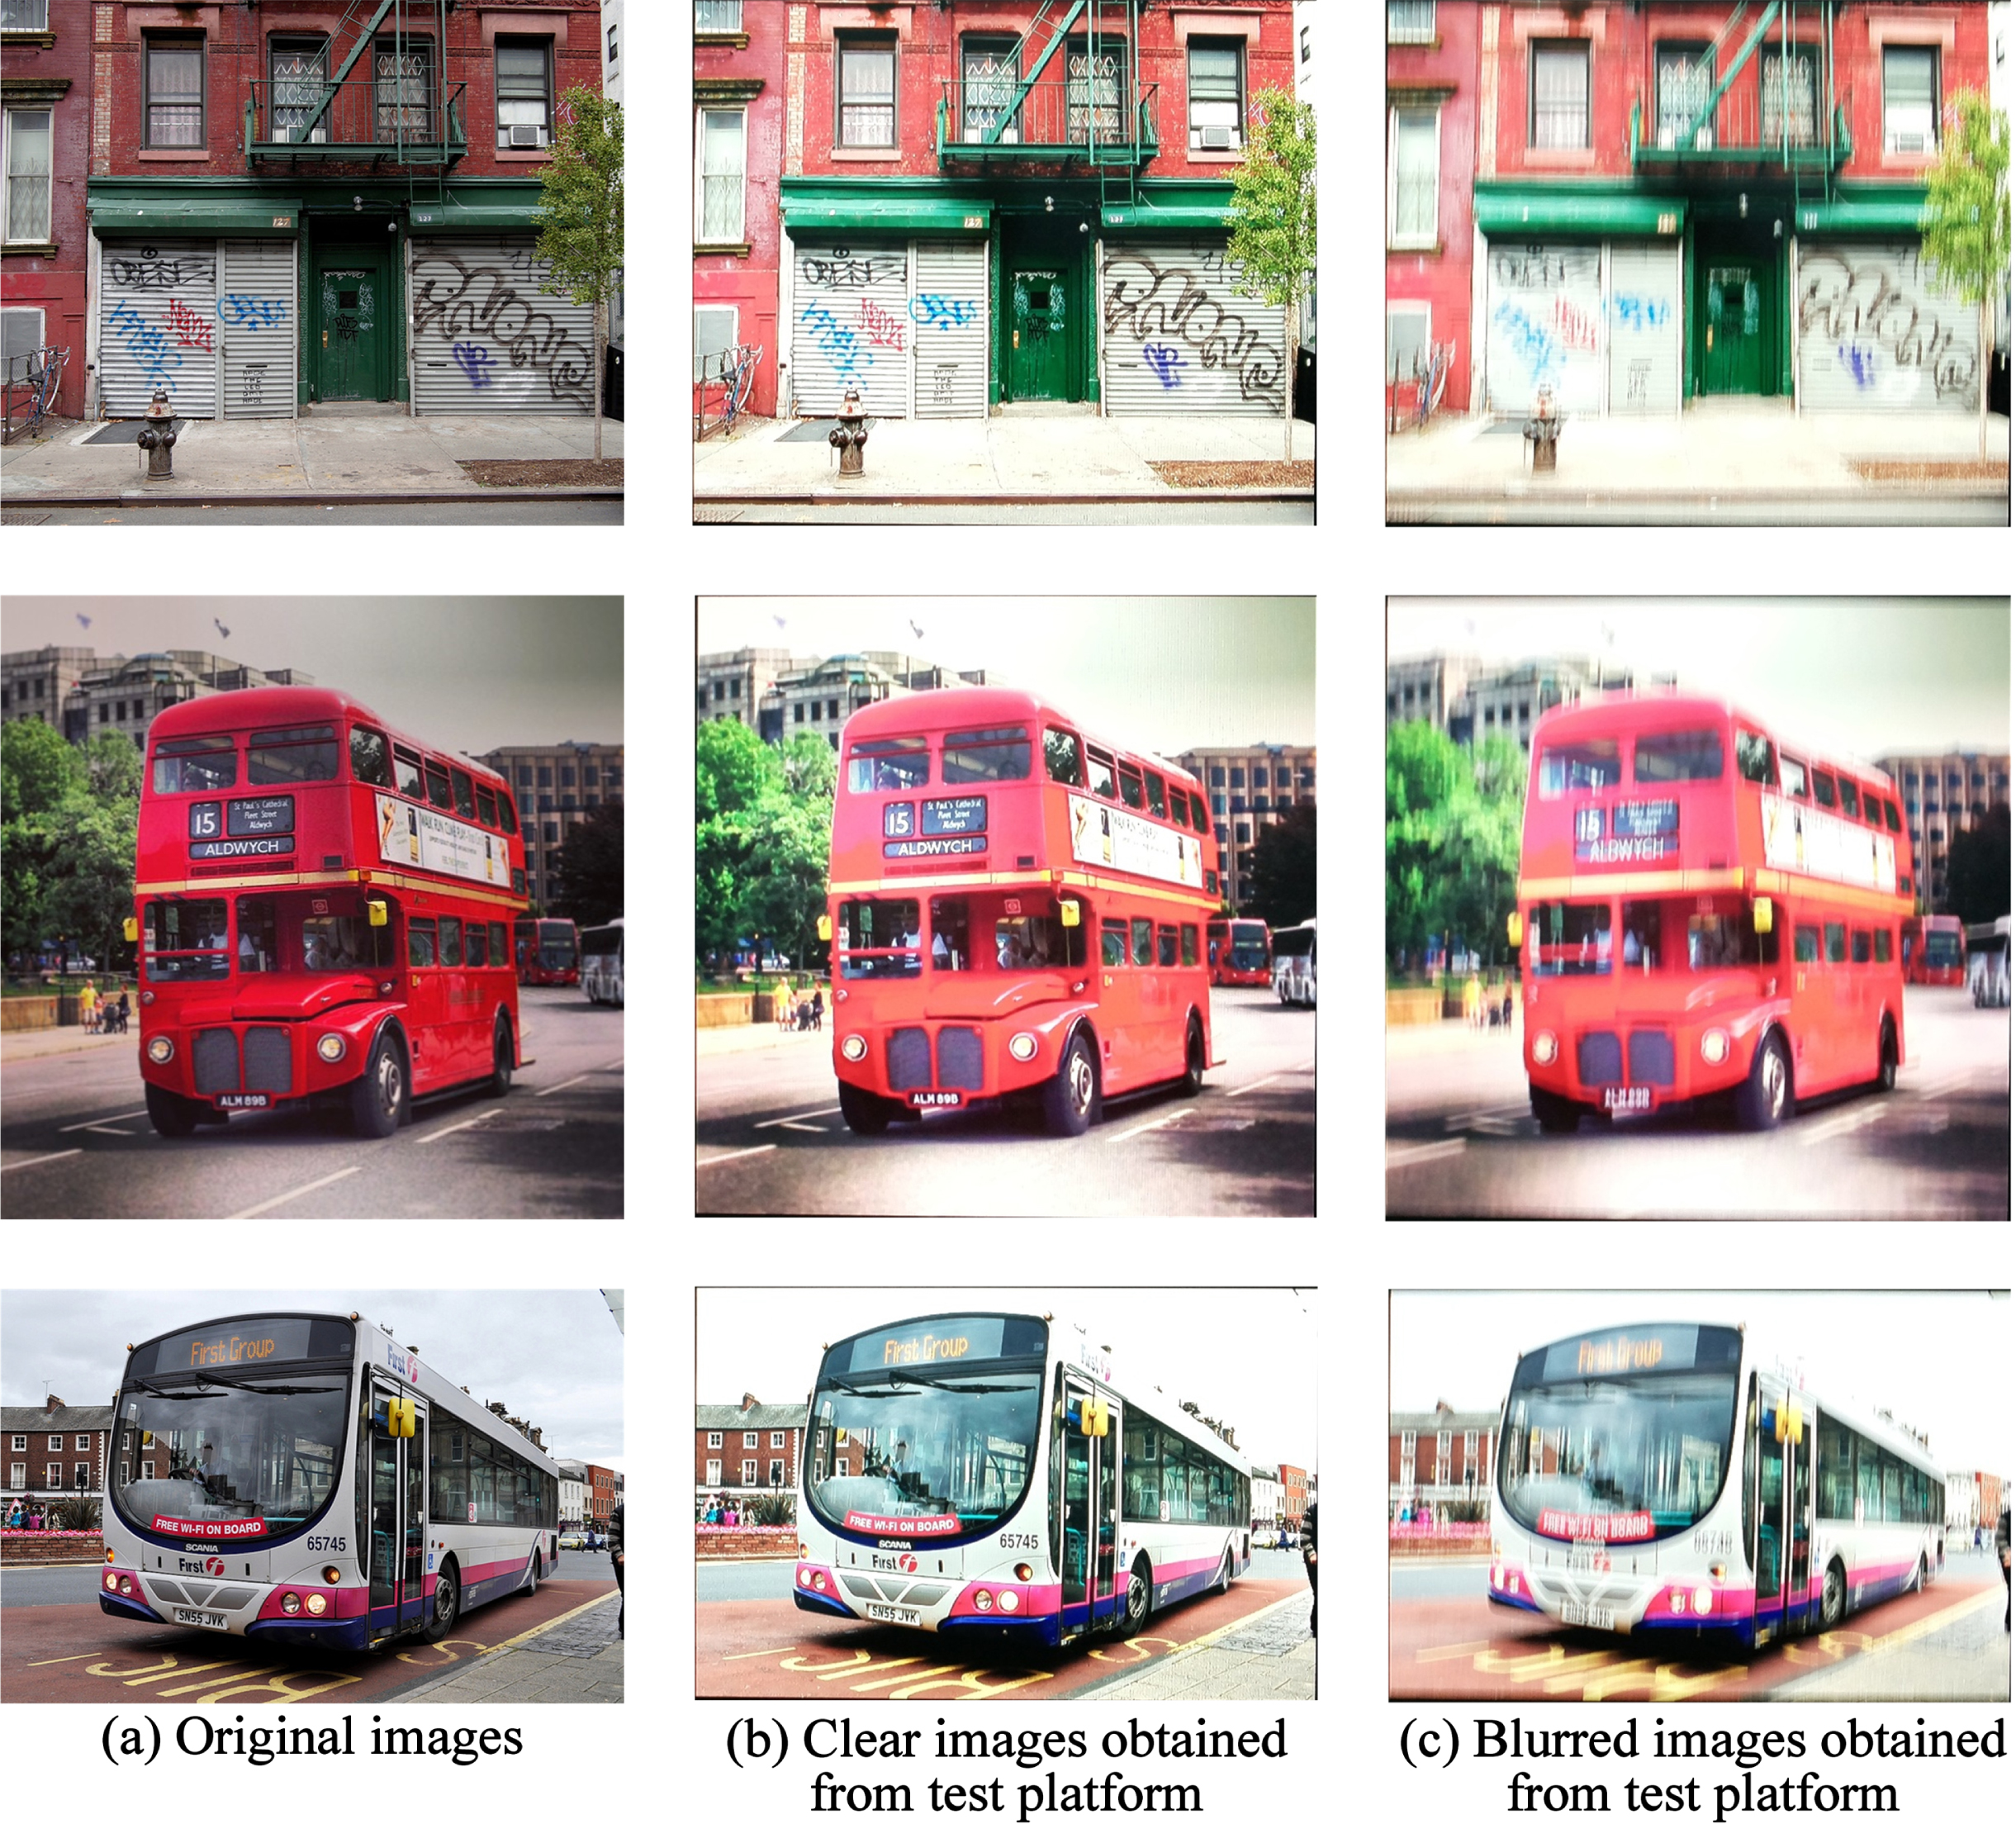
Examples of image data comparison in COCO2017 dataset. (a) Original images in dataset; (b) Static clear images collected from the test platform. (c) Blurred images under vibration mode collected from the test platform.
In a practical intelligent unmanned equipment, the optical images captured by the visual perception module during operation are transformed into digital images and stored within a data center. The APU retrieves the image information stored in the data center and inputs it into the AI model in real time. After the visual information features have been extracted, the AI model outputs the results of object recognition. In the test platform, the collected digital images are stored on the Raspberry Pi and transmitted to a trained computer model, which outputs the object recognition results for each individual image, as well as the object recognition capability of the entire dataset under the AI model.
Figure 6 provides a comprehensive illustration of the overall flow of the vibration test platform.
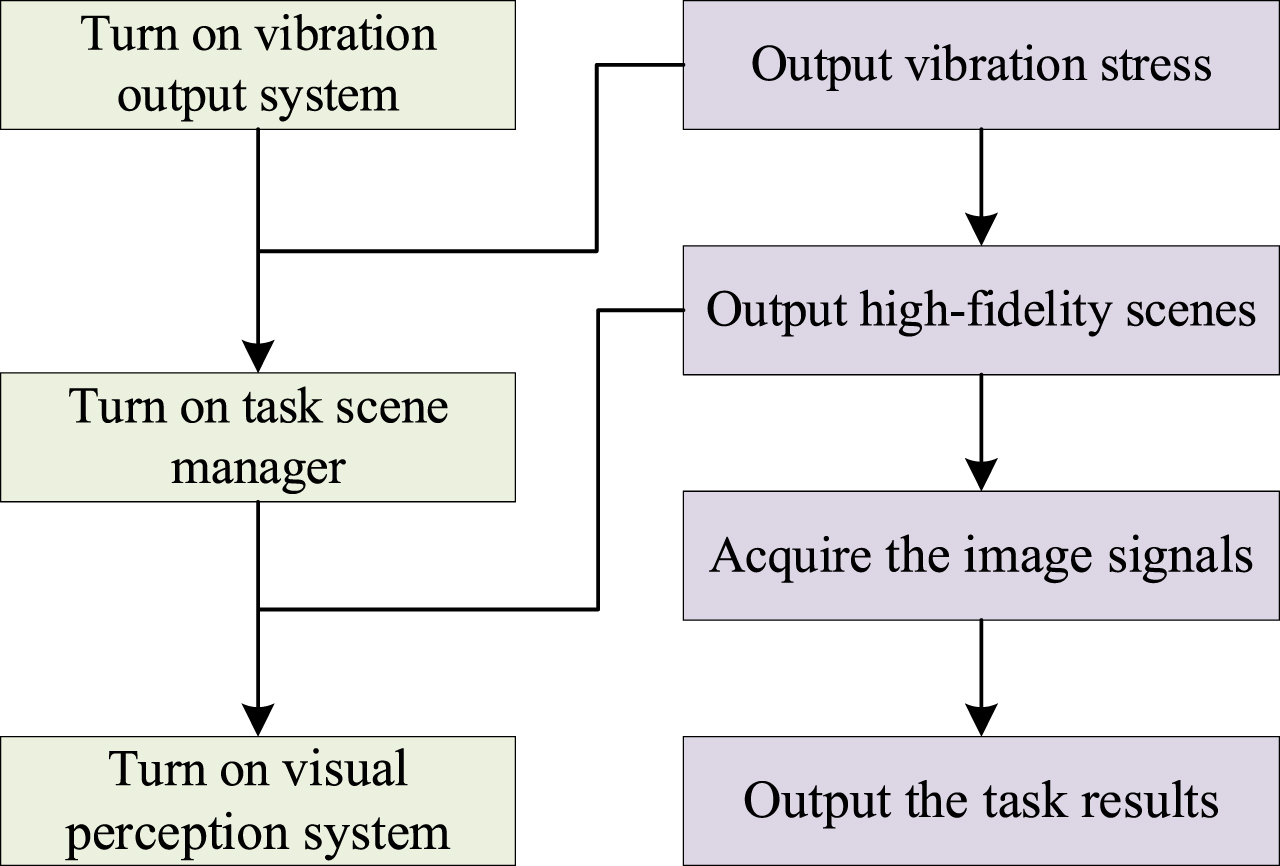
The overall flow of the vibration test platform.
The aim of our research is to provide a comprehensive vibration simulation environment for AI visual perception system for real-time testing tasks and performance evaluation. On one hand, a virtual vibration environment, referred to as the AI visual perception system vibration test platform, is developed, while on the other hand, a framework is designed for evaluating the environmental adaptability of AI devices. The vibration output system allows for dynamic adjustment of various vibration settings and reliability assessment framework offers a quantifiable benchmark for different models and evaluate their performance.
Vibration setup
We obtain the adaptability functions of AI visual perception systems to two different vibration modes: high-frequency and low frequency. Due to the exposure interval of the camera, the vibration period T0, vibration frequency f, and lens exposure time t e are related. When t e > T0 or t e T0 > 1, i.e., when there is more than one vibration period in the exposure interval, the vibration process can be considered as high frequency vibration. For high frequency vibration, the pixel blur displacement d of the image within the exposure interval is the value of “peak-to-peak” of the vibration amplitude A, and the pixel blur trajectory of the image is the accumulation of the displacement of the imaging points over multiple vibration cycles. When t e < T0 or t e T0 < 1, i.e., when the exposure interval is less than the vibration period, the vibration mode is low frequency vibration, and the exposure interval becomes a random interval within the vibration period, with the vibration amplitude A being greater than the pixel blur displacement d of the image. The relationship between the pixel blur displacement d of the image, the vibration period T0, vibration frequency f, exposure time t e , and shutter opening time t s is shown in Fig. 7.
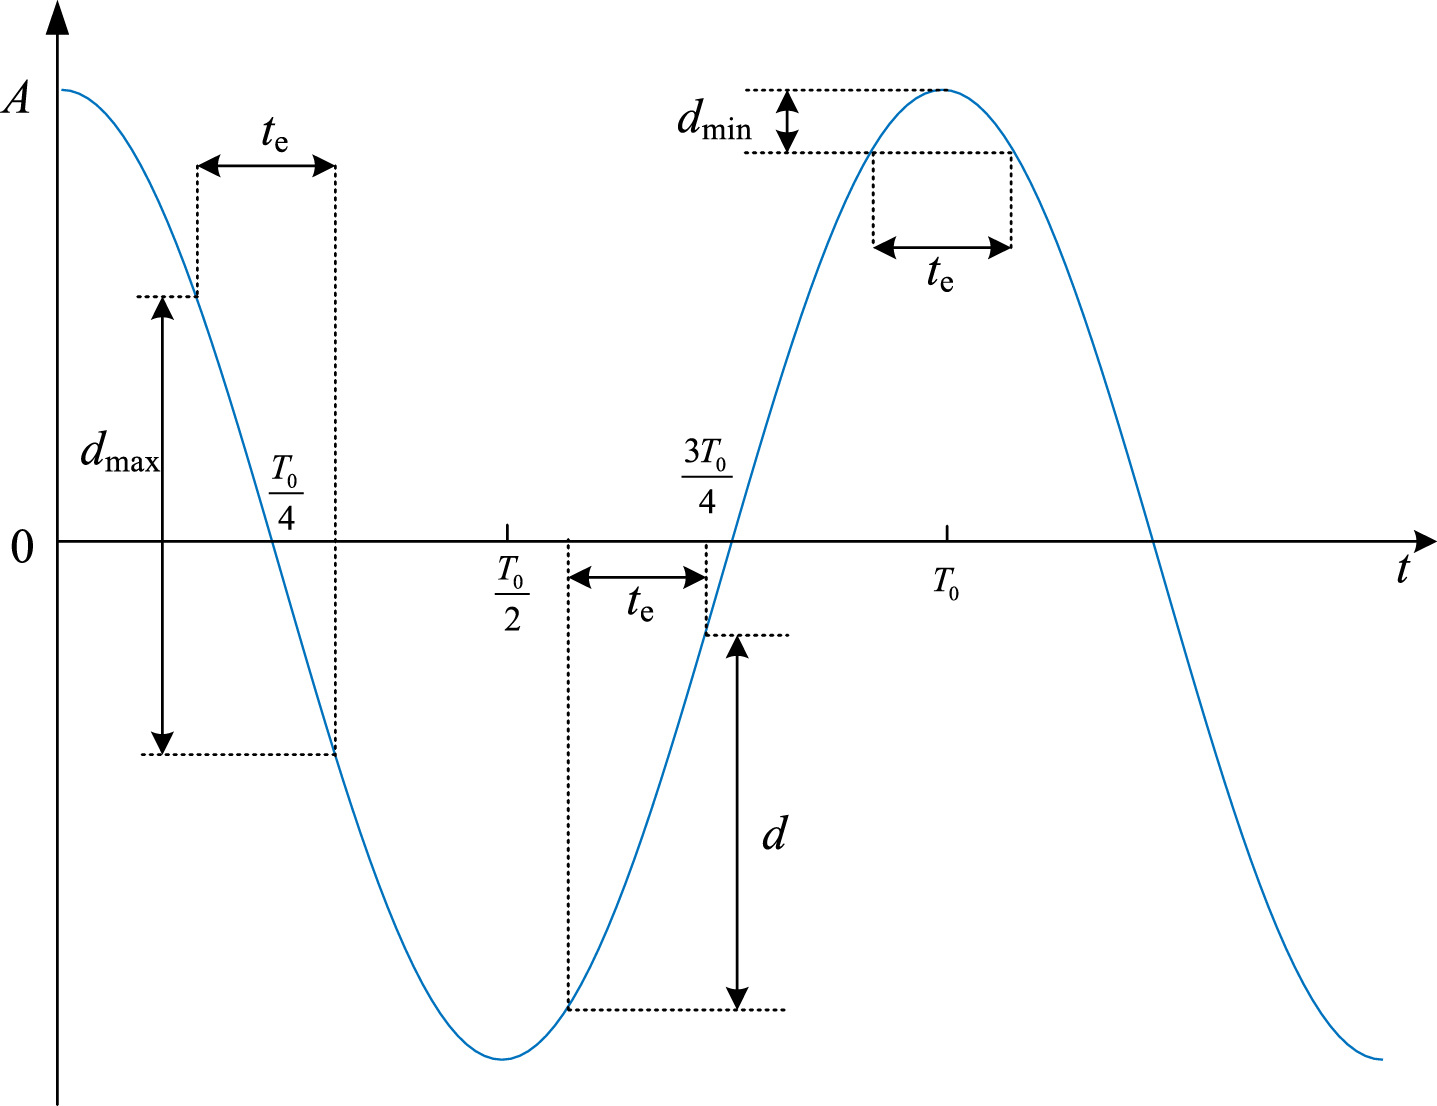
The relationship between different shutter opening moment of low frequency vibration and blurred pixel displacement.
Based on the above analysis, the reliability testing of AI visual perception devices under vibration stress needs to consider both high frequency and low frequency vibration scenarios. The SAU of the visual perception system adopts a Raspberry Pi HQ Camera with an IMX477R image sensor, an exposure time of t e = 0.02 s, a focal length of f1 = 6 mm, and the lens field of view (FOV) of 61.93°×48.46°. After calibration, the average displacement of the SAU and the scene display screen in static state is d = [0, 0]T mm, with the lens centerline being perpendicular to the screen surface, and the horizontal line of the frame is parallel to the horizontal line of the screen with a directional angle of Ψ= 0 rad. The vibration test platform contains shaker with an operating frequency range of 5–4500 Hz and a maximum excitation force of 1500 N. The “peak-to-peak” vibration amplitude is 25 mm. Visual scenes are rendered on a 27-inch OLED display screen with a 144 Hz maximum refresh rate. The Raspberry Pi microcomputer runs the Raspberry Pi OS and streams the captured digital image frames in real-time to the AI models deployed on a connected computer for processing and analysis.
For high frequency vibration, considering that t e > T0, the exposure interval will undergo multiple vibration periods, and the pixel displacement is the vibration amplitude of the system. Therefore, the influence of vibration amplitude on visual perception performance should be considered under high frequency vibration with vibration frequency exceeding 1/t e . Moreover, the preliminary tests showed that when the vibration amplitude surpasses 4 mm, the model performance deteriorates to a very low level. In the test, the vibration frequency f = 100 Hz, and the vibration amplitude is set to 13 levels, that is, A = {0, 0.25, 0.5, 0.75, 1, 1.25, 1.5, 1.75, 2, 2.5, 3, 3.5, 4} mm. Under low frequency scenarios, since t e < T0, the pixel displacement is not only related to the vibration amplitude but also to the frequency. Based on the conclusions from the preliminary tests and high-frequency vibration tests, the vibration amplitude occupies a dominant role in affecting imaging if it becomes excessively large. However, if the amplitude is too small, the impact on imaging remains minimal regardless of the vibration frequency. Therefore, to explore the effects of vibration frequency on imaging and model performance, an appropriate medium vibration amplitude needs to be selected. The vibration amplitude is set to 2 levels, that is, A = {3, 3.3} mm, and the vibration frequency is set to 11 levels, f = {0, 5, 10, 15, 20, 25, 30, 35, 40, 45, 50} Hz.
Object detection models
Five state-of-the-art object detection models are selected for tests, including Faster-RCNN [37] and YOLOv3 [38], which are convolutional neural network models (CNN). Faster-RCNN is an anchor-based two-stage detector, while YOLOv3 is an anchor-based one-stage detection model. Two anchor-free algorithms, FSAF [39] and FCOS [40], are also considered. For the vision Transformer algorithm, the advanced PVTv2 [41] model is chosen as our test model.
Performance metric
Mean average precision (mAP) is a commonly used performance metric in the computer vision field, which can measure the recognition ability of model for different types of objects in the test dataset and is an important metric for evaluating model performance. When the model’s performance is lower than the specified threshold, the system cannot complete the prescribed task. In the tests, the initial mAP@0.5 : 0.95 of the model in the test environment is defined as the rated performance. In the actual test environment, when the performance of AI model is less than 60% of its rated performance, the model is considered to have failed.
Task scenario and dataset
The test dataset in our research is chosen from COCO2017. Since the test set of the COCO2017 dataset does not contain data annotations, we use the validation set of COCO2017 as the test set for our research, which includes a total of 5000 images. The 5000 images are divided into 10 test sample sets, with each set containing 500 images. The size of the test sample set should neither be too large nor tiny. If the sample set is too large, a large amount of image data is required.
All tests are conducted using Nvidia GTX 1080 GPU and 32G RAM. State-of-the-art AI models are trained on the COCO2017 training set using the MMDetection framework and are available on the Github platform. The MMDetection framework is also used as the test framework for the models.
Test result
High frequency vibration
In this study, high frequency vibrations are applied to test the object detection performance of five AI models using mAP as the performance metric, under 13 different vibration amplitude conditions. The rated performance of the model is measured at the vibration amplitude A = 0 mm and frequency f = 0. Each level of the test dataset included 10 sample sets. As an example, Table 1 presents the results of discrepancy in 10 sample sets for the FSAF model, while Table 2 presents the results of mAP in 10 sample sets.
Results of Fréchet distance of FASF in 10 sample sets
Results of Fréchet distance of FASF in 10 sample sets
Results of mAP of FASF in 10 sample sets
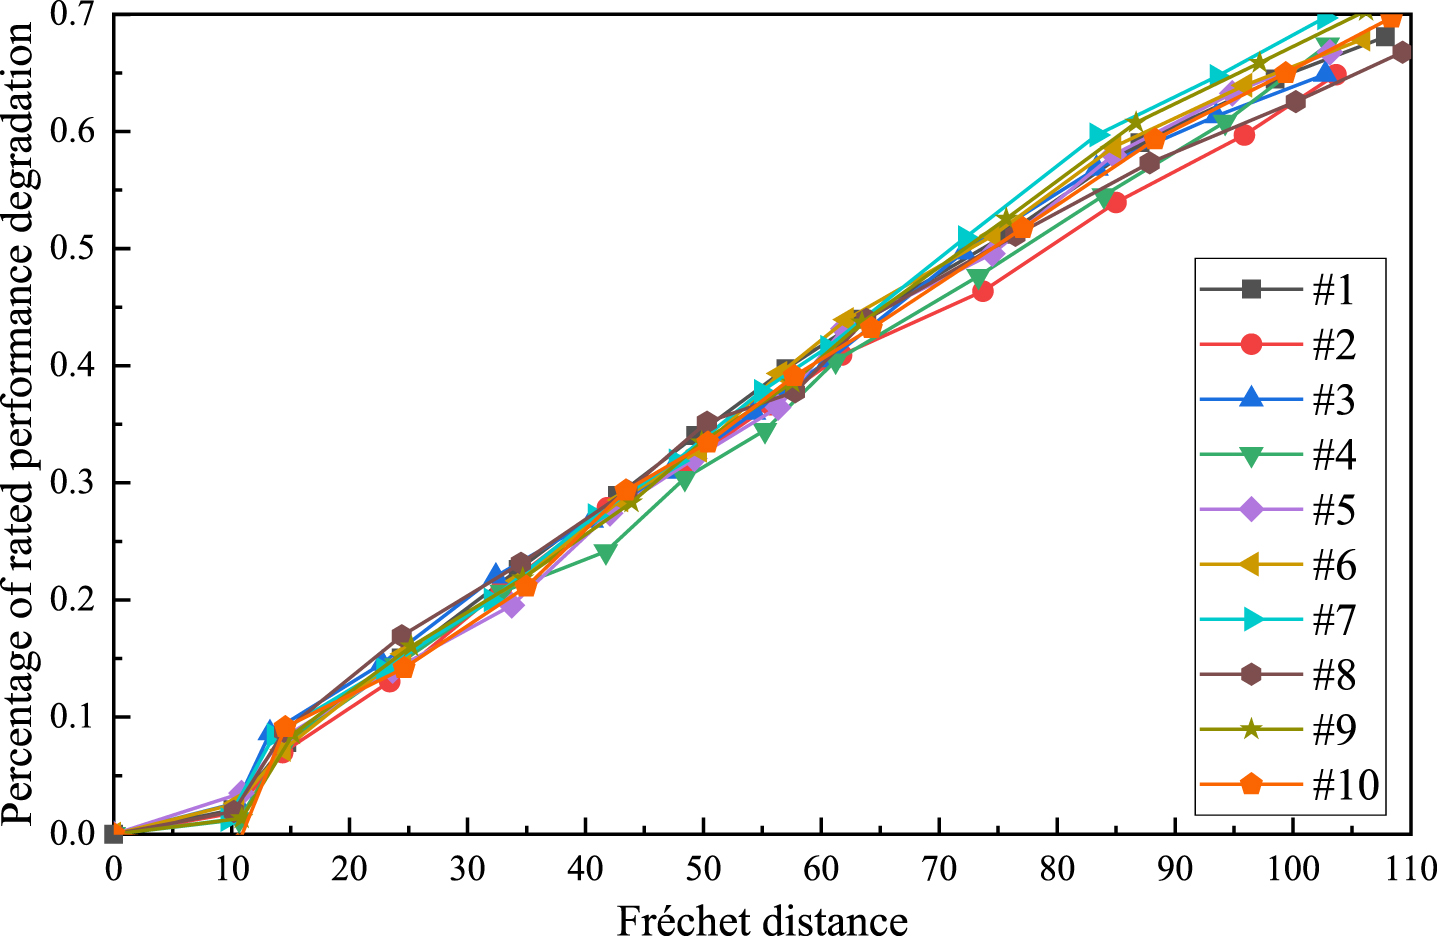
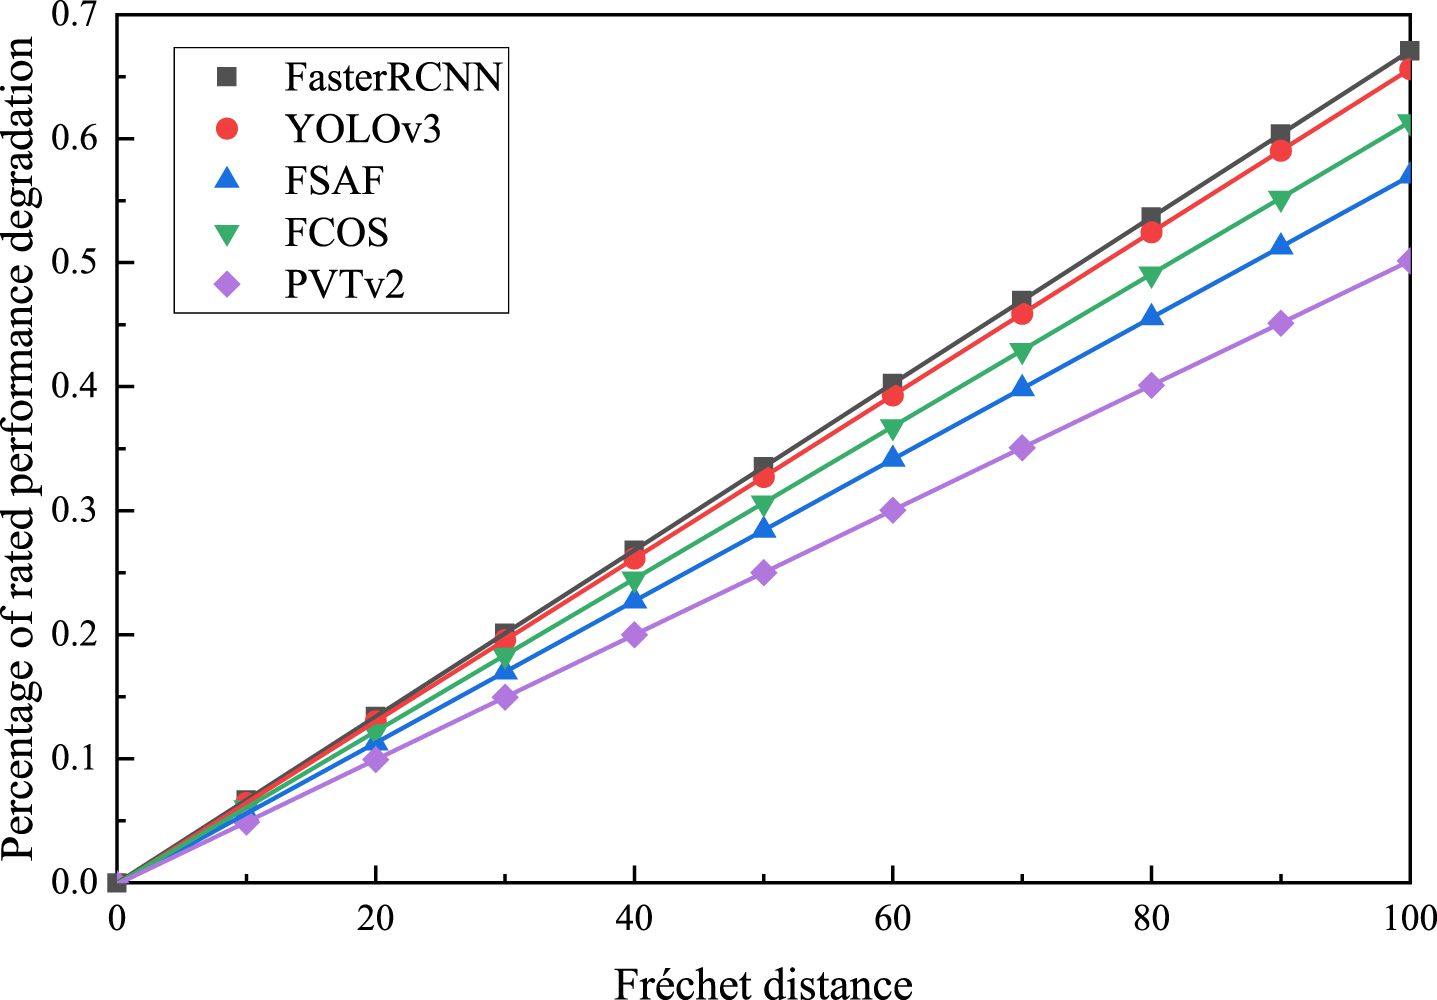
Taking Tables 1 and 2 as example, after acquiring the original data, we can establish the reliability model for AI models based on the distribution of degradation. The failure threshold is set at 60% of the rated performance. The results of mAP obtained from Table 2 are processed as the percentage of rated performance degradation. The degradation trajectories of FSAF and Faster-RCNN at the FD scale are depicted in Figs. 8 and 9.
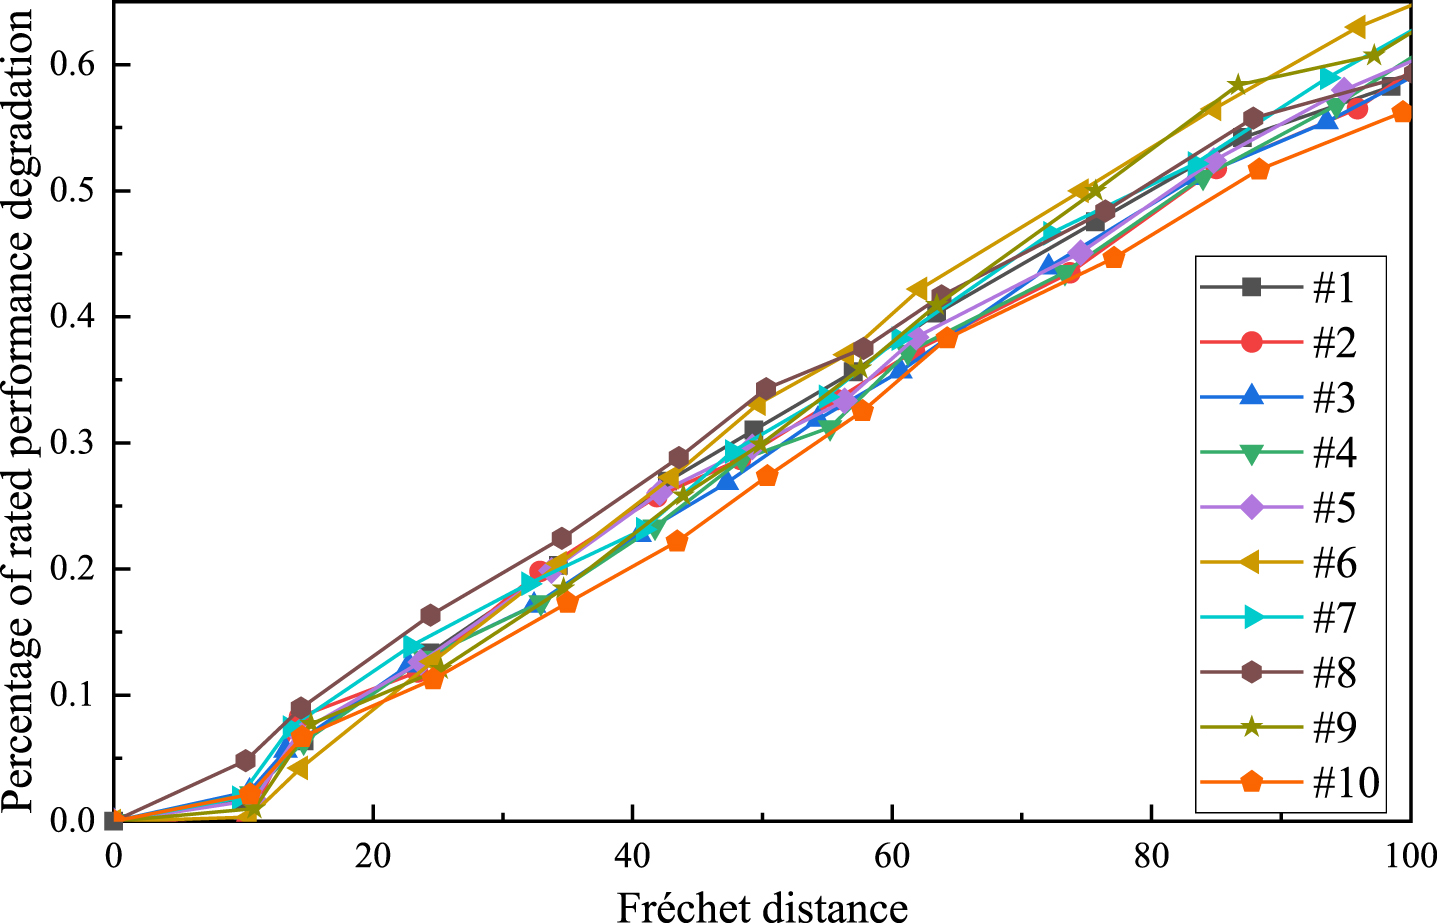
Degradation trajectories of FSAF on Fréchet distance scale.
Degradation trajectories of Faster-RCNN on Fréchet distance scale.
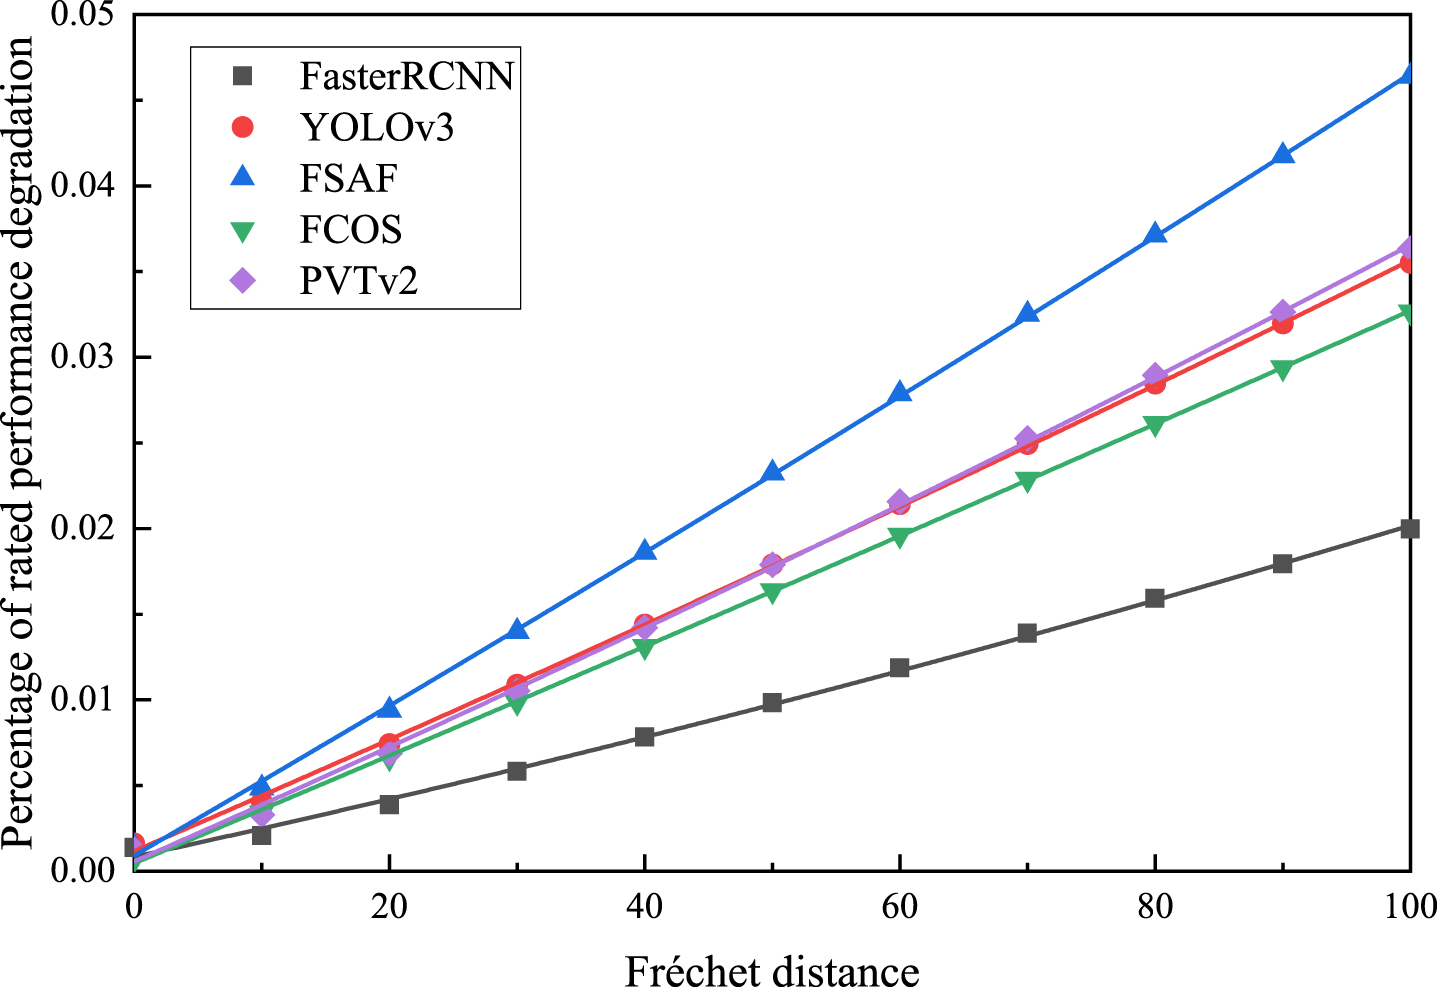
As the results of FD value obtained are not incrementally equal, the data needs to be processed into degradation increments within the equal interval of discrepancy. Using the method of linear interpolation, the degradation data for FSAF on the FD scale with the same increments are obtained, as shown in Table 3. Goodness-of-fit tests are carried out on the degradation data and it is found that the majority of the sample data follows the normal distribution. Based on the results in Table 3 and Equations (16) and (17), the sample mean and standard deviation of the model can be obtained at a specific FD value. Figures 10, 11 show the scatter plot of the sample mean and standard deviation data under the same FD value increment. Parameter estimation is conducted on the function of the degradation parameter with respect to the discrepancy κ. At any discrepancy scale, the model degradation follows the normal distribution D(κ) ∼N(μ(κ), σ(κ)). The mean function and standard deviation function with parameters of the AI models are presented in the Table 4.
Degradation data for FSAF on the FD scale with the same increments
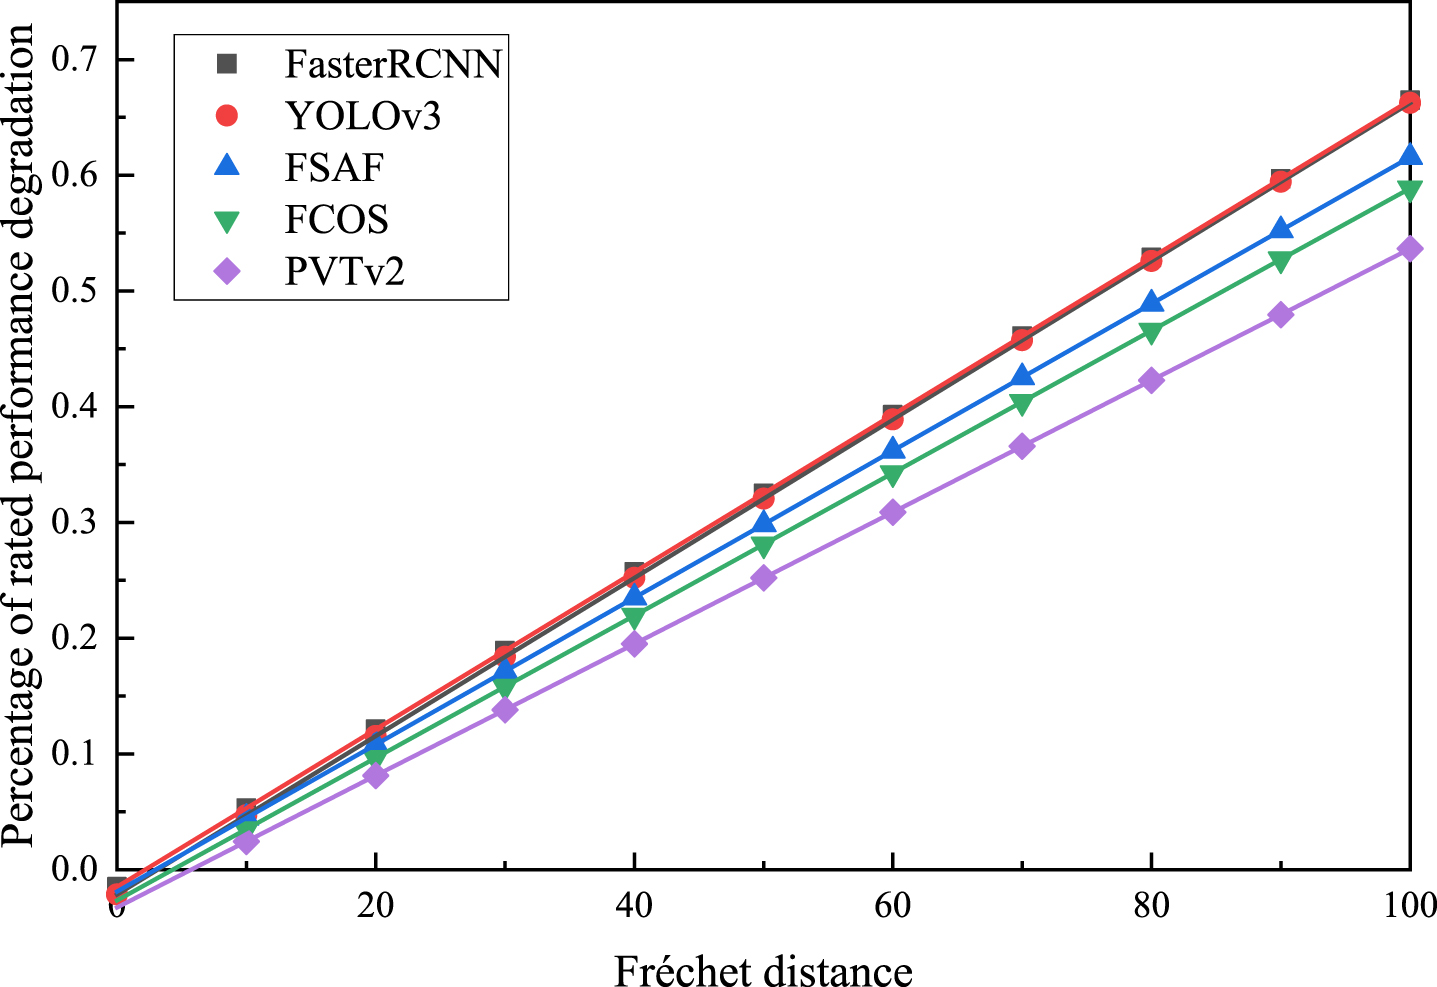
Data scatter and fitting results of mean values over the same FD increment.
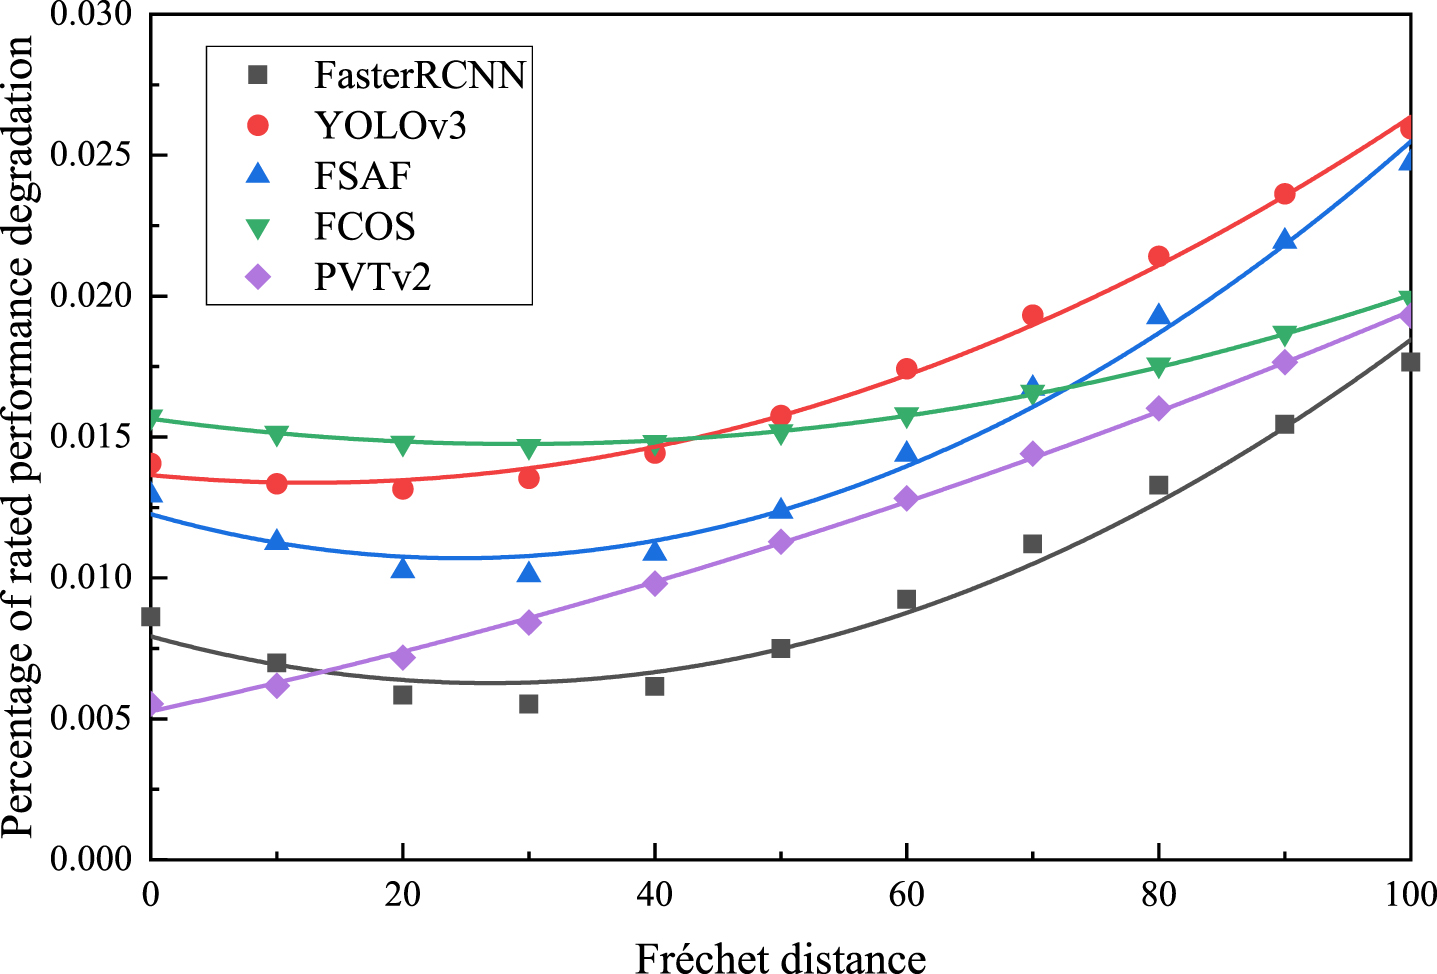
Data scatter and fit results with standard deviation over the same FD increment.
Mean function and standard deviation function with parameters of AI models
Based on the performance degradation distribution and the model’s failure threshold, the environmental adaptability function of the model can be expressed as
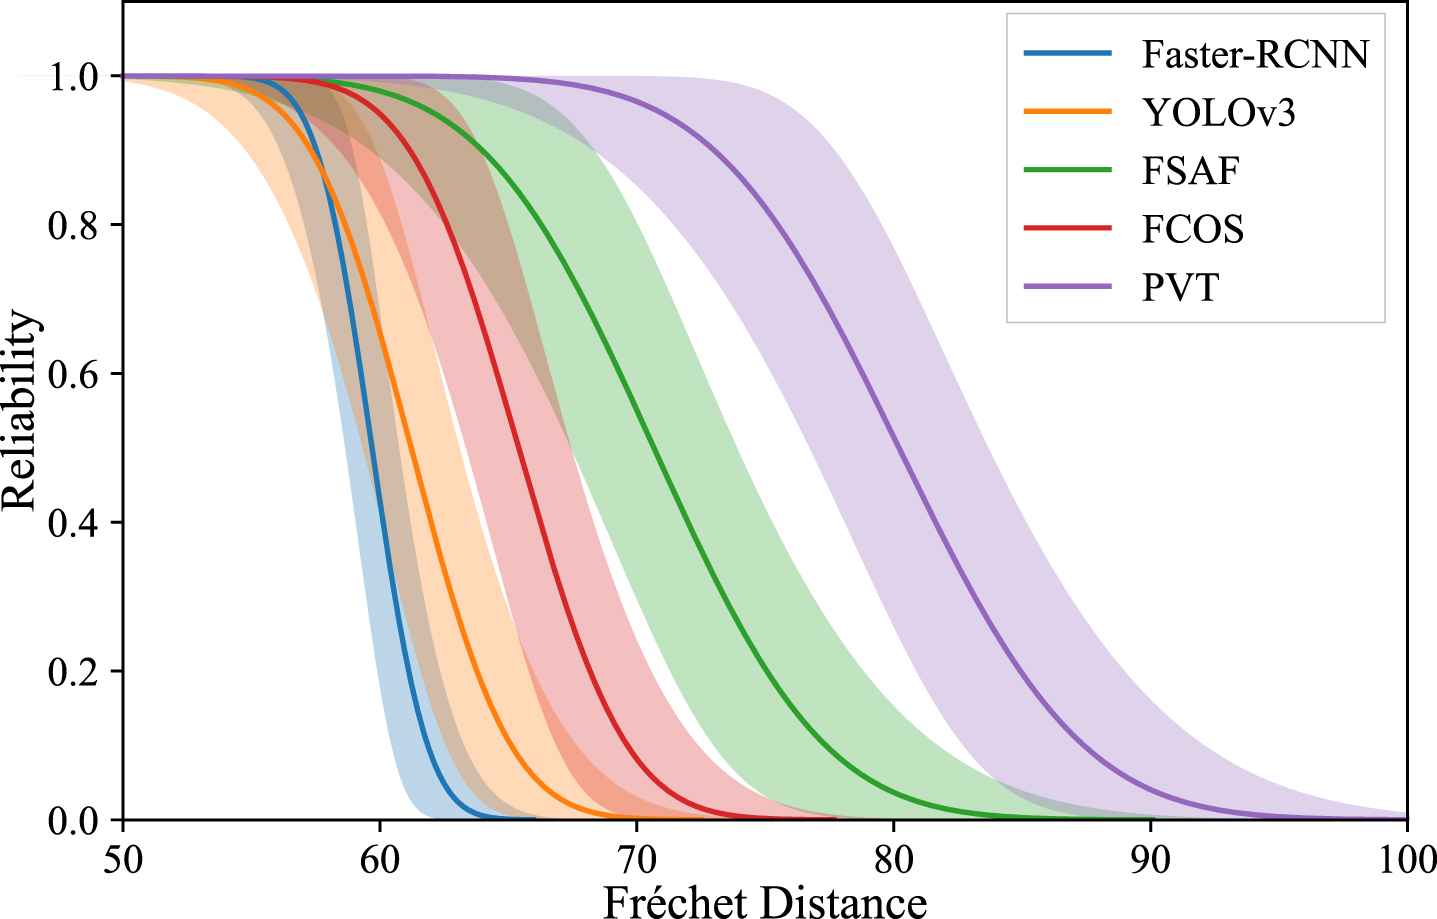
By utilizing the failure threshold, the reliability curves of AI models, based on the performance degradation distribution on the FD scale, can be obtained and depicted in Fig. 12.
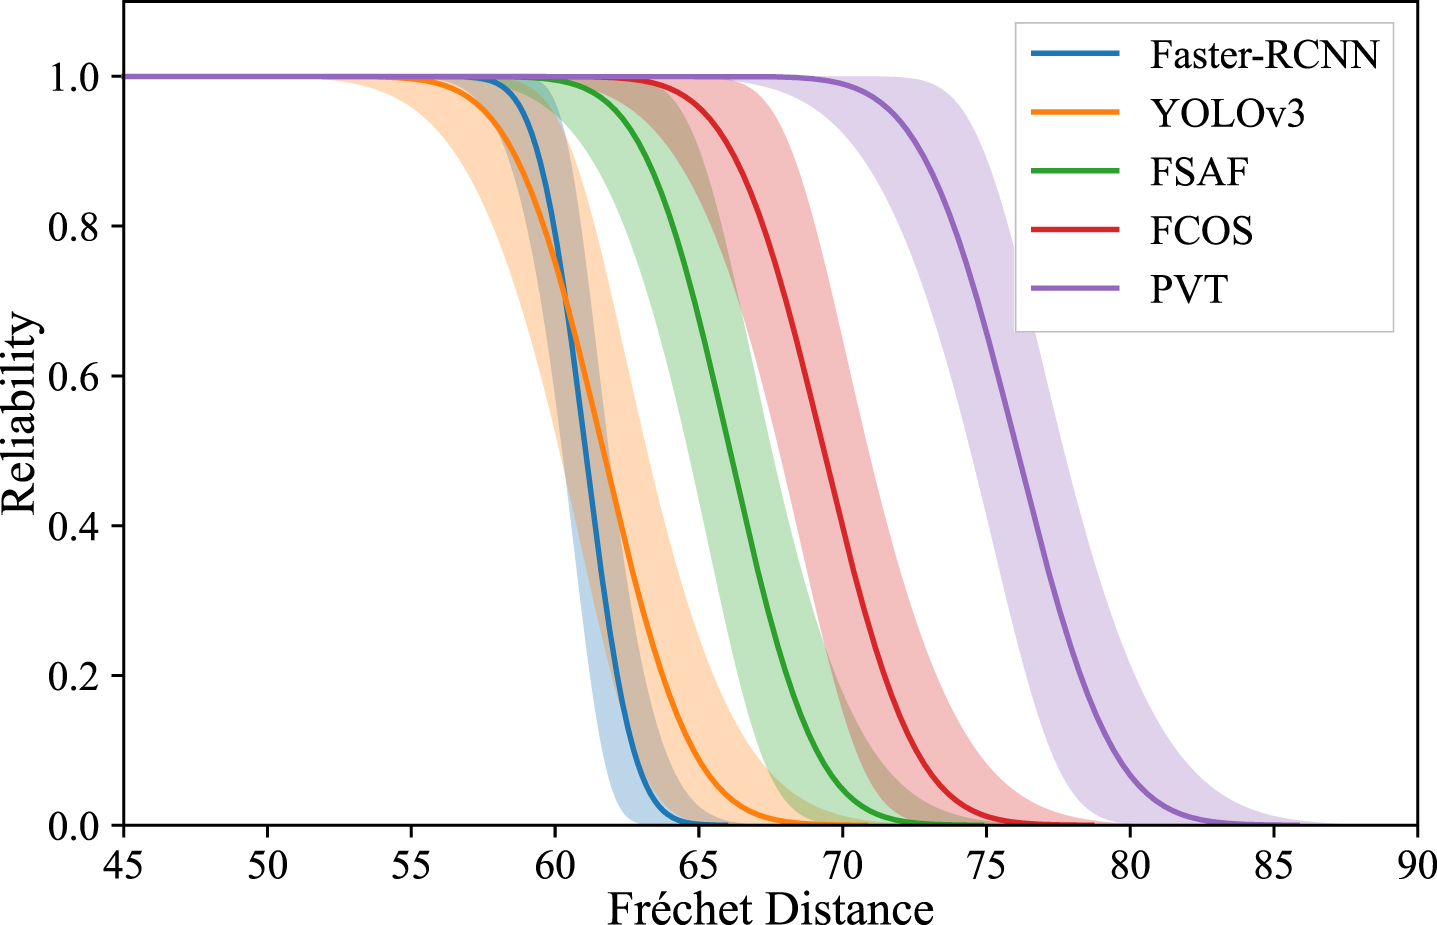
Reliability curves of AI models on FD scale.
The study aims to test the environmental adaptability of five state-of-the-art AI models under 11 different low vibration frequencies with vibration amplitudes A = {3, 3.3} mm. The mAP of each model is determined at a vibration amplitude A = 0 mm and vibration frequency f = 0 Hz as the rated performance. Each level of the test dataset contained 10 sample subsets. Specifically, Table 5 presents the results of FD of YOLOv3 on 10 sample sets at a vibration amplitude of A = 3 mm, and Table 6 shows the results of mAP of YOLOv3 on 10 sample sets at a vibration amplitude of A = 3 mm.
Results of Fréchet distance of YOLOv3 on 10 sample sets with A = 3 mm
Results of Fréchet distance of YOLOv3 on 10 sample sets with A = 3 mm
Results of mAP of YOLOv3 on 10 sample sets with A = 3 mm
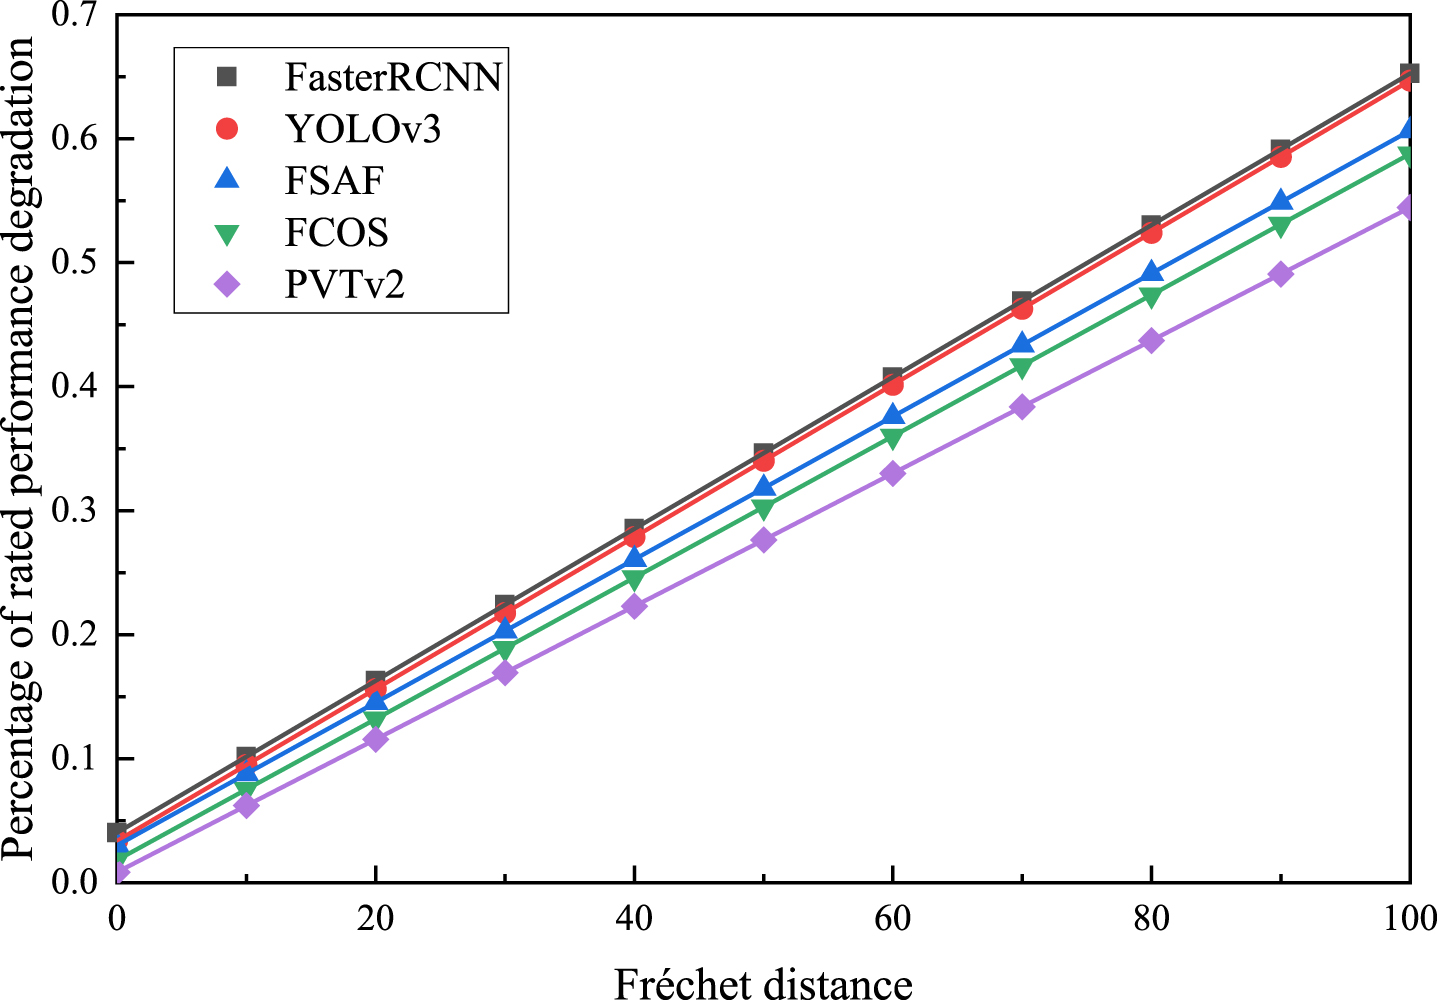
The results of mAP from Table 6 should be processed as a percentage of rated performance degradation. In the low frequency vibration tests, two vibration amplitude levels are set to obtain the degradation trends of AI models under vibration amplitudes A = 3, 3.3 mm, respectively. The degradation trajectories of YOLOv3 and PVTv2 on the FD scale are shown in Figs. 13–16. Employing linear interpolation, the data is processed into the performance degradation increment within the same discrepancy increment interval.
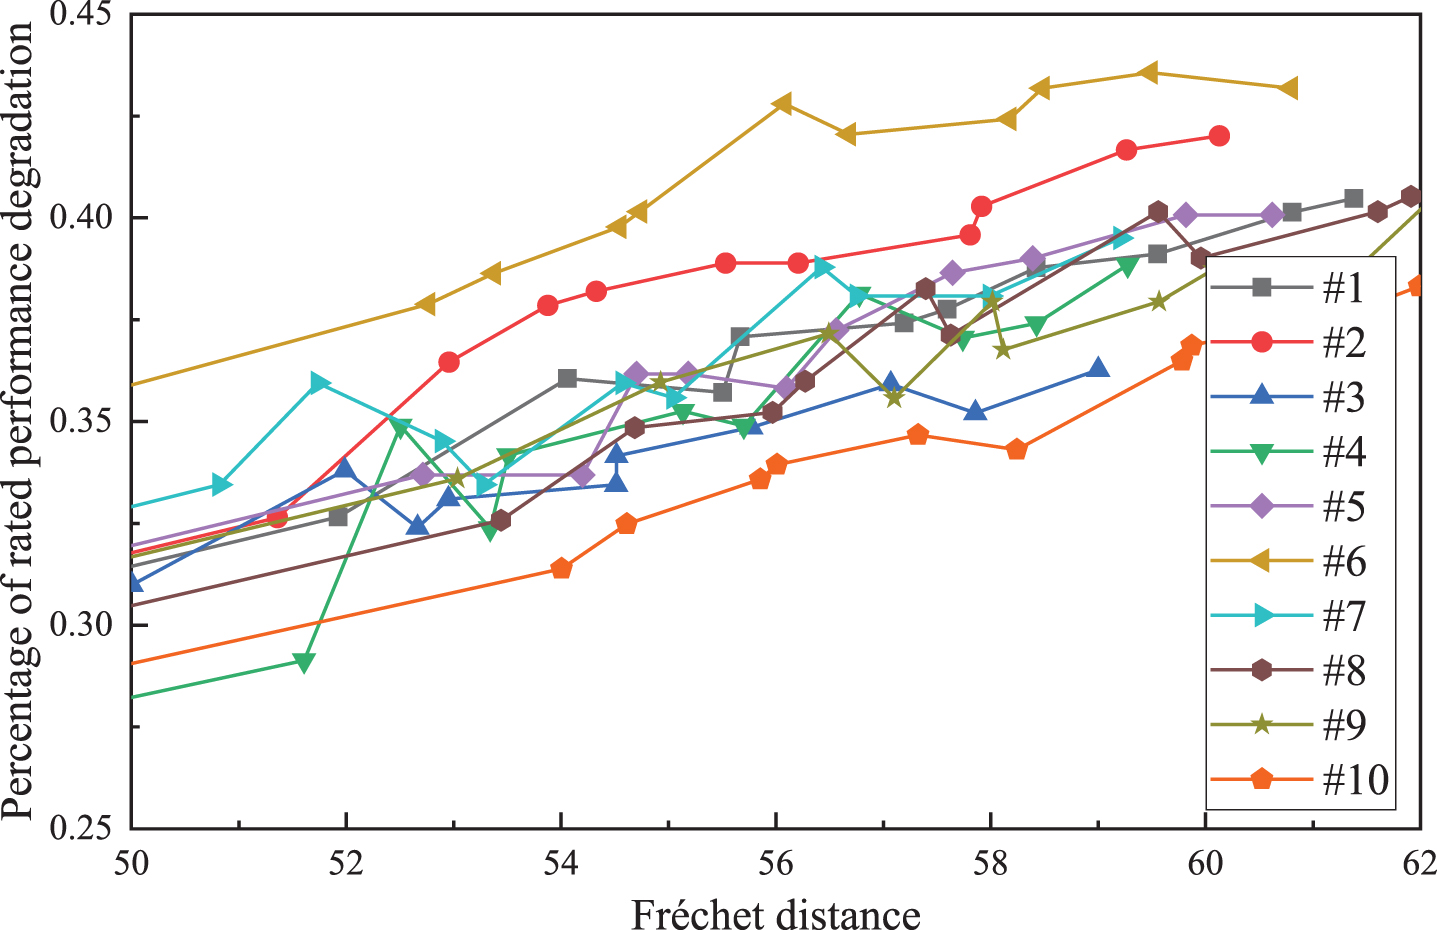
Degradation trajectories of YOLOv3 on Fréchet distance scale with A = 3 mm.
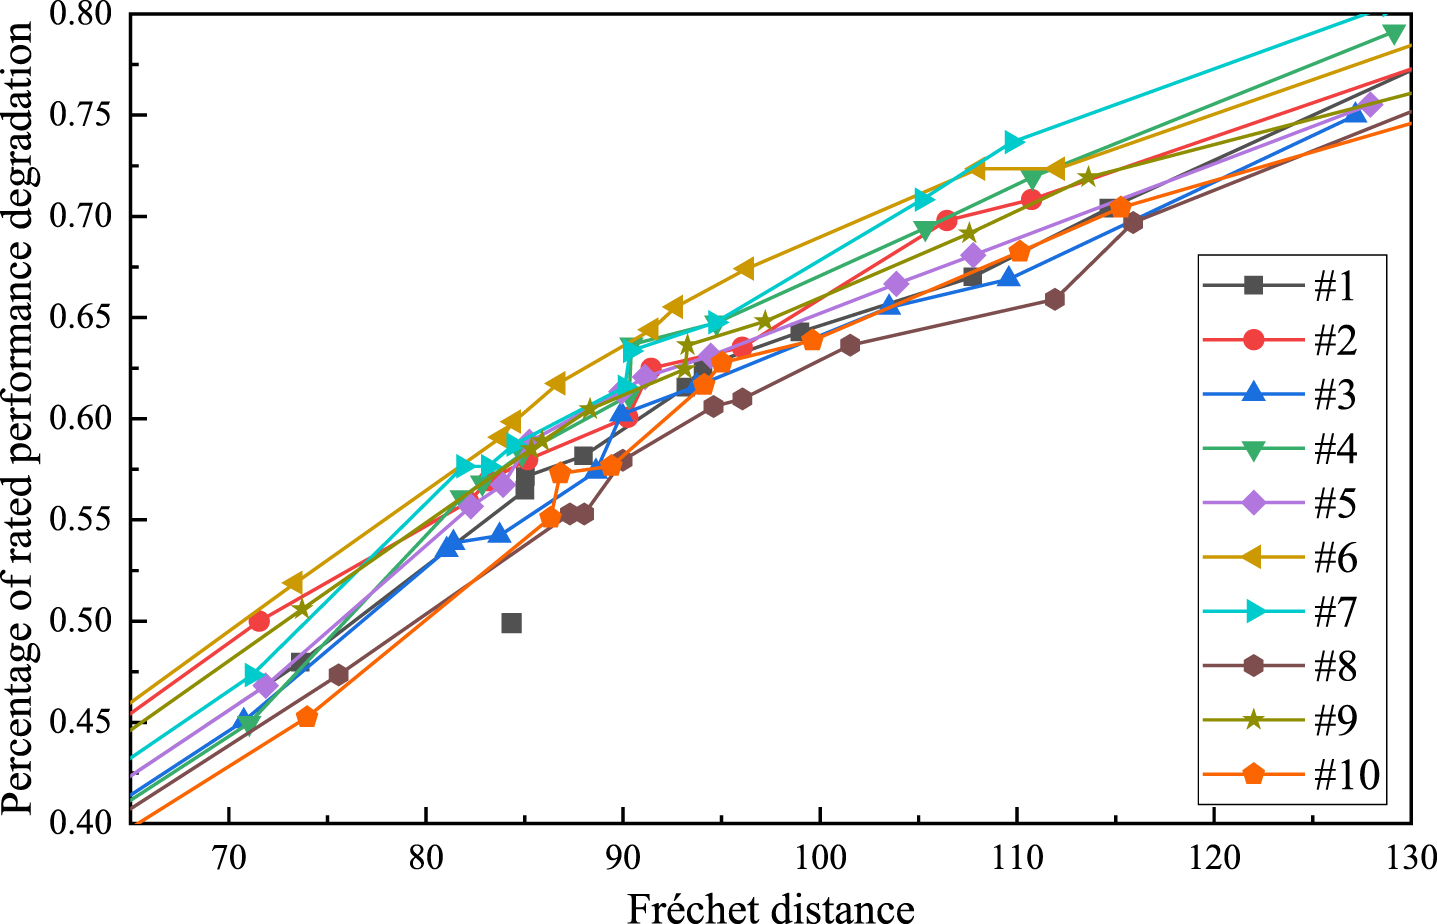
Degradation trajectories of YOLOv3 on Fréchet distance scale with A = 3.3 mm.
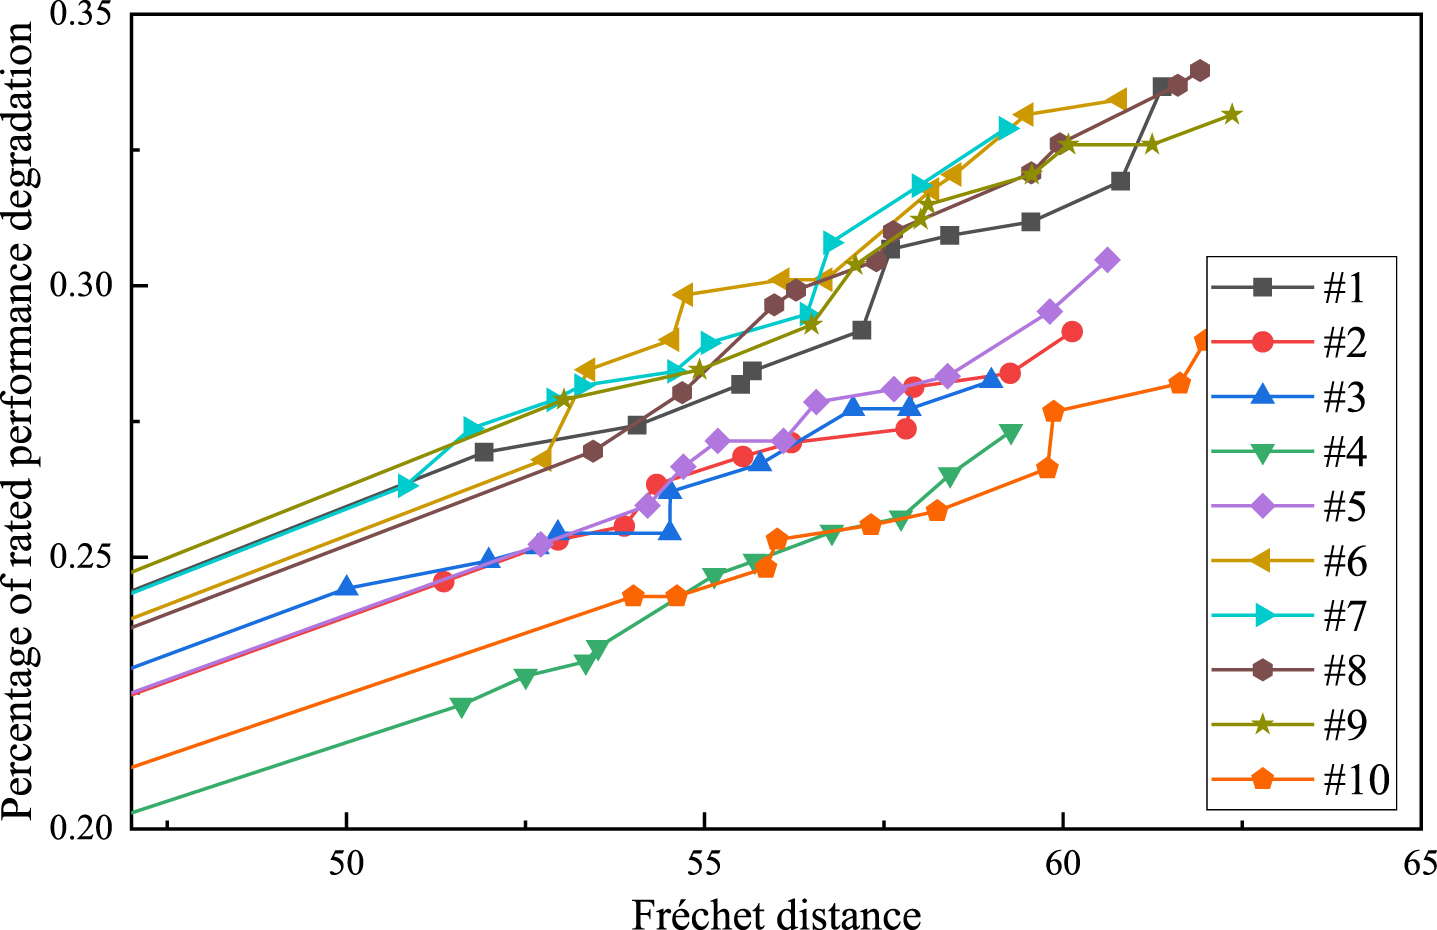
Degradation trajectories of PVTv2 on Fréchet distance scale with A = 3 mm.
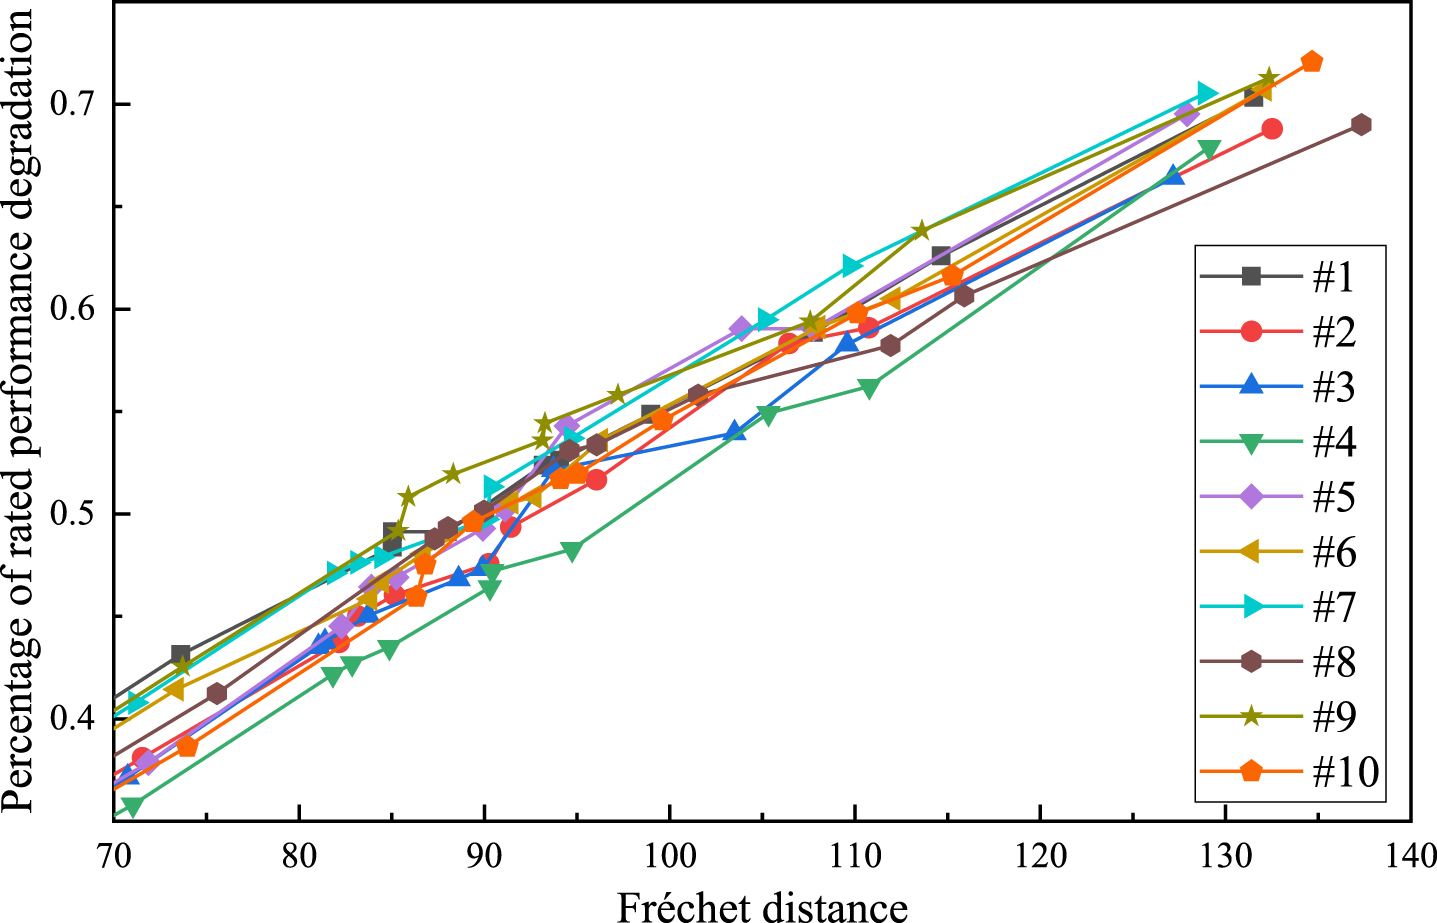
Degradation trajectories of PVTv2 on Fréchet distance scale with A = 3.3 mm.
Through the goodness-of-fit tests of the degradation data, it is determined that the degradation data of AI models follows a normal distribution under low frequency vibration. Based on the results of degradation data and Eqs. (16) and (17), the sample mean and standard deviation of the model at a specific FD value can be calculated. Figures 17–20 show the scatter plot of the sample mean and standard deviation data at various vibration amplitudes under the same FD value increment. By estimating the parameters, it can be concluded that the performance degradation of the model follows a normal distribution D(k) N(μ(k), σ(k)) at any discrepancy scale. Table 7 provides the mean function and standard deviation function with parameters of the AI models at vibration amplitudes A = {3, 3.3} mm.
Data scatter and fitting results of mean values over the same FD increment with A = 3 mm.
Data scatter and fitting results of mean values over the same FD increment with A = 3.3 mm.
Data scatter and fitting results with standard deviation values over the same FD increment with A = 3 mm.
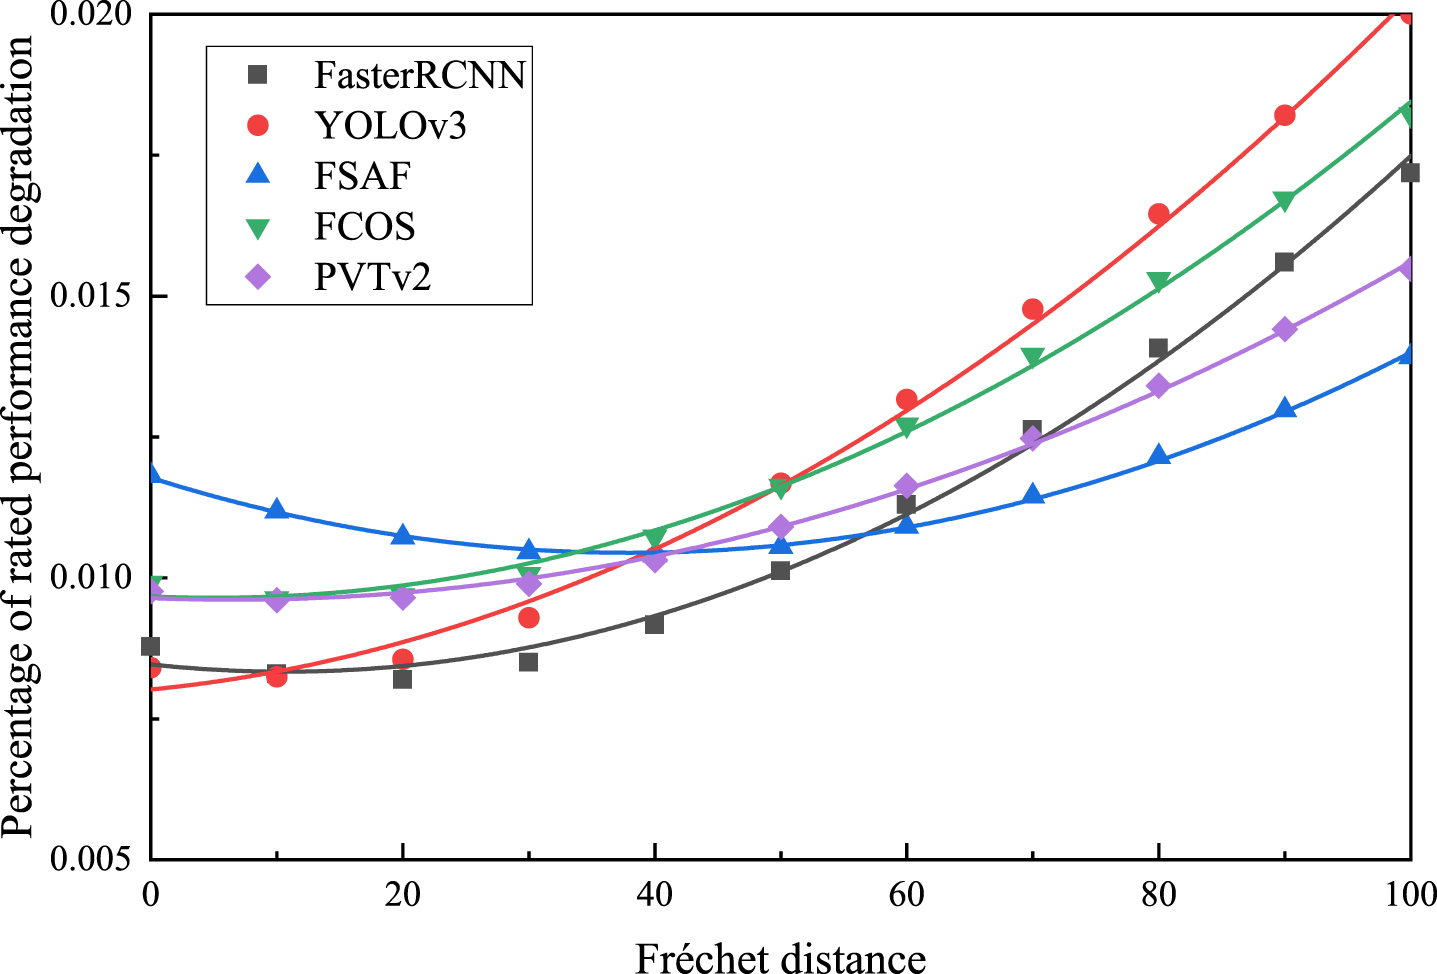
Data scatter and fitting results with standard deviation values over the same FD increment with A = 3.3 mm.
Mean function and standard deviation function with parameters of AI models.
Based on the performance degradation distribution and the model’s failure threshold, the environmental adaptability function of the model under low frequency vibration can be expressed as
Further, reliability curves of AI models based on the performance degradation distribution are obtained at different vibration amplitudes A = 3, 3.3 mm using the failure threshold. These curves are illustrated in Figs. 21 and 22.
Reliability curves of AI models on FD scale with A = 3 mm.
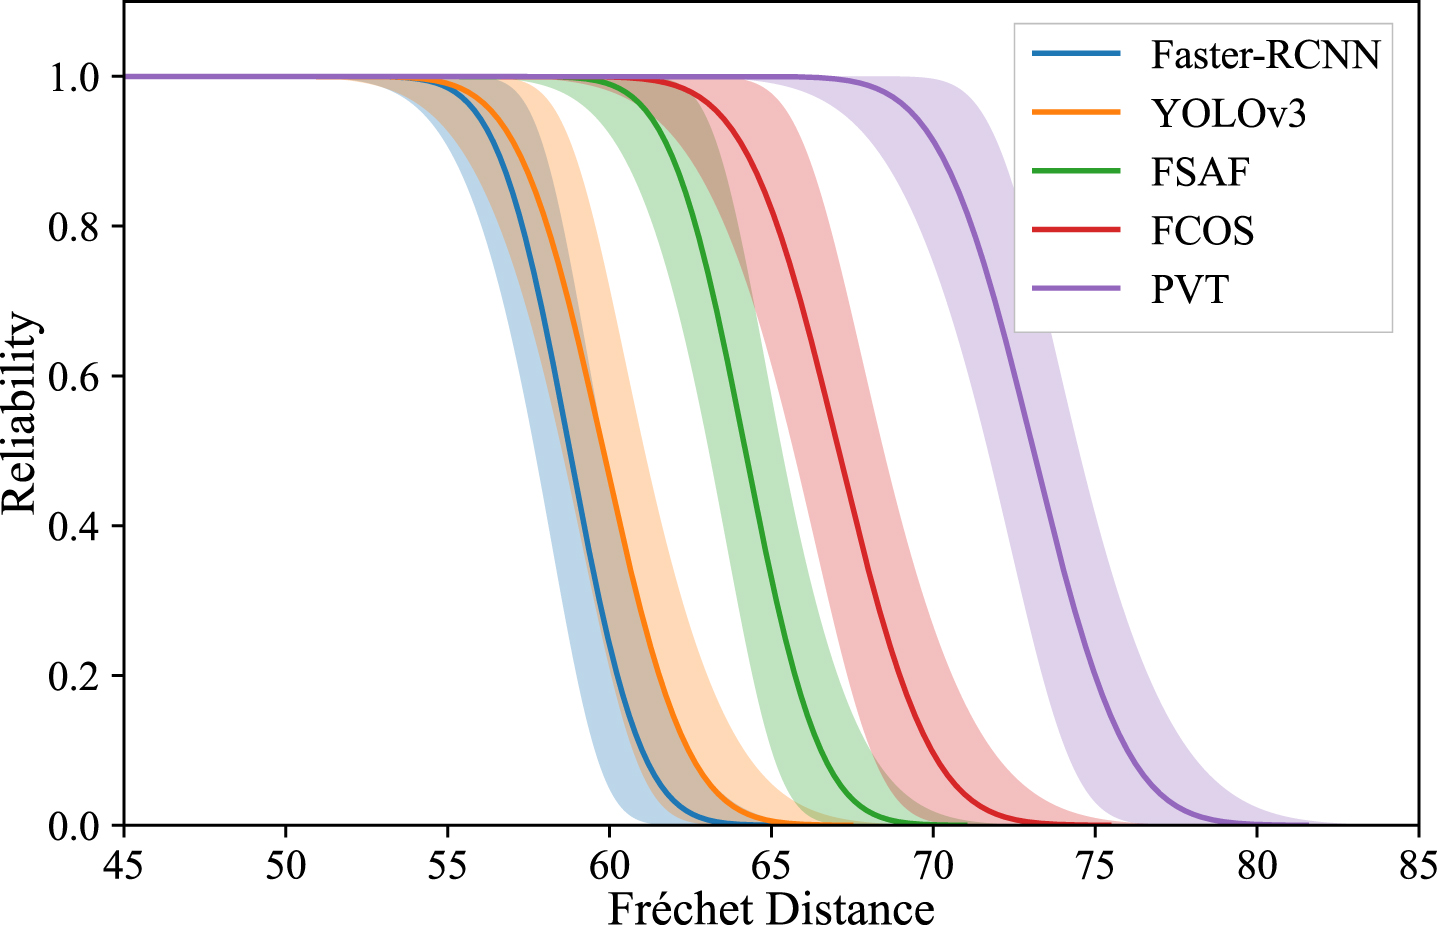
Reliability curves of AI models on FD scale with A = 3.3 mm.
The present test investigates the reliability of AI models subjected to high frequency and low-frequency vibrations. The reliability curves of AI models are obtained based on the discrepancy metric and environmental adaptability function. The following analysis can be drawn from the data:
The test results suggest that the performance of AI models decreases as the degradation amount increases, regardless of the type of vibration. Furthermore, the amount of performance degradation is linearly related to the discrepancy. Under high frequency vibration, the model performance is negatively correlated with the vibration amplitude. Conversely, under low frequency vibration, model performance is affected not only by the vibration amplitude but also by the frequency, with higher values of both parameters leading to poorer performance. The degradation amount of sample data for both high frequency and low frequency vibration follows a normal distribution for AI models. The sample mean and standard deviation of AI model performance degradation under vibration are functions of discrepancy. The linear function is the most effective in fitting the sample mean with respect to discrepancy, while the quadratic function provides a good fit for the standard deviation with respect to discrepancy. The values of environmental adaptability function of the AI models under high frequency and low frequency vibration are obtained, with FasterRCNN, YOLOv3, FSAF, FCOS, and PVTv2 models demonstrating an increase in their environmental adaptability, thereby enhancing their reliability. Under low frequency vibration, the larger the vibration amplitude and frequency, the weaker the model’s environmental adaptability function and reliability.
Conclusion
This paper presents a study on the reliability assessment of AI devices under vibration stress. In view of the difficulties in conducting tests on AI devices and the immaturity of reliability and environmental adaptability assessment methods, a reliability assessment method for AI devices based on the environmental adaptability metric at the FD scale is proposed. Additionally, a vibration test platform for the reliability assessment of AI visual perception systems is designed, which provides a more comprehensive understanding of the device’s performance under various scenarios. Finally, through tests, the environmental adaptability function of visual perception systems under vibration stress is obtained, providing a new path for AI equipment reliability testing and evaluation.
This study primarily focuses on the testing and evaluation of the environmental reliability of AI-based visual perception systems. The proposed methods are effective for assessing the reliability of visual systems, but new testing approaches still need to be explored for other AI perception systems, such as lidar-based or radar-based systems. In the future, our research will primarily investigate the environmental reliability of visual perception systems in coupled scenarios involving vibrations and other stress conditions, such as adverse weather and temperature. This will provide credible assurance for the reliable operation of AI systems in challenging or adverse environments.