
Abstract
The consumer price index (CPI) is an important indicator to measure inflation or deflation, which is closely related to residents’ lives and affects the direction of national macroeconomic policy formulation. It is a common method to discuss CPI from the perspective of economic analysis, but the statistical principles and influencing factors related to CPI are often ignored. Thus, the impact of different types of CPI on China’s overall CPI was discussed from three aspects: statistical simulation, machine learning prediction and correlation analysis of various types of influencing factors and CPI in this study. Realistic data from the National Bureau of Statistics from 2010 to 2022 were selected as the analysis object. The Statistical analysis showed that in 2015 and 2020, CPI had a fluctuating trend due to the impact of education and transportation. Four types of statistical models including Gauss, Lorentz, Extreme and Pearson were compared. It was determined that the R2 fitted by Extreme model was higher (R2 = 0.81), and the optimal year of simulation was around 2019, which was close to reality. To accurately predict the CPI, the results of Support Vector Machine, Regression decision tree and Gaussian regression (GPR) were compared, and the GPR was determined to be the optimal model (R2 = 0.99). In addition, Spearman matrix analyzed the correlation between CPI and various influencing factors. Herein, this study provided a new method to determine and predict the changing trend of CPI by using big data analysis.
Abbreviations
Consumer price index
Gaussian regression
Mean absolute error
Mean square error
Producer price index
Regression decision tree
Root mean square error
Support vector machine
Introduction
In the field of economics, many indicators provide convenience for research and analysis from the digital perspective [1–3], such as the consumer price index (CPI). CPI is a measure of the average price paid by consumers for a unit quantity of consumer goods and services over a period, which is also an important indicator of inflation or deflation [4]. The purpose of compiling the CPI is to understand the basic situation of price fluctuations in various parts of the country more intuitively through data, then to analyze and study the impact of price changes on socio-economic development and residents’ living standards, which is closely related to residents’ lives [5]. Meanwhile, CPI also affects the trend of national macroeconomic policy formulation, providing reference and needs for governments at all levels to formulate policies and plans, which carry out macro-control and provide a basis for measuring the national economic situation [6].
In recent years, the outbreak of the new crown epidemic affected the irregular fluctuation of the CPI, and economic development faced multiple pressures under the influence of many factors. Therefore, how to analyze the influencing factors of CPI more scientifically and intuitively has become a hot issue [7]. Statistical model fitting is a common way to describe numerical variation trends [8, 9]. To determine the most reasonable model, we need to go through the comparative analysis of several models [10]. In addition, there are many complex relationships among different factors of CPI. Therefore, in analyzing the changing trend of CPI, the influencing factors need to be emphasized.
Machine learning is based on computer algorithms and models that can automatically develop and adapt to a given situation and can make predictions from experience [11]. The benefits of machine learning have been widely recognized, including saving time and having high predictive accuracy in complex nonlinear problems. Currently, machine learning has been widely used in the economic field to make predictions, as well as to solve most classification problems. The reliable machine learning model broadens the research field of CPI and has provided significance for the analysis of other economic indexes. However, affected by various unstable factors, CPI and its derivative problems have become a more complex system [12]. Applying machine learning to predict the CPI is a breakthrough.
Therefore, the purposes of this study were to: (1) summarize the general trend of CPI change in China through big data analysis, and explore a fitting statistical model to describe this trend digitally; (2) compare various machine learning models, find out the best-performed model for China’s CPI, and analyze its model principle; (3) deeply clarify the influence of various factors on CPI by Spearman correlation matrix. This study provided a new method to determine and predict the changing trend of CPI by using big data analysis.
Literature review
Survey of CPI status
As the economy fluctuates, many scholars base their observations on the CPI. In recent years, the Chinese government’s macroeconomic policy has been shifting between expansion and tightening, and trying to balance economic growth with inflation [13, 14]. Some scholars have found that the rise of CPI will not bring negative effects, but it is conducive to bringing more economic development benefits to society, which is beneficial to the long-term development and target planning of enterprises [15]. China’s economy is in a critical period of growth, but the development of this period is also accompanied by risks and pressures in financial operations. As the main reference object in the process of economic policy making, CPI can reflect the level of inflation, and its result feedback will help the future economic trend and welfare level. Therefore, how to adjust the welfare through the influence mechanism of CPI and the change of CPI still needs further research.
Survey of machine learning status
Several advanced machine learning models have been developed to solve various problems [16]. The economic activities under the Internet and big data models have promoted the generation of more high-dimensional and complex empirical data [17]. According to the literature survey, the literature on economics and machine learning was retrieved, and the keywords in Fig. 1 were found to be connected with machine learning. The research methods of machine learning mainly include supervised machine learning and unsupervised machine learning. In the field of economic research, supervised machine learning usually needs to use characteristic variables to predict the results, such as the prediction of house prices and oil prices [18].
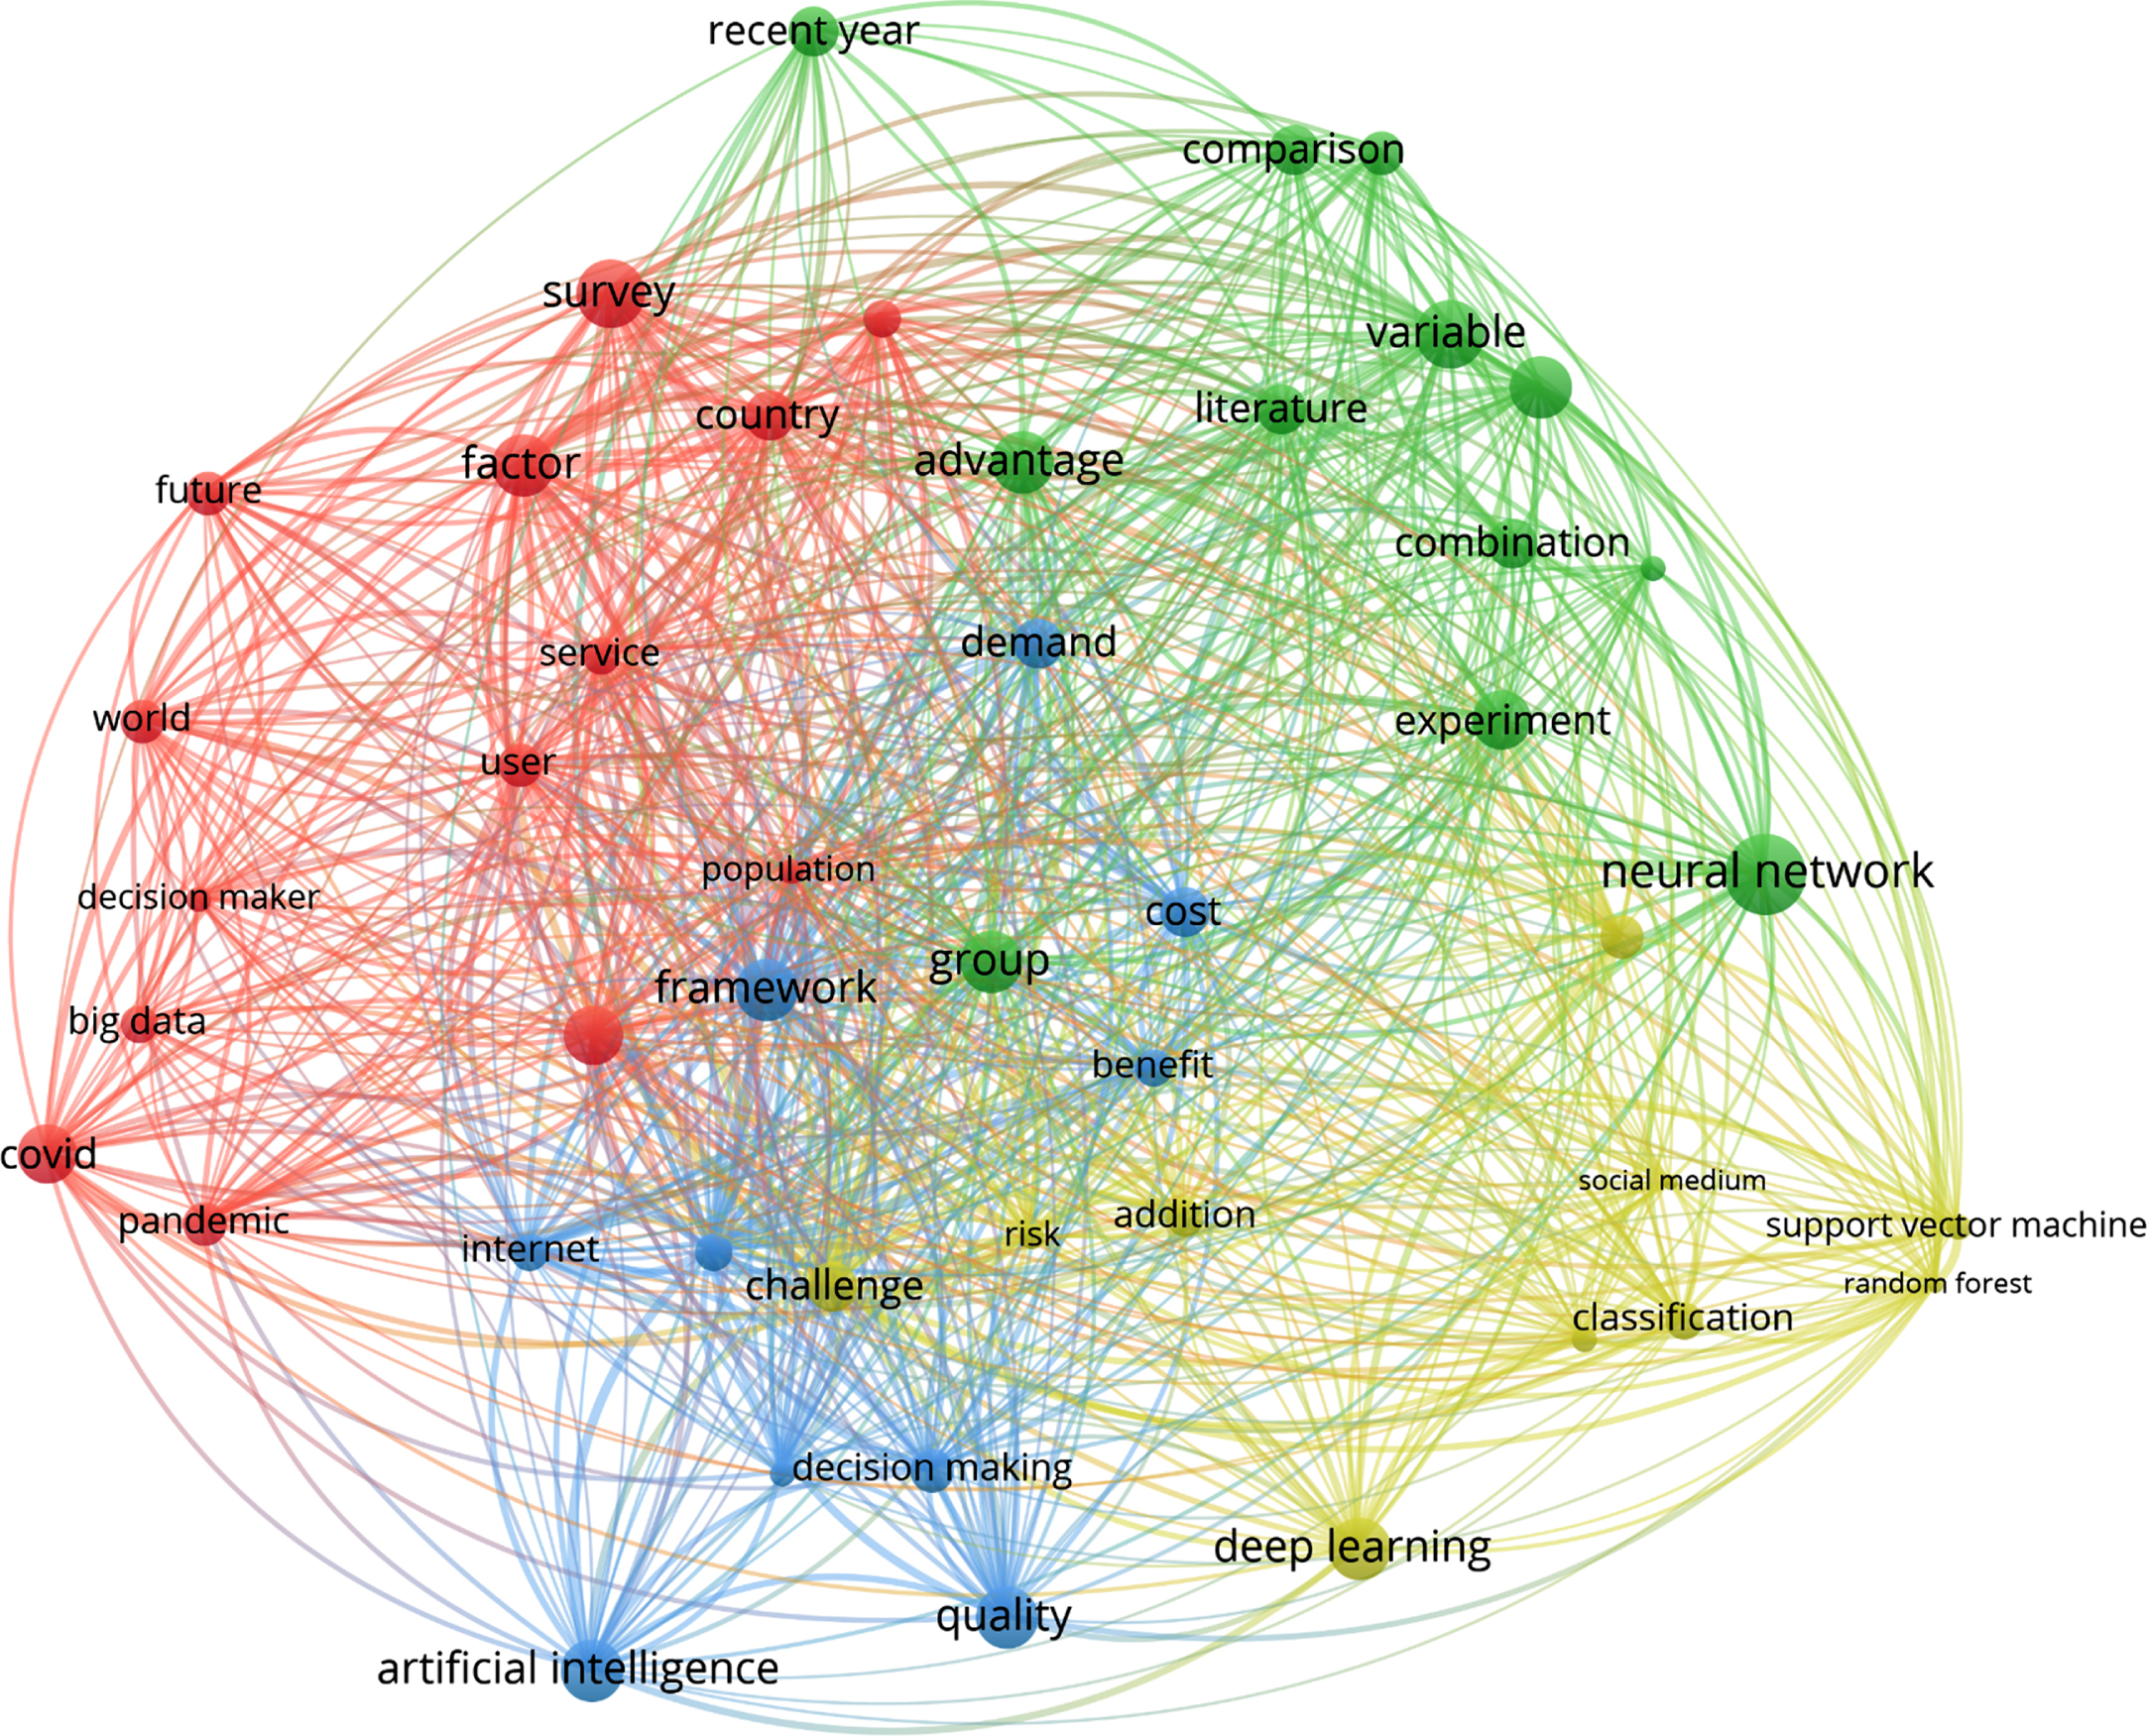
Literature Network Diagram of CPI and Machine Learning.
Moreover, unsupervised model transforms all empirical information into sample information, identifies and mines useful information from huge information in a data-driven way, and then calculates variables that can be used for economic analysis. Unsupervised machine learning commonly used in economic research includes K-average algorithm, topic modeling, community discovery, and so on [19, 20]. In addition, probability vector or weight vector can also be used as a clustering feature to partition according to probability vector and weight vector.
Processing big data from the literature
In this study, the data obtained from China’s National Bureau of Statistics National database is the realistic CPI data from 2010 to 2022 (https://data.stats.gov.cn/). The different categories of CPI were surveyed, including eight categories of food tobacco and alcohol, clothing, living, goods and services, transportation and communication, education, culture and entertainment, medical care and other goods and services, totaling 153 groups of sample data (Table S1). SPSS software was used for statistical analysis. Spearman correlation matrix was used to evaluate the impact of different categories of factors on CPI. The changing trend of CPI was fitted employing Statistical models. The CPI was predicted by machine learning models.
Analysis methods
In this study, CPI, CPIi and average CPI were according to Equations (1) to (4).
To digitally describe the annual average trend of CPI, four statistical models were compared and evaluated. The optimal model will determine the year corresponding to the maximum CPI and estimate its maximum. In Equations (5) to (8), CPI was fitted by Gauss, Lorentz, Extreme and Pearson models.
Gauss model:
Lorentz model:
Extreme model:
Pearson model:
where y is CPI at different year; x is year; xc is optimum year; w2 is variance; p is coefficient.
Typically, machine learning models are classified into supervised, unsupervised, and probabilistic models. Supervised and probabilistic models are often used for prediction, classification, and early warning moderation, while unsupervised models are used for clustering and categorization. In this study, regression decision tree model (RDT) and support vector machine model (SVM) from supervised models, and Gaussian regression model (GPR) from probabilistic models were used, through different factors to predict the CPI, the prediction accuracy of models were evaluated.
Decision trees are a basic classification and regression method. when decision trees are used for classification called classification trees and when they are used for regression called RDTs. An RDT partitions the regression prediction space into multiple non-overlapping regions for prediction. the RDT works as follows Equations (9) to (12).
where Rj is the region;
GPR is a nonparametric model for regression analysis of data using a Gaussian process. In addition, GPR can provide validation of the prediction results, and when the likelihood is normally distributed, the validation has an analytic form. Therefore, GPR is a generalized analytic probability model. GPR works as in Equation (13).
The SVM adopts the supervised learning method, uses the hinge loss function to calculate the empirical risk, and adds the regularization term in the solution system to optimize the structural risk. It is characterized by sparsity and stability. The working principle of SVM is as follows:
hypothesis δ ⪢0, then in the above formula δ Represents a nonnegative relaxation variable; C is the penalty factor; φ() is a kernel function.
Suppose that K (x
i
, x
j
) = φ (x
i
)
T
φ (x
j
), the optimization problem is transformed into a dual problem, namely the Lagrangian method.
Statistical analysis
In this study, the annual total CPI and the average of various types of CPI were calculated for statistical analysis. In Fig. 2, a 3D-waterfall map was made based on the CPI value, year and CPI classification. 3D-waterfall chart adopted the combination of absolute value and relative value to clearly show the quantitative change relationship between CPI, various types of CPI and annual values, to reflect the degree and results of data in different periods or affected by different factors, and intuitively illustrate the increase and decrease of data. In general, the CPI values of various types fluctuated between 90 and 110. However, there was a trend that the value fluctuated significantly after being gentle.
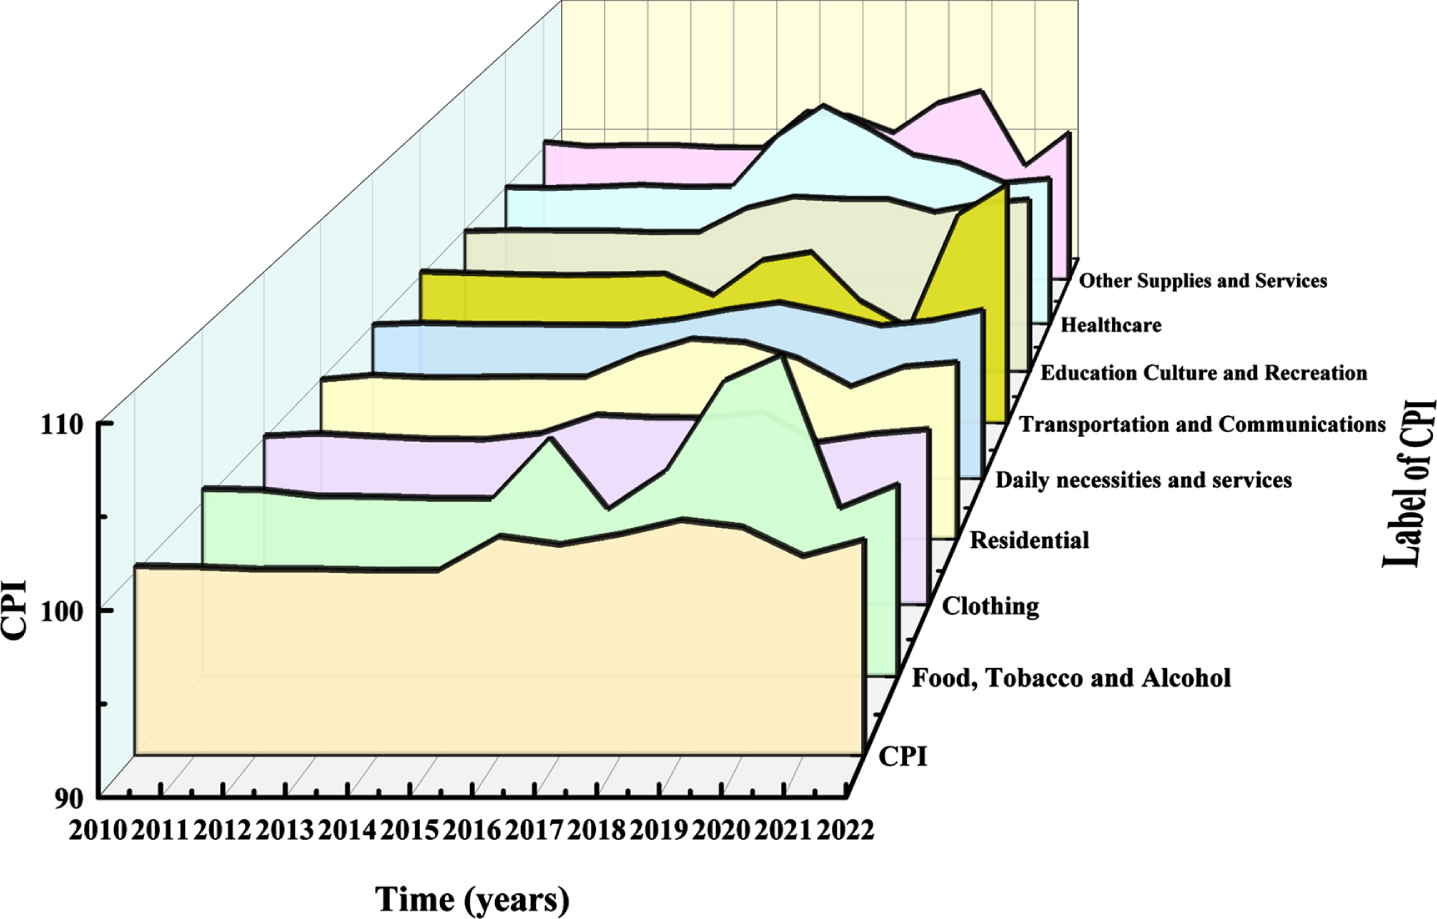
3D-waterfall plot of CPI change trend with years.
In addition, the fluctuation amplitude changed irregularly after 2015, showing a basic decline (Fig. 2). Most factors such as transportation, Food tobacco and alcohol, living, transportation and communication were on the rise, while education, culture and entertainment and other goods and services were on the decline. It may be that after 2015, China’s 13th Five-Year Plan was issued, which determined the direction of China’s economic development in the next five years. With the support of policies, both scientific and technological innovation, economic development and people’s living standards have been improved. In addition, after 2015, China began to implement a comprehensive open birth policy to stimulate population growth. The increase in population stimulated the increase of people’s demand for various commodities, which affected the fluctuation of CPI.
In 2020, the CPI of transportation and communication declined. On the contrary, under the influence of the epidemic, transportation and communication were more affected. Because the transportation industry was easy to expand the spread scope of the epidemic and the restrictions required by different epidemic prevention and control policies in different regions, the growth of such factors is limited. In addition, in 2020, China will fully popularize 12 years of compulsory education. There were 210800 schools at the compulsory education stage nationwide, with 34.4019 million students enrolled and 156 million students enrolled. The consolidation rate of nine-year compulsory education reached 95.2%. With the vigorous development of national education and the popularization of education, more and more people began to attach importance to the education of the new generation, stimulating the rapid development of national education.
Statistics is a research technology that integrates and processes collected data, provides scientific technical support and data proof for the progress and development of various research fields, can ensure the rationality of decision-making and promote the sustainable development of research direction. At present, to achieve scientific and practicality in the practice of various fields, many scholars explain and discuss the application of statistics to practical problems. Thus, it can improve the development of information technology in a certain research field. According to the collected documents, the relevant research fields and research results of statistics are shown in Table 1.
Statistical literature review
Statistical literature review
In this study, four statistical models were selected for fitting: Gauss model, Lorentz model, Extreme model and Pearson model. Gauss model is a nonparametric Bayesian statistical inference model, which is a powerful mathematical tool for modeling various complex surfaces through mean and covariance functions. The statistical characteristics of Gauss model enable it to incorporate measurement errors into the modeling process and assign credibility to the constructed model [25]. In 1905, the American economic statistician Mr. Lorenz put forward the Lorenz curve to study whether wealth, land and wage income were fair. At present, Lorenz curve is also applied to the fitting of macroeconomics [26]. Extreme model is a process of constantly finding the optimal solution and is also a common means of statistical fitting and prediction [27]. Pearson model is a process of forming constraint conditions through correlation calculation, to carry out fitting analysis [28]. Therefore, four models with different principles were selected for fitting, aiming to digitally describe the annual average CPI change from a statistical perspective.
The annual average CPI was used for fitting, as shown in Table S2. In Fig. 3, the four curves could generally fit the overall trend of CPI changes with years, but the fitting results were different, R2 was between 0.69 and 0.81. In general, Extreme model with the R2 of, R2 0.81 had the best fitting effect, while Pearson model had the worst fitting effect and its R2 reached 0.69 (Table 2). The value of Xc in the formula represented the optimal year. The Xc values of Gaussian model, Lorentz model and Extreme model were 2018.95, 2018.99 and 2018.54, respectively, which were consistent with the actual values in Fig. 3. But Pearson model did not fit the best year well. In addition, from 2010 to 2015, CPI performed a slight downward trend. Among the four models, only the extreme model described this downward trend, while other models did not show a downward trend (Fig. 3). Furthermore, in the description of the highest point, Lorentz model had made the closest fitting, while other models were slightly inferior.
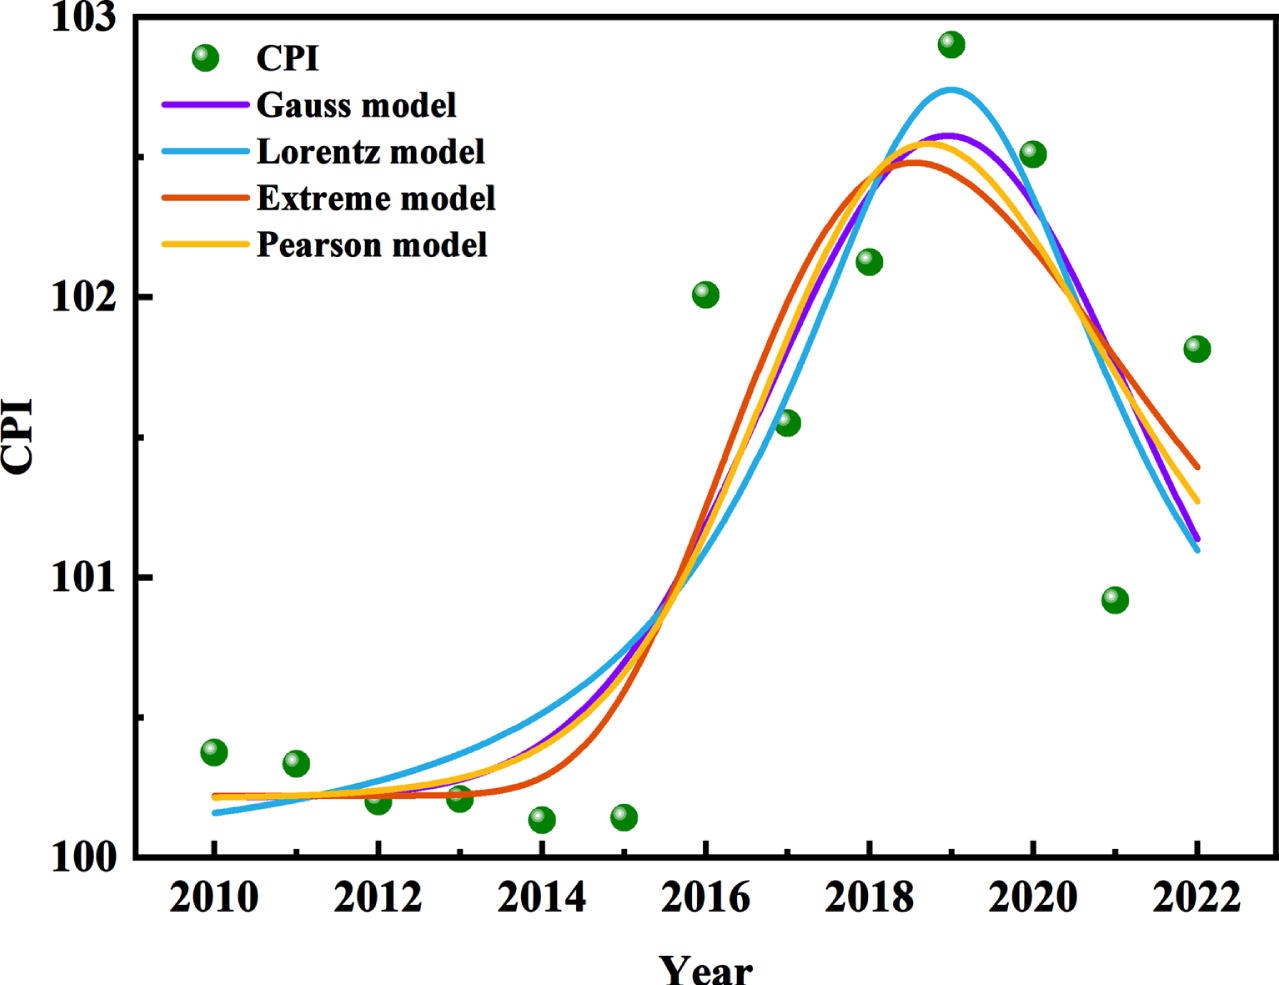
Statistical model fitting results of CPI and year.
Fitting parameters of the statistical model
In a word, fitting CPI with the statistical model was a relatively novel means to describe traditional economic problems with digital methods. In this study, Extreme model was a good choice to fit the overall change trend of CPI and year. This statistical fitting provided a reference method for predicting the trend of CPI change with years.
Predictive analysis
In previous studies, scholars tried to quantitatively compare CPI changes in China and the United States to find the rule and determine the prediction model [29]. Through literature research, researchers seem to be more interested in machine learning models based on neural networks. It is reported that SARIMA and back propagation neural network were used to predict the CPI data from January to June 2022 in Jiangsu Province of China [30]. In addition, With the help of the Baidu index and Ali index search data, Li [31] predicted the CPI trend by establishing different models that predicted the consumer price index, which clarified that the established neural network model could significantly improve the prediction effect. Other research methods for CPI prediction by different scholars are shown in Table 3. Therefore, a model different from the neural network principle is chosen in this study to predict the changing trend of CPI.
Machine learning literature review
Machine learning literature review
In this study, RDT, SVM and GPR were selected to predict CPI and compared with real data. Eight input conditions are set, namely food tobacco and alcohol, clothing, living, goods and services, transportation and communication, education, culture and entertainment, medical care and other goods and services. As shown in Table S1, 153 groups of data samples from 2010 to 2022 were selected to reduce prediction error and avoid data nonconvergence. In the dataset, 70% were randomly set as training data and 30% as validation data.
Figure 4a to Fig. 4i compared the predicted value with the real value through RDT, SVM and GPR models. The prediction results emphasized the change trend of CPI, and also proved that the regression model can roughly predict the overall change of CPI under the influence of different consumption categories. GPR and SVM models had better prediction results than RDT. Among them, the predicted value of GPR was the closest to the true value. A small number of GPR prediction results were not close to the real value, but more RDT prediction points were far away from the real data. There was a certain gap between the predicted data and the actual data, which may be due to the different prediction principles of different models, and the prediction principles of GPR model are more consistent with the change rule of CPI under the influence of different types of consumption.
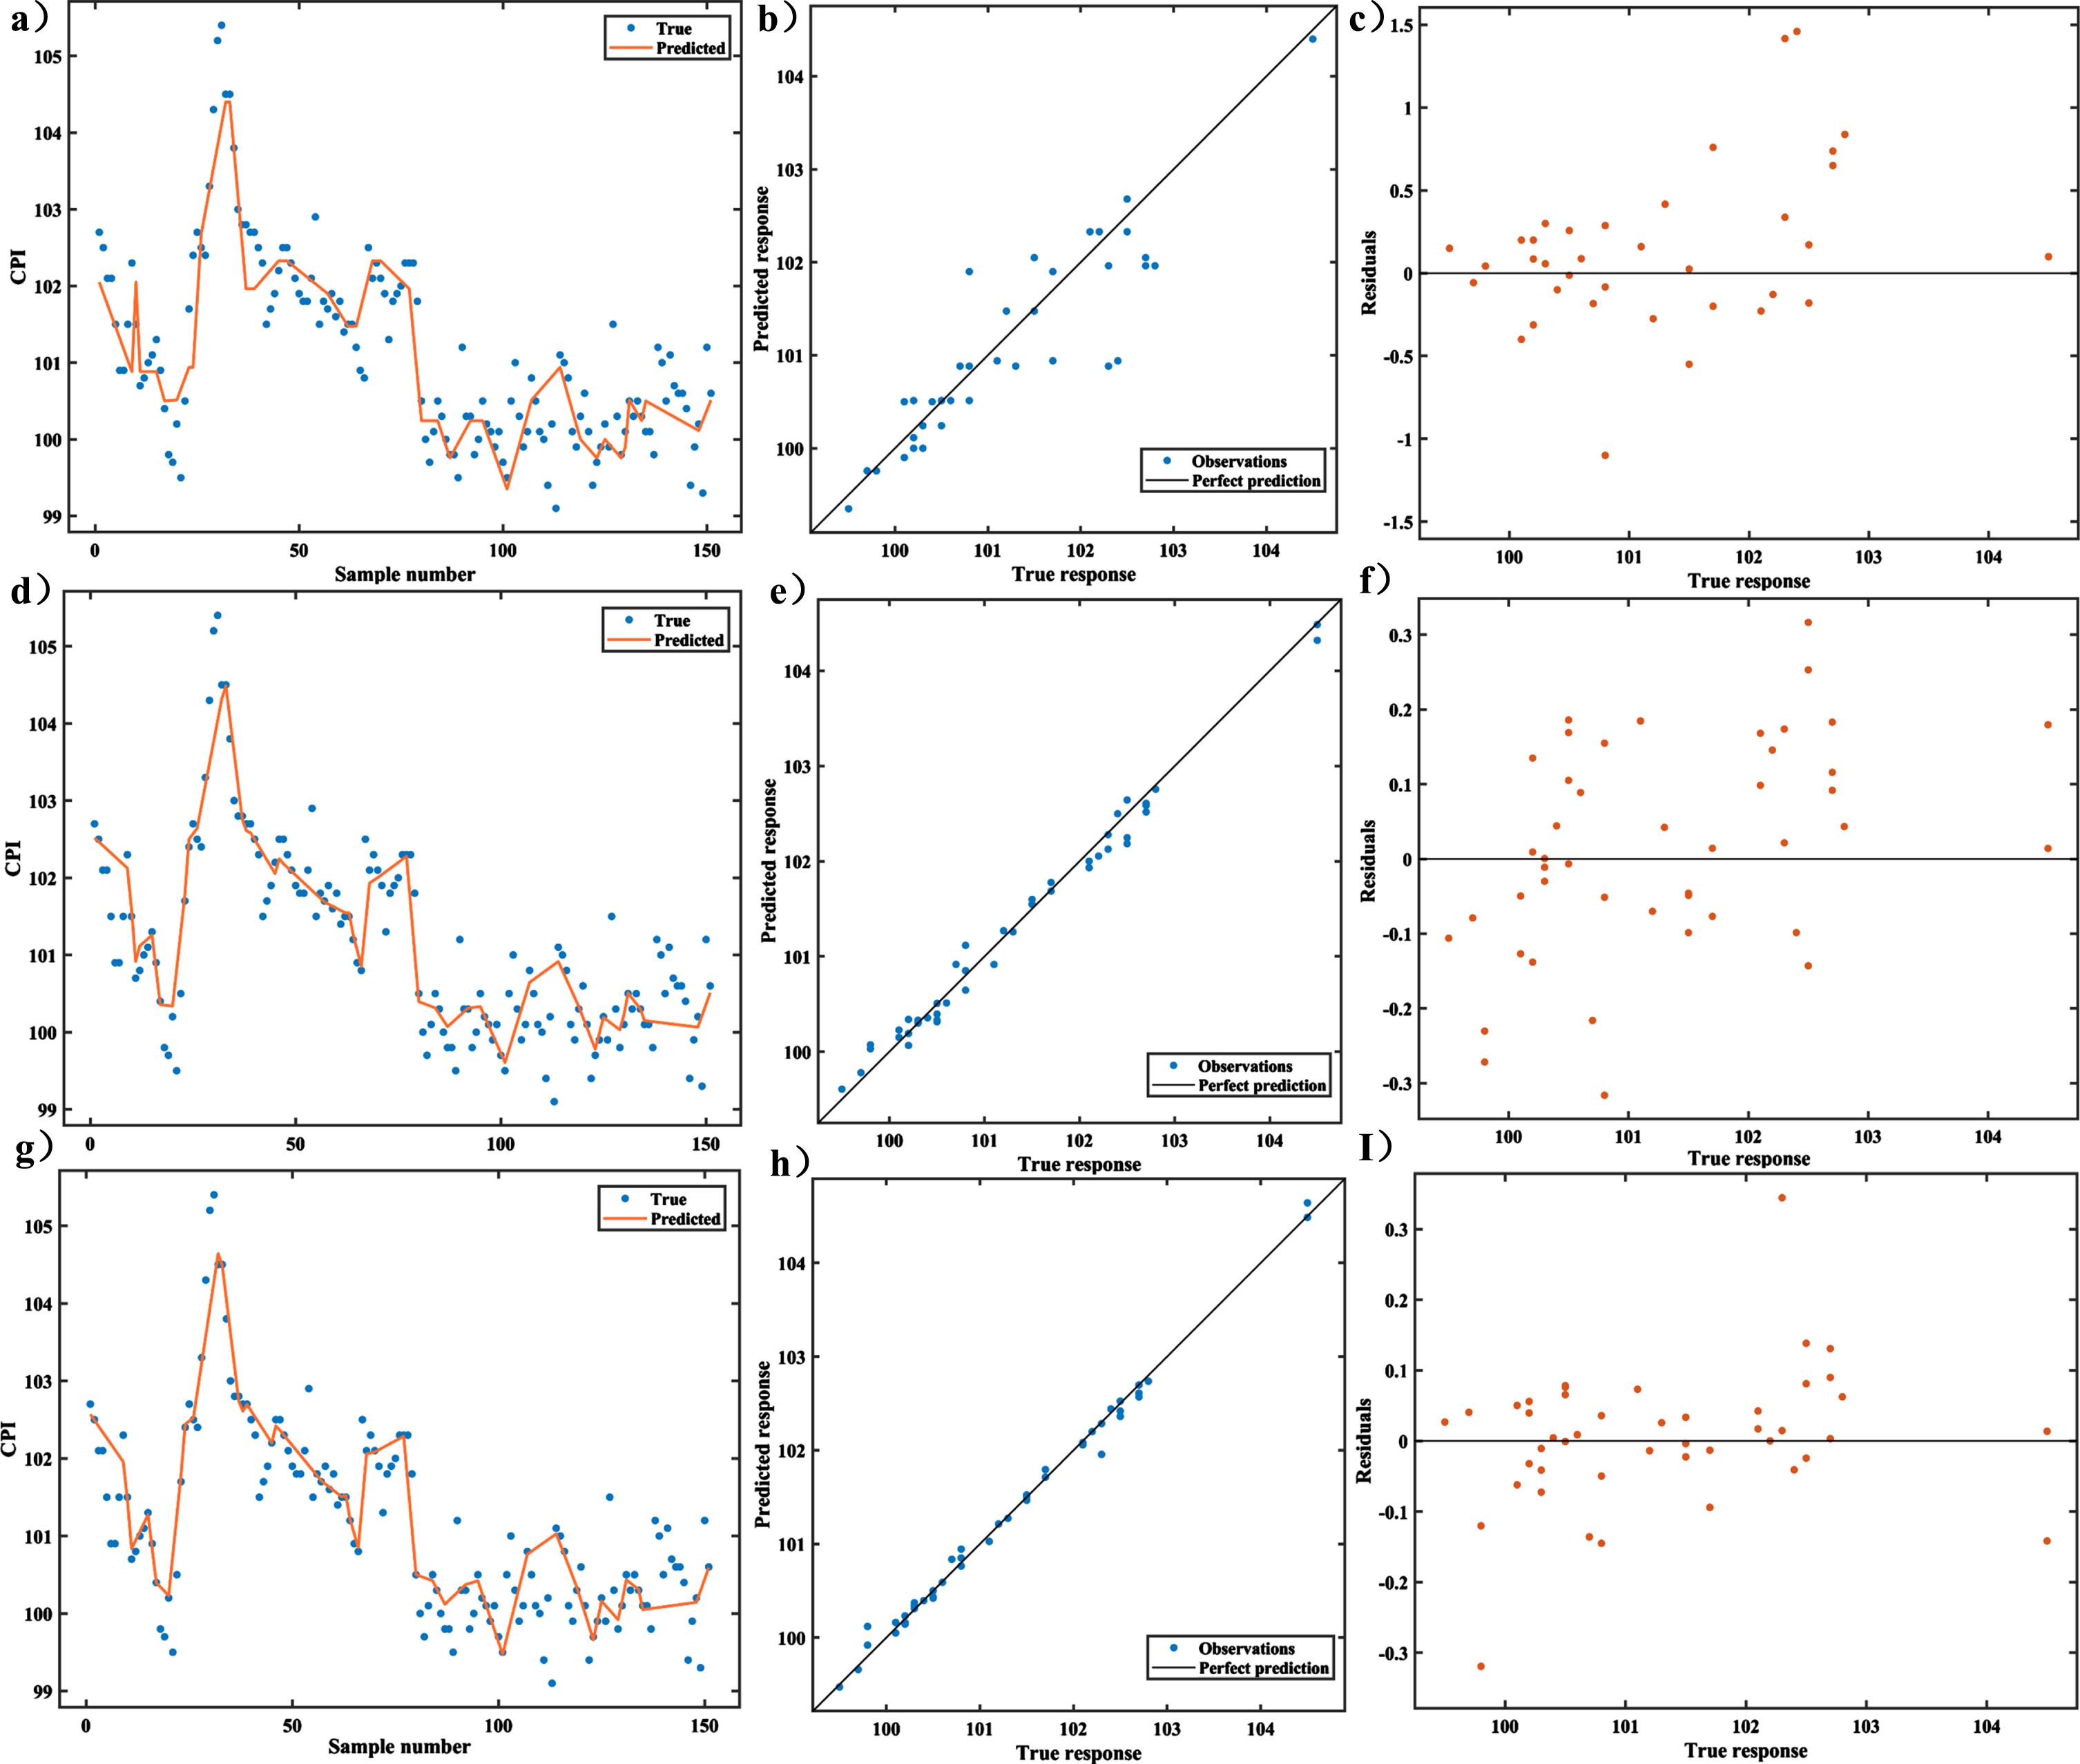
Performance effects of three prediction models: RDT(a, b, c), svm(d, e, f) and GPR(g, h, i).
In this study, supervised models were selected for the models, including decision algorithm, classification algorithm and probability algorithm. There were some differences between the three models. First of all, in terms of predicted values, some values in the SVM model were inconsistent with reality. From the analysis of model principle, SMV is a binary classification model, while the influencing factors of CPI are more complex, and the binary classification model cannot deeply classify the influencing factors. The specific parameters related to the model were listed in Table 4, which showed that the highest R2 of the GPR model is 0.99, and with the root mean square error (RMSE) of 0.096, which was far lower than the other two models. However, the mean square error (MSE) and mean absolute error (MAE) of RDT model were 0.220 and 0.321, respectively, higher than those of GPR, indicating that RDT was not a good choice. In addition, the GPR model also conforms to the principle of multivariate normal distribution, which is consistent with the characteristics of CPI, and further proves the reliability of the model.
Fitting parameters of RDT, SVM and GPR
Fitting parameters of RDT, SVM and GPR
In addition, Anderson, Walsh, Flynn and Walsh [36] pointed out that in addition to R2, RMSE and other parameters, prediction speed and training time were also important criteria for evaluating the prediction results of the model. The prediction speed of RDT, SVM and GPR models can reach 2400, 12000 and 20000 OBS/s, respectively, and the training time was 3.529, 0.828 and 0.829 s, respectively. This result showed that the training time of SVM and GPR models were relatively close, RDT algorithm needed more training time. Therefore, based on the prediction speed, training time and training results, we can conclude that the GPR model was satisfactory in these three models
In this study, Spearman statistical analysis method was used to analyze the correlation between consumer price indexes of various influencing factors (Fig. 5). In Fig. 5, the solid line represented a positive correlation and the dotted line represented a negative correlation. The strength of the correlation is indicated by the thickness of the line type, which means the thicker line type denoted the stronger the correlation.
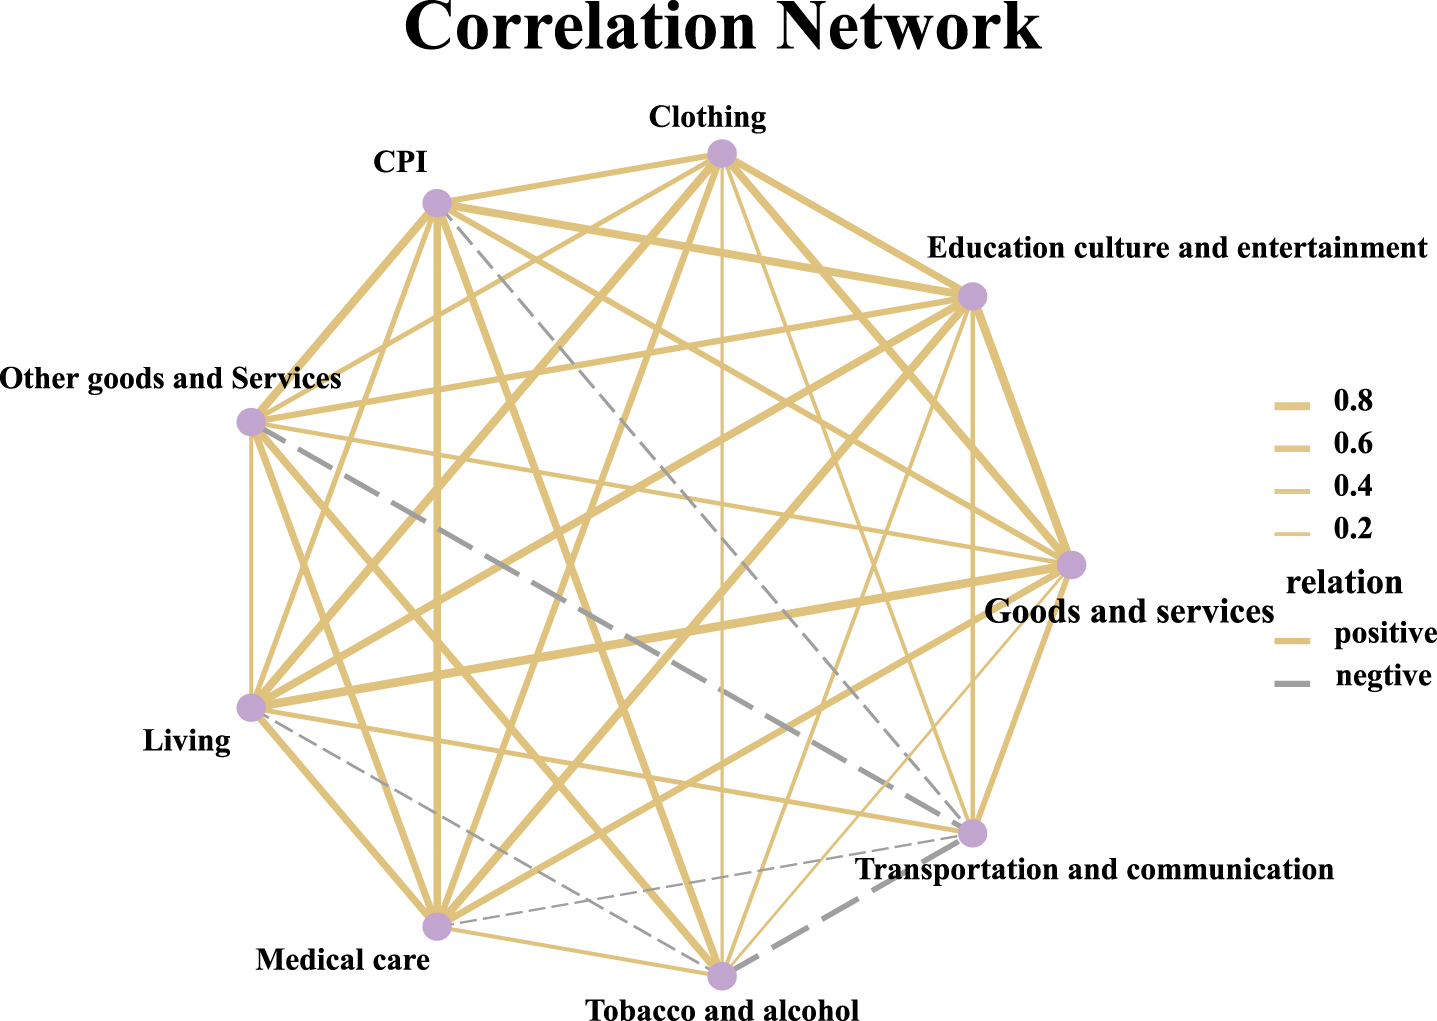
Spearman Correlation heat map for CPI and other factors.
As shown in Fig. 5, CPI was mainly positively related to goods and services, living, medical care, food, tobacco and alcohol, clothing, education culture and entertainment, and other goods and services, which was because the rapid development of digitalization has expanded the scale of online consumer groups in the age of big data, making it easier to obtain daily necessities. In addition, the 20th National Congress of the CPC pointed out that to build a modern industrial system, which should focus on the real economy, promote new industrialization, and accelerate the construction of manufacturing, quality, aerospace, transportation, network, and digital China. With the encouragement and support of policies, China’s economy has been developing continuously, social productivity has been greatly improved, people’s living standards have been significantly improved, and the demand for social services and goods has been increasing. What’s more, the novel coronavirus has an impact on medical and health services. The global dependence on epidemic prevention supplies increased with the aggravation of the epidemic situation, and the market demand increased significantly, which affected the change in the market price level. In a word, these factors have become the positive driving force of China’s CPI fluctuations and have a far-reaching impact on the development of the market economy.
However, CPI was mainly negatively related to the consumer price index of transport and communication residents. Behind the rapid economic development and the continuous improvement of the quality of material life, the environment on which people depend for survival was facing more serious challenges. The main fluctuation of transportation and communication CPI came from the fuel for transportation, which was mainly affected by the international crude oil price [37]. As a non-renewable resource, oil was increasingly scarce, and the rapid development of China’s transportation field was inseparable from the large consumption of fuel oil. The sustainable development of the natural environment and national energy security were under great pressure [38]. The rise and fall of oil prices had a relatively obvious lagging effect on China’s economic growth, restricting the fluctuation of CPI [39].
Furthermore, there are some obvious correlations between other parameters. The living category is positively related to education, culture and entertainment, and the degree is strong. The residents living around the education, culture and entertainment infrastructure have driven the development of the education, culture and entertainment industry. At the same time, education and culture have also improved the quality of the surrounding people and promoted social harmony and progress. Moreover, clothing was positively related to daily necessities and services, because people’s quality of life mainly depended on these parameters. With the development of the economy and the improvement of people’s living standards, these parameters have also increased.
In this study, the impact of different types of CPI on the overall CPI in China was discussed from three aspects: statistical simulation, machine learning prediction and correlation analysis between various types of influencing factors and CPI. First of all, the research showed that in 2015 and 2020, due to the impact of education and transportation, CPI fluctuated. Next, it was found that Extreme model can well fit the law of the change of the overall average CPI with the year. In addition, GPR model can well predict the changing trend of CPI under the influence of years and various factors. In addition, Spearman correlation analysis found that CPI was mainly positively related to goods and services, living, medical care, food, tobacco and alcohol, clothing, education culture and entertainment, and other goods and services, while CPI was mainly negatively related to the consumer price index of transport and communication residents.
Different from traditional research methods, this study compares a variety of statistical models and machine learning models to simulate and accurately predict the changing trend of CPI from the two dimensions of annual and monthly changes of CPI. The average annual maximum value of CPI and the year were successfully fitted through the statistical model. Machine learning methods are also more in line with scientific modernization. Combined with the results of statistics, machine learning model and Spearman correlation analysis, the future CPI trend can be predicted and timely adjustments can be made, which provides new ideas and methods for economic research. However, the shortcoming of this study is that it only analyzes data in China and the number of models is limited.
In future research, based on this research, we can increase the amount of data in the model and conduct an in-depth analysis of the model. For example, SHAP analysis and other means are added to analyze the importance of input from the perspective of machine learning models.
Appendix A. Supplementary data
The supplementary Appendix is available in the electronic version of this article: https://dx.doi.org/10.3233/JIFS-234102.