
Abstract
Air pollution exerts a profound impact on both public health and the natural environment. In India, festivals like Diwali also contaminate the air by releasing pollutants into the atmosphere. It is essential to identify the most polluted region by estimating these pollutants. Since air quality assessment involves multiple air pollutants, there may be inherent uncertainty associated with data. This study employs a fuzzy Multi Attribute Decision Making (MADM) framework fuzzy Analytical Hierarchy Process-Entropy-fuzzy VlseKriterijumska Optimizacija I Kompromisno Resenje (FAHP-Entropy-FVIKOR) to model the impact of air pollution as a decision-making problem to address the uncertainty and assess the air quality during the Diwali festival from 2019 to 2021 in Tamil Nadu, India. An integrated weighting approach is utilised to determine the weights of the air pollutants using a fuzzy Analytical Hierarchy Process and Entropy methods. Mainly, the fuzzy VIKOR approach is employed to rank the polluted regions. The validation of the proposed model is established through a comparative analysis using Spearman’s rank correlation with two other existing fuzzy MADM methods. Furthermore, a sensitivity analysis is conducted to evaluate the influence of priority weights and the interdependence of pollutants in determining regional rankings. The results conclude that a strong positive correlation is attained between the proposed and existing methods and the highest levels of air pollution during the festival period are observed in Gandhi Nagar (2019), Rayapuram (2020), T. Nagar, Sowcarpet and Triplicane (2021) in their respective years. These findings substantiate the consistency and effectiveness of the proposed approach.
Introduction
Air pollution is a major global issue, particularly significant in India, where it adversely affects public health and the natural ecosystem. This problem has worsened due to rapid industrialisation, vehicular emissions, burning of agricultural waste, and poor waste management practices [20]. These sources release various pollutants that cause cancer [34], neurological damage [14], DNA damage [27], and immune and respiratory system diseases [10]. Moreover, it can lead to acid rain, harm crops, and adversely affect wildlife [21]. In India, festivals like Bhogi and Diwali significantly contribute to environmental contamination. This study focuses on Diwali, also known as the "Festival of Lights", a highly significant and widely observed event across the country. This festival occurs every year in October or November, signifying the victory of light over darkness and good over evil [6]. During Diwali, celebrants illuminate their homes, temples, and workspaces with oil lamps, candles, lanterns, and firecrackers to create a joyous atmosphere commemorating the occasion. However, the tradition of lighting firecrackers increases air pollutants like sulphur dioxide, nitrogen oxides, particulate matter and other pollutants [29].
The government has implemented measures to alleviate air pollution and identify severely affected regions. In 2015, the Indian government introduced the Air Quality Index (AQI) to prioritise and identify sources of air pollution and areas of utmost concern [4]. Additionally, researchers worldwide have employed numerous mathematical methods to consolidate multiple air pollutants into a single value, providing a concise depiction of air quality. Lin et al. [18] proposed a new multi-pollutant weighted comprehensive air quality assessment method using relative entropy and improved TOPSIS. Ozkaya and Erdin [24] presented the situation of 30 countries and compared them in forest and air quality indicators using the TOPSIS and VIKOR methods. Xu and Chernikov [38] employed an integrated approach called EM-TOPSIS-PROMETHEE for air quality assessment. Zeydan and Pekkaya [40] employed the grey relational analysis method to examine the air pollution index.
Considering that air quality comprises measurements of multiple parameters, the gathered data can have inherent uncertainty. This may not be adequately addressed in traditional calculations. Considering these uncertainties, numerous studies have adopted diverse approaches to evaluate air quality. Kumaravel and Vallinayagam [15] proposed a fuzzy logic controller using triangular membership functions to predict Chennai’s AQI. Dionova et al. [8] introduced an indoor air quality monitoring and controlling system based on a fuzzy logic controller using triangular and trapezoidal membership functions. Chitnis et al. [7] utilised a fuzzy MADM approach to assess the air quality employing six air pollutants in the Vapi area, Gujarat. Suresh et al. [32] analysed the air quality during the covid pandemic using the fuzzy MADM model for three cities in India.
The literature indicates that numerous studies have recognised air quality assessment as a significant fuzzy MADM problem due to its reliance on multiple quality indicators. Fuzzy MADM is an extended approach of MADM by incorporating fuzzy logic into its assessment. Its primary advantage is its ability to integrate multiple attributes in the decision-making process, efficiently manage uncertain data, and provide a more comprehensive solution based on the preference information provided by a single or group of decision makers [17, 42]. Fuzzy MADM encompasses various methods, including the fuzzy AHP, fuzzy TOPSIS, fuzzy PROMETHEE, fuzzy VIKOR, fuzzy ELECTRE, fuzzy CODAS and fuzzy WASPAS among others. These methodologies are applied in various fields involving uncertainties [13].
Akram et al. [1] have proposed a method based on fuzzy ELECTRE IV to address the water supply problem in Iran’s Kermanshah province. The primary objective of the approach is to determine an optimal site for the Kandoleh dam. Issa et al. [12] have applied fuzzy AHP and TOPSIS techniques to prioritise deep excavation support systems. Pamucar et al. [25] have presented an integrated fuzzy MACBETH-D-WASPAS model, offering a solution to the problems of lithium-ion battery management. Phan et al. [26] employed fuzzy VIKOR approach to prioritize the critical barriers to supply chain resilience in Vietnamese small and medium-size enterprises. Hosseini et al. [11] introduced a hybrid decision-making approach based on fuzzy DEMETEL and fuzzy VIKOR methodologies for the purpose of prioritizing action plans as a recovery solution for ecotourism centers in the midst of the COVID-19 outbreak. Sharafi et al. [30] have introduced a novel hybrid fuzzy MADM approach, combining data envelopment analysis with the fuzzy CODAS method for selecting a green supplier. Tushar et al. [36] proposed an integrated framework combining fuzzy AHP and fuzzy PROMETHEE II to tackle the issue of circular supplier selection in the construction industries.
The motivation behind this paper is as follows: Fuzzy Multi-Attribute Decision Making techniques find extensive application across diverse fields. Their adaptation to air quality assessment reveals specific limitations in the systematic data preparation process for effectively addressing the inherent uncertainties associated with air quality evaluation. Converting precise numerical data into fuzzy numbers is particularly crucial, given the significance of air quality assessment in safeguarding public health and the environment.
The main contribution of this study is as follows: To address the gap in the limited application of fuzzy Multi-Attribute Decision Making methods within the field of air quality assessment, the percentage error method is introduced in this paper to construct the triangular fuzzy numbers, which is highly effective in capturing and handling uncertainties inherent in air pollution datasets. The proposed hybrid methodology integrates the fuzzy Analytical Hierarchy Process and Entropy weighting techniques to ascertain the relative significance of each parameter. Furthermore, the fuzzy VIKOR approach categorises geographical areas and pinpoints the most polluted region. This paper outlines these methods and their application in the context of air quality assessment, aiming to contribute to the refinement of methodologies for addressing air quality challenges.
The paper’s structure is as follows: the preliminaries section provides essential definitions, and the study area and data collection section outline the considered alternatives, attributes, and statistical data. The methodology section details the algorithms of the employed methods. The findings are summarized in the results and discussion section and the article concludes in the final section.
Preliminaries
The Preliminaries section of the paper encompasses primary definitions and essential concepts necessary for the study.
Fuzzy set theory [43]
Lotfi Zadeh [39] introduced the fuzzy set theory, a mathematical theory that aims to capture and represent human cognitive processes imprecise or vague nature. Let X be the universe of discourse, X = {x1, x2, …, x
n
}, a fuzzy set
Fuzzy numbers [43]
A fuzzy number there exists exactly one x0 in R with
In fuzzy set theory, triangular and trapezoidal fuzzy numbers are two commonly used fuzzy numbers. These fuzzy numbers are widely utilised both in theoretical studies and practical applications. While both triangular and trapezoidal fuzzy numbers have their uses, triangular fuzzy numbers are often considered more convenient in application due to their simplicity in the calculation.
Triangular fuzzy number [5]
Let
Percentage error method [16]
The process of fuzzy data transformation entails constructing a triangular fuzzy number through the percentage error method. Based upon a 95% confidence interval, solely the distribution exhibiting a 5% or less dispersion is considered the optimal choice. The triangular fuzzy number generated via the percentage error method can be acquired from,
Fuzzy operation [22]
The mathematical operations on triangular fuzzy numbers
Defuzzification [2]
A vital step in fuzzy modelling and fuzzy multi-attribute decision making is the procedure of defuzzification. Various techniques for defuzzification are available, including the mean of maxima, the centre of area and α-cut. The fuzzy numbers are defuzzified in this study using the centre of area method. For the triangular fuzzy number,
Study area and data collection
This research intends to estimate the air quality and determination of the most polluted area during the Diwali festival, specifically in the 26 regions of Tamil Nadu, India, shown in Table 1, and the ambient air pollutants sulphur dioxide (SO2), nitrogen dioxide (NO2), and particulate matter (PM10 microns ≤10 μg ∖ m3 and PM2.5 microns ≤2.5 μg ∖ m3) have been selected as the attribute to evaluate the air quality using the proposed model.
The considered areas of Tamil Nadu during the Diwali festival
The considered areas of Tamil Nadu during the Diwali festival
The concentration of these pollutants during the Diwali festival from 2019 to 2021 was procured from the Tamil Nadu Pollution Control Board (TNPCB) in Chennai [33]. The data distribution for the four contaminants is presented in Fig. 1.
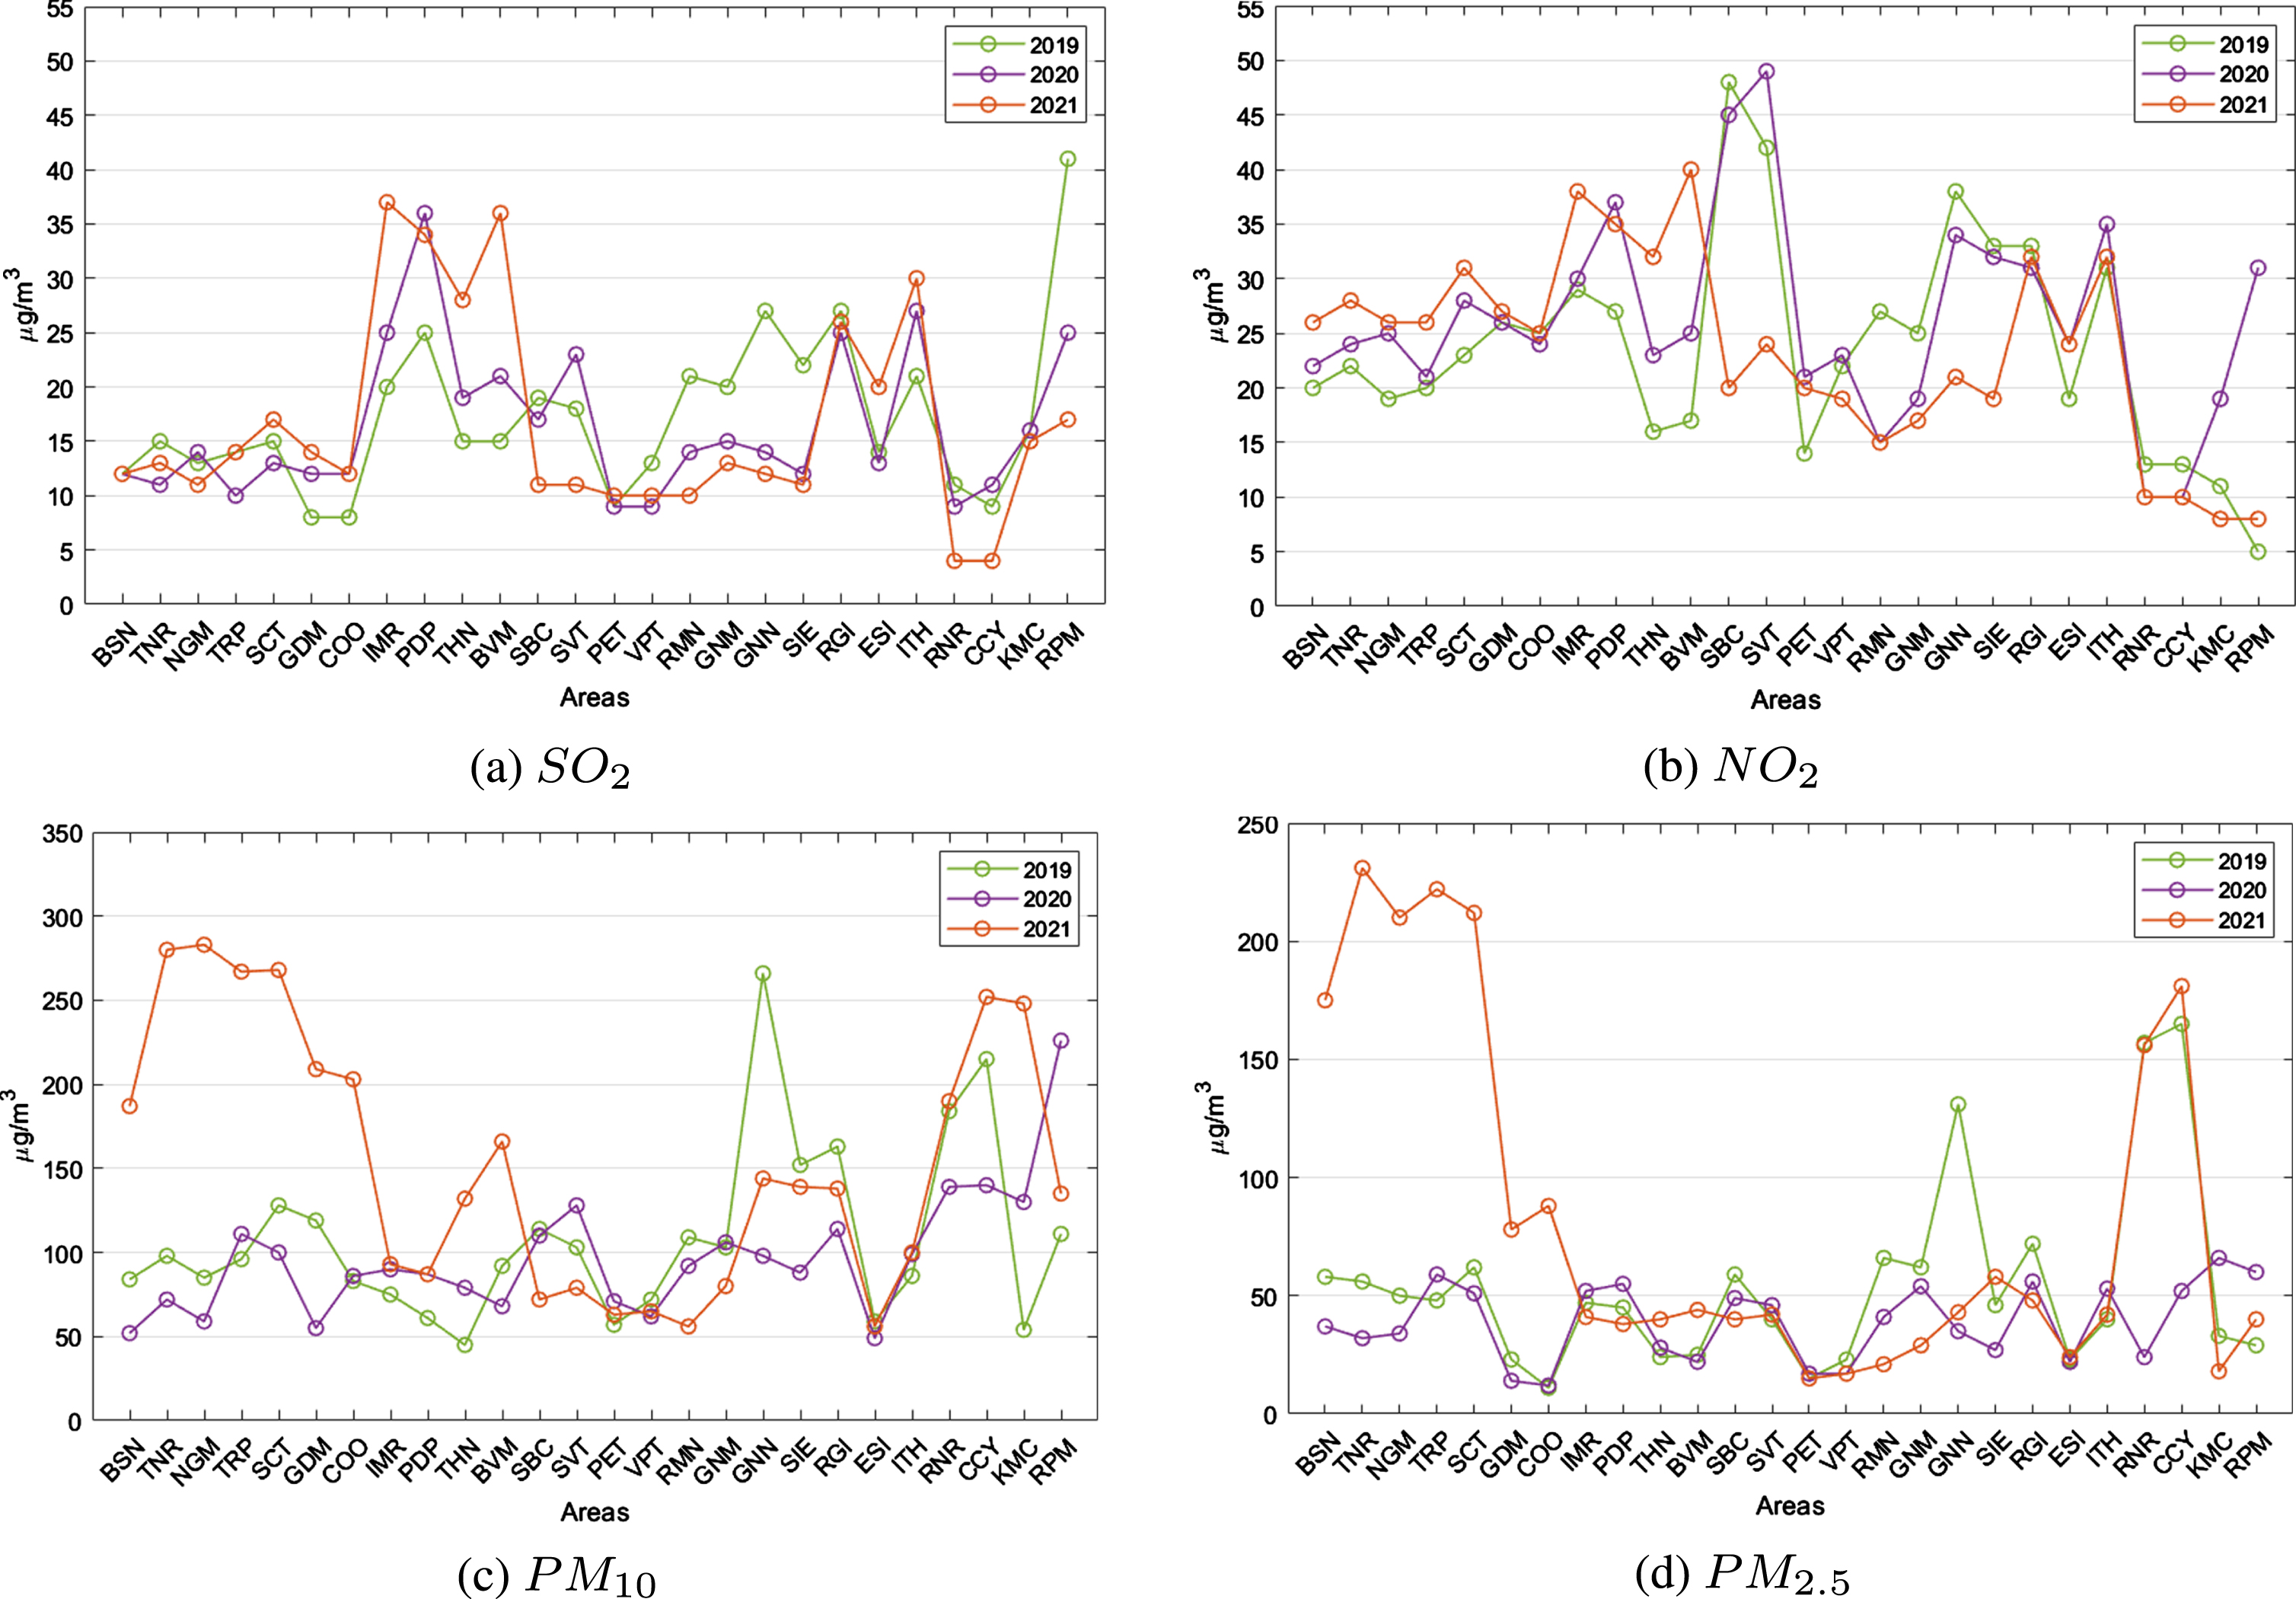
Data distribution of each pollutant.
Descriptive statistics of the pollutant studied in the community of Tamil Nadu, India have been carried out. Table 2 shows a statistical summary of these data, including measures of central tendency and variability in the form.
Summary statistics of the air pollutants concentrations
The maximum concentration values of SO2 and NO2 in 2019, 2020, and 2021 were within the permissible limits, with values ranging from 36 μg ∖ m3 to 49 μg ∖ m3. However, all three years exceeded the average daily limit of 100 μg ∖ m3 for PM10, with maximum values ranging from 226 μg ∖ m3 to 283 μg ∖ m3. Similarly, all three years exceeded the average limit of 60 μg ∖ m3 for PM2.5, with maximum values ranging from 66 μg ∖ m3 to 231 μg ∖ m3. It is worth noting that large standard deviations were found for PM10 in all years, indicating significant variations in the concentration levels within the studied regions. Additionally, the coefficient of variation for PM2.5 was higher in 2019 and 2021, suggesting more variability in the concentration levels of this pollutant during those years. Furthermore, the skewness values indicate the distribution characteristics of the contaminants. PM2.5 exhibited higher skewness values in 2019 and 2021, indicating a skewed distribution. PM10 showed higher skewness in 2020. These observations highlight the elevated levels of particulate matter, specifically PM10 and PM2.5, during the Diwali festival period. The results emphasise the need for effective measures to reduce and control particulate matter pollution, as it poses a significant health risk to the population.
We propose a hybrid approach that combines the FAHP and Entropy weighting techniques to prioritise the attributes (parameters) in the decision-making process. Then, we use the FVIKOR method to evaluate and rank the alternatives (areas) and to identify the most polluted region. The flowchart in Fig. 2 presents the methodology of the proposed FAHP-Entropy-FVIKOR model.
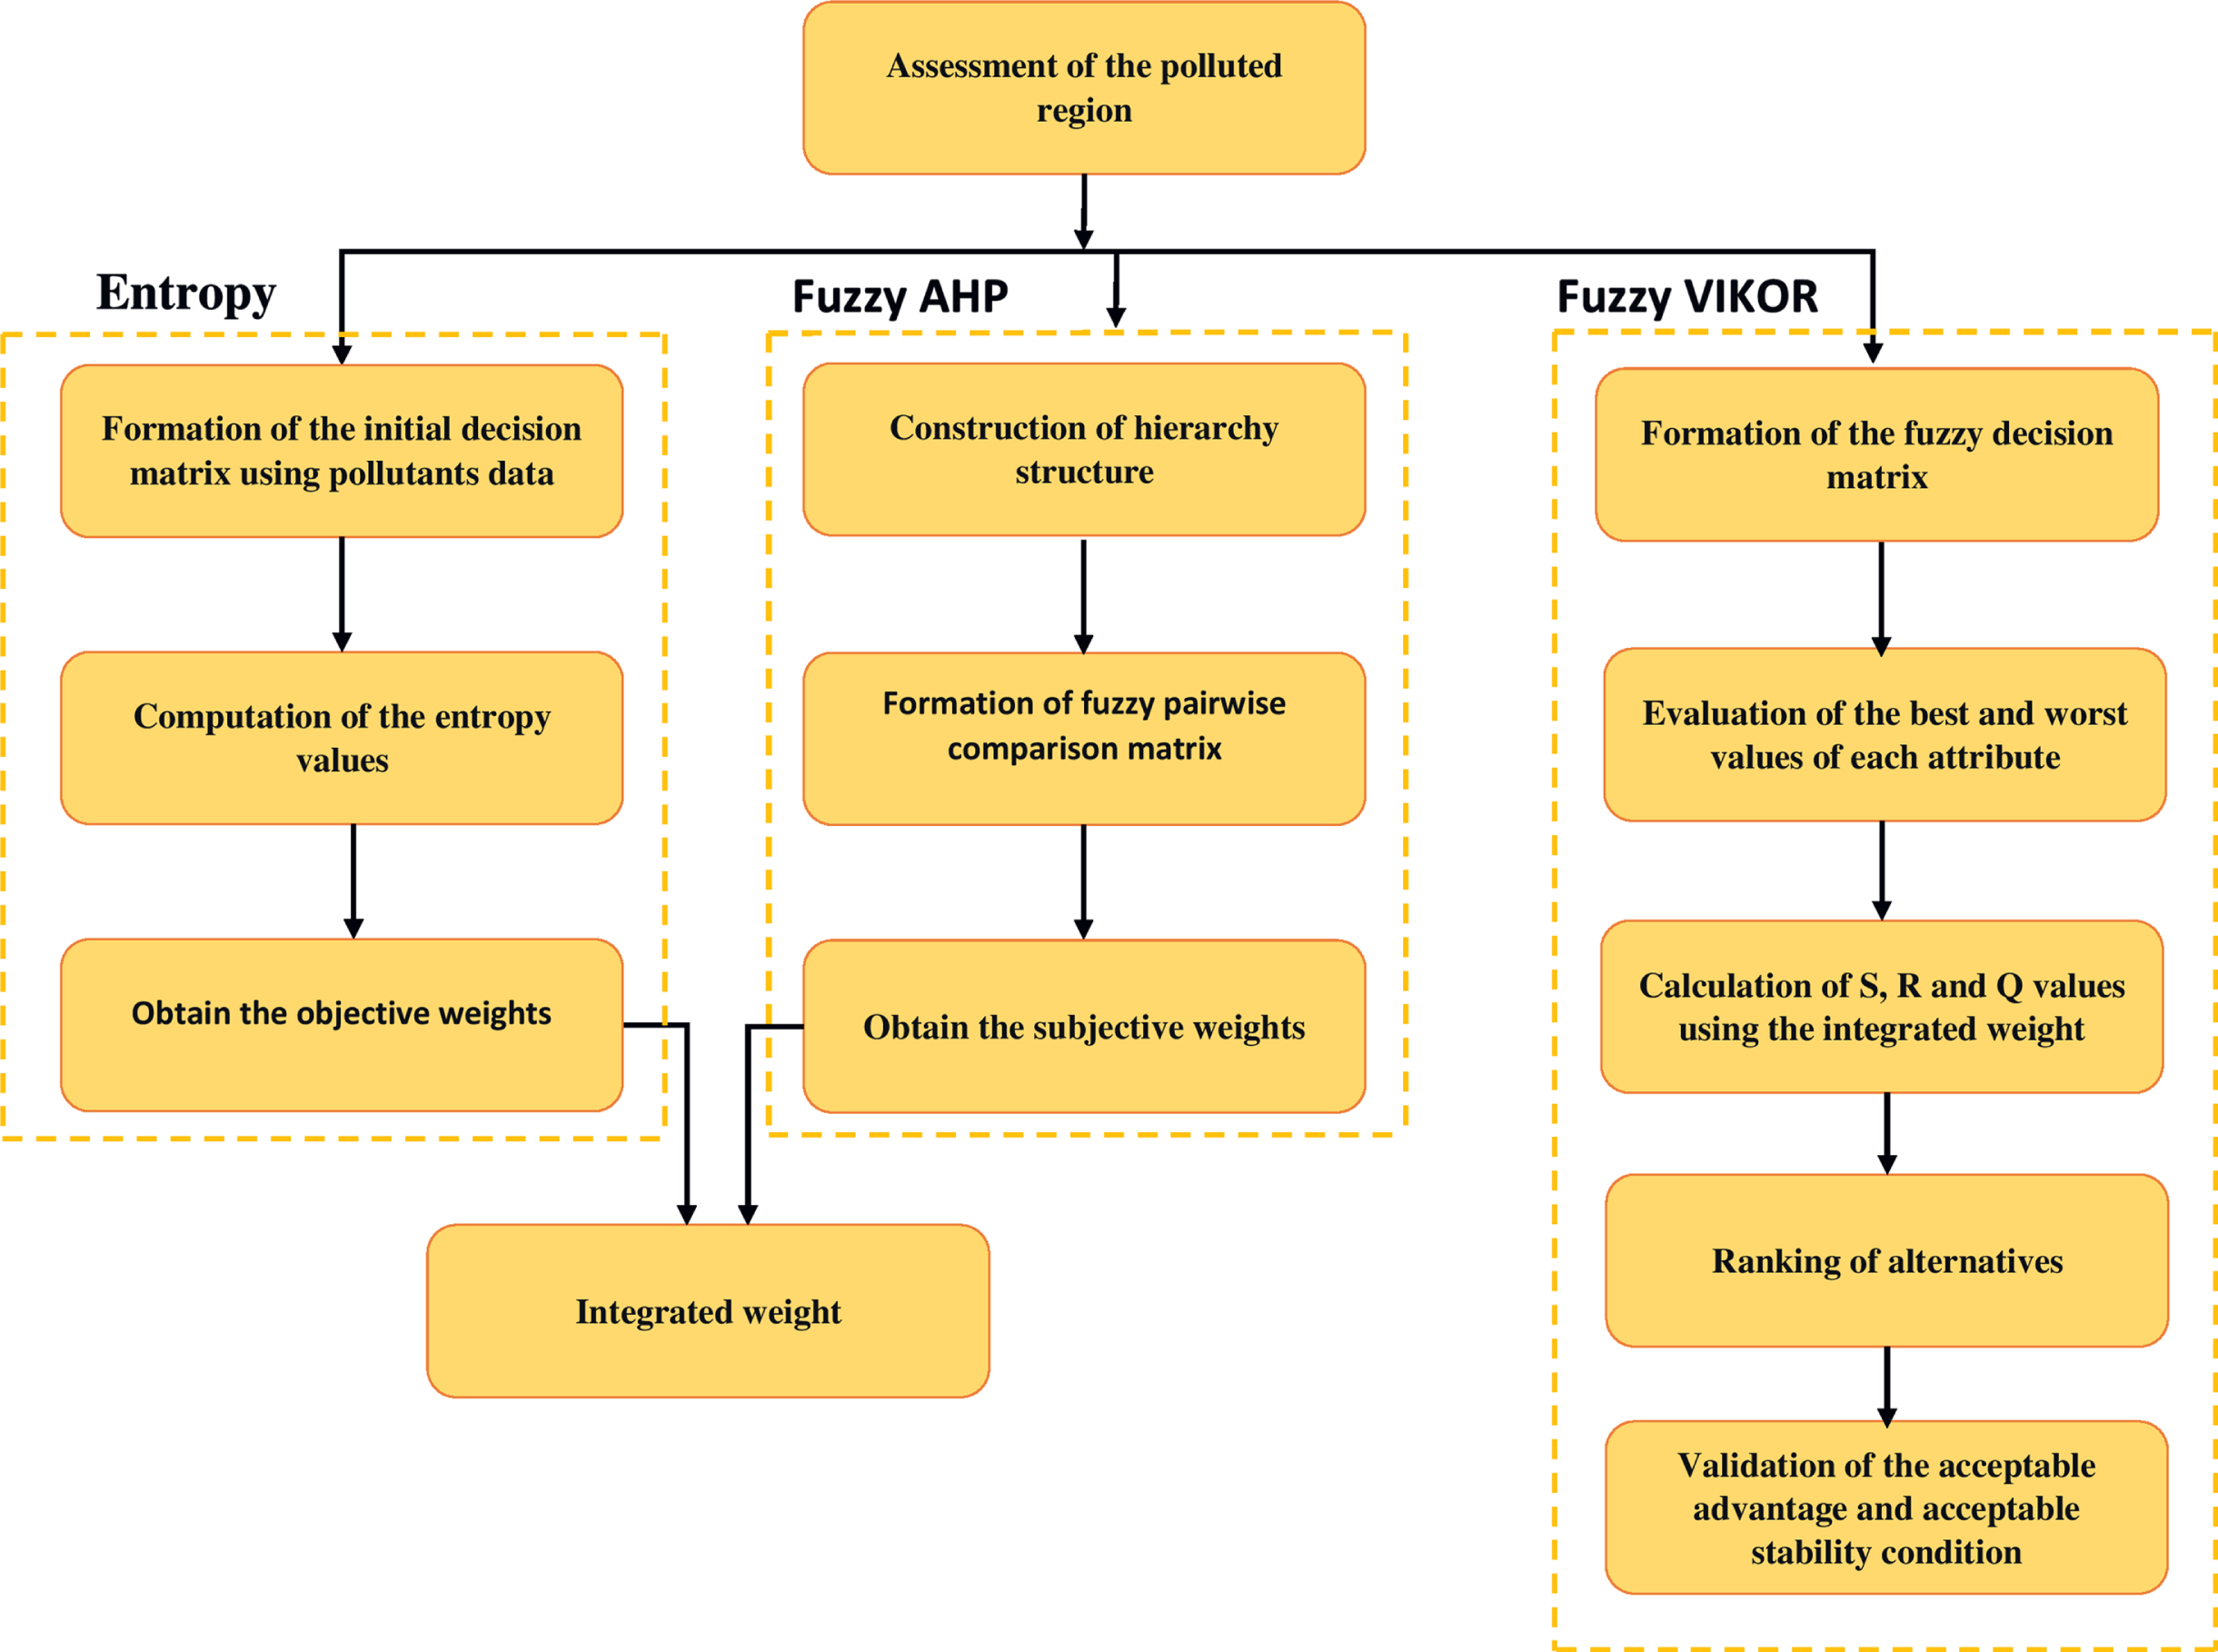
FAHP-Entropy-FVIKOR Model.
In real-world problems, the information regarding attribute weights may be either unknown or only partially known, leading to an incomplete problem [19]. In this study, the weights of the attributes are determined using standard weighting approaches, namely the FAHP and Entropy methods. These approaches provide systematic ways to assign attribute weights based on expert opinion and alternative data.
FAHP
The FAHP is an extension of the Analytic Hierarchy Process (AHP) developed by Saaty. AHP is widely used in various multi attribute decision making problems [28]. However, AHP does not inherently account for vagueness in personal judgments. To address this limitation, the FAHP incorporates fuzzy logic to handle ambiguity in decision-making. Buckley’s method [3] is utilised to determine the relative importance weights for attributes. The procedure follows these steps:
Linguistic expressions and their corresponding triangular fuzzy values
Linguistic expressions and their corresponding triangular fuzzy values
The pairwise comparison matrix is presented in Equation (1), where
The Entropy method, proposed by Shannon [31], is utilised as an objective weighting approach to determine the relative importance of different attributes. The algorithm for the Entropy method is as follows:
In this study, the weight preference factor φ is employed to combine the objective and subjective weights and generate the comprehensive weight w
j
of the j
th
attribute.
VIKOR is a robust technique to address MADM problems involving diverse alternatives and conflicting attributes. To address the challenges of uncertainty and inconsistency, FVIKOR was introduced [23]. The algorithm for FVIKOR is outlined as follows:
After gaining
C1: Acceptable advantage:
C2: Acceptable stability in decision-making:
The alternative A1 must also be the best ranked according to S or/and R.
If one of the conditions is not satisfied, then a set of compromise solutions is proposed, which consists of the following: The alternatives A1 and A2 if only the condition 2 is not satisfied. The set of alternatives A1, A2, … A
p
if condition 1 is false; A
p
is determined by Q (A
p
) - Q (A1) < DQ.
To identify the most polluted region in Tamil Nadu based on air pollutant concentrations, a FAHP-Entropy-FVIKOR model was implemented. The fuzzy Analytic Hierarchy Process was utilised to determine the subjective weights of the attributes through pairwise comparisons. The resulting weights are α j = [0.120 0.056 0.267 0.557]. Based on the Entropy methodology, the normalisation process, entropy value and the degree of diversification are determined using Equations (6)-(8). The relationship between the entropy value and the entropy weight is the maximum entropy value attains minimum entropy weight and minimum entropy value reaches maximum entropy weight. The objective weight β j of each attribute obtained using Equation (9), shown in Table 4.
Obtained entropy weights of the attributes
Obtained entropy weights of the attributes
A comprehensive weighting approach is adopted to derive more moderate weights, incorporating the FAHP and Entropy methods. The final weights w j as calculated by Equation (10), are presented in Table 5 under φ = 0.5.
Final weights of the attributes
In the next step, the crisp data is transformed to triangular fuzzy number using the percentage error method. Using the transformed fuzzy data the fuzzy best
Fuzzy best and worst value of each attribute
Fuzzy worst value of each attribute
The normalised fuzzy difference
Ranks of the FVIKOR parameters
Upon verification of the conditions, it can be concluded that the alternatives met the requirements for acceptable advantage and stability in 2019 and 2020. As a result, Gandhi Nagar and Rayapuram were ranked as the most contaminated regions in their respective years. However, in 2021, although the acceptable stability condition was met, the acceptable advantage condition was not. Consequently, among the alternatives, T. Nagar, Sowcarpet, and Triplicane were identified as the most polluted areas. Pettai was the least contaminated area in 2019 and 2021, while Collectorate Office was the least polluted area in 2020. The results showed that the rankings of these twenty-six areas slightly differed from the TNPCB results, which were based on the breakpoint concentration of pollutants and obtained through the maximum aggregation operator. The results of TNPCB is illustrated in Fig. 3.
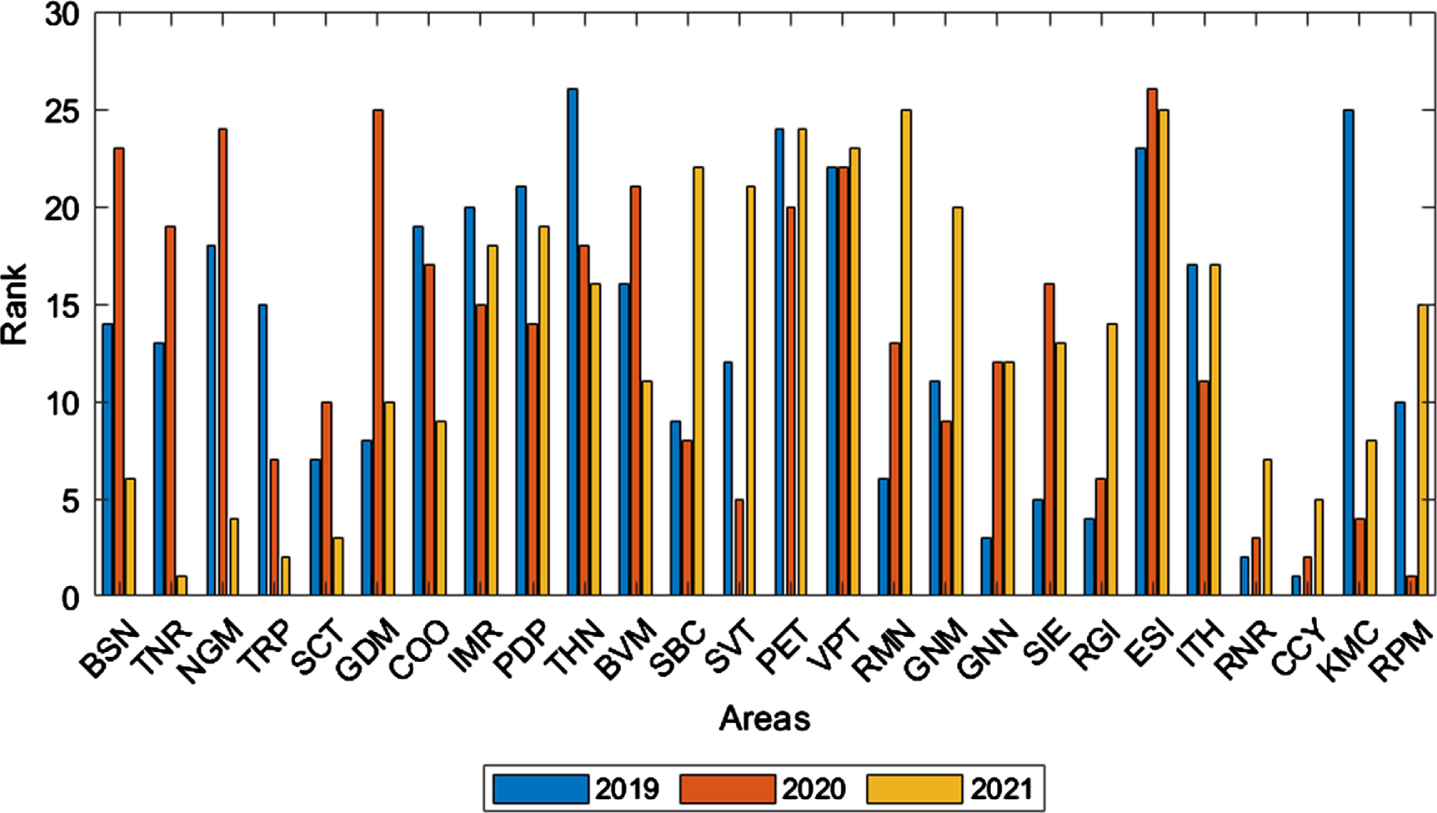
TNPCB Ranking.
According to the TNPCB results, Cellisini Colony, Rayapuram, and T. Nagar were the most polluted areas in 2019, 2020 and 2021, respectively. On the other hand, Thirunagar, ESI Hospital, and Ramalinga Nagar were found to be the least contaminated areas in the same respective years. It is observed that the results obtained from the FAHP-Entropy-FVIKOR method align with the TNPCB findings regarding the most polluted area.
In order to validate the proposed methodology, this study compares the FVIKOR approach with two established fuzzy MADM techniques: fuzzy Combinative Distance based Assessment (FCODAS) [9] and fuzzy Weighted Aggregated Sum Product Assessment (FWASPAS) [35]. All methods are applied to the same dataset to rank the areas and identify the most polluted area in Tamil Nadu. The results of these ranking methods are presented in Table 9.
Ranking of FCODAS and FWASPAS
Ranking of FCODAS and FWASPAS
According to the results obtained from Table 9, the FCODAS and FWASPAS methods resulted in Cellisini Colony, Rayapuram, and T. Nagar being among the top-ranked areas among the twenty-six regions in Tamil Nadu. In 2019, Pettai was identified as the least polluted area based on the FCODAS method, while the FWASPAS method ranked Collectorate Office as the least polluted area. Similarly, in 2020, Gowndampalayam obtained the least polluted area status according to the FCODAS and FWASPAS methods. Finally, in 2021, both methods ranked Pettai again as the least polluted area. The most polluted ranks obtained from FCODAS and FWASPAS for the years 2019-2021 are the same as the proposed method. The comparison of these ranks is presented in Fig. 4.
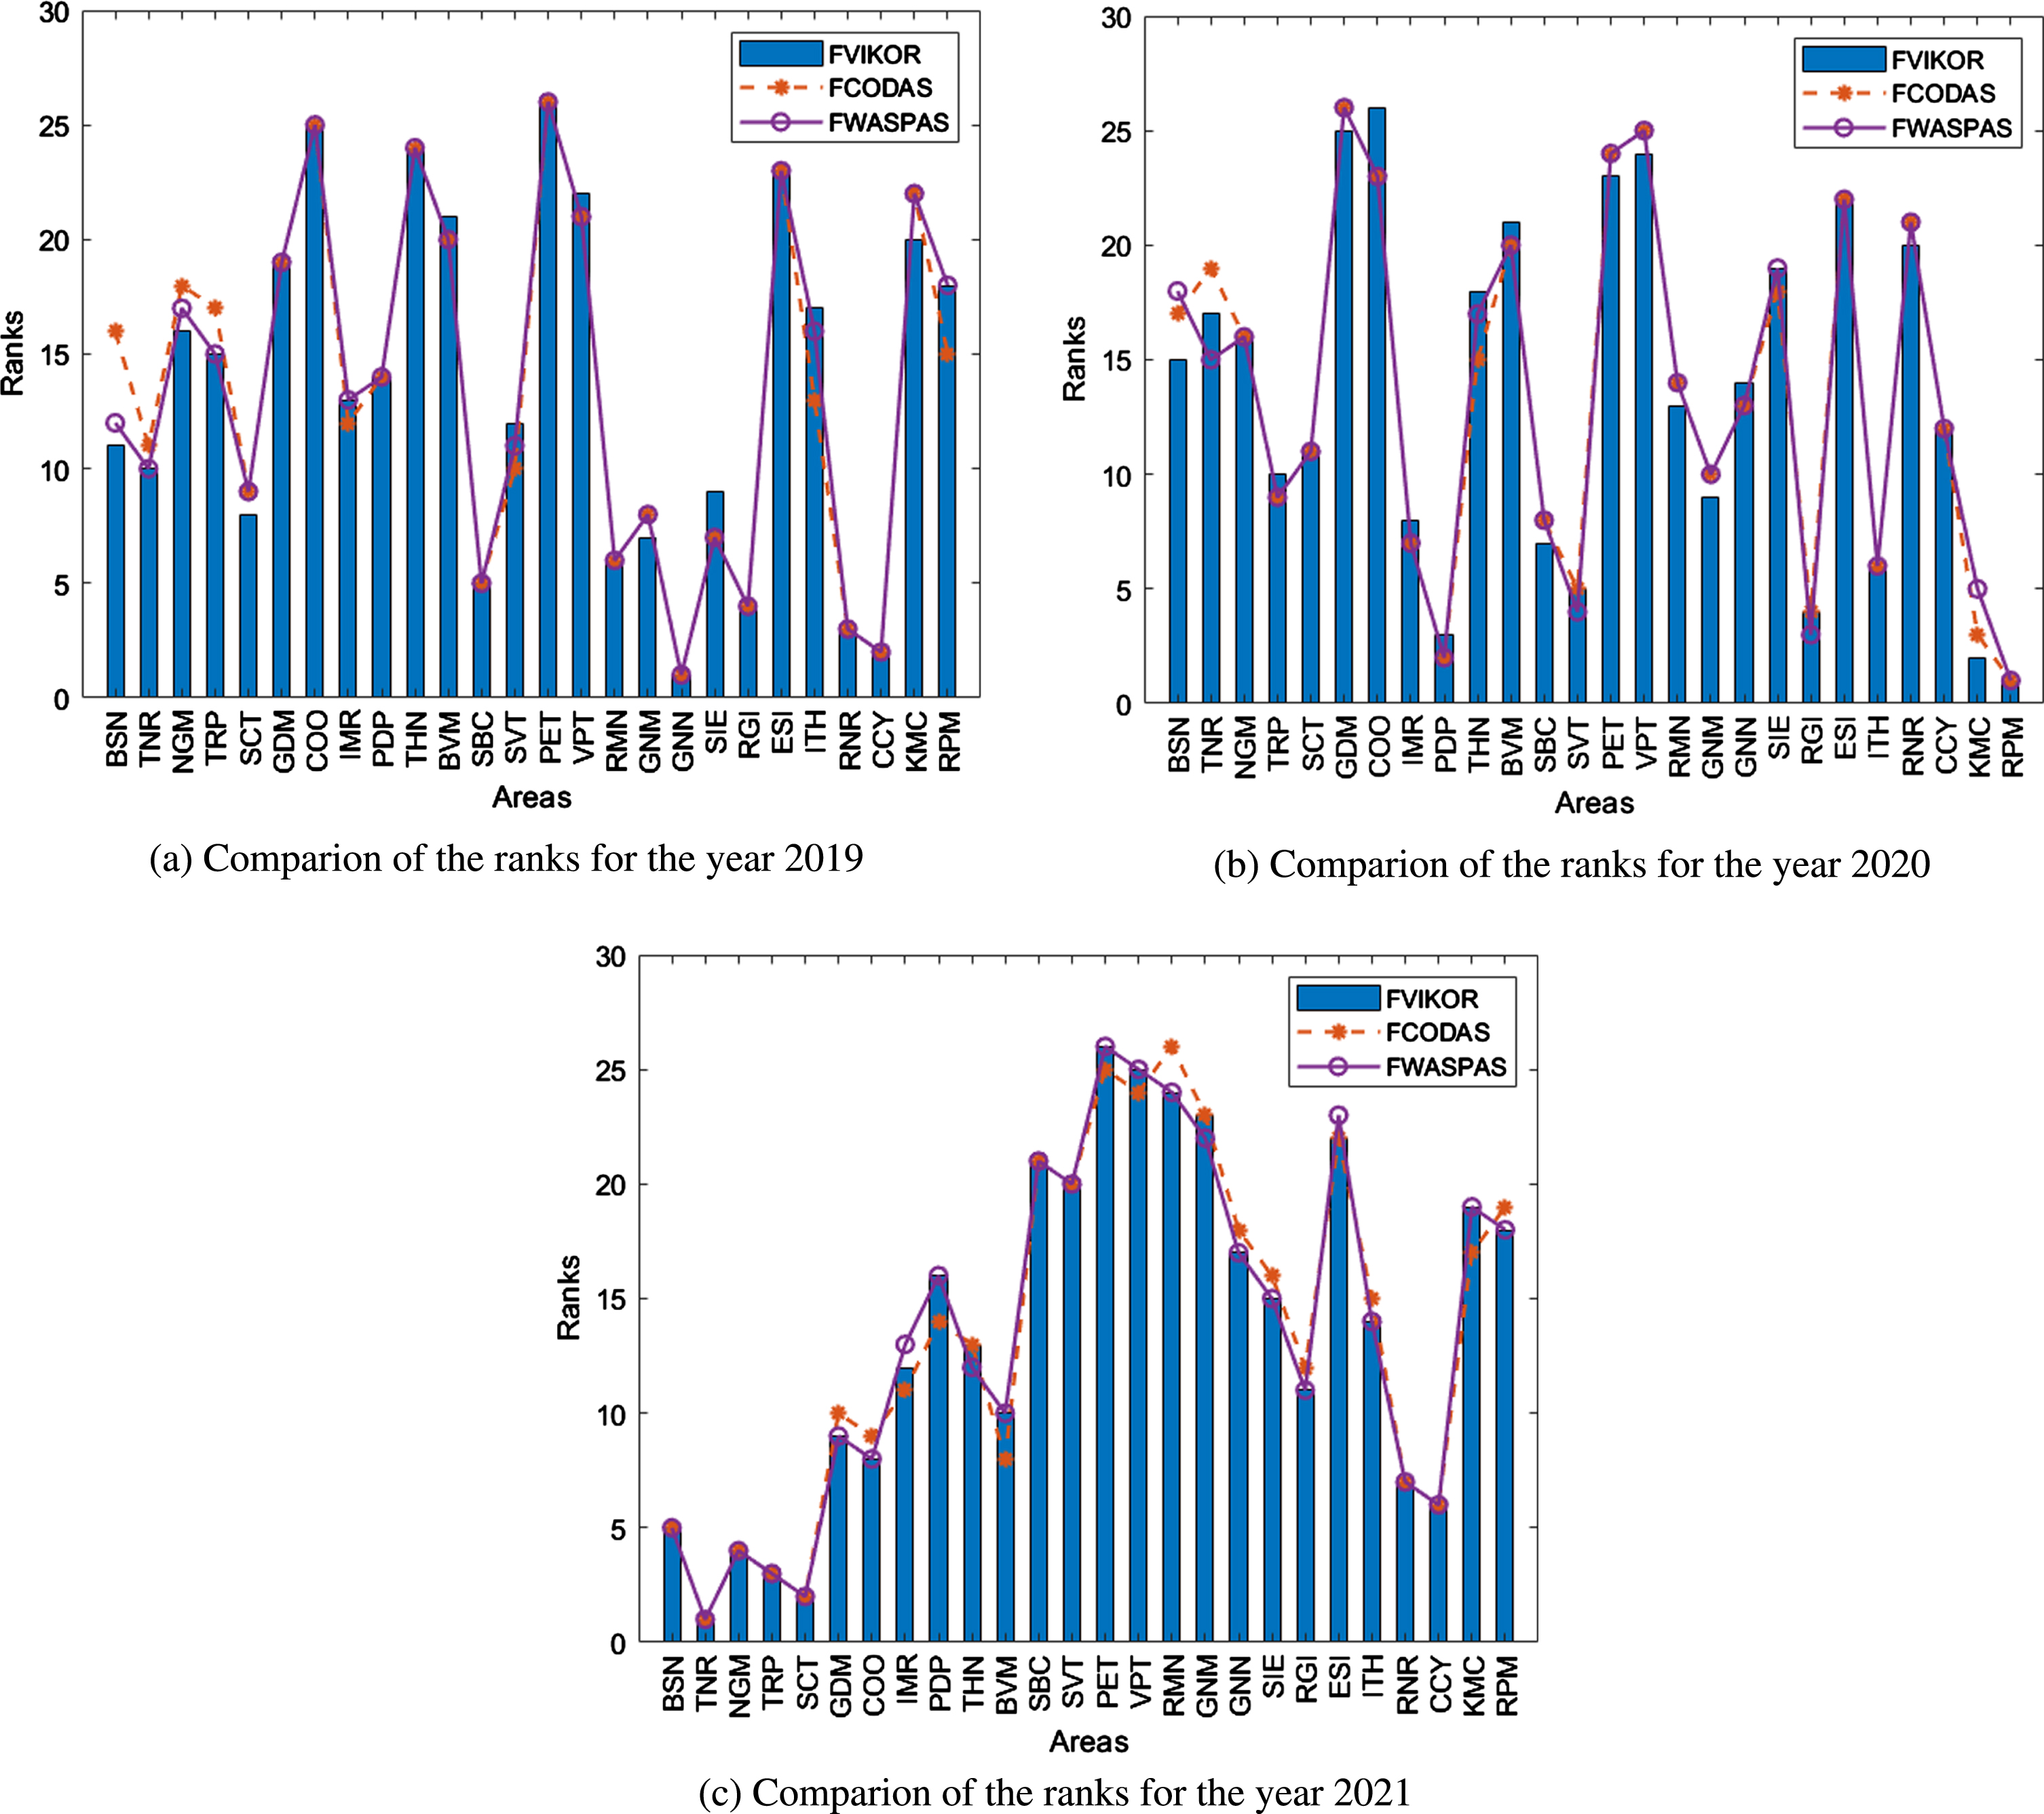
Comparative ranks of FVIKOR with FCODAS and FWASPAS methods.
Figure 4 presents a comparison of the ranks obtained by the FVIKOR method against two alternative approaches, FCODAS and FWASPAS, to assess their performance and effectiveness in ranking various areas. The results for the years 2019 and 2021 show that the FVIKOR method precisely matched rankings in 12 areas compared to the FCODAS approach. Moreover, in 2020, the FVIKOR method achieved identical rankings in 8 specified areas when compared to FCODAS. Similarly, concerning the FWASPAS method, the FVIKOR rankings coincided with FWASPAS in 16 areas for 2019, 7 areas for 2020, and 22 areas for 2021, indicating considerable consistency across different periods. This substantial consistency in rankings highlights the potential of the FVIKOR method. It is important to note slight variations in rankings when comparing the FVIKOR method to the other two approaches. To verify the accuracy of the FVIKOR method, it is essential to perform an evaluation using appropriate statistical tools.
A statistical test called Spearman’s rank correlation test is employed to assess the correlation between the rankings obtained from the FVIKOR approach and the rankings from FCODAS and FWASPAS. Spearman’s coefficient (ρ) is calculated to determine the significance of the correlation between two or more rankings. Given two ranking datasets (A1 and A2), ρ is calculated using the equation.
The correlation between the FVIKOR approach and the FCODAS and FWASPAS methods is determined using Equation (18). In the year 2019, Spearman’s rank correlation between the FVIKOR approach and FCODAS is 0.999, and with FWASPAS, it is 0.997. In the year 2020, the correlation with FCODAS is 0.999, and with FWASPAS, it is 0.988. In the year 2021, the correlation with FCODAS is 0.999, and with FWASPAS, it is 0.999. These values indicate a strong positive correlation between the proposed method and the other two fuzzy MADM methods.
In the present study, a sensitivity analysis is conducted to assess the influence of priority weights on the ranking of regions and to identify the impact of a specific air pollutant on air quality. The sensitivity analysis comprises two scenarios: The priority weights have changed. Reduction of pollutants
Scenario 1
This scenario presents the changes in the weights of the attributes and the comparison between the 2 cases: By applying a combined FAHP-Entropy approach. Equal weights are considered for all attributes.
Figure 5 illustrates the variation in area rankings when applying the FAHP-Entropy approach compared to the equal weight approach. It can be observed that there are significant changes in the rankings of the areas when equal weights are used across the years. In 2019, the rankings of all areas, except for Triplicane, Imperial Road, Pudupalayam, and Pettai, were altered. Similarly, in 2020, only Gandhi Market, ESI Hospital, and Rayapuram maintained their original ranks, while the ranks of other areas were modified. In 2021, Nungambakkam, Triplicane, Saradha Balamandhir School, and umaran Complex retained the same rank, but the rankings of the remaining areas were altered when employing the equal weight approach.
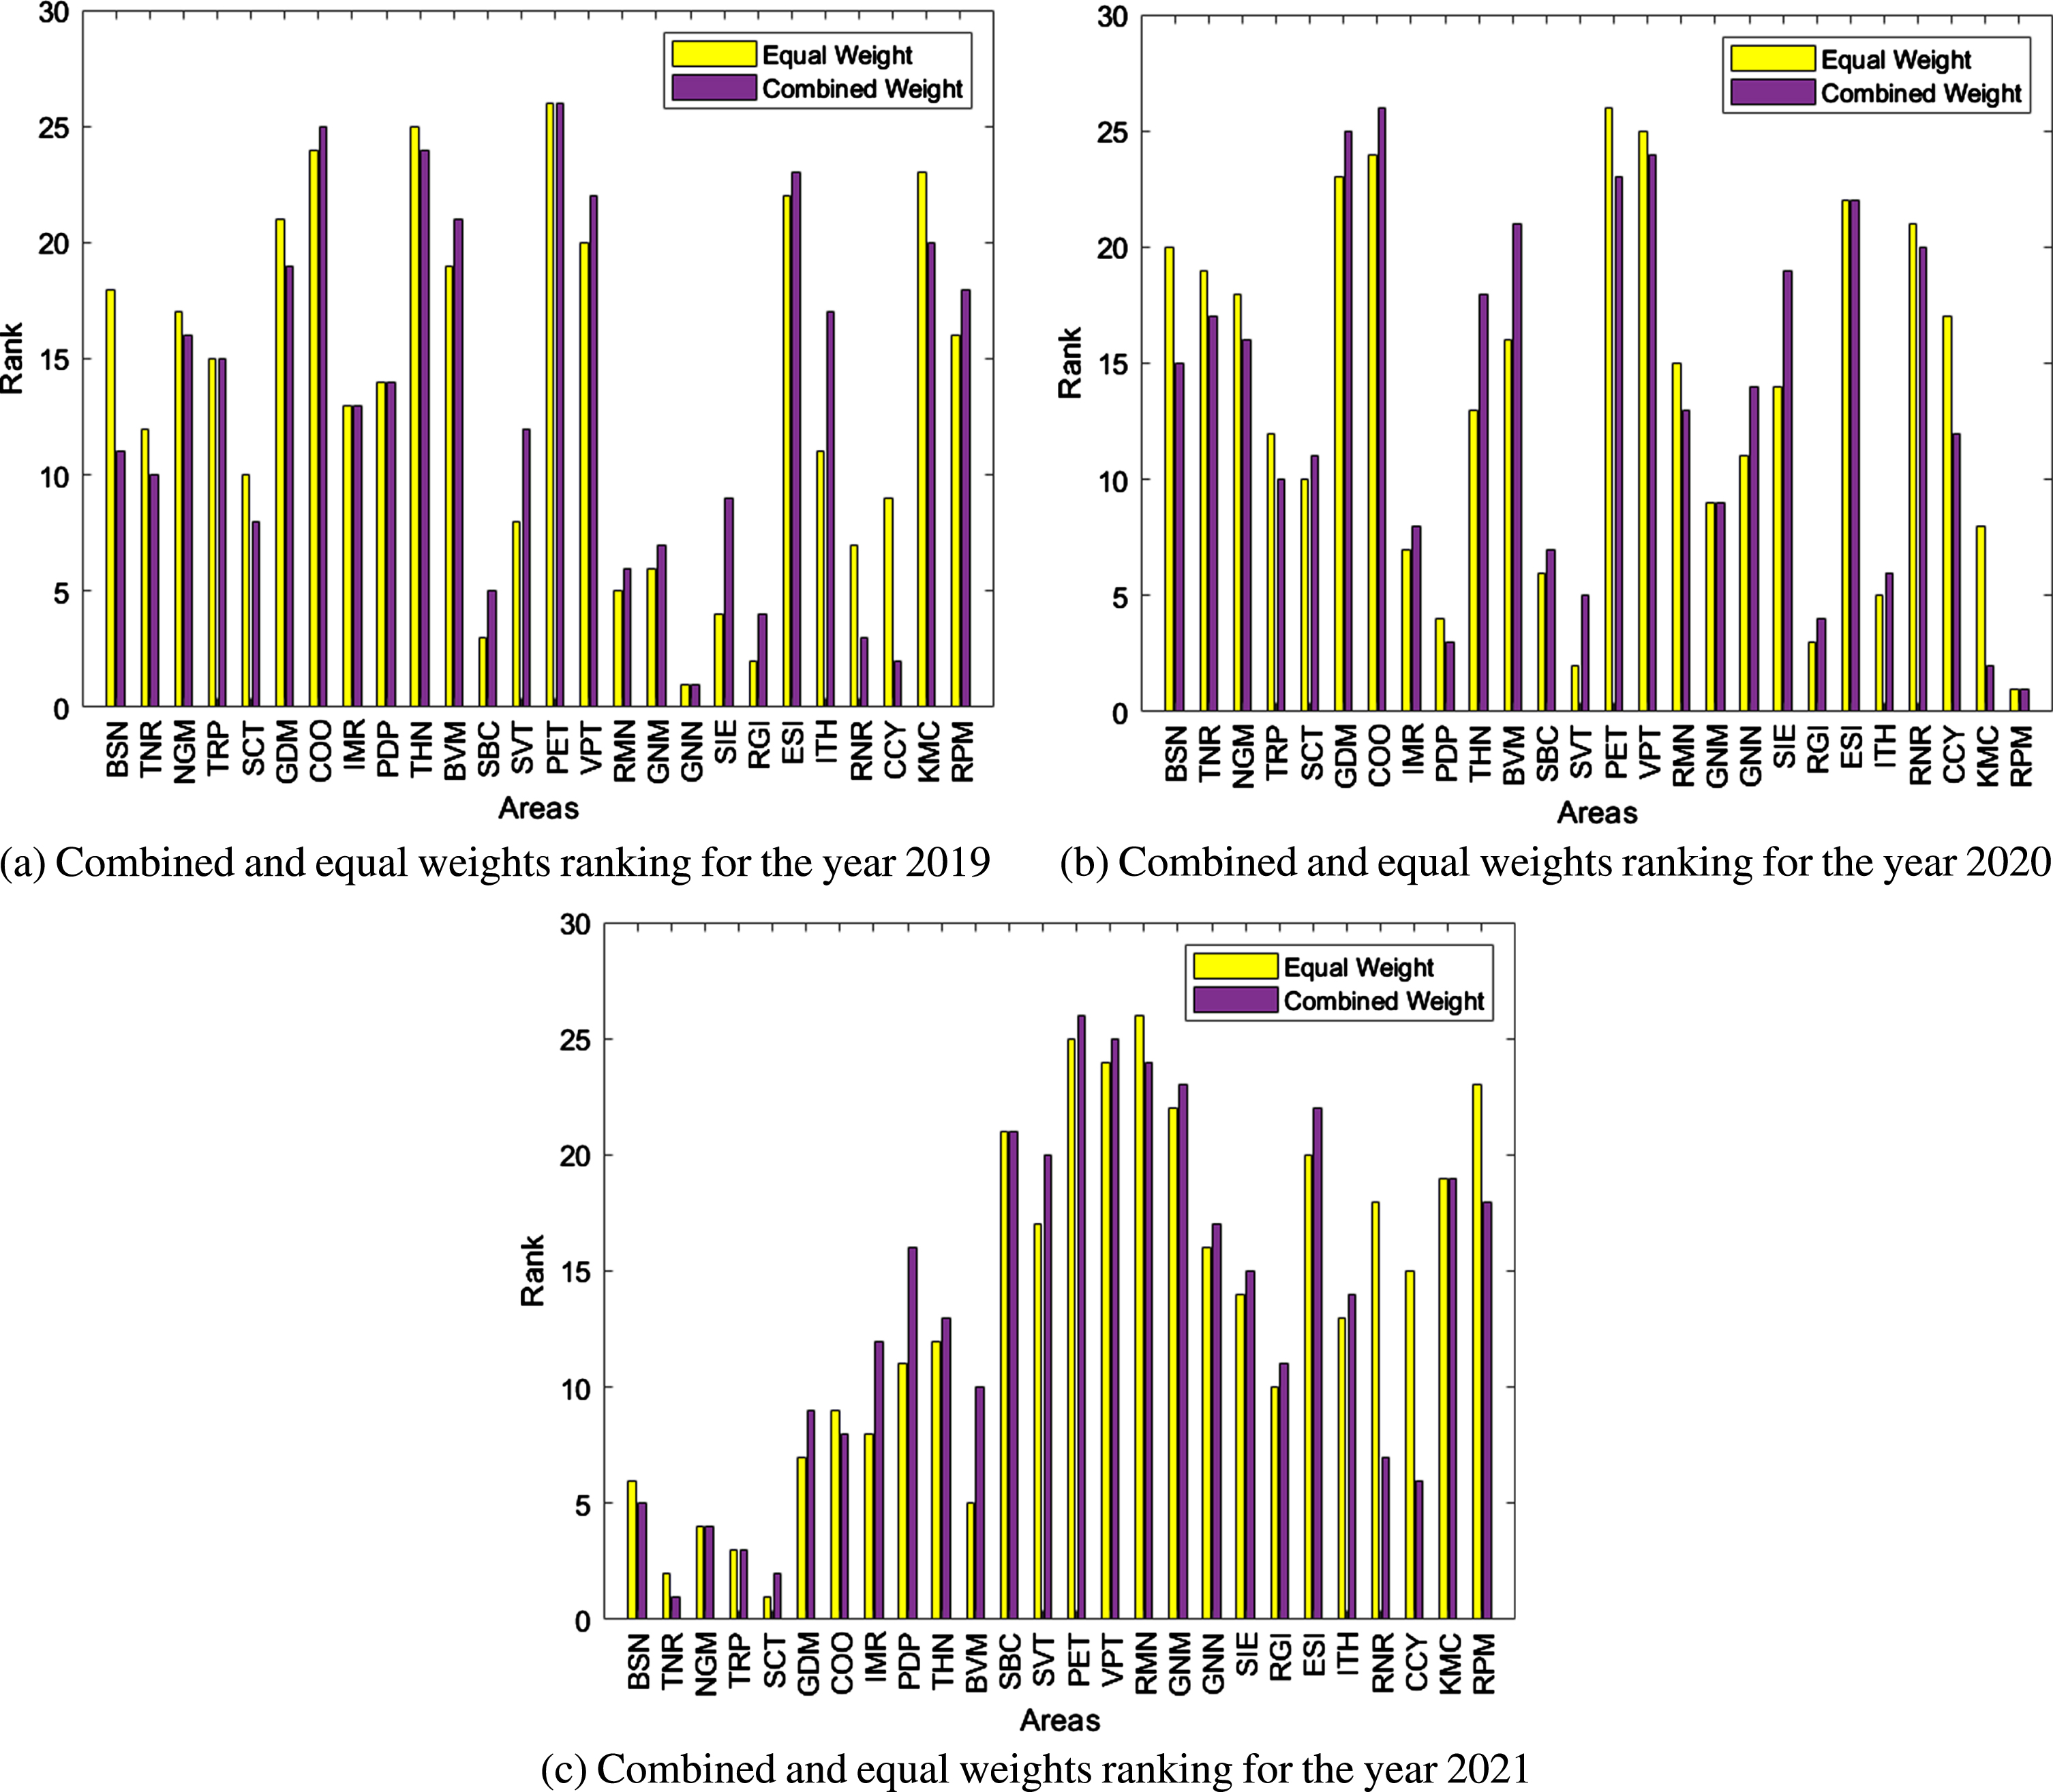
Sensitivity analysis for scenario 1.
In scenario 1, it is emphasised that assigning appropriate weights to the pollutants is crucial when determining the most polluted region. Since air pollution consists of multiple pollutants with varying concentrations, accurately evaluating the weights of these pollutants becomes essential. This ensures that the impact of each pollutant is adequately considered in the decision-making process, leading to a more accurate identification of the most polluted region.
The sensitivity analysis conducted in this study investigates the impact of individual air pollutants on the ranking of contaminated places. Each pollutant is removed one at a time, and the resulting changes in the ranking of the areas are observed. This analysis helps identify the pollutant that significantly influences air quality and determines how its removal affects the ranking of regions.
In this particular study, the pollutants are eliminated in the following sequence: SO2 is eliminated first, followed by NO2, then PM10, and finally PM2.5. The resulting changes in the ranking of areas after removing each pollutant are depicted in Fig. 6. This analysis provides valuable insights into the relative importance of different pollutants and their impact on the overall ranking of contaminated places.
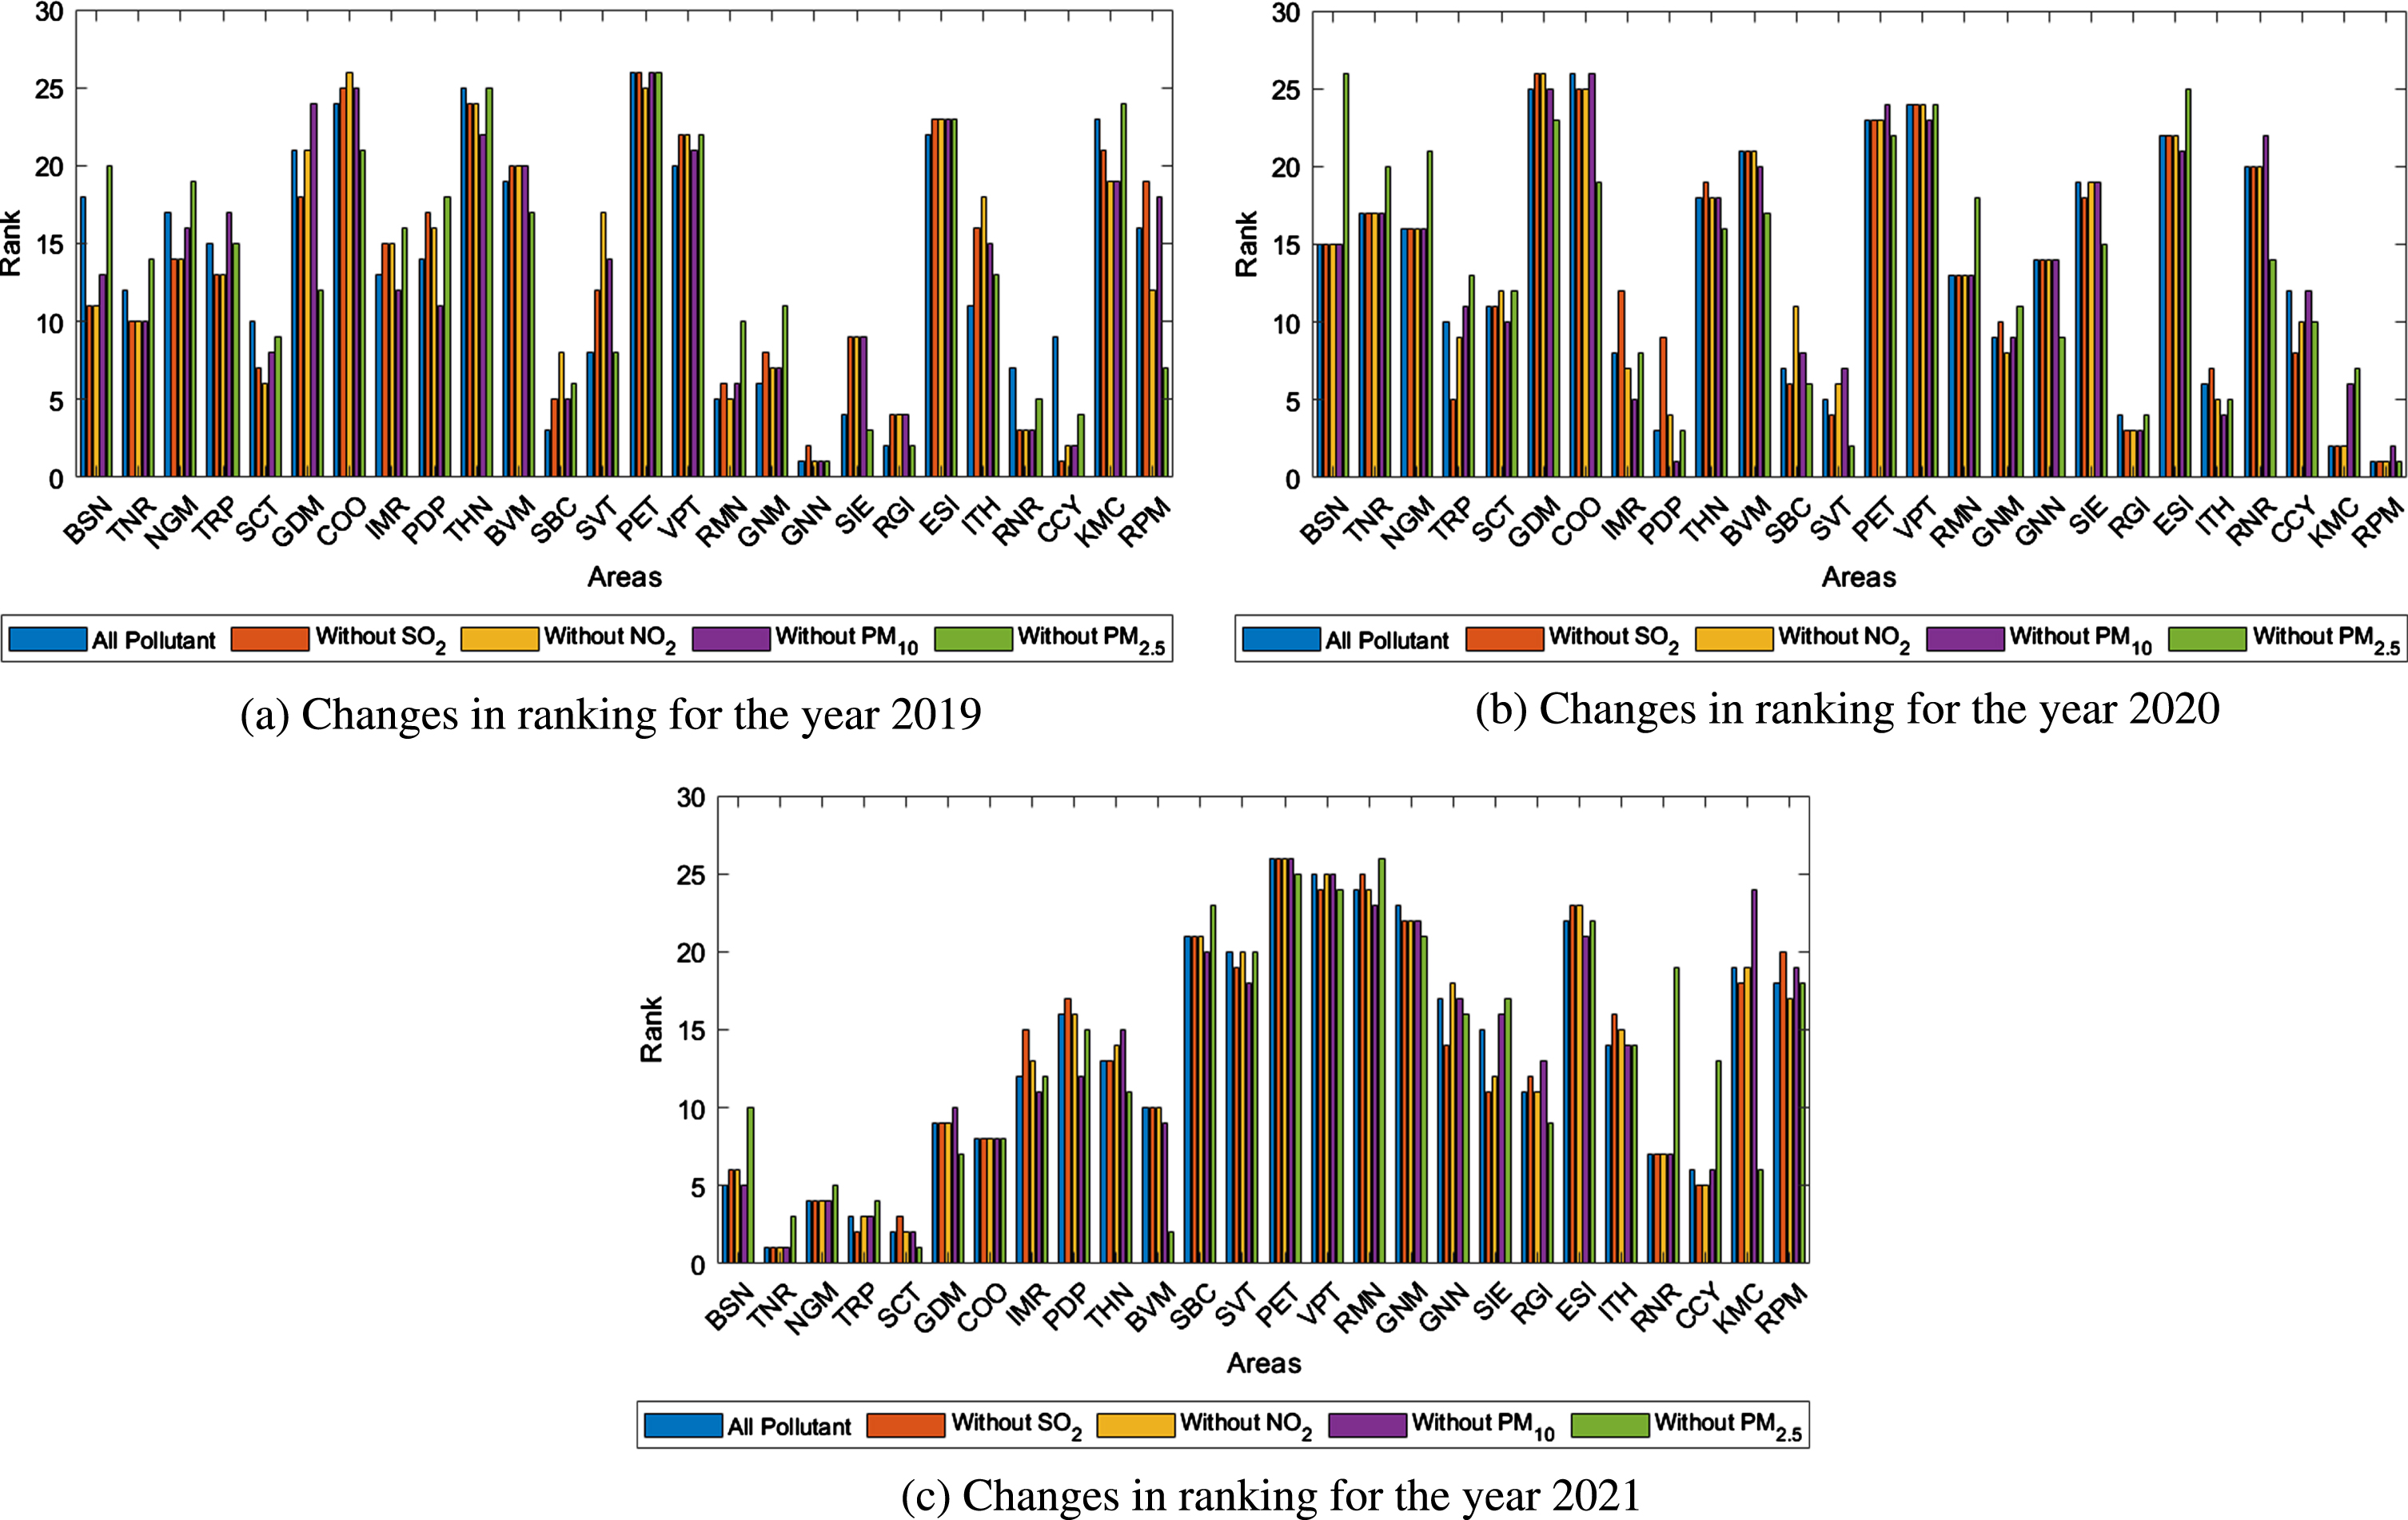
Sensitivity analysis for scenario 2.
In this scenario, the sensitivity analysis focuses on the impact of each pollutant on the ranking of contaminated areas. By eliminating each pollutant one by one SO2, NO2, PM10 and PM2.5, the changes in the ranking of limited areas are observed. It is observed that the elimination of SO2, NO2, PM10 affects the ranks of some areas, but the removal of PM2.5 causes a significant change in the ranks across the years.
This sensitivity analysis indicates that PM2.5 has a substantial impact on the ranking of the most polluted areas. Therefore, to improve the air quality in these areas, it is crucial to focus on reducing the sources that emit PM2.5. By targeting and reducing PM2.5 emissions, significant improvements can be made in the air quality of these regions.
Using the FAHP-Entropy-FVIKOR model, this study identified the most polluted area during the Diwali festival from 2019 to 2021 in Tamil Nadu, India. Four pollutants were considered, and their weights were determined using the FAHP and Entropy methods combined. The areas are ranked using the FVIKOR method. By integrating these techniques, the study aims to provide a robust and systematic framework for air quality assessment, effectively identifying the most polluted region and prioritising necessary interventions or mitigation strategies.
The results indicated that Gandhi Nagar in Vellore and Rayapuram in Tiruppur were the most polluted in 2019 and 2020, respectively. However, due to failed conditions of acceptable advantage in 2021, T. Nagar, Sowcarpet, and Triplicane in Chennai were the most contaminated areas that year. Validation through Spearman’s rank correlation with other fuzzy MADM approaches, FCODAS and FWASPAS demonstrated consistency and strong correlation in the ranking of the proposed approach. Sensitivity analysis revealed that pollutant’s weight affects the ranks of the city and importance of specific air pollutants on overall air quality, with PM2.5 significantly impacting the area’s rank.
The proposed model has advantages, including reduced complexity and computation of air pollutant weights using subjective and objective weight concepts. The results can aid government agencies in making informed decisions. Furthermore, the model has the potential for expansion by incorporating relevant environmental parameters that may contribute to pollution in the future. Including spatial and temporal analysis can help understand variations in pollution levels across regions and periods. The proposed method can also be compared with other established pollution assessment methodologies.
Footnotes
Acknowledgment
The authors thank the Tamil Nadu Pollution Control Board (TNPCB, Chennai) for providing the air pollution monitoring data during the Diwali festival in Tamil Nadu.